Embed Size (px)
Citation preview

M4 LA MERCY TO WATSON HIGHWAY BUILT FORM VISUALISATION STUDY
APRIL 2009
Produced for Framework Planning: Development Planning Department, eThekwini Municipality through collaboration between Urban Planet and PS Solutions:
Contact Person: Richard Jordan 202 Montpelier Road
Windermere Durban
4001
Cell Number: 083 22 77 456 Office Number: 031-3035852
E-mail: [email protected]

CONTENTS
1 Introduction ________________________________________ 3
1.1 Products __________________________________________ 3
1.2 Study Area _________________________________________ 3
1.3 Study Outcomes ____________________________________ 4
2 Methodology _______________________________________ 4
2.1 Data Streams _______________________________________ 4
2.2 Current site development trends and development control approach. ________________________________________________ 5
2.3 Scenario Building ____________________________________ 5
3 Outcomes and Products ______________________________ 6
4 Development Controls _______________________________ 7
4.1 Bulk Controls _______________________________________ 7
4.2 Sites Extending to the High Water Mark __________________ 8
5 Zoning Analysis _____________________________________ 9
5.1 South Beach Road (South) ____________________________ 9
5.2 South Beach Road (North) ____________________________10
5.3 Genazzano ________________________________________10
5.4 Casuarina Beach ____________________________________11
6 Bulk Study:Conceptual Analysis _____________________ 12
6.1 Distribution of Zoning by Bulk opportunity _________________ 12
6.2 Bulk Study: Conceptual Analysis _______________________ 13
6.3 Scenario1: Status Quo _______________________________ 13
6.4 Scenario 2: Development to maximum bulk opportunity ______ 13
6.5 Scenario 3: Conversion of GR2 to GR1 __________________ 13
6.6 Implications of zoning on Bulk Distribution ________________ 14
7 Analysis of 3D Visualisation Products _________________ 15
7.1 Panoramic Stills ____________________________________ 15 7.1.1 Viewpoint 1 ______________________________________________ 15 7.1.2 Viewpoint 2 ______________________________________________ 15 7.1.3 Viewpoint 3 ______________________________________________ 16 7.1.4 Viewpoint 4 ______________________________________________ 16 7.1.5 Viewpoint 5 ______________________________________________ 16 7.1.6 Viewpoint 7 ______________________________________________ 16 7.1.7 Viewpoint 8 ______________________________________________ 17 7.1.8 Viewpoint 9 ______________________________________________ 17 7.1.9 Viewpoint 10 _____________________________________________ 17 7.1.10 Viewpoint 11 _____________________________________________ 17 7.1.11 Viewpoint 12 _____________________________________________ 17
7.2 M4 virtual drive through and video capture ________________ 19 7.2.1 View Point 1 _____________________________________________ 19 7.2.2 View Point 2 _____________________________________________ 19 7.2.3 View Point 3 /4 ___________________________________________ 20 7.2.4 View Point 5 _____________________________________________ 20 7.2.5 View Point 6 _____________________________________________ 21 7.2.6 View Point 7-8 ____________________________________________ 21 7.2.7 View Point 9/10 ___________________________________________ 21 7.2.8 View Point 11/12 __________________________________________ 22
8 Findings and Recommendations _____________________ 23

M4 Bulk Visualisation Study 3
8.1 Scenario 1 _________________________________________23
8.2 Scenario 2 _________________________________________23
8.3 Scenario3 _________________________________________23
8.4 General Comments __________________________________23
1 I n t r o d u c t i o n
Following the Ohlanga-Tongati Local Area Plan and Coastal Management Plan and responses from the public participation process in 2008, the Development Planning Department of the eThekwini Metropolitan council saw the need to conduct a visualisation study for the coastal strip between the Umdloti estuary up to and including the Casaurina Beach area south of Westbrook. This was in response to concerns raised at the public meeting that the existing distribution of development rights in terms of the Tongaat scheme was unduly prejudicial to those properties east of the M4, when compared with similar coastal areas such as Umdloti and Westbrook. Principally the concern raised was that the high proportion of GR2 zoning relative to GR1 zoning restricted the development opportunity for the majority of properties within the study area. Messrs Richard Jordan and Petrie Swart of Urban Planet and PS Solutions respectively were commissioned to conduct a 3D visualisation study for the coastal strip in which the impact of built-form under various scenarios was compared in order to test a change in development rights associated with a conversion of GR2 to GR1 zoning. This report covers:
the scope of work of the project,
the methodology employed in generating the 3D visualisation modelling,
analysis of zoning in the study area and its implication for built form,
analysis of visual material produced
findings and recommendations based on the analysis of visualisation material generated.
1 .1 Products This document is intended as a relatively concise guide to the process and findings of the study. Additional material has been bundled with the report and is accessible on the set of DVD’s submitted in conjunction with this report. These discs contain the built form visualisation material generated as part of the study. The material is accessible in an interactive flash player format either as an executable file directly off the DVD or via a hotlink embedded within the PowerPoint presentation also on the DVD. 1 .2 Study Area The study area covers the coastal strip from the Umdloti River to the Watson highway with the focus being on properties east of the M4. The study area is approximately 6.5 km in length and covers about 133 parcels under GR1, GR2, Commercial, and SR1 zones.
Figure 1: Study Area

M4 Bulk Visualisation Study 4
1 .3 S tudy Outcomes The purpose of the study is to test the potential visual impacts of a zoning conversion from GR2 to GR1 on the study area. This involved the development of 3D visualisation material as a tool for assessing the impact of different zoning scenarios. Using this methodology it is intended that the study will be able to provide visual material generated to a fairly high level of accuracy, thereby reducing what could be a difficult qualitative assessment to a largely quantitative process. Consequently it is hoped that the material for the better part should be able to ’speak for itself’, allowing both officials and members of the public to view some of the visual merits and demerits of a zoning conversion. While the modelling process allows for a fairly rigorous comparative analysis it inevitably relies on qualitative tools of assessment as well. Both processes therefore inform the findings and recommendations contained at the end of this report and which are intended to guide the Municipality in its response to public concerns regarding the perceived prejudicial distribution of development rights.
2 M e t h o d o l o g y
In order to compare different bulk outcomes and to measure the impact of a zoning change across the study area three scenarios were identified for modelling: Scenario 1: the status quo based on June/July 2007 aerial survey; Scenario 2: a full take up of existing rights i.t.o. the scheme; Scenario 3: a full take up of development rights under a conversion of GR2
to GR1 zoning. 2 .1 Data St reams The development of built form visualisation material provided the bulk of the work required for the study and utilised different data streams:
The first stream involved the use of base data captured from the June / July 2007 aerial survey and includes:
1) Rectified orthophotos sampled at 0.3m ground sampling distance (one pixel will represent 0.3m x 0.3m)
2) TIN – Triangular Irregular Network. This is a digital representation of the terrain at the time of photography. This is an important aspect of the data set as it is used as the base from which all subsequent data sets are derived. It also acts as a quality check for derived data.
3) Contour set with 2M and 1M vertical incline. 4) Building foot prints attributed for GIS. 5) Built form in 3D format – Building foot prints extruded from ground
level to appropriate heights. Buildings are multi layered – Sub levels that differ in shape to that of the base of the building is also captured.
In order to model as realistically as possible, the following additional data was captured:
1) Trees and tall bush – Captured to accurate heights (as it was in June / July 2007).
2) Street lights and other tall light poles. 3) Communication masts and other tall towers. 4) Major fencing and walls. 5) Overhead road signs. 6) Roof structures – some roofing structures contributes a significant
amount to the height of a structure. Video footage and photographic material was captured during two visits to the study area in February and March 2009. The video footage included
1) An M4 run north and South, captured from a motor vehicle driven at 40 km/h
2) A helicopter fly-by at approximately 500ft above sea level.

M4 Bulk Visualisation Study 5
Photographic data of the study area was captured, with the data collected having two functions. The first being as a general record of the status quo of development in the study area, architecture character and to capture current models of built form to inform the building of models to populate Scenarios 2 and 3; the other being the identification of specific viewpoints onto the study area and the compilation of fixed point panoramas from which scenarios 1,2 and 3 could be compared. 2 .2 Current s i te deve lopment t rends and deve lopment
cont ro l approach . In order to accurately model plausible site development solutions the process needed to use and adapt existing examples of site development solutions evident in the study area. The environmental scan also required capturing the current approach to development control as the generated built form models needed to reflect existing interpretation of height restrictions, building lines, setbacks, side spaces and parking requirements with a reasonable degree of accuracy and within the budgetary and time constraints of the project. 2 .3 Scenar io Bu i ld ing For the purpose of populating the scenarios described above a number of 3D built form models were developed in Sketchup. These were then imported into Microstation and positioned in real space using the appropriate x,y and z co-ordinates on each site according to a key plan for each site produced in DWG format. For the purpose of arriving at an authentic level of simulation a high level of design resolution was aimed at. Models were provided with height and scale cues -window and door openings, verandas, and colours to distinguish slabs and floor were employed. The process yielded a number of models representing different site development options from which appropriate models for individual sites could be selected and adapted in accordance with the bulk potential of each site. The bulk yield for each
site took into account circulation and parking requirements in order to generate plausible site development solutions. Basement parking, particularly for GR1 models was also generated as part of the modelling and structures were located with basements 50% below the mean natural ground level in line with the scheme requirements. Features such as verandas service areas, lift shafts, parking garages, basement parking, and open staircases were also included as additional add-ons because these all contribute to massing and the impression of bulk even though these areas are not included in the bulk calculations under the scheme regulations.
Figure 2: Sample of built form models employed

M4 Bulk Visualisation Study 6
3 O u t c o m e s a n d P r o d u c t s
The study is designed primarily to test the impact of rezoning GR2 sites to GR1. The bulk of the work conducted through this project involves the development of material that has a reasonably high level of technical accuracy and landscape verisimilitude allowing for a ‘realistic’ comparison of the potential impact of different zoning scenarios on the landscape and visual experience of the study area. Specifically this material includes:
1) Panoramic still images covering all three scenarios, from 12 identified strategic viewpoints, mainly west of the M4, looking eastward over the \
2) study area. A number of isometric virtual camera shots comparing Scenarios 2 and 3
3) Real and v virtual drive-throughs, covering all three scenarios, based on the visual experience from a car moving northwards along the M4.
4) Video capture fly-over views, looking east and west onto the study areas. 5) A basic solar analysis based on shadow cast on winter solstice between
8:30 am and 4pm.
Products have been bundled in a flash player format for interactive viewing but are also available in the following formats: Still Images – JPEG format (High res 300dpi) Animated Views – Standard Microsoft media formats (avi, mpeg, wmf )

M4 Bulk Visualisation Study 7
4 D e v e l o p m e n t C o n t r o l s
In order to accurately model Scenarios 2 and 3, the controls governing density and bulk for the coastal strip were captured and applied to the building of models for GR2 and GR1 sites. 4 .1 Bulk Cont ro ls The table adjacent reflects the controls for the Tongaat Scheme as applied to sites east of the M4. The floor to area ratio (FAR) for both GR1 and GR2 sites is governed by table F in the scheme. Table F indicates 2 sliding scales (I and II) in which the FAR for any given site is determined in relation to the size of the site, giving proportionately greater bulk opportunity as sites increase in size. The highest floor area ratio is 1:1.1 for GR1 sites and 1:0.75 for GR2 sites, applied in both case to sites 4000 m² and bigger. On aggregate a conversion from GR2 to GR1 zoning equates to a 36% increase in bulk opportunity across the study area.
Use Zone
F.A.R. Cov. Min. Site Size
(m) Min.
Frontage Height
Front building line (m)
Side& Rear
Spaces (m)
Special Residential 0.6 40 650 15 2 7.5 4.5
General Residential 1 Table F (I) 40 2000 25 6 7.5 4.5
General Residential 2 Table F (II)
40 1000 18 3 7.5 4.5
Commercial 2 70 500 12 8 Str. Line 2
Table 1: Summary of Development Controls
Figure 3: Floor Area Ratio Table F(I and II)

M4 Bulk Visualisation Study 8
4 .2 Si tes Ex tend ing to the High Water Mark For 26 of the GR2 sites within the study area (20% of properties under residential or commercial zoning) the zoning overlay does not align with the cadastre. Properties are overlaid by GR2, Road, and Private Open Space zones with the cadastre extending to the high-water mark. Historically the full area of the site has been used to calculate bulk for each site. The implication of this is that these sites may have up to approximately 30% more bulk opportunity than those sites where the cadastre extends only to the road reserve. Under a GR2 zoning regime the full additional bulk attributed to these sites may be difficult to realize due to a combination of the 2 storey height restriction, the 40% maximum coverage, and the practical requirements of on-site circulation and parking. However under a GR1 conversion scenario the full bulk becomes a lot easier to realize since the bulk can be distributed across the 6 storeys allowed under GR1 zoning.
Figure 4: Illustration showing cadastre extending to high-water mark

M4 Bulk Visualisation Study 9
5 Z o n i n g A n a l y s i s
For the purpose of describing the zoning distribution the study area can be divided into 4 sections. 5 .1 South Beach Road (South ) Starting from the south of the study area the dominant zoning is GR1. There are 14 sites zoned GR1 representing a total bulk opportunity of 48,944 m² of floor area of which 29, 705 m² (61%) has been built. The area also contains 2 commercial sites representing 13 176 m² of bulk opportunity. The sites remain undeveloped. The greatest proportion of sites within this section of the study are zoned GR2. These sites cover a contiguous area of approximately 1.7 km in length.
Figure 5: Zoning Distribution - Key
Figure 6: Zoning Distribution: South Beach Road (South)
M4 Bulk Visualisation Study 10
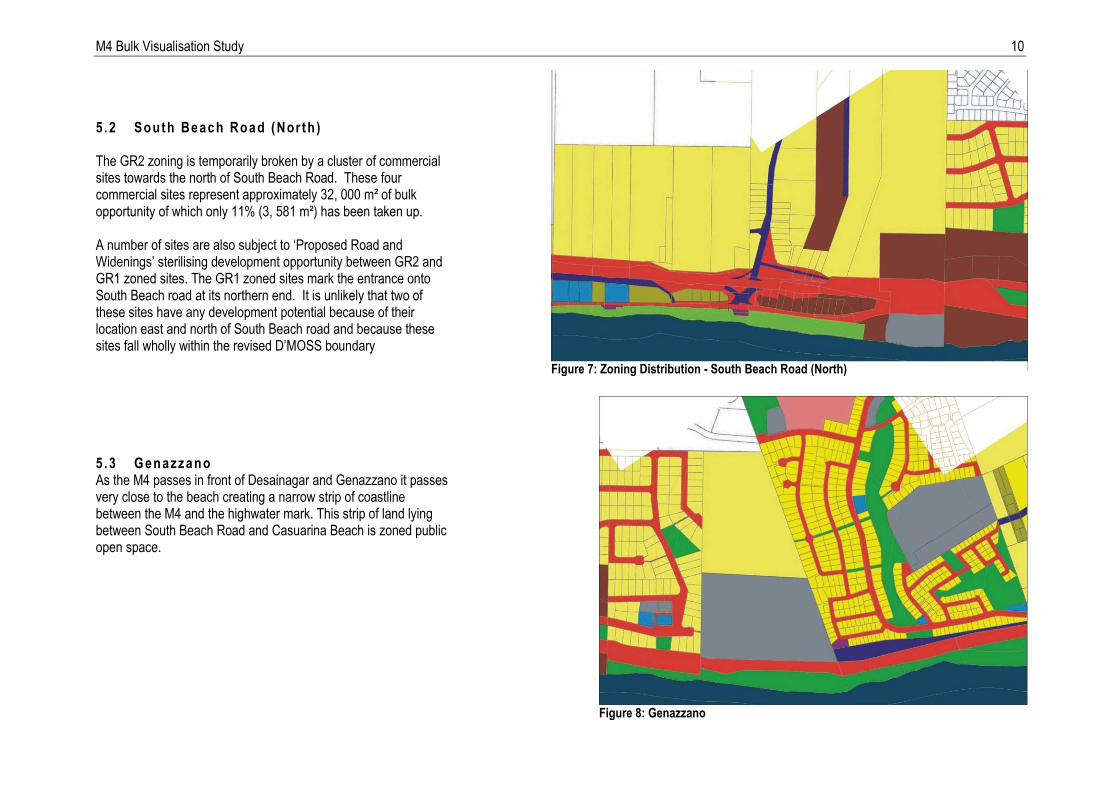
5 .2 South Beach Road (Nor th ) The GR2 zoning is temporarily broken by a cluster of commercial sites towards the north of South Beach Road. These four commercial sites represent approximately 32, 000 m² of bulk opportunity of which only 11% (3, 581 m²) has been taken up. A number of sites are also subject to ‘Proposed Road and Widenings’ sterilising development opportunity between GR2 and GR1 zoned sites. The GR1 zoned sites mark the entrance onto South Beach road at its northern end. It is unlikely that two of these sites have any development potential because of their location east and north of South Beach road and because these sites fall wholly within the revised D’MOSS boundary 5 .3 Genazzano As the M4 passes in front of Desainagar and Genazzano it passes very close to the beach creating a narrow strip of coastline between the M4 and the highwater mark. This strip of land lying between South Beach Road and Casuarina Beach is zoned public open space.
Figure 7: Zoning Distribution - South Beach Road (North)
Figure 8: Genazzano

M4 Bulk Visualisation Study 11
5 .4 Casuar ina Beach Casuarina Beach contains 20 sites zoned GR1, 2 Commercial zoned sites and 11 SR1 zoned sites. A number of sites zoned for residential purposes are owned by the municipality and have been developed as part of the public open space amenity.
Figure 9: Casuarina Beach

M4 Bulk Visualisation Study 12
6 B u l k S t u d y : C o n c e p t u a l A n a l y s i s
6 .1 Dis t r ibut ion o f Zon ing by Bu lk oppor tun i ty The zoning distribution by development area reveals that the greatest proportion of the net developable land (62%) is developable under GR2 zoning rights. Just under a third of the developable area is developable under GR1 zoning. Comparing these figures with the distribution of bulk opportunity by zone, it is evident that both the existing Commercial and GR1 sites have proportionately much higher bulk opportunity relative to the net developable area under these zones due to the bulk controls attributed to these zones.
Figure 11: Zoning Distribution by Bulk Opportunity
Figure 10: Zoning Distribution by Development Area

M4 Bulk Visualisation Study 13
6 .2 Bulk Study: Conceptua l Ana lys is The following provides a conceptual analysis of the implication of a zoning conversion. 6 .3 Scenar io1 : S ta tus Quo
Although recent empirical evidence suggests renewed interest in property development in the study area, existing take up of bulk potential remains low. Existing take up of bulk opportunity (according to data derived from June/July 2007 aerial survey) represents only 28% of the theoretical bulk opportunity . Existing zoning rights allow for a theoretical total of 303, 888 m² of floor area of which only 85, 981 m² (28%) has been built.
6 .4 Scenar io 2 : Deve lopment to max imum bu lk oppor tun i ty
Consequently, in terms of existing zoning, the theoretical bulk opportunity is 3.5 times more than the present bulk take up. Existing GR2 sites alone allow for approximately 147’000 m² of floor area Based on a theoretical average of 150 m²/unit this implies 980 units.
6 .5 Scenar io 3 : Convers ion o f GR2 to GR1 Converting GR2 sites to GR1 zoning would increase the theoretical bulk opportunity across the study area by 30%. This translates into an aggregate increase of 36% in floor area for existing GR2 sites alone. Converting these sites to GR1 will allow an additional 53’ 200 m² of floor area,
Based on a theoretical average of 150 m²/unit this implies an additional 355 units (1,335 in total).
Figure 12: Graphic representation of bulk per scenario
M4 Bulk Visualisation Study 14
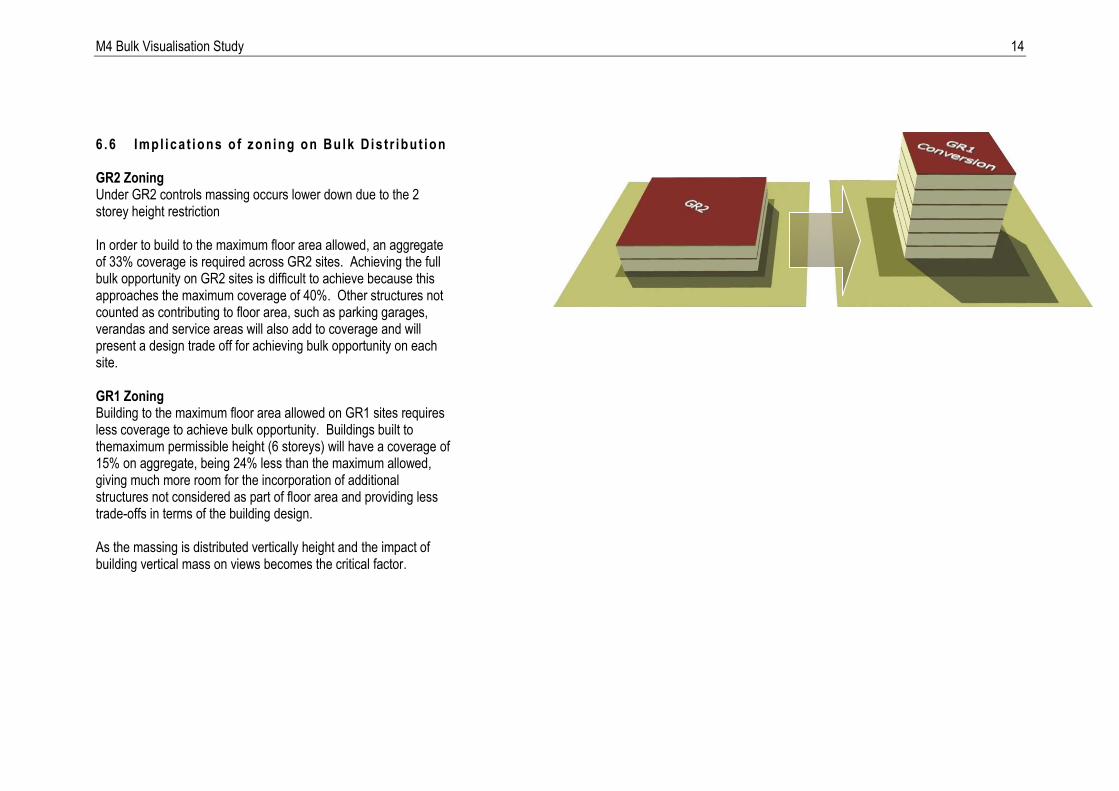
6 .6 Impl ica t ions o f zon ing on Bu lk D is t r ibut ion GR2 Zoning Under GR2 controls massing occurs lower down due to the 2 storey height restriction In order to build to the maximum floor area allowed, an aggregate of 33% coverage is required across GR2 sites. Achieving the full bulk opportunity on GR2 sites is difficult to achieve because this approaches the maximum coverage of 40%. Other structures not counted as contributing to floor area, such as parking garages, verandas and service areas will also add to coverage and will present a design trade off for achieving bulk opportunity on each site. GR1 Zoning Building to the maximum floor area allowed on GR1 sites requires less coverage to achieve bulk opportunity. Buildings built to themaximum permissible height (6 storeys) will have a coverage of 15% on aggregate, being 24% less than the maximum allowed, giving much more room for the incorporation of additional structures not considered as part of floor area and providing less trade-offs in terms of the building design. As the massing is distributed vertically height and the impact of building vertical mass on views becomes the critical factor.
M4 Bulk Visualisation Study 15
7 A n a l y s i s o f 3 D V i s u a l i s a t i o n P r o d u c t s
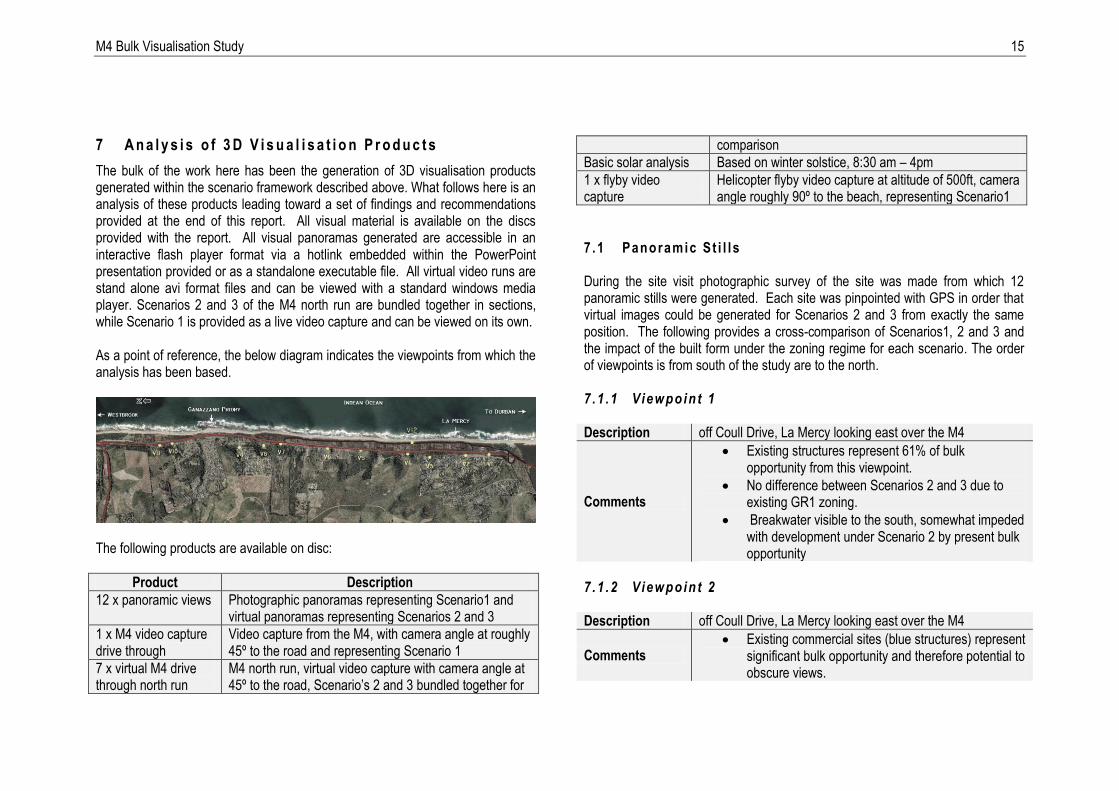
The bulk of the work here has been the generation of 3D visualisation products generated within the scenario framework described above. What follows here is an analysis of these products leading toward a set of findings and recommendations provided at the end of this report. All visual material is available on the discs provided with the report. All visual panoramas generated are accessible in an interactive flash player format via a hotlink embedded within the PowerPoint presentation provided or as a standalone executable file. All virtual video runs are stand alone avi format files and can be viewed with a standard windows media player. Scenarios 2 and 3 of the M4 north run are bundled together in sections, while Scenario 1 is provided as a live video capture and can be viewed on its own. As a point of reference, the below diagram indicates the viewpoints from which the analysis has been based.
The following products are available on disc:
Product Description
12 x panoramic views Photographic panoramas representing Scenario1 and virtual panoramas representing Scenarios 2 and 3
1 x M4 video capture drive through
Video capture from the M4, with camera angle at roughly 45º to the road and representing Scenario 1
7 x virtual M4 drive through north run
M4 north run, virtual video capture with camera angle at 45º to the road, Scenario’s 2 and 3 bundled together for
comparison
Basic solar analysis Based on winter solstice, 8:30 am – 4pm
1 x flyby video capture
Helicopter flyby video capture at altitude of 500ft, camera angle roughly 90º to the beach, representing Scenario1
7 .1 Panoramic St i l l s During the site visit photographic survey of the site was made from which 12 panoramic stills were generated. Each site was pinpointed with GPS in order that virtual images could be generated for Scenarios 2 and 3 from exactly the same position. The following provides a cross-comparison of Scenarios1, 2 and 3 and the impact of the built form under the zoning regime for each scenario. The order of viewpoints is from south of the study are to the north. 7 .1 .1 Viewpoin t 1 Description off Coull Drive, La Mercy looking east over the M4
Comments
Existing structures represent 61% of bulk opportunity from this viewpoint.
No difference between Scenarios 2 and 3 due to existing GR1 zoning.
Breakwater visible to the south, somewhat impeded with development under Scenario 2 by present bulk opportunity
7 .1 .2 Viewpoin t 2 Description off Coull Drive, La Mercy looking east over the M4
Comments Existing commercial sites (blue structures) represent
significant bulk opportunity and therefore potential to obscure views.

M4 Bulk Visualisation Study 16
The dominance of GR1 zoning within view means that the difference between Scenarios 2 and 3 is marginal.
Development within existing zoning rights will obscure most of the breakwater.
The most significant difference between Scenarios 2 and 3 evident is that a conversion to GR1 will have a significant impact on the skyline at the northern end of the view, impeding longer views onto the coastline and giving the impression of more intensive bulk.
7 .1 .3 Viewpoin t 3 Description off Golden dawn Drive, La Mercy looking east over the M4
Comments Significant length of breakwater is visible under
Scenarios 1 and 2
Breakwater disappears with Scenario 3 7 .1 .4 Viewpoin t 4 Description off Golden dawn Drive, La Mercy looking east over the M4
Comments
Existing take up of development rights is low as evident from the Scenario 1 panorama.
Significant length of breakwater is visible under Scenarios 1 and 2
View of the breakwater is significantly reduced with Scenario 3 particularly far north and south of the viewpoint. Breakwater is visible between buildings closer to the centre of the view.
A comparison of scenarios 2 and 3 also reveals the potential difference in massing; under a GR2 regime massing occurs lower down with less space between buildings (i.e. greater footprint) and with
GR1 zoning, massing is distributed through height potentially allowing for more space between buildings.
7 .1 .5 Viewpoin t 5 Description off South Dune Road looking east over the M4
Comments
Existing take up of development rights is low as evident from the Scenario 1 panorama. The breakwater is not very visible due to the low vantage of the viewpoint. The viewpoint is onto predominantly GR2 zoning
Building to existing zoning will significantly obscure views onto the ocean. The horizon line will for the better part remain visible.
Converting to GR 1 will obscure the horizon line but there is the possibility that a marginally higher percentage of ocean will remain visible due to potentially greater spacing between buildings
7 .1 .6 Viewpoin t 7
Description Off Park Ave. looking South onto the entrance to South Beach Road
Comments
The area visible is dominated by GR1 zoning i.t.o. the scheme, hence there is no evident difference in Scenarios 2 and 3.
Areas north of the turning circle are covered by D’MOSS and no models were generated for these sites. If maintained as such this would give some reprieve for maintaining visual connection with the ocean and natural coastal landscape.

M4 Bulk Visualisation Study 17
7 .1 .7 Viewpoin t 8 Description Off Park Ave. looking East onto Tongaat Beach
Comments
The area visible directly east of the M4 is covered by D”MOSS and has no development opportunity
Structures on GR2 sites in the study area (covered in viewpoint 7) are visible looking south.
7 .1 .8 Viewpoin t 9 Description Off Park Ave. Desainager looking East onto Tongaat Beach
Comments The area visible directly east of the M4 is covered
by D”MOSS and has no development opportunity
No Development visible 7 .1 .9 Viewpoin t 10 Description Off Genazzano Rd. Looking East onto Casuarina Beach
Comments
Little take up of existing GR2 zoning evident under Scenario 1.
Areas of D’MOSS allow preservation of sea views and coastal landscape south of the last plots in Casuarina Beach
The majority of sites within Casuarina Beach fall below the minimum site size of 2 000m² for GR1 zoning.
The horizon line will be broken under both Scenarios 2 and 3.
Due to site size some structures will not be able to practically attain the permissible height of 6 storeys with a conversion to GR1 (without consolidation).
7 .1 .10 Viewpoin t 1 1
Description Off Genazzano Rd. Looking East onto Casuarina Beach (slightly higher vantage than Viewpoint 10 and further north)
Comments
Little take up of existing GR2 zoning evident under Scenario 1.
View mainly onto area zoned GR2 but owned by the Municipality and developed as P.O.S.
The majority of sites within Casuarina Beach fall below the minimum site size of 2 000m² for GR1 zoning.
The horizon line will be broken under Scenarios 3, but not under current zoning.
Due to site size some structures will not be able to practically attain the permissible height of 6 storeys with a conversion to GR1 (without consolidation).
Commercial sites with proportionately significant bulk opportunity evident to the north of the view. These are hidden from view under Scenario 3 as a result of the height conversion under this scenario.
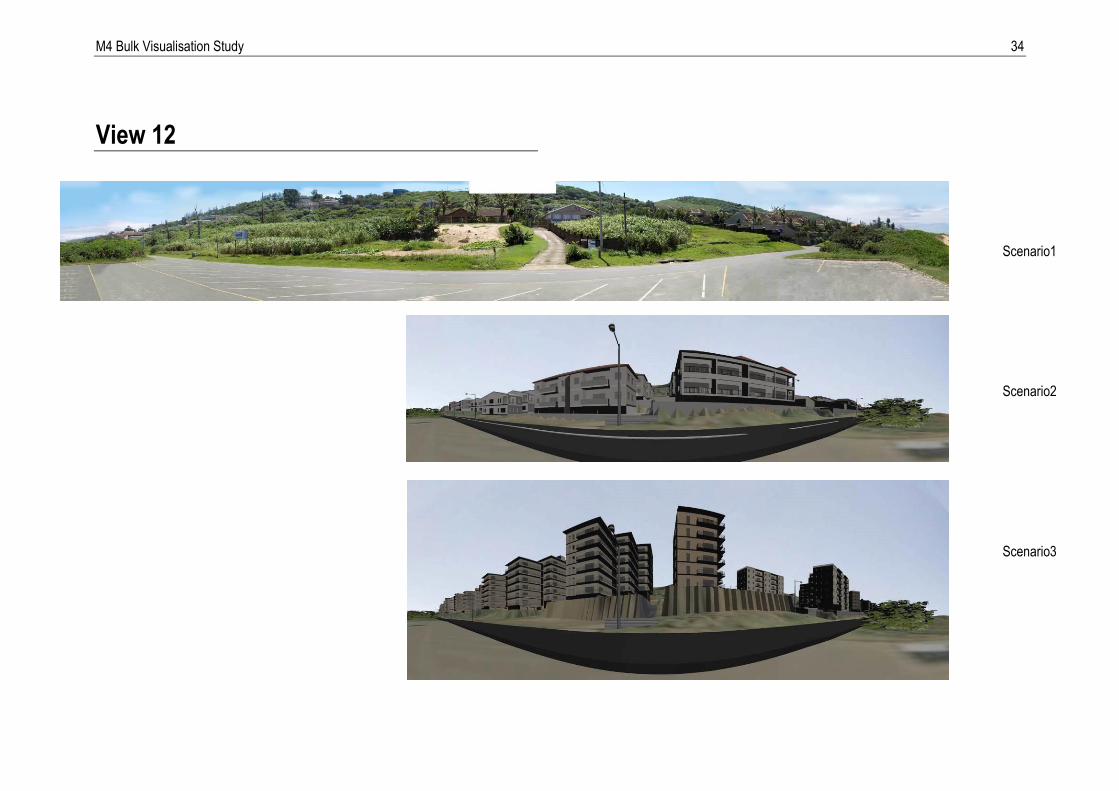
7 .1 .11 Viewpoin t 1 2
Description Off South Beach Rd. Looking West onto the study area from the parking lot
Comments
Little take up of existing GR2 zoning evident under Scenario 1.
The scale of Scenario 2 (GR2 zoning for sites visible) is arguably more appropriate to the scale and intimacy of the beach experience along the length of South Beach Road.
Taller structures have the potential for casting

M4 Bulk Visualisation Study 18
shadows onto the dune cordon.

M4 Bulk Visualisation Study 19
7 .2 M4 v i r tua l d r ive through and v ideo capture In addition to the stills reported on above, video material was also captured and produced as part of the study. This material covers all three scenarios and represents the view from a vehicle travelling northwards along the M4 at a speed of approximately 40km/h with a camera angle at 45º to the road. Scenario 1 is presented as a standalone feature while Scenarios 2 and 3 have been bundled together for the purpose of comparison. Due to the technical constraints of dealing with vast volumes of data the virtual drive through has been packaged into 7 individual segments. Each of the Segments roughly corresponds in location to the panoramic viewpoints already discussed. Segments have been packaged with a location tracking plan showing the camera location and camera angle. In assessing the material it must be emphasised that the fixed angle creates a reference point for the purpose of cross-comparison. In reality the eye would be drawn to additional viewpoints of significance which can only be captured by shifting the angle of view while proceeding northward along the M4. Consequently the drive through is not a comprehensive indicator of the experience along the M4, but is considered allow for both quantitative and qualitative assessment of the alternative scenarios. 7 .2 .1 View Po in t 1
Description Southern entrance to study area northern run for approximately 655 metres. The road rises for over a distance of 550 m before levelling off at the end of the scene
Comments
Scenario 1 indicates significant verge screening and with only brief glimpses of the ocean afforded. Better sea views are afforded at the top of the rise towards the end of the segment.
Good sea views will be more evident on the southern run at the approach to the Umdloti estuary.
Screening is both indigenous (Brachylaena discolor)
and exotic (Casaurina equisetifolia) vegetation.
As the scene covers an area with only GR1 zoning there is no difference between scenarios 2 and 3 in terms of impact.
Development to bulk potential will result in the skyline being dominated by physical structures. Structures are likely to penetrate the horizon line and where visible the horizon line will be broken.
Under this scenario appropriate verge screening may improve the experience by screening the rear of buildings as sea views are limited
7 .2 .2 View Po in t 2
Description
Continuation for approximately 655 metres (59 seconds), overlap of 288m (26 seconds) with view 1. The road levels off and reaches its highest point along the M4 above the study area, before beginning a gradual descent towards the end of the segment.
Comments
Scenario 1 indicates that where the road reaches its crest, significant sea views are possible. Although a significant percentage is obscured by vegetation on the road verge and Casuarinas on properties below the M4. The roof structure of existing development is occasionally visible below the M4 with the ocean horizon visible above.
For the first 35 seconds the zoning immediately below the road is GR1, therefore no difference between Scenarios 2 and 3 are indicated. Thereafter a comparison between Scenarios 2 and 3 reveals a significant difference.
Scenario 3 indicated that under a GR1 zoning scenario the built form is significantly more

M4 Bulk Visualisation Study 20
prominent, and will be visible above the roadside vegetation.
In addition a GR1 zoning scenario is likely to inhibit views of the ocean where this otherwise would be visible (if not obscured by screening). Structures are also likely to penetrate the horizon line
Maintaining the GR2 zoning would restrict height and limit the overall impact of built form while also maintaining views onto the ocean and the horizon line where visible.
7 .2 .3 View Po in t 3 / 4
Description Overlap of 88m (8 seconds) with view 2. The road begins to gradually descend having past the highest point above the study area.
Comments
Scenario 1 indicates that as the road drops significant views over the project area and ocean are possible. This is particularly clear 1′45″ into the clip where a steep embankment onto the study area results in the absence of vegetation and provides more expansive views onto the ocean. From this vantage point the breakwater is also visible.
A comparison between Scenarios 2 and 3 reveals a significant difference in impact between the two built form scenarios.
Scenario 2 indicates that views of the breakwater will be significantly reduced with the take up of existing bulk opportunity. Views over the ocean are still visible above roof tops with the horizon line remaining intact, although as the road descends, more of the ocean views are obscured and towards the end of the segment roof structures start to break
the horizon line.
Scenario 3 indicates a built form that is significantly more prominent being visible above the roadside vegetation.
A GR1 zoning scenario is likely to result in a built form that will dominate the sky line and severely restrict views of the ocean which otherwise are likely to remain visible under GR2 zoning.
A comparison between scenarios 2 and 3 indicates a substantial impact on visual amenity under a GR1 conversion scenario.
7 .2 .4 View Po in t 5
Description Overlap of 22.2m (2 seconds) with view 3/4. The road descends further dropping another 5m along the duration of this segment and passes through 2 prominent cuttings.
Comments
Scenario 1 indicates that as the road drops further visibility over the ocean is affected. The vegetated verges and topography obstruct the views. The road passes through 2 prominent cuttings reducing vantage over the sea and off the study area. This section offers approximately 24% visibility of the ocean. A low level of bulk take up is indicated.
A comparison between Scenarios 2 and 3 reveals a significant difference in impact between the two built form scenarios However due to the height of the road relative to the study area Scenario 2 indicates that even under a GR2 zoning scenario roof lines will penetrate the horizon line.
Scenario 3 indicates a built form that is significantly more prominent. A GR1 zoning scenario is likely to result in a built form that will have a greater impact

M4 Bulk Visualisation Study 21
in terms of scale and bulk and will dominate the sky line, although views of the ocean will already be restricted by GR2 zoning. It is possible that a GR1 zoning might allow slightly more opportunity for ‘view corridors’ onto the ocean although this opportunity is not considered to be substantial enough to ameliorate the overall impact of increased height and bulk.
The segment also contains four sites with commercial zoning which represent significant bulk opportunity with a high potential impact as indicated.
7 .2 .5 View Po in t 6
Description
Overlap of 200m (18 seconds) with view 5. The road descends slightly further, dropping another 3m along the duration of this segment. The segment passes market gardens (out of view) off South Dune Road and reaches the concentration of GR1 sites towards the traffic circle which marks the northern entry onto South Beach Road.
Comments
Vegetation on the verges obstructs views onto the ocean, although there is roughly 33% visibility of the ocean for the duration of this segment. A low level of bulk take up is indicated allowing greater sea views than would otherwise be possible.
Scenario 2 indicates that the study area in places drops low enough below the road such that rooflines may not necessarily break the horizon line and unspoilt views are possible.
A comparison between Scenarios 2 and 3 reveals a significant difference in impact between the two built form scenarios in terms of the sky line. Scenario 3 indicates a GR1 zoning conversion scenario that is
likely to result in a built form that will have a greater impact in terms of scale and bulk and will dominate the sky line. While views of the ocean are already impeded under Scenario 2, some views still appear to be unspoilt. It is possible that a GR1 zoning might allow slightly more opportunity for ‘view corridors’ onto the ocean.
A concentration of GR1 properites at the end of the section means that there is no difference between Scenarios 2 and 3 at this point. Properties zoned for proposed road and widening before the GR1 zoning reduces development opportunity opening up the skyline although no vantage for ocean views is gained due to topography and verge screening on the road edge.
7 .2 .6 View Po in t 7 -8
Description
Overlap of 99.9m (9 seconds) with view 6. The segment covers 355m (32 seconds). The road rises approximately 3m towards the traffic circle marking the northern entry onto South Beach Road.
Comments
Scenario 1 indicates that vegetation on the verges obstructs views onto the ocean, with the best views visible over the traffic circle at the entrance to South Beach Road.
Due to GR1 zoning over properties in view there is no difference between Scenarios 2 and 3. GR1 may offer opportunities for view corridors due to space between buildings.
7 .2 .7 View Po in t 9 /10

M4 Bulk Visualisation Study 22
No virtual drive through is provided between the traffic circle marking the northern entrance to South Beach Road and view point 11/12 as the zoning and D’MOSS overlay limit development potential. This stretch of the study area is approximately 1.6 km long, is unlikely to see any development and has high amenity value offering a few brief and close encounters with the ocean with the breakwater and even shoreline visible in places. 7 .2 .8 View Po in t 11 /12
Description
The segment begins on approach northwards toward Casuarina Beach after passing the Genezzano. The road rises gently having passed the lowest point of the road along the study area before levelling off adjacent to Casaurina beach and terminating at the traffic circle adjoining the M4 with the Watson Highway.
Comments
Scenario 1 indicates views onto the ocean at the start of the segment on approach to Casuarina Beach, due to the number of undeveloped sites. In general vegetation and bermes on the verge screen out most of the potential views onto the study area and ocean.
The difference in bulk between Scenarios 2 and 3 for this segment is not as significant as other areas of the study area as sites are generally smaller, thereby restricting bulk opportunity on these sites. The height of structures is also functionally restricted but site size as it is not practical to achieve a height of 6 storey’s under Scenario 3 with limited bulk opportunity resulting from small site areas. Modelling here did not capture the possibility of site consolidation.
At the beginning of the segment Scenario 2 indicates penetration of the horizon line by roof
structures. Scenario 3 indicates marginally increased height and bulk but with slightly greater opportunity for view corridors. However due to the constraints of site size it is unlikely that structures would be built as indicated by scenario 3. Realisation of bulk opportunity under a GR1 conversion scenario is likely to require site consolidation.
The view ends with SR1 sites towards the end of the segment.

M4 Bulk Visualisation Study 23
8 F i n d i n g s a n d R e c o m m e n d a t i o n s
The following provides a brief set of findings with some recommendations: 8 .1 Scenar io 1
Because of the low level of development evident in the study area a full take up of bulk opportunity in terms of the existing zoning will change the experience and amenity of the study area significantly. As it is vegetation, and bermes along the verge of the M4 and topography in places, screens views of the ocean from the M4 which with appropriate landscaping could be controlled allowing less impeded views of the ocean. Numerous and fairly significant views are afforded along the length of the M4. Part of the attraction and visual interest of the study area results from frequent and significant views of the ocean from the M4 and the extent of green open space. Properties back of the M4 in the areas of La Mercy, Desainagar and Genazzano have good ocean views and in many places the breakwater is also visible due to the low development uptake on the coast.
8 .2 Scenar io 2
The take up of existing bulk opportunity will itself have a significant impact on views of the ocean. From the M4 where the road descends and approaches the height of the study area adjacent to it, views become more impeded and roof lines are more likely to break the horizon line. Nevertheless for the better part views over the ocean from the M4 will potentially still have a high amenity value. Some breakwater is likely to remain visible from locations west of the M4.
8 .3 Scenar io3 Quantitatively a conversion to GR1 increases the net bulk opportunity by 36% for those sites affected. This represents a gross bulk increase of 30% across the study area. In general conversion under this scenario indicated significant impact of the skyline from the M4 with structures impeding views onto the ocean to a greater extent than under scenario 2. Structures are also visible
above vegetated screening. It is possible that this scenario may afford some opportunity for view corridors due to the fact that structures require a smaller footprint (due the added height allowed), although this is not considered to be substantial enough to ameliorate the overall impact of increased height and bulk. From viewpoint west of the M4 much of the breakwater previously visible is likely to be lost due to building height. A Conversion to GR1 zone will reduce amenity value of ocean views for areas west of the M4 although views on the ocean will not be obstructed entirely
8 .4 Genera l Comments
In general the additional bulk and height is considered to have negative amenity benefit for the landscape experience of the study area and it would seem that maintaining the zoning rights as they are is more desirable than converting zoning rights from GR2 to GR1. There is greater opportunity under a conversion scenario to create view corridors onto the ocean from the M4 and strategic points back of the M4, but this requires complex development control management. In general the lower bulk value and height associated with GR2 zoning is also more appropriate to the scale and the experience of the local access roads, South Beach and Casuarina Beach Roads, that run behind the beach.

M4 Bulk Visualisation Study 24
Appendix A: Panoramic Stills View 1
Scenario1
Scenario2
Scenario3

M4 Bulk Visualisation Study 25
View 2
Scenario1
Scenario2
Scenario3

M4 Bulk Visualisation Study 26
View 3
Scenario1
Scenario2
Scenario3

M4 Bulk Visualisation Study 27
View 4
Scenario1
Scenario2
Scenario3

M4 Bulk Visualisation Study 28
View 5
Scenario1
Scenario2
Scenario3

M4 Bulk Visualisation Study 29
View 6
Scenario1
Scenario2
Scenario3

M4 Bulk Visualisation Study 30
View 7
Scenario1
Scenario 2 (no distinction with Scenario3)

M4 Bulk Visualisation Study 31
View 8
Scenario1
Scenario 2 (no distinction with Scenario3)

M4 Bulk Visualisation Study 32
View 10
Scenario1
Scenario2
Scenario3

M4 Bulk Visualisation Study 33
View 11
Scenario1
Scenario2
Scenario3
M4 Bulk Visualisation Study 34
View 12
Scenario1
Scenario2
Scenario3