Embed Size (px)
Citation preview
M. Yoda, S. I. Abdel-Khalik, D. L. Sadowski, M. D. Hageman, B. H. Mills, and J. D. Rader
G. W. Woodruff School of Mechanical Engineering
Extrapolating Model Divertor Studies to
Prototypical Conditions
ARIES Meeting (7/10) 2
Objectives / MotivationObjectives• Experimentally evaluate thermal performance of gas-cooled
divertor designs in support of the ARIES team• Evaluate use of fins to enhance performance of current designs– Plate-type divertor– HEMP / HEMJ
Motivation• Experimental validation of numerical studies• Divertors may have to accommodate steady-state and transient
heat flux loads exceeding 10 MW/m2 • Performance should be “robust” with respect to manufacturing
tolerances and variations in flow distribution
ARIES Meeting (7/10) 3
Approach• Design and instrument test modules that closely match
divertor geometries• Conduct experiments that span expected non-dimensional
parameters at prototypical operating conditions– Reynolds number Re– Use air instead of He: difference in Prandtl numbers has
negligible effect on Nusselt number Nu• Measure cooled surface temperatures and pressure drop– Effective and actual heat transfer coefficients (HTC)– Normalized pressure drops P
• Compare experimental data with predictions from commercial CFD software
ARIES Meeting (7/10) 4
Thermal Enhancement• Most current divertor designs rely on jet impingement
to cool plasma-facing heated surface– 2D (rectangular) or 3D (round) jet(s)
• Can thermal performance of leading divertor designs be further improved by an array of cylindrical pin fins on heated surface?– Pin-fin array increases cooled surface area– Pins span gap between jet exit and cooled surface: bare
region in center of cooled surface to allow jet to impinge– Impact on actual heat transfer coefficient and pressure
drop?
ARIES Meeting (7/10) 5
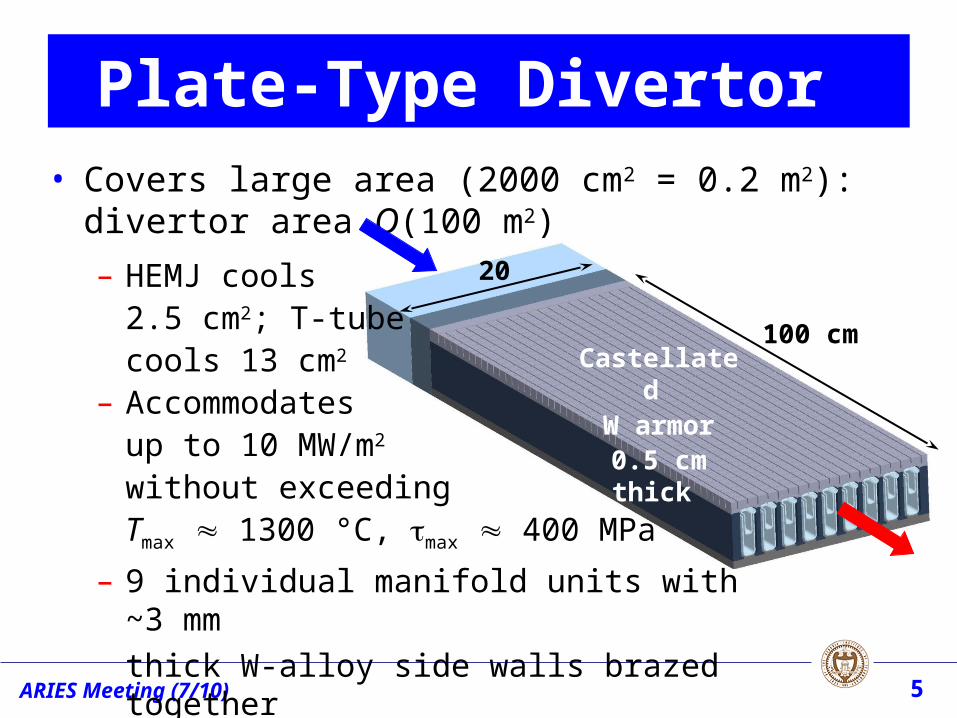
Plate-Type Divertor • Covers large area (2000 cm2 = 0.2 m2): divertor area
O(100 m2)
100 cmCastellated
W armor0.5 cm thick
20– HEMJ cools 2.5 cm2; T-tube cools 13 cm2
– Accommodates up to 10 MW/m2 without exceeding Tmax 1300 °C, max 400 MPa
– 9 individual manifold units with ~3 mm
thick W-alloy side walls brazed together

ARIES Meeting (7/10) 6
Measurements• Temperature
distribution over cooled surface– Surface
temperatures Ts from 5 TCs
– Ts HTCs• Coolant P, T at
test section inlet, exit P
• Mass flow rate Re
GT Plate Test Moduleq
Brass shell
Al cartridge
In
Out
1 mm
Pin-fin array• 808 1 mm 2 mm fins • Increase
cooled area by 276% vs.bare surfacearea A = 1.6103 m2
• 2 mm “bare” strip for jetimpingement
Test module• Jet from H =
0.5 or 2 mm L = 7.62 cm slot
• Coolant: air• Cu heater block• Bare and pin-
covered cooled surfaces
• 2 mm gap• Brass, W have
similar k
ARIES Meeting (7/10) 7
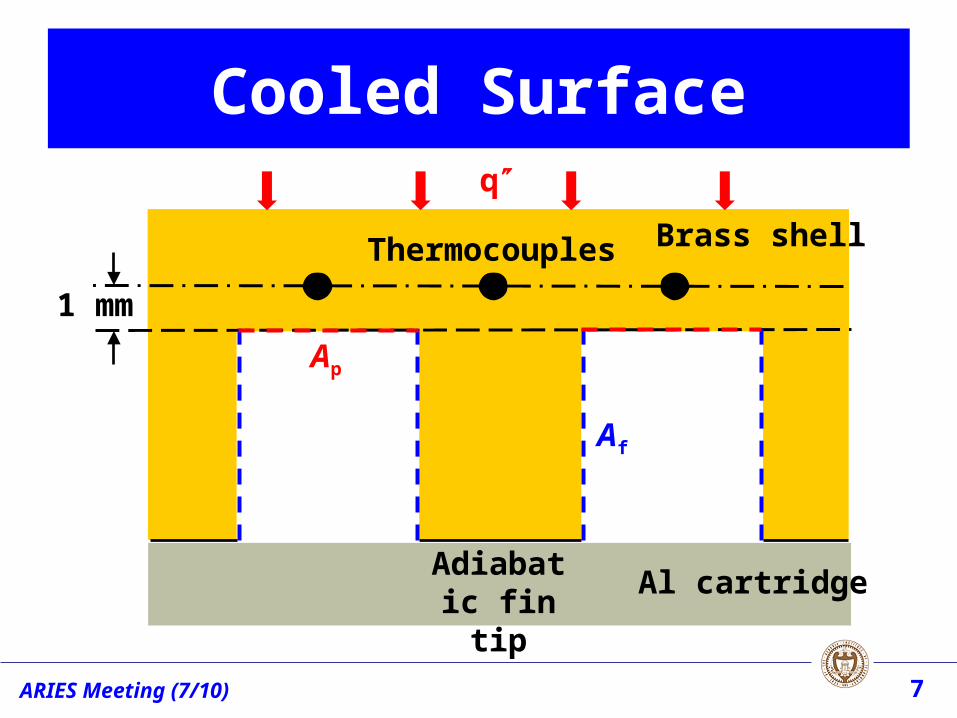
Abare
1 mm
Cooled Surface
Thermocouples
Al cartridge
Brass shell
Adiabatic fin tip
Af
Ap
q
ARIES Meeting (7/10) 8
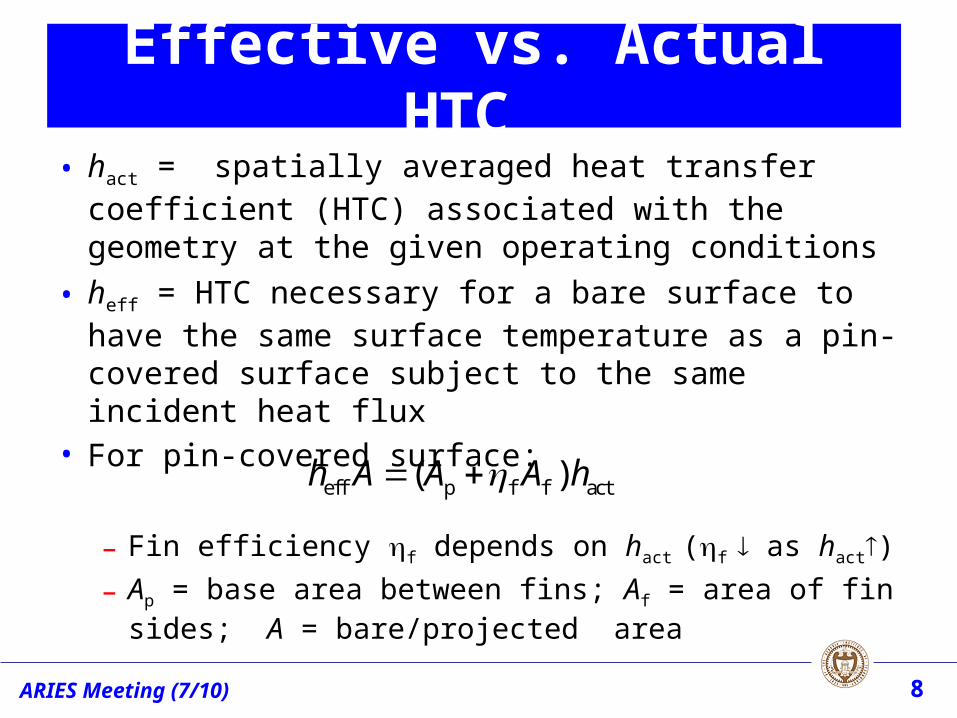
Effective vs. Actual HTC • hact = spatially averaged heat transfer coefficient (HTC)
associated with the geometry at the given operating conditions
• heff = HTC necessary for a bare surface to have the same surface temperature as a pin-covered surface subject to the same incident heat flux
• For pin-covered surface:
– Fin efficiency f depends on hact (f as hact)
– Ap = base area between fins; Af = area of fin sides; A = bare/projected area
eff p f f act( )h A A A h

ARIES Meeting (7/10) 9
Calculating Actual HTCFor pin-covered surfaces, iterate since f = f (hact)
1) Initial “guess” for hact same as for corresponding bare surface
2) Assuming an adiabatic fin tip, fin efficiency
3) Use f to determine new value of hact
4) Repeat Steps 2 and 3 until (hact, f) converge
c actf
act c
( )1tanh
( )
k A h PerL
L h Per k A
eff p f f act( )h A A A h
– Per = pin perimeter; L = fin length ; Ac = fin cross-sectional area
– f decreases as HTC increases

ARIES Meeting (7/10) 10
Effective HTC: Air h
eff [
kW
/(m2
K)]
2 mm Bare 2 mm Pins 0.5 mm Bare 0.5 mm Pins
Re (/104)
• Effective HTC of pin-covered surfaces 90180% greater than HTC of bare surfaces
• Increase is less than increase in area (lower hact and f < 1)
ARIES Meeting (7/10) 11
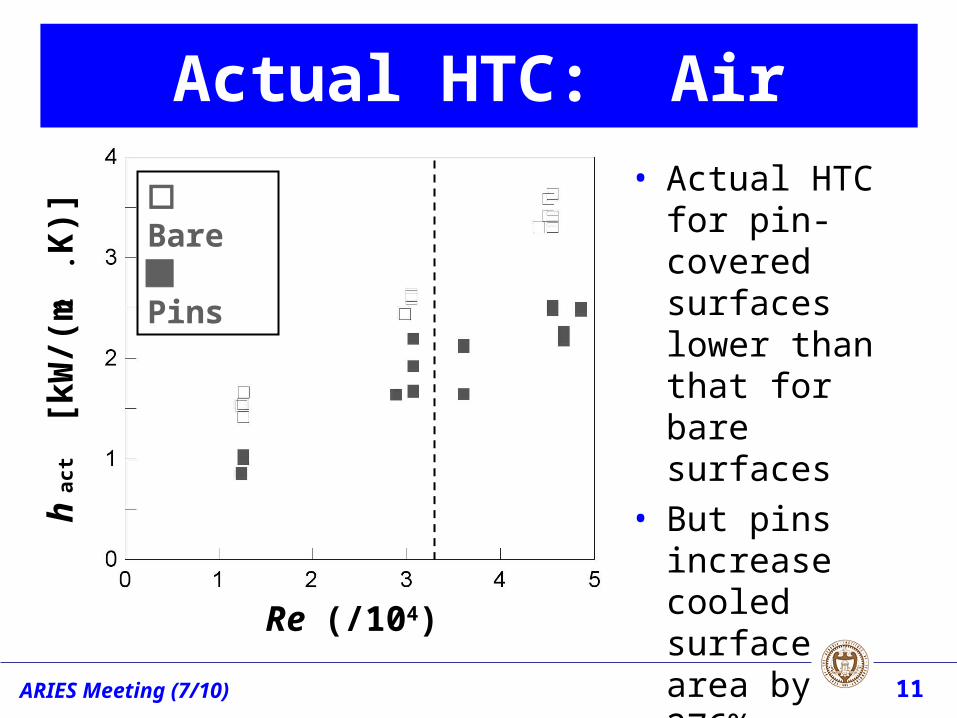
Actual HTC: Air
Bare Pins
hac
t [k
W/(
m2
K)]
Re (/104)
• Actual HTC for pin-covered surfaces lower than that for bare surfaces
• But pins increase cooled surface area by 276%, so heff greater than hact of bare surfaces

ARIES Meeting (7/10) 12
• Dynamic similarity dictates that Nusselt number Nu based on hact should be the same for air and He (small Pr effect)
• To predict performance of divertor at prototypical operating conditions, convert hact for air to hact for He
• Actual HTC: correct for changes in thermal conductivity k
• Pin-covered surface: correct for changes in hact and f
– f as Re and as hact
– f > 90% for air; f 5060% for He
HTC for Helium
He airHeact act
air
kh h
k
He He Heeff p f f act( )h A A A h
ARIES Meeting (7/10) 13
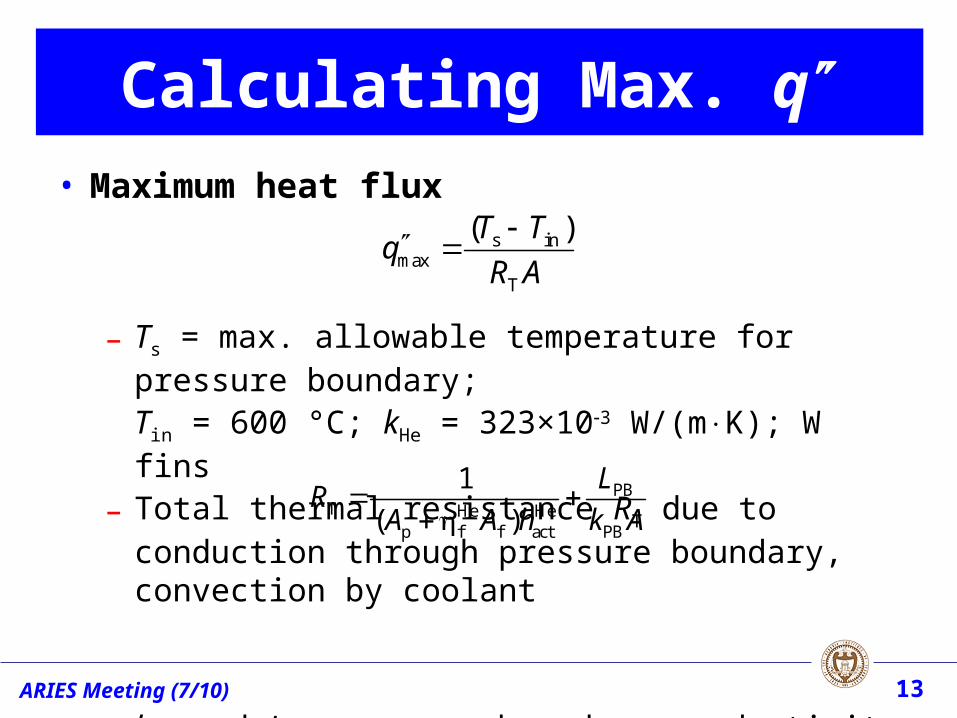
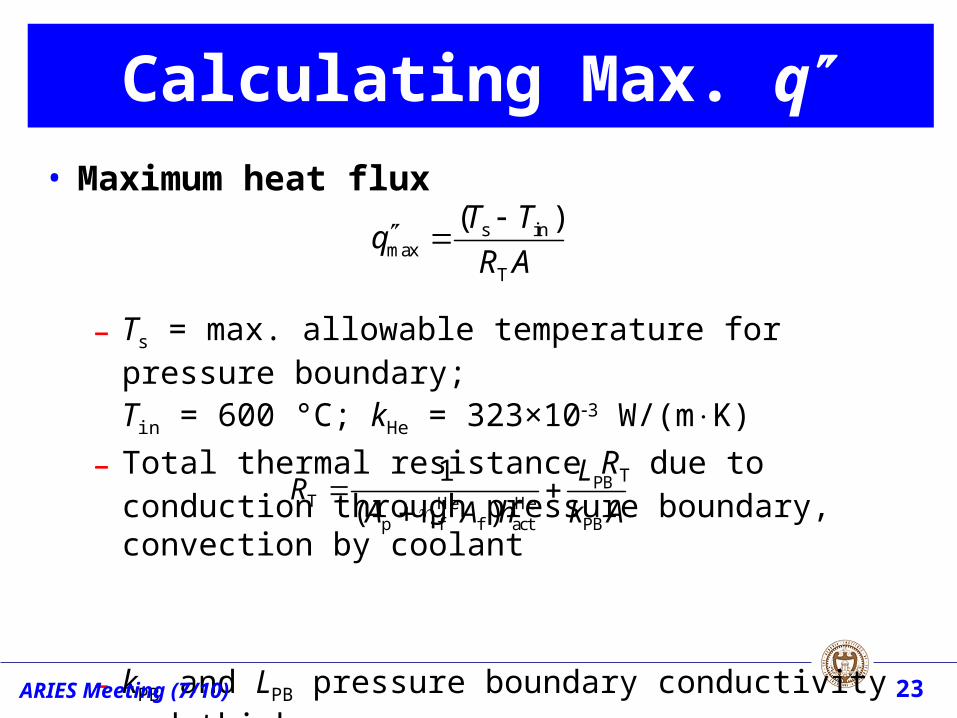
• Maximum heat flux
– Ts = max. allowable temperature for pressure boundary;
Tin = 600 °C; kHe = 323×103 W/(mK); W fins
– Total thermal resistance RT due to conduction through pressure boundary, convection by coolant
– kPB and LPB pressure boundary conductivity and thickness
– Plate: Ts = 1300 °C; kPB that of pure W; LPB = 2 mm
Calculating Max. q
PBT He He
p f f act PB
1
( )
LR
A A h k A
s inmax
T
( )T Tq
R A
ARIES Meeting (7/10) 14
1414
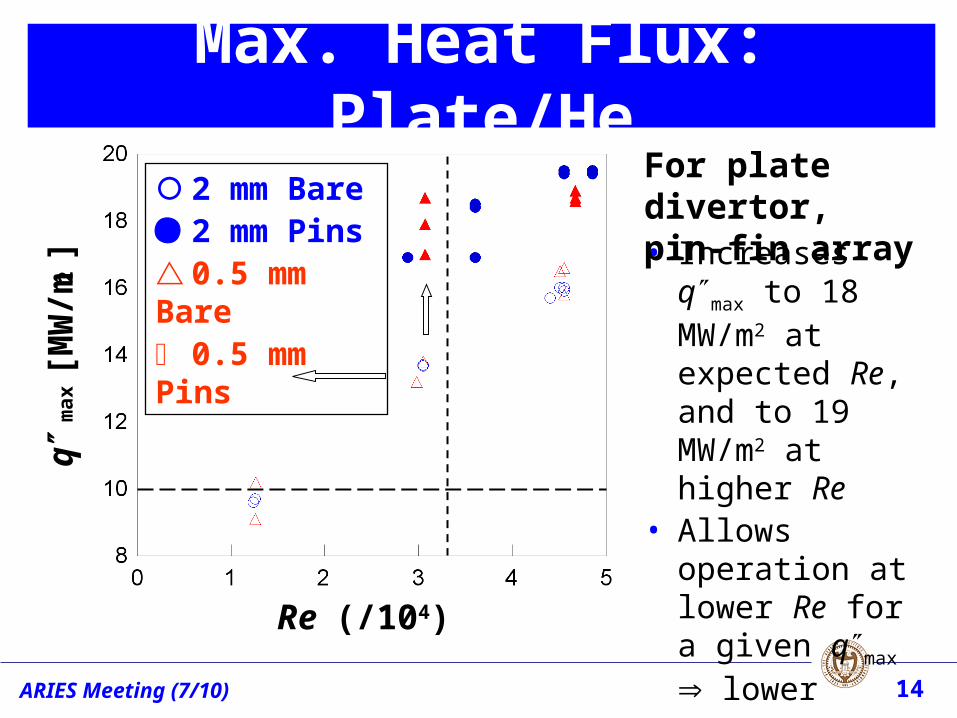
Max. Heat Flux: Plate/He
qm
ax [
MW
/m2
]
Re (/104)
2 mm Bare 2 mm Pins 0.5 mm Bare 0.5 mm Pins
• Increases qmax to 18 MW/m2 at expected Re, and to 19 MW/m2 at higher Re
• Allows operation at lower Re for a given qmax lower pressure drop
For plate divertor, pin-fin array
ARIES Meeting (7/10) 15
151515
Plate Conclusions• H = 2 mm 2D jet of He impinging on pin-covered surface
under prototypical conditions (Re = 3.3104) can accommodate heat fluxes up to 18 MW/m2 – Based on heat transfer (vs. thermal stress) considerations
• Pin fins can reduce operating Re, and hence coolant pumping requirements, for a given maximum heat flux– Benefits of pin fins decrease as Re increases and/or kPB
decreases (lower η)• Pin-fin array– Increases effective HTC by 90180%, but reduces actual
HTC– Increases P by at most 40%

ARIES Meeting (7/10) 16
• HElium-cooled Modular divertor with Pin array: developed by FZK to accommodate heat fluxes up to 10 MW/m2
HEMP Divertor
Finger + W tile
Pin-fin arrayW
W-alloy
– He enters at 10 MPa, 600 °C, then flows through ~3 mm annular gap, pin-fin array
– He exits at 700 °C via inner tube
– About 5105 modules needed for O(100 m2) divertor
[Diegele et al. 2003; Norajitra et al. 2005]
15.8
14 mm

ARIES Meeting (7/10) 17
GT HEMP Test Module
qReverse flow• Coolant: air
• Nominal operating Re = 3.05104 chosen to give 700 °C exit temperature in HEMP
• Fabricated in brass (k similar to W)• Heated by oxy-acetylene torch: q 2.5
MW/m2
• Reverse flow: similar to HEMP• Bare and pin-covered cooled surfaces• Forward flow: round jet with exit dia.
2 mm impinges on cooled surface– 2 mm gap between inner cartridge, cooled
surface 10 mm
5.8
Forward flow
Test Section
q
ARIES Meeting (7/10) 18
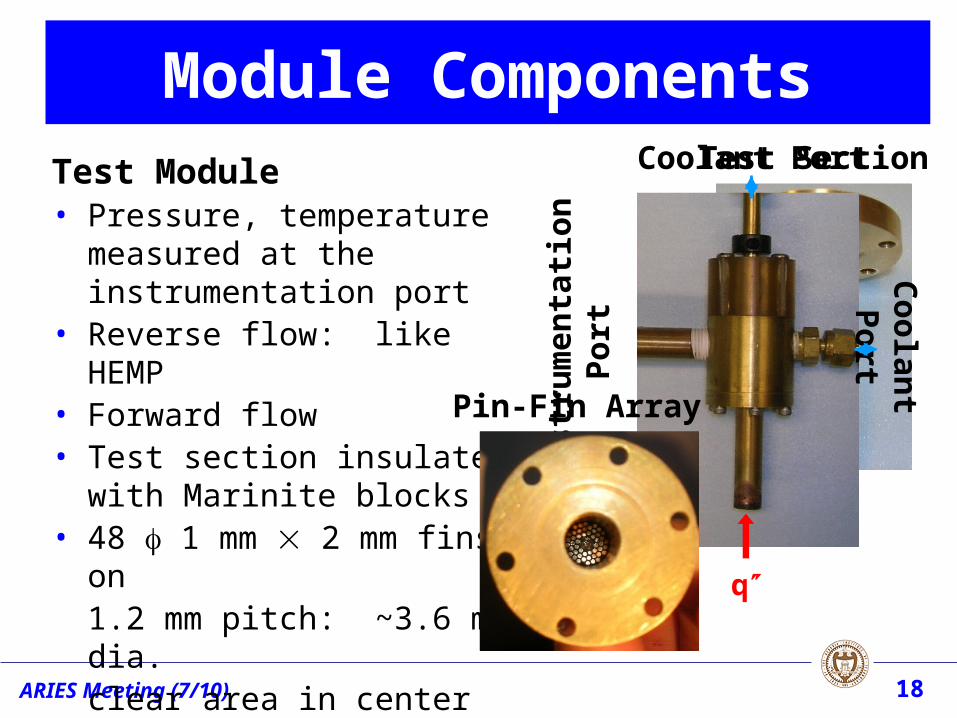
Test Module• Pressure, temperature measured
at the instrumentation port• Reverse flow: like HEMP• Forward flow• Test section insulated with
Marinite blocks• 48 1 mm 2 mm fins on
1.2 mm pitch: ~3.6 mm dia. clear area in center increase cooled surface area by 351%
Module ComponentsCoolant Port
Inst
rum
enta
tio
n
Por
t
Coolan
t P
ort
q
Pin-Fin Array
ARIES Meeting (7/10) 19
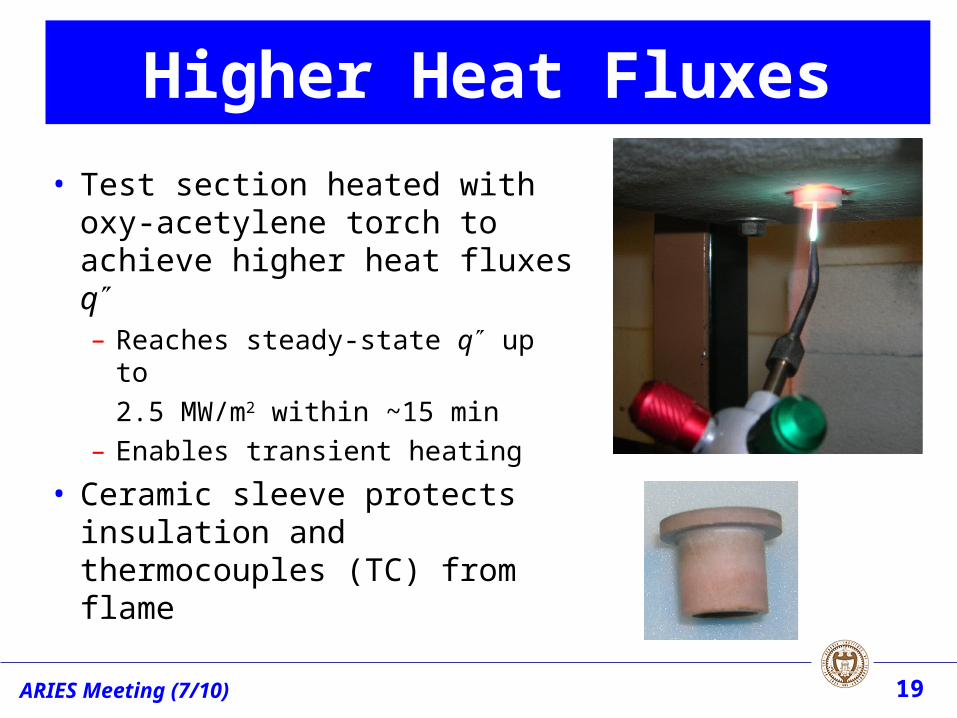
Higher Heat Fluxes
• Test section heated with oxy-acetylene torch to achieve higher heat fluxes q– Reaches steady-state q up to
2.5 MW/m2 within ~15 min
– Enables transient heating
• Ceramic sleeve protects insulation and thermocouples (TC) from flame
ARIES Meeting (7/10) 20
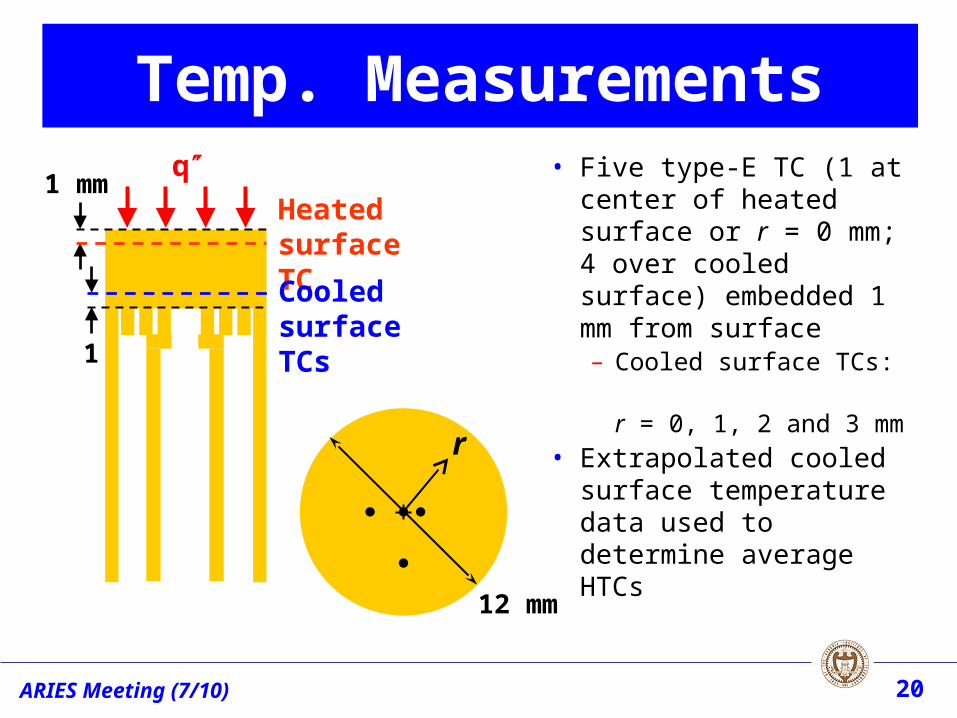
Temp. Measurements
Heated surface TC
Cooled surface TCs
q
1
1 mm • Five type-E TC (1 at center of heated surface or r = 0 mm; 4 over cooled surface) embedded 1 mm from surface– Cooled surface TCs:
r = 0, 1, 2 and 3 mm• Extrapolated cooled
surface temperature data used to determine average HTCs12 mm
r
ARIES Meeting (7/10) 21
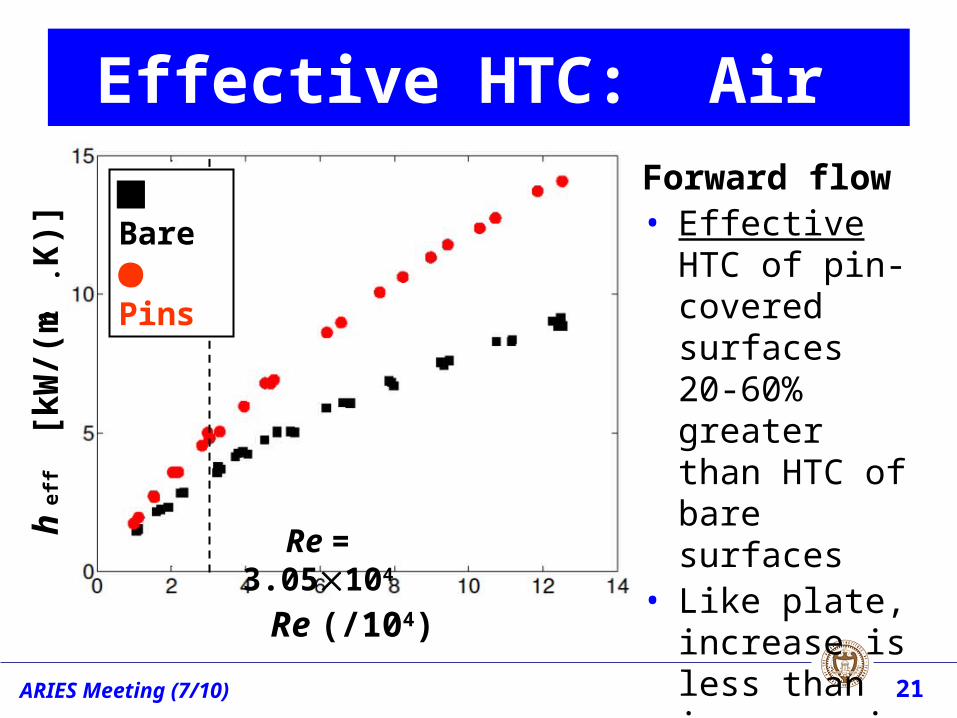
Effective HTC: Air Forward flow• Effective HTC of
pin-covered surfaces 20-60% greater than HTC of bare surfaces
• Like plate, increase is less than increase in area (lower hact and f < 1)
hef
f [k
W/(
m2
K)]
Re (/104)
Bare Pins
Re = 3.05104
ARIES Meeting (7/10) 22
Actual HTC: Air h
act [
kW
/(m2
K)]
Re (/104)
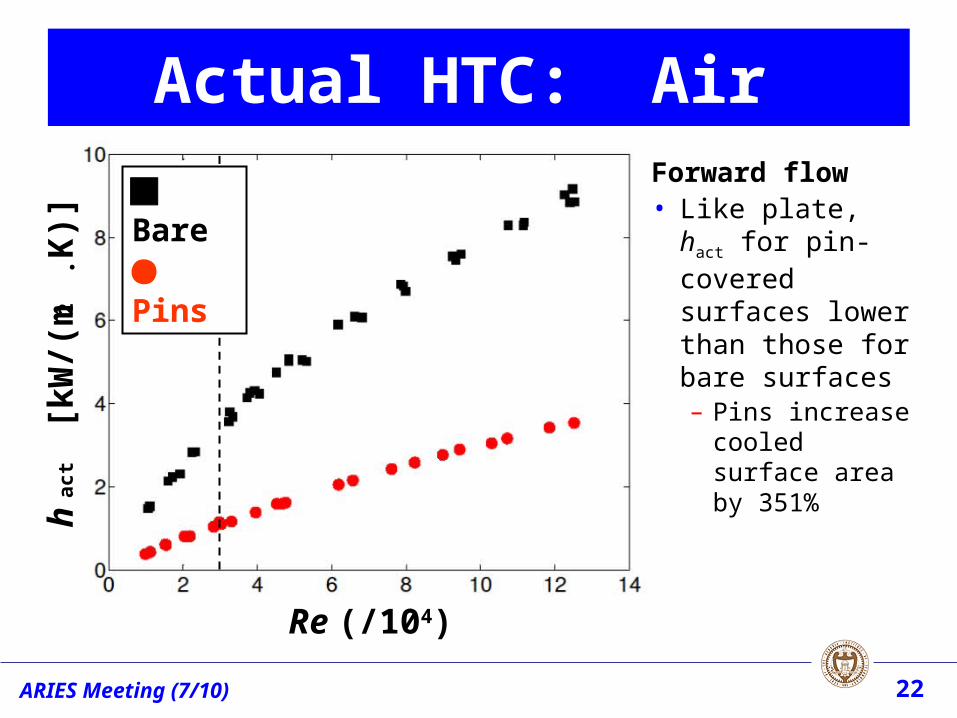
Forward flow• Like plate, hact
for pin-covered surfaces lower than those for bare surfaces– Pins increase
cooled surface area by 351%
Bare Pins
• Maximum heat flux
– Ts = max. allowable temperature for pressure boundary;
Tin = 600 °C; kHe = 323×103 W/(mK)
– Total thermal resistance RT due to conduction through pressure boundary, convection by coolant
– kPB and LPB pressure boundary conductivity and thickness
– HEMP: Ts = 1200 °C; kPB that of W-1% La2O3; LPB = 1 mm
ARIES Meeting (7/10) 23
Calculating Max. q
s inmax
T
( )T Tq
R A
PBT He He
p f f act PB
1
( )
LR
A A h k A
ARIES Meeting (7/10) 24
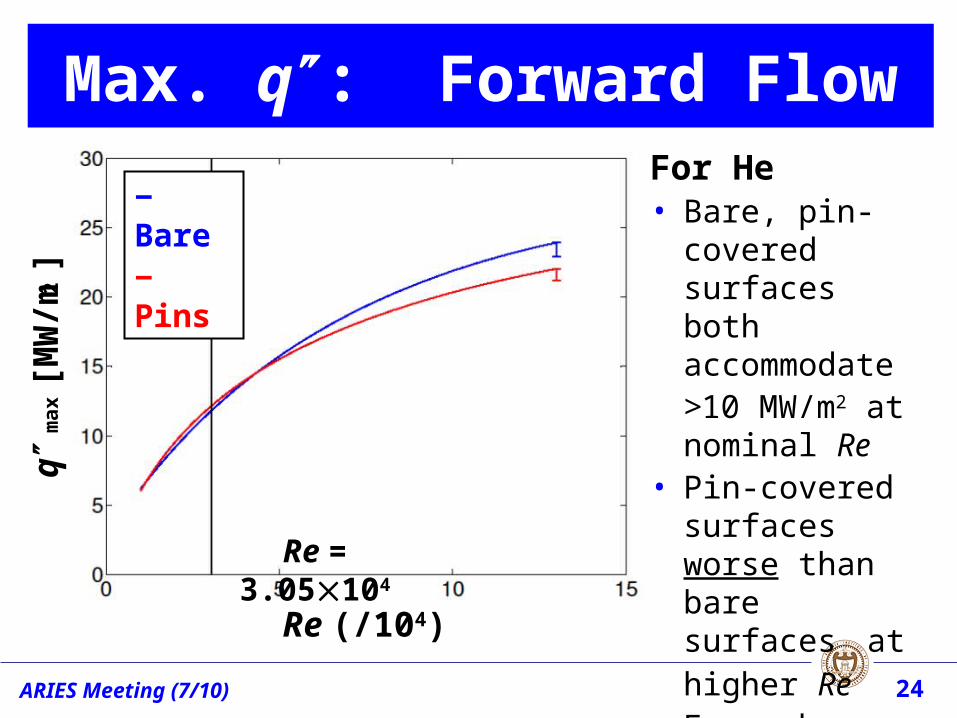
For He• Bare, pin-covered
surfaces both accommodate >10 MW/m2 at nominal Re
• Pin-covered surfaces worse than bare surfaces at higher Re
• Error bar: 10% decrease in kPB
2424
Max. q: Forward Flowq
max [
MW
/m2
]
‒ Bare‒ Pins
Re = 3.05104
Re (/104)
ARIES Meeting (7/10) 25
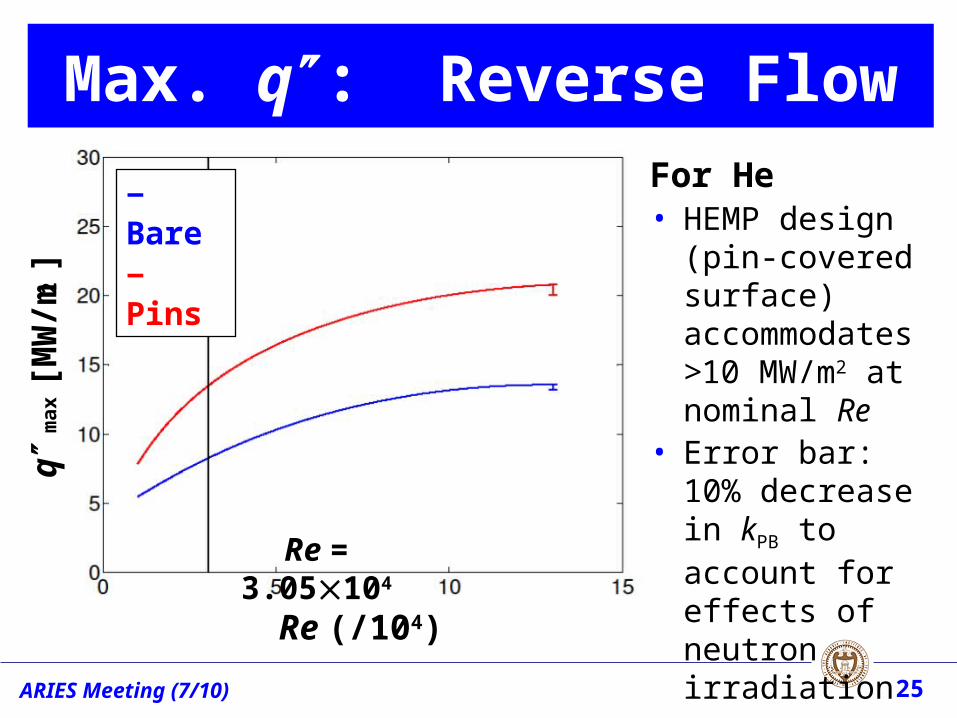
For He• HEMP design
(pin-covered surface) accommodates >10 MW/m2 at nominal Re
• Error bar: 10% decrease in kPB to account for effects of neutron irradiation
qm
ax [
MW
/m2
]
‒ Bare‒ Pins
Max. q: Reverse Flow
Re = 3.05104
Re (/104)
ARIES Meeting (7/10) 26
qm
ax [
MW
/m2
]
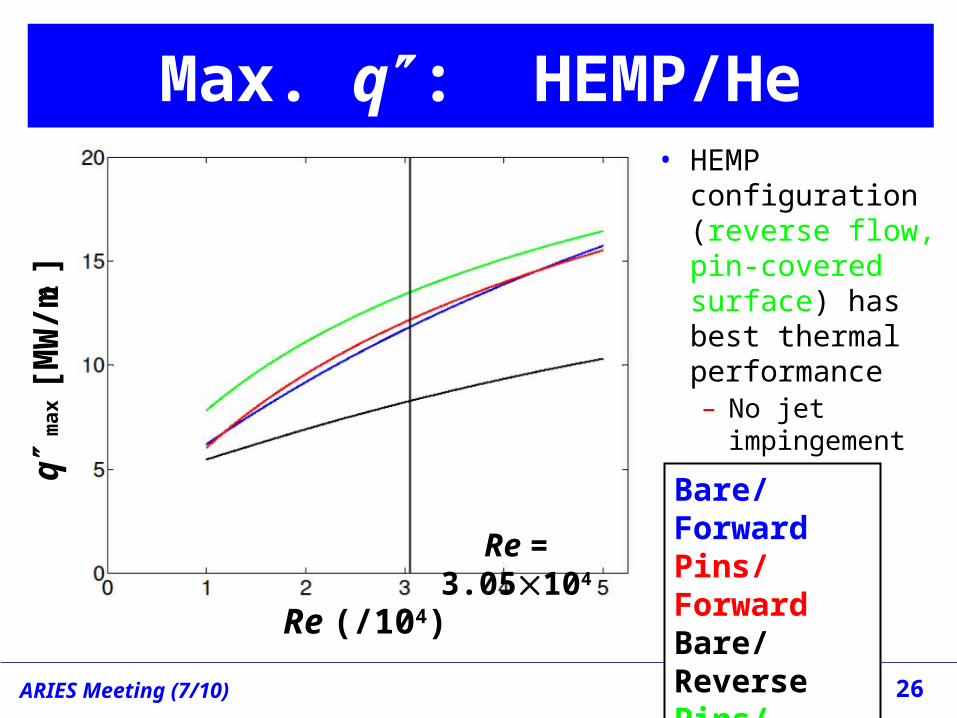
Bare/ForwardPins/ForwardBare/ReversePins/Reverse
Max. q: HEMP/He
Re = 3.05104
Re (/104)
• HEMP configuration (reverse flow, pin-covered surface) has best thermal performance– No jet
impingement
ARIES Meeting (7/10) 27
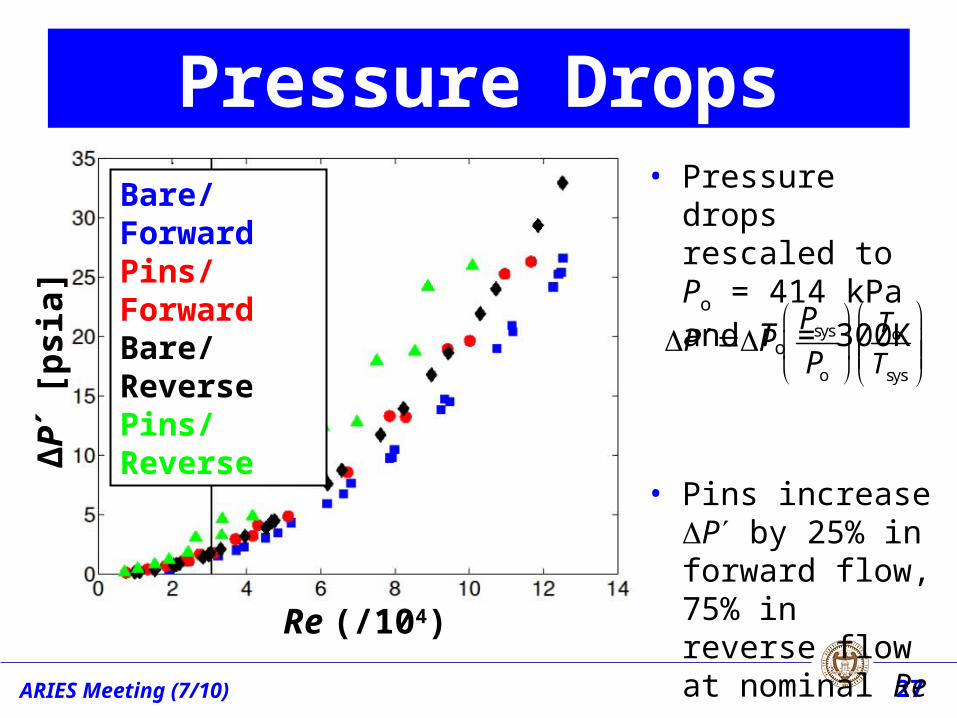
• Pressure drops rescaled to Po = 414 kPa and To = 300K
• Pins increase P by 25% in forward flow, 75% in reverse flow at nominal Re
Pressure Drops
sys o
o sys
T
T
PP P
P
ΔP
΄ [p
sia]
Re (/104)
Bare/ForwardPins/ForwardBare/ReversePins/Reverse

ARIES Meeting (7/10) 28
• ANSYS FLUENT® v12.1– Mesh: Gambit 2.4.6– RNG k-ε turbulence model– Non-equilibrium wall
functions• Two numerical models
– 2D axisymmetric (bare)– 3D 60° symmetric (bare +
pins): ~3.8105 cells• No insulation included;
adiabatic walls– BC confirmed by
simulations
Numerical Simulations50 mm
6
ARIES Meeting (7/10) 29
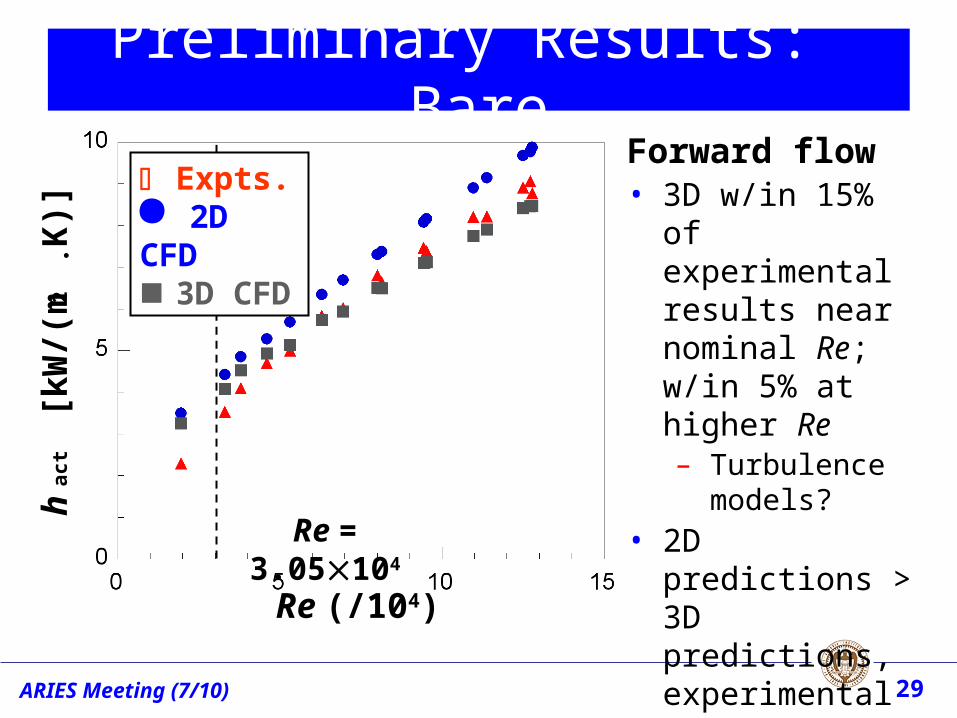
Preliminary Results: Bareh
act [
kW
/(m2
K)]
Re (/104)
Re = 3.05104
Forward flow• 3D w/in 15% of
experimental results near nominal Re; w/in 5% at higher Re– Turbulence
models?• 2D predictions >
3D predictions, experimental results– q = 0.5–2.3
MW/m2
Expts. 2D CFD 3D CFD

ARIES Meeting (7/10) 30
HEMP Summary• Experimental studies of forward and reverse flow for
cooling bare and pin fin-covered surfaces– At nominal operating Re = 3.05104, best thermal
performance from HEMP configuration (reverse flow with pins): accommodates heat fluxes up to 13 MW/m2
– But fins increase P by 75% and 25% in reverse and forward flow, respectively, compared with bare surface cases
– Reverse flow with fins alternative to impingement jet cooling
– Fins have negligible benefit for forward flow (jet impingement)
• Numerical simulations– Initial results in qualitative agreement with experiments