Embed Size (px)
Citation preview

M. Umezaki, 21 June 2011

• Abstract
• Context
• The Mountain Ok (Mt Ok) people of Telefomin, who live at the interior of Papua New Guinea (PNG), were documented over 25 years ago to be one of the shortest populations on record, with average adult height below the fifth percentile (US). Serum Growth Hormone was detectable, Insulin-like Growth Factor-1 and serum indicators of protein nutritional status fell within the normal range, suggesting that these were not primary factors for their relative short stature.
• Objective
• Since the Telefolmin people have experienced recent socioeconomic changes, they were re-evaluated in 2008, to examine height, weight, and body mass index (BMI), for insight into relative contributions of environment and other factors that modulate stature in children and adults.
• Study Design and Setting
• Cross-sectional anthropometric data were collected from 474 individuals at Telefomin in 2008, and compared with anthropometric data from 342 individuals measured in 1983.
• Results
• The height of Telefolmin subjects, below the fifth percentile in 1983, remained below the fifth percentile in 2008. Weight and BMI of peripubertal and adult age groups increased from 1983 to 2008. Male and female heights at peripubertal ages were significantly greater in 2008. Nevertheless, final adult height did not change significantly over the 25 years.
• Conclusions
• Recent socioeconomic changes appear to contribute to increased weight, BMI, and stature at younger ages in the Mt Ok at Telefomin. In contrast, unchanging adult stature may reflect a delay in the impact of socioeconomic changes, or genetic influences that modulate responsiveness to other growth regulators. Am. J. Hum. Biol., 2011. © 2010 Wiley-Liss, Inc.

Determinants of Stature - Environment - Nutrition - Hormone - Genetics
The Mountain Ok people in PNG - One of the shortest on record in 1983 (Schwartz et al., 1987) - Growth hormone =sufficient
Ok Tedi Gold and Copper Mining - the early 1980s
Growth pattern in 1983 Growth pattern in 2008
25 years


Telefol-speaking people (N=4500) - 474 individuals were recruited in schools, clinics, and community centers. - Height, weight, MUAC, armspan - Reported age, verified by birth registries, hospital records or event calendar
Growth curves: - US population (CDC), WHO - Z scores
Born 2008
‘84-88 21-25
‘89-93 16-20
‘94-98 11-15
In 1983 2008
0-4 25-29
5-9 30-34
10-14 35-39
15-19 40-44

Figure 1. Height of Mt Ok people falls below fifth percentile in 2008. Growth curves for Telefolmin males (A) and females (B) are
plotted as mean height (cm) for age (year) in comparison to US growth charts indicated by dotted lines for the 5th (lower), 50th (middle), and 95th (upper) percentiles. Points show Mean ± SD for individual ages (below 20 years) or at the midpoint of 5-year
age intervals above 20 years.
(A) (B)

Fig 1: Comparison with US growth curves
• Hgt (>21y, 2008) =158 (m), 151 (f); <5th %tile
• Hgt (11-20y, 2008) = <5th %tile
• Hgt (<10y, 2008) = 50th %tile (f)
• Hgt*Armspan: r=0.96

Figure 2. Height, weight, and BMI of Telefolmin are higher at peripubertal ages in 2008 than in 1983. Mean height (A), weight (B), and BMI (C) of Mt OK males and females are significantly greater at peripubertal ages (P < 0.05 shown by ♦) in 2008 (solid circles) versus 1983 (open circles). Weight and BMI are also significantly greater in some adult age groups in 2008 as indicated. Each point shows mean height (±SD) for age groups in Table 1.

Figure 3. Z scores for height, weight, and BMI of Telefolmin are higher at peripubertal ages in 2008. Z scores normalizing Mt Ok data to US values (reference line = 0) are shown for subjects below 20 years, grouped as in Figure 2. Height, weight, and BMI were significantly greater in 2008 (gray box) versus 1983 (open box) for age groups indicated on x axis (P < 0.05 shown by *). Each box shows median (horizontal line) within 25th (bottom) and 75th (top) percentiles; error bars show 5th (bottom) to 95th (top) percentiles. Small open circles show outliers.

Fig 2A: Comparison of Hgt in 1983 and 2008
• Female: 2008>1983 (6-10y, 11-15y)
• Males: 2008>1983 (11-15y, 16-20y)
• Males: 2008>1983 (36-45y)
Born 2008
‘84-88 21-25
‘89-93 16-20
‘94-98 11-15
In 1983 2008
0-4 25-29
5-9 30-34
10-14 35-39
15-19 40-44

Figure 2. Height, weight, and BMI of Telefolmin are higher at peripubertal ages in 2008 than in 1983. Mean height (A), weight (B), and BMI (C) of Mt OK males and females are significantly greater at peripubertal ages (P < 0.05 shown by ♦) in 2008 (solid circles) versus 1983 (open circles). Weight and BMI are also significantly greater in some adult age groups in 2008 as indicated. Each point shows mean height (±SD) for age groups in Table 1.
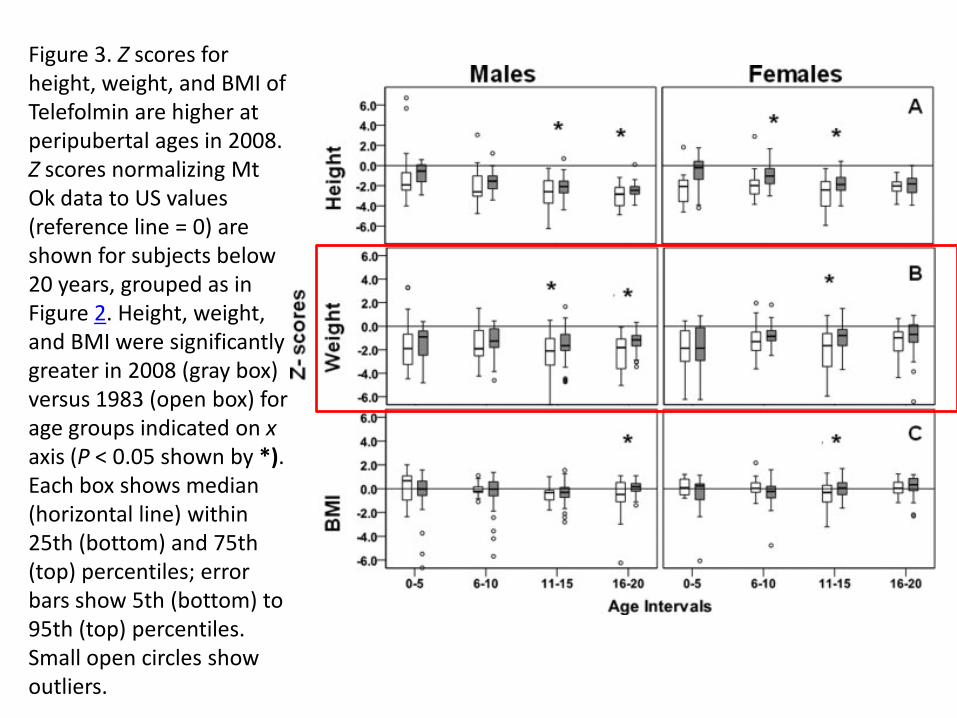
Figure 3. Z scores for height, weight, and BMI of Telefolmin are higher at peripubertal ages in 2008. Z scores normalizing Mt Ok data to US values (reference line = 0) are shown for subjects below 20 years, grouped as in Figure 2. Height, weight, and BMI were significantly greater in 2008 (gray box) versus 1983 (open box) for age groups indicated on x axis (P < 0.05 shown by *). Each box shows median (horizontal line) within 25th (bottom) and 75th (top) percentiles; error bars show 5th (bottom) to 95th (top) percentiles. Small open circles show outliers.

Fig 2B: Comparison of Wgt in 1983 and 2008
• Female: 2008>1983 (11-15y)
• Female: 2008>1983 (26-35y, 36-45y)
• Males: 2008>1983 (11-15y, 16-20y)
• Males: 2008>1983 (36-45y)
Born 2008
‘84-88 21-25
‘89-93 16-20
‘94-98 11-15
In 1983 2008
0-4 25-29
5-9 30-34
10-14 35-39
15-19 40-44

Figure 2. Height, weight, and BMI of Telefolmin are higher at peripubertal ages in 2008 than in 1983. Mean height (A), weight (B), and BMI (C) of Mt OK males and females are significantly greater at peripubertal ages (P < 0.05 shown by ♦) in 2008 (solid circles) versus 1983 (open circles). Weight and BMI are also significantly greater in some adult age groups in 2008 as indicated. Each point shows mean height (±SD) for age groups in Table 1.

Fig 2C: Comparison of BMI in 1983 and 2008
• Female: 2008>1983 (11-15y)
• Female: 2008>1983 (26-35y, 36-45y)
• Males: 2008>1983 (16-20y)
• Males: 2008>1983 (36-45y)
Born 2008
‘84-88 21-25
‘89-93 16-20
‘94-98 11-15
In 1983 2008
0-4 25-29
5-9 30-34
10-14 35-39
15-19 40-44

Figure 3. Z scores for height, weight, and BMI of Telefolmin are higher at peripubertal ages in 2008. Z scores normalizing Mt Ok data to US values (reference line = 0) are shown for subjects below 20 years, grouped as in Figure 2. Height, weight, and BMI were significantly greater in 2008 (gray box) versus 1983 (open box) for age groups indicated on x axis (P < 0.05 shown by *). Each box shows median (horizontal line) within 25th (bottom) and 75th (top) percentiles; error bars show 5th (bottom) to 95th (top) percentiles. Small open circles show outliers. BMI = 50th%tile of US standard

Piecewise linear structure regression(?), a special case of spline
Estimated change from 1983 to 2008
Regression to cancel the effect of different age in each age group?

Figure 4. Percent changes in height are not parallel to changes in weight and BMI. The relationships among percent changes between 2008 and 1983, for
height (black bar), weight (gray bar), and BMI (open bar), vary among the shortest (10th percentile) and tallest (90th percentile) subjects. Values are
presented as Mean ± SD, derived from quantile regression analysis.
Hgt Wgt BMI

Summary of the findings
• Height increased only in young generation
• Height did not increase in adult
• Weight ang BMI increased in most age groups
• SE change contributed the above changes
• Unchanging adult stature may reflect the delay in impact or genes that limit growth

Stature of the Mountain Ok people
• Short stature (<5th%tile) in 1983 and 2008
– Growth promoting hormones (GH and IGF1) were
detectable in serum (Schwartz et al., 1987)
– Reduced GHBP (Baumann et al., 1991)
– “multiple factors impact regulation of stature”
– “non-hormonal factors?”

Younger age groups show increased height over the 25-year-interval
• Height gain from 1983 to 2008: 11-15y (m) and 6-10 y (f)
• Originally characterized by “slow growth”
• Evidence of puberty spurt?
• Secular trend with changes in socioeconomic status?

Weight and BMI increase in young and adult age groups
• Height: high heritability
• Weight: Environmental effect
• Female of 26-25 years gained weight probably because of SE changes

Impact of interactions with ok Tedi mine
• No Hight change in 21-35 males (2008), and adult females (2008) but in 36-45 y males (2008) – By chance? or onset of bone loss in 1983
– Dietary change (e.g., energy dense)
– Time lag: cf, birth weight: 2663g (1963-70) < 2854g (1995-2000)

Multiple factors influence stature of the Telefolmin
• Height increase in young generation
= future height increase in adults?
• Genetic factors limit the increase of final height? (see Fig 4)

Why their stature is short?
• (1) Biological adaptation?
• (2) Or Consequences of diet?
• The Shorter, the better: (1)
• Height increase due to dietary change (2)