Embed Size (px)
Citation preview

M Slavik & J Bosman

2
ExpertiseExpertise
1 2 3 4 5 6 7 8 9 10 11 12 13 14 15 16
17 18 19 20
1 2 3 4 5 6 7 8 9 10 11 12 13 14 15 16
17 18 19 20
DataData
Information
KnowledgeKnowledgeM1 M2 M3M1 M2 M3

70 % freight by road 4 % p.a. growth
Information on traffic loadingneeded for:
• pavement design• road maintenance• law enforcement• statistics, patterns, trends
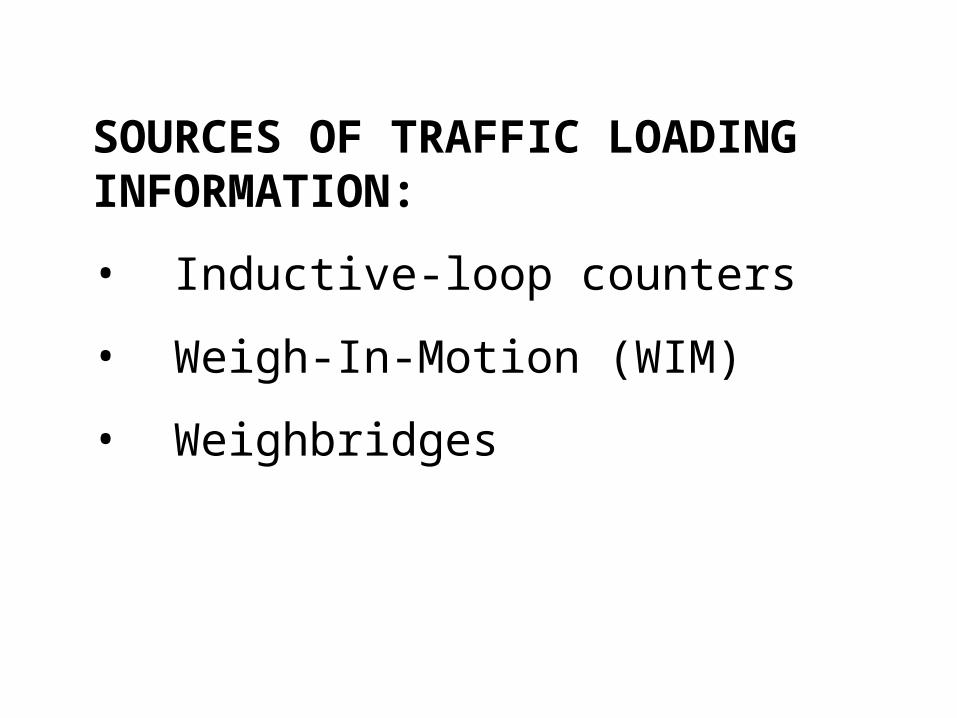
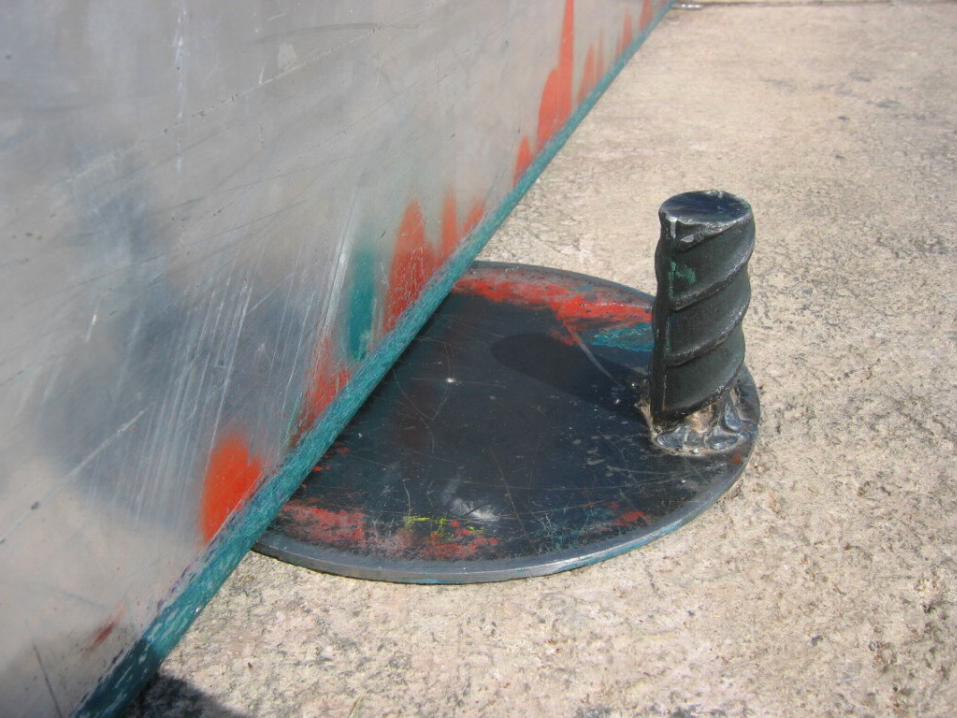
SOURCES OF TRAFFIC LOADINGINFORMATION:
• Inductive-loop counters
• Weigh-In-Motion (WIM)
• Weighbridges

ASPECTS OF TRAFFIC LOADING:
• MagnitudeAverage Daily Traffic (ADT)Average Daily Truck Traffic (ADTT)
• CompositionLV, HV; HV - short, medium, long,buses, vehicle / axle configuration
• Axle loadsAxle-load distributionESAL (E80)

0123456789
10111213141516171819202122232425
0 1 2 3 4 5 6 7 8 9 10 11 12 13 14 15 16 17 18
Axle load, t
E80
E80 = (Axle load / 8.2)4.2


E80 FROM INDUCTIVE LOOPS
• Bosman 1988:4 classes of road, by % of 2-ax HVTypical (default) axle-load distributions
• Bosman 2004: Simplified to 3 classes
• Slavik & Bosman in 2006:Parameters measurable by loopsHV - Short, Medium, Long, vs E80/HVInfluence of law enforcement3 steps
STEP 1 – RELATION WITH E80/HV
Loop measured attributes:
• % heavy vehicles (HV)• % short HV• % mediun HV• % long HV

STEP 2 – 76 WIM STATIONS, 2005
• Data validated
• Reprocessed
• % Long trucks determined
• E80/HV evaluated

STEP 3 – LAW ENFORCEMENT
INTENSITY :
• Strong – permanent presence
• Medium – ad-hoc, blitzes
• Weak – occasional; non-existent
STEPS 1 + 2 + 3 : GRAPH – FIG.1
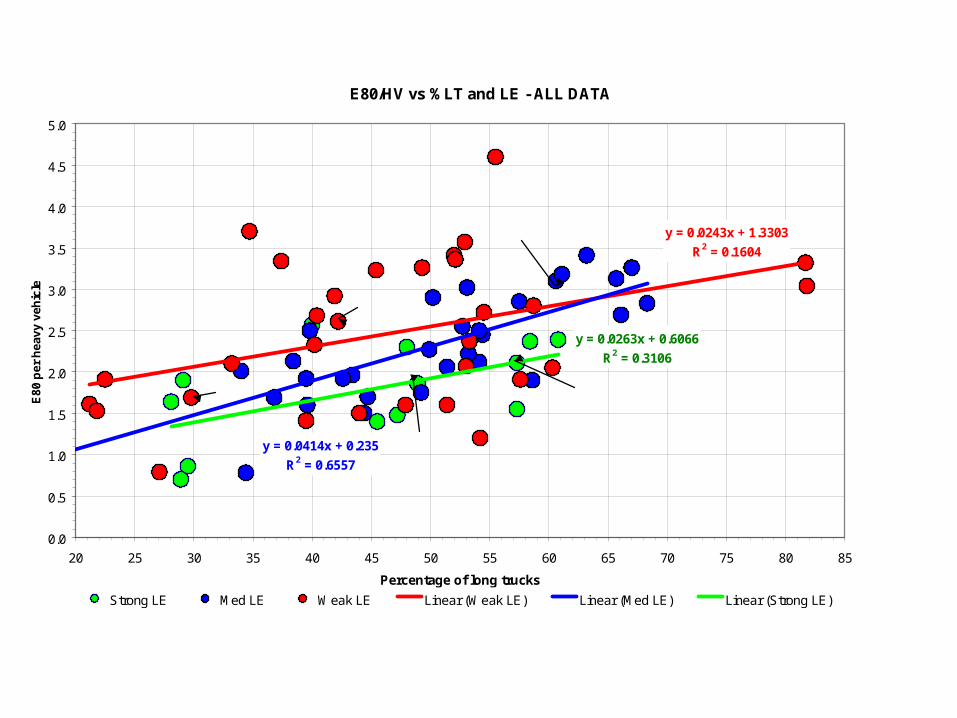
E80/HV vs %LT and LE - ALL DATA
y = 0.0243x + 1.3303
R2 = 0.1604
y = 0.0414x + 0.235
R2 = 0.6557
y = 0.0263x + 0.6066
R2 = 0.3106
0.0
0.5
1.0
1.5
2.0
2.5
3.0
3.5
4.0
4.5
5.0
20 25 30 35 40 45 50 55 60 65 70 75 80 85
Percentage of long trucks
E8
0 p
er
he
avy
veh
icle
Strong LE Med LE Weak LE Linear (Weak LE) Linear (Med LE) Linear (Strong LE)
1 KLPnb
2 WNKnb
3 KMTeb
5 HDBsb
4 HDCsb

STEP 4 –TRAFFIC LOADING MODELS
Type LT class Law Enf.
1 Below 35 % Any
2 35 % – 55 % Weak
3 35 % – 55 % Strong
4 Over 55 % Weak
5 Over 55 % Strong

STEP 5 – FIVE MODEL STATIONS
Type LT LE Model
1 Below 35 % Any N12 Kliprivier
2 35 % – 55 % Weak N2 Winkelspruit
3 35 % – 55 % Strong N4 Komati
4 Over 55 % Weak N3 Hidcote
5 Over 55 % Strong N3 Heidelberg

TABLE 2. Traffic and Sample Sizes at the Five Traffic-loading Model Stations
Type Abbrev. ADT/dir ADTT/dir HV HV-ax
1 KLP 32 451 1 618 367 147 1 512 495
2 WNK 11 898 951 317 918 1 444 444
3 KMT 1 619 222 46 932 210 335
4 HDC 7 223 1 995 593 819 3 154 415
5 HDB 5 082 1 052 325 177 1 703 140

TABLE 3. Key Figures of the Five Traffic-loading Types
Model %LT class LE WIM % LT t/ax E80/ax ax/HV E80/HV
1 Below 35 Any KLP 29.8 4.845 0.411 4.12 1.69
2 35 - 55 Weak WNK 42.2 5.080 0.574 4.54 2.61
3 35 - 55 Strong KMT 48.9 5.279 0.415 4.48 1.86
4 Over 55 Weak HDC 60.6 5.984 0.583 5.31 3.10
5 Over 55 Strong HDB 58.4 5.783 0.453 5.24 2.37
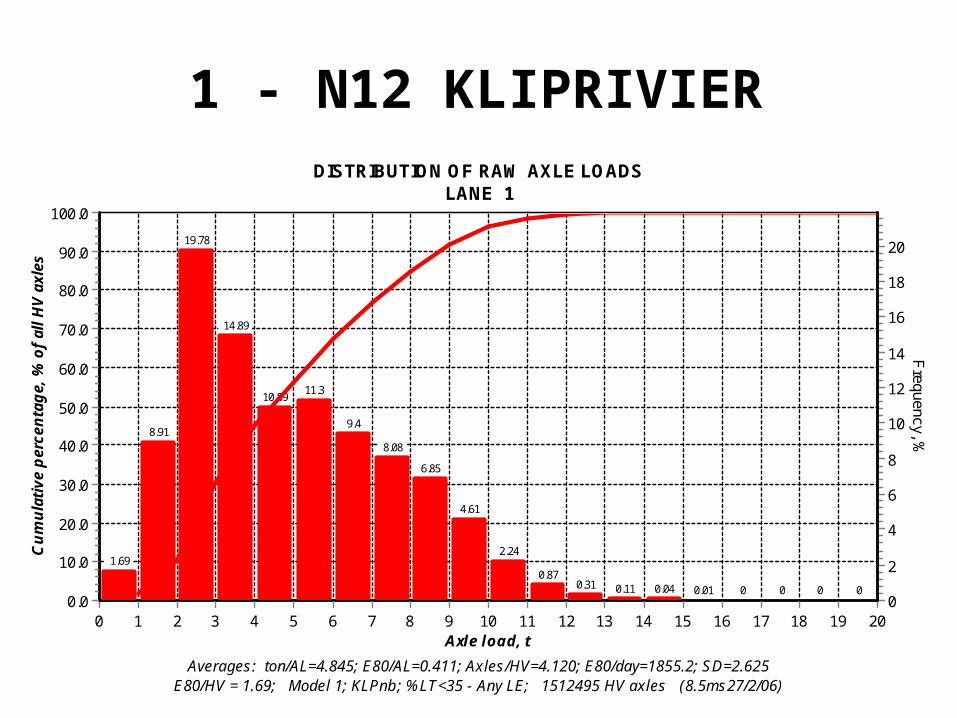
DISTRIBUTION OF RAW AXLE LOADSLANE 1
E80/HV = 1.69; Model 1; KLPnb; %LT<35 - Any LE; 1512495 HV axles (8.5ms27/2/06)Averages: ton/AL=4.845; E80/AL=0.411; Axles/HV=4.120; E80/day=1855.2; SD=2.625
Axle load, t20191817161514131211109876543210
Cu
mu
lati
ve p
erce
nta
ge,
% o
f al
l HV
axl
es
100.0
90.0
80.0
70.0
60.0
50.0
40.0
30.0
20.0
10.0
0.0
Frequency, %
20
18
16
14
12
10
8
6
4
2
0
1.69
8.91
19.78
14.89
10.8911.3
9.4
8.08
6.85
4.61
2.24
0.870.31 0.11 0.04 0.01 0 0 0 0
1 - N12 KLIPRIVIER

DISTRIBUTION OF RAW AXLE LOADSLANE 1
E80/HV = 2.61; Model 2: WNKnb; 35<%LT<55 - Weak LE; 1444444 HV axles (8.6ms27/6/06)Averages: ton/AL=5.080; E80/AL=0.574; Axles/HV=4.543; E80/day=2363.9; SD=2.972
Axle load, t20191817161514131211109876543210
Cu
mu
lati
ve p
erce
nta
ge,
% o
f al
l HV
axl
es
100.0
90.0
80.0
70.0
60.0
50.0
40.0
30.0
20.0
10.0
0.0
Frequency, %
20
18
16
14
12
10
8
6
4
2
0
1.27
11.46
19.32
13.5
10.63
9.48
6.56
5.66
7.457.05
4.61
2.04
0.70.21 0.06 0 0 0 0 0
2 - N2 WINKELSPRUIT

DISTRIBUTION OF RAW AXLE LOADSLANE 1
E80/HV = 1.86; Model 3; KMTeb; 35<%LT<55 - Strong LE; 210335 HV axles (8.5ms27/2/06)Averages: ton/AL=5.279; E80/AL=0.415; Axles/HV=4.482; E80/day=402.2; SD=2.409
Axle load, t20191817161514131211109876543210
Cu
mu
lati
ve p
erce
nta
ge,
% o
f al
l HV
axl
es
100.0
90.0
80.0
70.0
60.0
50.0
40.0
30.0
20.0
10.0
0.0
Frequency, %
1716
15
1413
12
1110
9
87
6
54
3
21
0
0.65
5.63
14.49
15.99
11.68 11.4211.03
11.86
10.39
5.24
1.3
0.24 0.06 0.01 0.01 0.00 0 0 0 0
3 - N4 KOMATIPOORT

DISTRIBUTION OF RAW AXLE LOADSLANE 4
E80/HV = 3.10; Model 4; HDCsb; %LT>55 - Weak LE; 3154415 HV axles (8.5ms27/2/06)Averages: ton/AL=5.984; E80/AL=0.583; Axles/HV=5.312; E80/day=5151.2; SD=2.438
Axle load, t20191817161514131211109876543210
Cu
mu
lati
ve p
erce
nta
ge,
% o
f al
l HV
axl
es
100.0
90.0
80.0
70.0
60.0
50.0
40.0
30.0
20.0
10.0
0.0
Frequency, %
15
14
13
12
11
10
9
8
7
6
5
4
3
2
1
0
1.28
2.54
8.69
12.18
9.95
14.23 14.46
12.01
12.95
7.41
3.42
0.720.12 0.03 0.01 0.00 0 0 0 0
4 - N3 HIDCOTE

DISTRIBUTION OF RAW AXLE LOADSLANE 1
E80/HV = 2.37; Model 5; HDBsb; %LT>55 - Strong LE; 1703140 HV axles (8.5ms27/2/06)Averages: ton/AL=5.783; E80/AL=0.453; Axles/HV=5.238; E80/day=2141.4; SD=2.112
Axle load, t20191817161514131211109876543210
Cu
mu
lati
ve p
erce
nta
ge,
% o
f al
l HV
axl
es
100.0
90.0
80.0
70.0
60.0
50.0
40.0
30.0
20.0
10.0
0.0
Frequency, %
18
16
14
12
10
8
6
4
2
00.15
1.58
8.85
13.82
12.59
14.23
17.31
14.67
10.64
4.77
1.12
0.22 0.04 0.01 0.00 0.00 0 0 0 0
5 - N3 HEIDELBERG
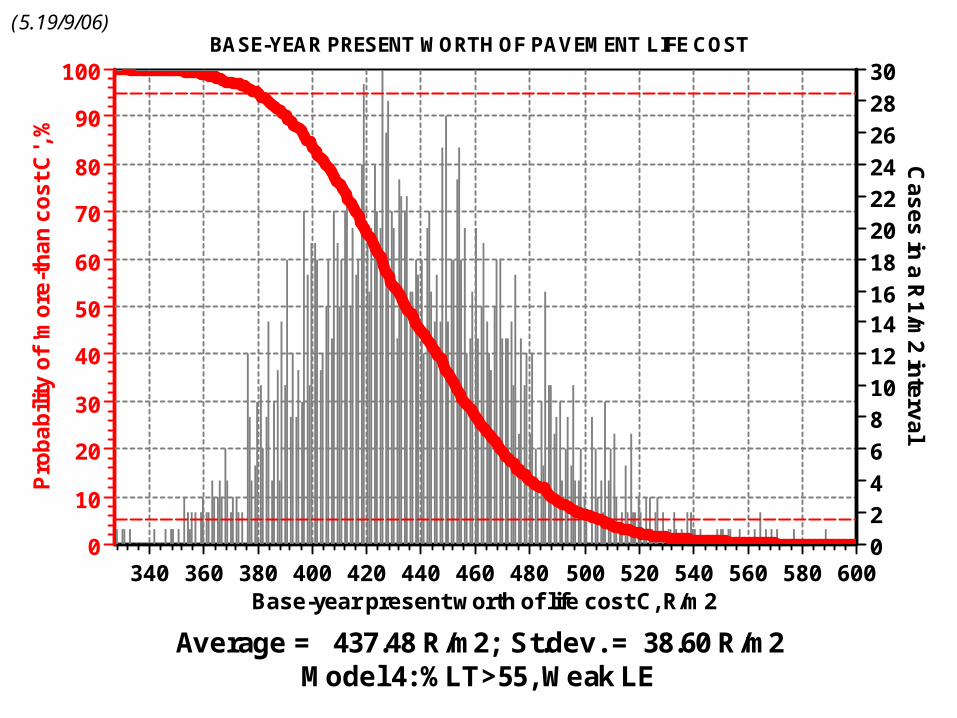
BASE-YEAR PRESENT WORTH OF PAVEMENT LIFE COST
Model 4: %LT>55, Weak LEAverage = 437.48 R/m2; St.dev. = 38.60 R/m2
Base-year present worth of life cost C, R/m2600580560540520500480460440420400380360340
Pro
ba
bili
ty o
f 'm
ore
-th
an
co
st
C',
%100
90
80
70
60
50
40
30
20
10
0
Ca
se
s in
a R
1/m
2 in
terv
al
30
28
26
24
22
20
18
1614
12
10
8
6
4
2
0
(5.19/9/06)

BASE-YEAR PRESENT WORTH OF PAVEMENT LIFE COST
Model 5: %LT>55, Strong LEAverage = 393.90 R/m2; St.dev. = 28.29 R/m2
Base-year present worth of life cost C, R/m2500480460440420400380360340320
Pro
ba
bili
ty o
f 'm
ore
-th
an
co
st
C',
%100
90
80
70
60
50
40
30
20
10
0
Ca
se
s in
a R
1/m
2 in
terv
al
35
30
25
20
15
10
5
0
(5.19/9/06)

E80/HV vs %LT and LE - ALL DATA
y = 0.0243x + 1.3303
R2 = 0.1604
y = 0.0414x + 0.235
R2 = 0.6557
y = 0.0263x + 0.6066
R2 = 0.3106
0.0
0.5
1.0
1.5
2.0
2.5
3.0
3.5
4.0
4.5
5.0
20 25 30 35 40 45 50 55 60 65 70 75 80 85
Percentage of long trucks
E8
0 p
er
he
avy
veh
icle
Strong LE Med LE Weak LE Linear (Weak LE) Linear (Med LE) Linear (Strong LE)
1 KLPnb
2 WNKnb
3 KMTeb
5 HDBsb
4 HDCsb

WHY?• Weak relationship between %LT and E80/HV• Imprecision of WIM due to - Calibration problems - Deteriorating pavement - Hardware and software defects• No cheap substitute for good WIM measurements
NEXT?• Strict WIM quality control (European Standard) • Uniform data validation procedures• Uniform tender requirements• Re-appraise situation in 2-3 years time

CONCLUSION
The relationship between the percentage of long trucks and E80/HV is not very good. R-square varies from 0,16 to 0,66.
The trend lines, however, indicate that
• the E80/HV is lower with higher law enforcement, and • the E80/HV is higher with a higher percentage of long trucks.
It is thus recommended that, in the absence of better traffic loading data
• the E80/HV values in Table 3 of the paper, and • the axle distributions in Appendix A of the paper
be used by designers and practitioners in the meantime.

ACKNOWLEDGEMENTS
The authors wish to express their gratitude to:
• NTRV (Northern Toll Road Venture, the N1 Toll Road Concessionaire) • N3TC (N3 Toll Concession, the N3 Toll Road Concessionaire),
• TRAC (Trans African Concessions, the N4 Toll Road Concessionaire), • Bakwena (the N4 Platinum Toll Road Concessionaire), and
• SANRAL (South African National Roads Agency Limited)
for the traffic data and information made available.

M Slavik & J Bosman