Embed Size (px)
Citation preview

Joumal of Glaciolog)!, Vol. 25, No. 91,1980
GLACIOLOGICAL INVESTIGATIONS OF THE TROPICAL QUELCCAYA ICE CAP, PERU*
By LONNIE G. THoMPsoN ( Institute of Polar Studies, Ohio State University, Columbus, Ohio 43210, U.S.A.)
ABSTRACT. Glaciological results of the continuing investigations of the Quelccaya ice cap located at lat. 13 ° 56' S., long. 70° 50 ' W., in the Cordillera Oriental of southern Peru are presented. lee cores to a depth of 15 m have been retrieved from the summit dome (5 650 m), middle dome (5543 m), and south dome (5 480 m) and sampled in detail for microparticle, oxygen-isotope, and total-,8-activity measurements. Results of these core analyses indicate that although the summit of this ice cap is only 300 m above the annual snow line and the firn is temperate, an interpretable stratigraphic record is preserved. The marked seasonal ice stratigraphy is produced by the marked seasonal variation in regional precipitation. High concentrations of microparticles and ,8-radioactive material occur during the dry season (May-August). Microparticles deposited during the rainy season are larger than those deposited during the dry season. On the Quelccaya ice cap the most negative 01BO values occur during the warmer rainy season (the opposite occurs in polar regions). The near-surface mean 0 value of - 21 %0 is remarkably low for this tropical site where the measured mean annual air temperature is - 3 ° C. The seasonality of the microparticles, total ,8 activity, and isotope ratios offers the prospect of a climatic ice-core record from this tropical ice cap.
RESUME. Reclzerches glaciologiques sur la calotte glaciaire tropicale du Quelccl1.ya, Pirou. On presente les resultats glaciologiques d'investigations continues de la calotte glaciaire du Quelccaya situee a 13 ° 56' S., 7 0° 50' w. dans la Cordillera Oriental du Perou du sud. Des carottes jusqu'a une profondeur de 15 m ont ete prelevees sur le dome sommital (5 650 m), le dome du milicu (5543 m) et le dome sud (5 480 m) et analysees en detail pour les microparticules, I'oxygene isotopique et l'activite ,8 totale. Les resultats de ces analyses de carottes indiquent que, bien que le sommet de cette calotte de glace ne soit qu'a 300 m au-dessus de la ligne annuelle des neiges et que le neve soit tempere, le glacier reste un enrcgistreur stratigraphique interpretable. La stratigraphie saisonniere bien marquee de la glace est l'effet d'une variation saisonniere bien marquee dans les precipitations regionales. De hautes concentrations en microparticules et en materiel radioactif ,8 se produisent pendant la saison seche (mal-aout). Sur la calotte glaciaire du Quelccaya, les valeurs les plus negatives de olBO interviennent au cours de la saison chaude pluvieuse (l'oppose se produit dans les regions polaires). La valeur moyenne de 0 pres de la surface qui est - 21 %0 est remarquablement faible pour ce site tropical ou la temperature moyenne annuelle de l'air est de - 3 ° C . La variabilite saisonniere des microparticules de I'activite totale et des rapports isotopiques offre la perspective d'un enregistrement du c1imat par les carottes de glace de ce glacier tropical.
ZUSAMMENFASSUNG. Glaziologische Ulltersucll1lllgen my der tropischell OJLClccaya-Eiskappe, Peru. Es werden Ergebnisse der fortlaufenden glaziologischen Untersuchungen auf der Quelccaya-Eiskappe, gelegen auf 13° 56' S. und 7 0 ° 50 ' W., in der Cordillera Oriental "on Stidperu mitgeteilt. Bohrkerne bis 15 m Tiefe wurden am Gipfel-Dom (5 650 m), am Mittel-Dom (5543 m) und am Slid-Dom (5 480 m) gewonnen und eingehend auf Mikropartikel, Sauerstoff-Isotope und Gesamt-,8-AktivitiH untersucht. Die Ergebnisse zeigen, dass eine interpretierbare Schichtung erhalten ist, obwohl der Scheitel dieser Eiskappe nur 300 m liber der jahrlichen Schneegrenze liegt und der Firn temperiert ist. Die deutliehe jahreszeitliehe EisStratigraphie rlihrt von der betrachtlichen jahreszeitlichen Schwankung des regionalen Niedersehlages her. Hoh� Konzentrationen von Mikropartikeln und ,8-radioaktivem Material treten in der Trockenzeit ( MaiAugust) auf. Die wahrend der Regenzeit abgelagerten Mikropartikel sind grosser als die der Trockenzeit. Auf der Quelccaya-Eiskappe kommen die hochsten negativen SIBO-Werte wahrend der warmeren Regenzeit vor (im Gegensatz zu Polargebieten). Der mittlere 0-Wert von - 2 I roo nahe der OberAache ist bemerkenswert niedrig flir diese Stelle in den Tropen, wo die gemcssene mittlere Jahrestemperatur -3°C betragt. Diejahreszeitliehen Schwankungen der Mikropartikel, der Gesamt-,8-Aktivitat und der Isotopenverhaltnisse eroffnen die Moglichkeit, den Ablauf des Klimas aus Bohrkernen dieser tropischen Eiskappe zu ermitteln.
INTRODUCTI ON
The Institute of Polar Studies in conjunction with the Peruvian Instituto de Geologia y Mineria has undertaken a multi-year glaciological investigation of the Quelccaya ice cap. The ice cap is unique in that it offers the opportunity to apply the ice-core climatic techniques to a low-latitude ice cap. The central objective of the glaciological program is the retrieval of a long ice core, from which a climatic history for tropical South America is to be reconstructed on the basis of microparticle arrd isotope analysis.
* Contribution No. 372 of the Institute of Polar Studies, Ohio State University, Columbus, Ohio 43210 , U.S.A.
69
JOUR NAL OF GLACIOLOGY
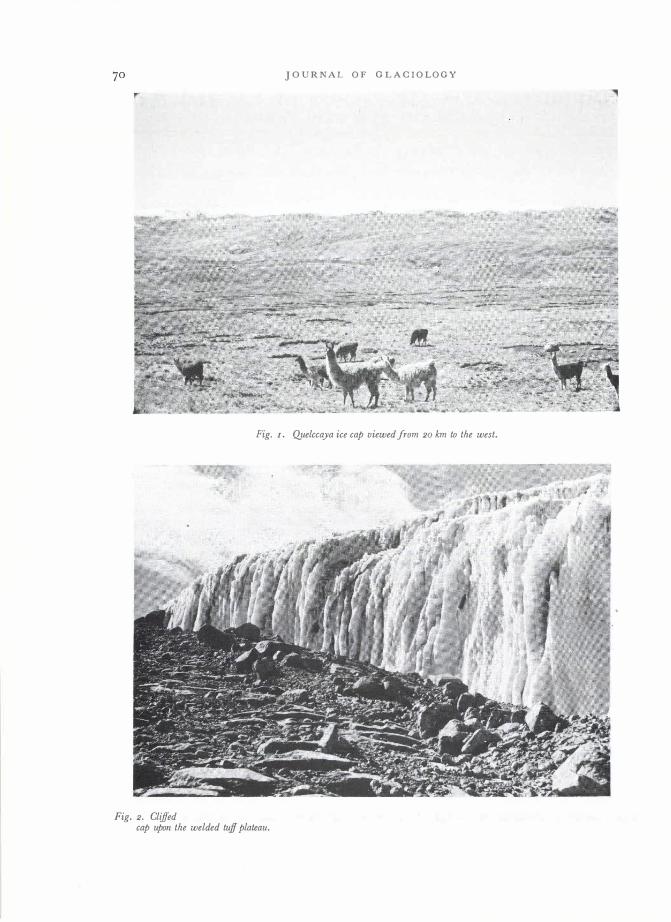
Fig. I. Quelccaya ice cap viewed from 20 km to the west.
Fig. 2. ClifJed ice edge near the southern end of the QJlelccaya ice cap. The clifJed ice e dge characterizes the margins of the ice cap upon the welded tuff plateau.

QU ELCCAYA ICE CA P
The ice cap covering an area of 55 km2 ranges 3-5 km in width (east to west), and up to 17 km in length (north to south), and is located in a remote area 60 km north-east of Sicuani. A seasonal road allows vehicular access to within 40 km. From this point it takes three days with pack animals to reach the western edge of Quelccaya which lies on top of a gently undulating plateau of welded tuff (Fig. 1) . Along much of the margin Quelccaya ends in spectacular vertical ice walls (Fig. 2) .
The first field season dates back to J une-July 1974. As the pilot expedition, its major objectives included exploration of access routes and logistics. During the first expedition a
C' ICE MARGIN 1000 o
o 100 200km I ! I
Quelccaya ___ ....,-.p .0 Ice Cap
1000 2000 melers
A ABLATION CORE
@ LAKE
CONTOUR INTERVAL- 100 METERS
<> WEATHER STATION
o SNOW PIT
o TRIANG ULATION STATION
A(X.Y.Z) ABLATION AND ACCUMULATION STAKES
Fig. 3: Map of the Quelccaya ice cap, showing: (a) location of snow-sample sites, (b) ablation and accumulation stakes, (c) weather-station sites, and (d) the triangulation survey points. Location of the meteorological stations quoted in the text are indicated in the insert map, ecatcca (C), Ollachea (0) , Nuiloa (N) and Sicuani.

JOU R N AL OF GLAC IOLOGY
snow pit was excavated on the summit dome to measure density and temperature and to obtain samples for microparticle and isotope analysis (Thompson and Dansgaard, 1975) .
Glaciological expeditions were undertaken during June and July (the dry season) in 1976, 1977, and 1978, each of which required 20 pack animals to transport food and equipment to the ice cap. During these expeditions the upper portion of the ice plateau was surveyed by theodolite along two representative routes. An existing map at a scale of 1 : 25 000 was completed by additional contouring for the enti re plateau (Fig. 3). The summit elevation was determined to be approximately 5 650 m by both tacheometry (5 645 m) and paired aneroid altimeter traverse (5 650 m) . Accumulation/ablation stakes were placed along two transects arranged perpendicularly across the ice cap. Automatic meteorological stations were installed on 3 m polycarbonate poles at the summit dome to record temperature, wind direction and speed, and sunshine duration (Fig. 4) ' In 1978 a snow-gage recorder was
I
Fig. 4. Automatic meteorological station installation at the summit of the Qyelccaya ice cap (5 650 m).
installed at the 5 400 m level of the west side of the ice cap. Hourly temperature records have been obtained at Quelccaya summit from July to December 1976, and from July 1977 to May 1978. Hourly wind-speed and -direction measurements have been obtained for the period of July 1977 to mid-February 1978. A second meteorological station was installed at the summit in 1978 to better insure a complete meteorological record for the 1978-79 period.
During each field season several snow pits were excavated at the summit dome and the previous year's snowfall was sampled in detail for microparticle, oxygen isotope, and total f3 activity. Firn samples were obtained using a SIPRE drill on the summit, middle, and south domes to a maximum depth of 16 m. The glaciological program has been complimented by a study of the glacial geology (Mercer and others, 1975; Mercer, 1977).
Observations during these expeditions place the annual snow line (firn line) at approximately 5250 m. No superimposed ice has been observed in the vicinity of the annual snow line. Small superglacial streamlets were observed for the first time in 1978, but only on a relatively small fiat area within 400 ill of the ice-cap margin near the camp site. The orienta-

QUELCCAYA ICE CA P 73
tion of the snow surface with respect to the tropical sun is an important factor affecting the ablation rate.
One visit was made to the ice cap during the rainy season in January of 1977 by the author and Marino Zamora. During the period, '25-30 January, snow fell daily from thunderstorms which formed by late morning and continued until dark. Due to the intense morning radiation, little snow accumulated on the bedrock adjacent to the ice cap, although fresh snow measured over 0.6 m at the ice rim on the glacier surface. The snow-rain limit was approximately 4 300 m, well below the ice margin, approximated by the 5 150 m contour. Field observations and the collected meteorological data reveal that the annual precipitation is totally deposited as snow on all parts of this tropical ice cap.
PERCOLATION
At the outset of the investigation, it was essential to ascertain whether percolation is sufficient to destroy any seasonal fluctuations in the microparticle, oxygen-isotope, and total,8-activity records. In order to establish this, heat and mass budget measurements were made at the summit of the ice cap (Hastenrath, 1978) . It was determined that the net all-wave radiation is zero for all practical purposes and within the accuracy of measurement. Accordingly there is essentially no energy available for evaporation and melting. This has been confirmed by lysimeter measurements and bulk-aerodynamic estimates. Conditions similar to those at the summit prevail for that part of the plateau above 5 400 m. Here ablation is essentially nil, and net balance approximately equals accumulation (Thompson and others, 1979)' However, since ice lenses have been observed in surface cores from the summit dome, melt water must form in response to conditions not observed during the field seasons and rapidly refreeze nearly in situ. The fact that the 0180 record is preserved at the summit of the Quelccaya ice cap proves that the stratigraphic record is preserved. However, it is impossible to know that these same conditions have prevailed for the last 100 years.
TEMPERA TURES AND DENSI TY
Bore-hole temperature measurements on the summit of Quelccaya indicate that the ice cap is temperate (i.e. temperatures below 10 m depth are o°C, Fig. 5) . Therefore it must be a combination of temperature, cloud cover, large net balances, and slow air which accounts for the preservation of seasonal stratigraphic fluctuations. The temperature record at the summit of Quelccaya from July to December 1976 has been evaluated by one-hour periods. Figure 6 shows a time-series plot of daily values, including '24 h mean and extrema. These data, as well as the 1977-78 temperature data, illustrate that mean annual air temperature remains several degrees below o°C. The difference between the screen temperature and the 10 m snow temperatures may be partly due to the dependence of the la m temperature upon the temperature of the snow surface itself (Loewe, 1970) rather than upon the temperature at screen level. The percolation of water could also create this temperature difference as indicated by L1iboutry and others ( 1976) . This problem will be investigated further during future field seasons.
The density profile (Fig. 7) established for the summit dome corresponds to that expected from a temperate ice cap (Benson, 196'2; L1iboutry, 1964-65, Tom. I, p. '215; Vallon and others, 1976) . For example, the density at the summit of Quelccaya, which measures 640 kg m-J at a depth of la m, is intermediate between those measured at Jungfraujoch (Alps, 3 600 m) , where densities measure 6'25 kg m-3 at la m, and Seward Glacier (Alaska, I 790 m) where densities measure 730 kg m-J at 10 m (Lliboutry, 1964-65, Tom. I, p. '215). At 3 550 m on Mont Blanc the density is 400 kg m-3 at the surface, but 700 kg m-3 is reached at '20-30 m deep (Vallon and others, 1976) instead of 10 m. This is important because it has been proved that soaking by water accelerates firnification, yet as noted earlier, percolation

74
.£ 8
..c:: a. Q) o
10
12
13
14
15
16
JOURNAL OF GLAC IOLOGY
Temperature QC -9 -8 -7 -6 -5 -4 -3 -2 -I
... - 1974 Snow pit temperature profile
x - 1976 Snow pit and borehole
temperature profile
• - 1977 Snow pit temperature profile
• - 1978 Snow pit temperature profile
Calm day
Stormy day-o
o 2
Fig. 5. Firn temperature profiles from the summit dome of the Quelccaya ice cap. These data illustrate the large year-to-year variation in near-suiface firn temperatures. The bore-hole profi!e shows a temperature of o.ooe at 15 m depth.
-14�1�6'OOh.�2i.5�3�'-�'"���U--'�10�15�2�0���30�'5��IO�15�2CO�2�5�3�-r5�10�lc5-2�0�25�30rr-r-�10�-�
July Aug. Sepl. Qct. Nov. Dec.
Fig. 6. Daily temperature values at Quelccaya summit, 5 650 m, during July-December 1976. A. Temperature maximum-24 h largest one-hour averages; B. 24 h temperature mean; and C. temperature minimum-24 h lowest one-hour average. Horizontal broken lines indicate monthly mean over the Pacific coast, as calculated from radio-soundings at Lima and Antofagasta by interpolation for 5 650 m and lat. 140 S.

c 5
9
10
"
QUELCCAYA ICE CAP
Density (Kg. m�3) 200 300 400 500 600 700
.
. .
BOO
Fig. 7. Snow densities JOT the summit dome oJ the Quelccaya ice cap.
75
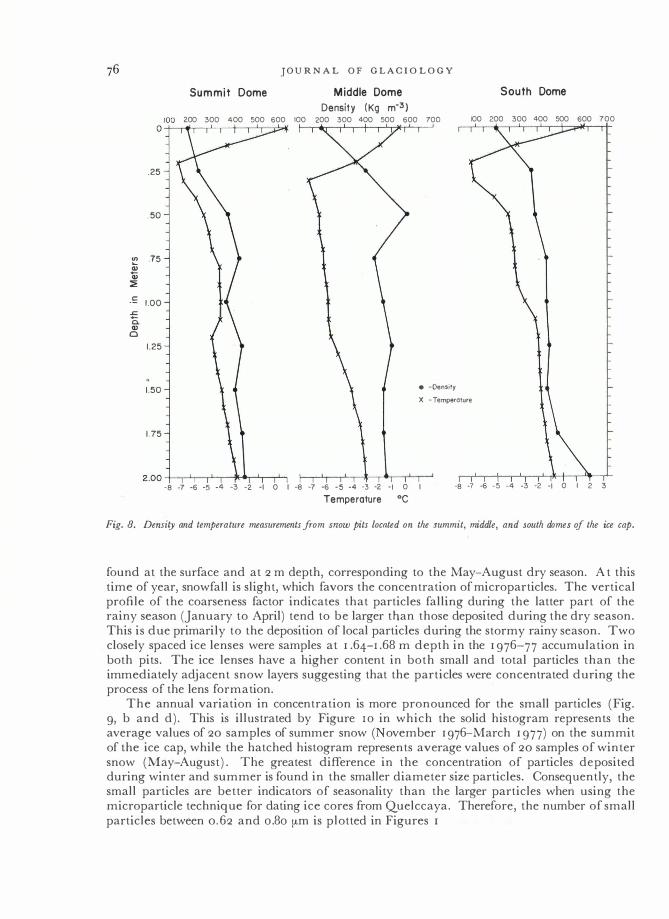
does not appear to be a major factor at the summit of Quelccaya. Percolation may be a greater factor at the middle and south domes and probably accounts for the higher densities for these lower-elevation sites (Fig. 8) .
SNOW-SAMPLE COLLECTION AND PREPARAT ION
During the 1976 field season, three snow pits were excavated on the summit, middle, and south domes of the Quelccaya ice cap. In each pit measurements of temperature and density were made. The walls of each snow pit were sampled at 5 cm intervals for microparticle, oxygen-isotope, and f3 analysis. Fifteen meters of firn from the summit and middle dome and sixteen meters of firn from the south dome were obtained by drilling in the excavated pits with a "Teflon"-coated SIPRE drill. Two parallel (0.30 m separation) cores were drilled from the bottom of each snow pit. One of these was analyzed for microparticles while the other was analyzed for oxygen isotope and total f3 activity. The collected samples were placed in pre-cleaned air-tight plastic bags, allowed to melt and transferred to 4 oz-pre-cleaned polyethylene bottles which were sealed with wax and shipped to the microparticle laboratory at Ohio State University and the Geophysical Isotope Laboratory in Denmark.
The examination of microparticles in these melted samples was conducted in a class IOO
Clean Room which is used solely for measuring microparticle variations in snow and ice cores. The microparticle population in each sample is presented as the number of particles in fifteen intervally scaled channels representing particle diameters between 0.5 and 16.0 flm. A total of I 263 samples from Quelccaya snow pits and ice cores have been processed for microparticle, oxygen isotope, and f3 activity.
MICRO PARTICLES
Figure 9 illustrates the microparticle profile in the two pits at the summit dome representing the 1976-77 accumulation season. In both pits large particle concentrations are
.25
.50
Cl)
:;; .75
Q; ::i; .£ 1.00 ..r::::
0. Q)
0 1.25
1.50
1.75
Summit Dome
JOUR N AL OF GLAC IOLOGY
Middle Dome Density (Kg m-3)
200 300 400 500 600 100 200 300 400 500 600 700
South Dome
100 200 300 400 500 600 700
• -Density
X -Temperature
-8 -7 -6 -5 -4 -3 -2 -I 0 I -8 -7 -6 -5 -4 -3 -2 -I 0 I -8 -7 -6 -5 -4 -3 -2 -I 0 I 2 3
Temperature °C
Fig. 8. Density and temperature measurements from snow pits located on the summit, middle, and south domes of the ice cap.
found at the surface and at 2 m depth, corresponding to the May-August dry season. At this time of year, snowfall is slight, which favors the concentration of microparticles. The vertical profile of the coarseness factor indicates that particles falling during the latter part of the rainy season (January to April) tend to be larger than those deposited during the dry season. This is due primarily to the deposition of local particles during the stormy rainy season. Two closely spaced ice lenses were samples at 1.64-1.68 m depth in the 1976-77 accumulation in both pits. The ice lenses have a higher content in both small and total particles than the immediately adjacent snow layers suggesting that the particles were concentrated during the process of the lens formation.
The annual variation in concentration is more pronounced for the small particles (Fig. 9, b and d). This is illustrated by Figure 10 in which the solid histogram represents the average values of 20 samples of summer snow ( ovember 1976-March 1977) on the summit of the ice cap, while the hatched histogram represents average values of 20 samples of winter snow (May-August) . The greatest difference in the concentration of particles deposited during winter and summer is found in the smaller diameter size particles. Consequently, the small particles are better indicators of seasonality than the larger particles when using the microparticle technique for dating ice cores from Quelccaya. Therefore, the number of small particles between 0.62 and 0.80 [Lm is plotted in Figures I I, 12, and 13.

QUELCCAYA ICE CAP
Totol Number of Portlcles per 500 ),11. Samplu
24� X I03Jo
;:: Ice Lenses
(a)
Measured
AccumulallOfl
0.0 al) 1.0 co ... ltso.us r"CIOl'l llI'O',
Total Number of Particles per 500 J,l1. Samples
( x 103)
(e)
Measuled
Accumulation
do O!l 10 COAASl.NUS FAC'OfI 1.102,
Number of Small Porticl .. B.t ••• n 0.63-0.80J,lm. In Diameter per 500 J,I\. Somple
Is!,X 103�
Measured
Accumulation
i Ice Lenses
(b)
Number of Small Particles Between 0.63- O.BOJ,lm. in Diameter per 500j,J1. Sample
o I!X I03 �
"����
,,, Lenses
Meosured
AccumulollOn
--L-_________ � (d)
77
Fig. 9. Vertical distribution oJ microparticle concmtration in two snow Pits (4a, b and 4C, d) dug at the summit dome in 1977. (a) and (c) represent variations of total particle concentration, while (b) and (d) show variations in small particles Jrom 0.63 to 0.80 j.Lm in diameter.
No. p(lrticies (1.0 J-Lm .;;; d.;;; 13.0 J-LIII) Per cenl coarseness Jaclor = No
. I ( d ) X 100. o. parllc es 0.5 J-Lm';;; .;;; 13.0 J-Lm
Figure I I illustrates seven years of balance, with major ice lenses and peaks in particle concentration characterizing the dry season. It is during the dry period (May-August) that the major peaks form in the particle record although minor ice lenses and particle peaks occur at other instances during the year. Samples are closely spaced at the top representing those samples collected along the wall of the snow pits, while the larger samples were cut from the SIPRE ice cores. The ice-core stratigraphy is illustrated on the right margin of each of these figures.
TOTAL f3 ACTIVITY AND 8180 The f3-activity and oxygen-isotope results for these same sites are presented in Figure 14.
The total-f3-activity and oxygen-isotope measurements indicate a seasonal variation on the summit dome. Although both the middle and south domes may experience substantial percolation, the f3 radioactive material in these cores occurs in distinct layers over most of the record (Fig. 14). Based on the present data, it cannot be determined whether these layers represent the original stratigraphic layers or represent reconcentration due to redistribution of radioactive material by percolation. However, the total-f3-activity peaks are large in the 1974 layer in all three profiles as is the 1970 f3-activity peak although in the summit dome the latter peak occurs as two immediately adjacent peaks. Further, the largest single �-activity peak from any of these sites is the 1965 peak from the south dome which may reflect the increased activity due to the 1963-64 �-activity maximum resulting from the Russian thermo-nuclear atmospheric test of 1962-63. The microparticle and total-�-activity peaks are correlated at all three sites. Thus, at this time it cannot be ruled out that the stratigraphic parameters at

JOU RNAL OF GLACIOLO GY
10'
10'
102
10
o
.5
I I L_
I I I I L_.
I I I I I L_
I I I I
Particle Size In micron diameter L09 Scole
10
Fig. IO. Particle population distributions. The solid histogram represents the average values of 20 samples representing snow deposited during the summer (October-April) I976-77 on the summit of the ice cap. The hatched histogram represents average values of 20 samples representing snow deposited during the winter (May-August) on the summit of the ice cap. The greatest difference in numbers of particles deposited during winter and summer occurs in the smaller diameter particles.
the middle and south sites reflect annual depositional features. The microparticle and total-,Bactivity variations at these sites will be investigated in detail during the ice-coring program in 1979·
The oxygen-isotope variation (Fig. 14) shows a seasonal variation throughout the length of the summit dome record. However, the range of oxygen-isotope values from summer to winter does decrease with depth. For both the middle and south domes the seasonal oxygenisotope variations are smoothed out by a depth of 6 m. On the Quelccaya ice cap the least and most negative values of 0 seem to occur respectively, in dry (cold) and wet (warm) season and summer snow (i.e. surface sriow collected in] une and July always yields the least negative 0180 values) . Although not the only exception (Dansgaard, 1964), this is opposite to normal seasonal variations. Further, the profiles show a range in surface 15 values of 22%0' one of the largest ranges measured to date. The near-surface mean 0 value of -21 %0 is remarkably low for this tropical site where the measured mean annual air temperature is a few degrees below o°C. The low mean values and large seasonal ranges of 15180 values indicate that temperature is not the main factor controlling the 15 values. The low 15180 content during the rainy season may be explained by the distance from the moisture source area. The Quelccaya ice cap is located 3 000 km from the Atlantic Ocean and 400 km from the Pacific

u> " � co
-'" � '"
14
QUELCCAYA ICE CAP
Particles (1lI03) 250 300 350
1975
1974
1973
1972
1971
1970
1969
79
Fig. I I. Variations in concentration of microparticles with diameters between 0.62 and 0.80 J-Lm per 500 /Ll of sample in 15 m of firn samples from summit dome. Solid peaks indicate high microparticie concentrations corresponding to the annual dry season. The solid line connecting individual samples in the particle histogram represents the two-sample running mean. The ice-core stratigraphy is illustrated on the right, where solid and dashed lines represent ice lenses and oblique lines indicate visually dirtier layers.
Ocean. Most of the moisture during the rainy season comes from the Atlantic Ocean having been recycled many times through tropical thunderstorms in crossing the Amazon basin. It is known for example, that in middle latitudes the warm air fronts produce precipitation depleted in 1)180 because precipitation from these air masses has occurred over a long period of time.
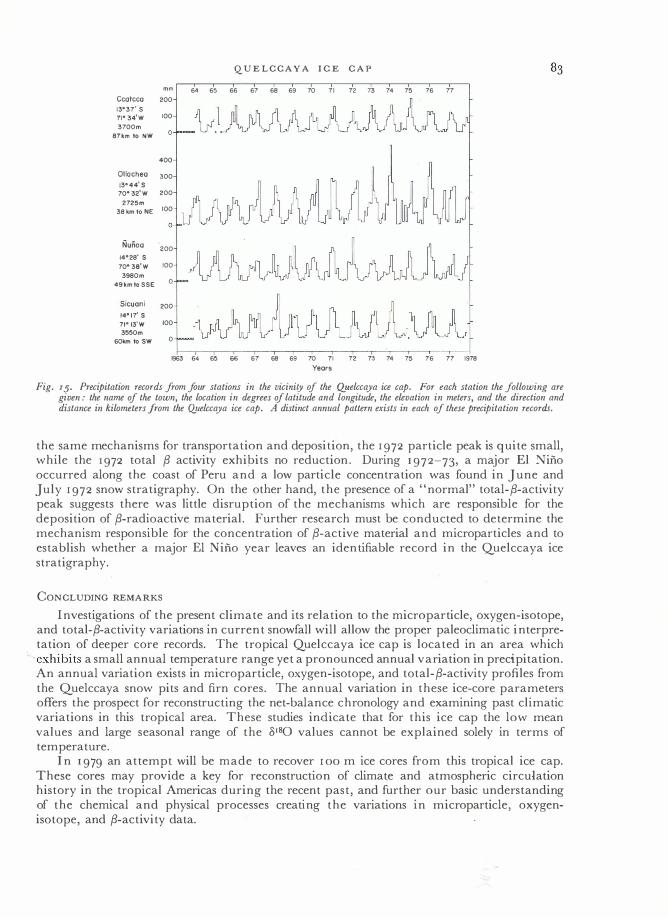
In Figure 15 the annual variation in precipitation from rain-gage stations located at various distances and directions away from the Quelccaya ice cap are presented (locations given on map, Fig. 3) . The data from each station reveal the marked seasonal variation in precipitation. Snow samples from the dry season (May-August) yield the largest concentrations of microparticles and radioactive material as well as the least negative 1)180 values. There is a tendency for a minor particle peak and a less negative 1)180 peak to occur during the rainy season (periods of less particle concentration, low f3 activity, and more negative 1)180) . One mechanism contributing to these peaks may be a slight bimodal pattern of regional precipitation during the rainy season as illustrated in Figure 15.

80
.
JOURNAL OF GLACIOLOGY
Particles (xI03) 50 o 100 150 200 250 300 350 0 �������������==����IIS97n6;-1I--l �
'� 1975
1974
1973? ;;7 ;:;;;;:;; "
/972?
1971?
= -1970?
10
� 1969?
12 196B? � �
13 � 1967? � � -
> 1966? �
� 1411�� 15
Fig. 12. Variations in concentration of microparticles between 0.62 and 0.80 /J-m per 500 /J-l of sample in 15 m of firn samples from the middle dome. The solid line connecting individual samples in the particle histogram represents the two-sample running mean. The ice-core stratigraplry is illustrated on the right, where solid and dashed lines represent ice lenses and oblique lines indicate visual(y dirtier layers.
NET BALANCE
The snow accumulation data for the summit dome based on the microparticle, fi-activity, and oxygen-isotope data are presented in Table 1. The net balance in water equivalent from
TABLE I. BALANCE MEASUREMENTS, SUMMIT DOME, QUELCCAYA
Water Snow equivalent accumulation
m m
1978-77 1.35 2.8 1977-76 0.88 2. 0 1976-75 " 1.03 2.8 1975-74 1. 08 2·4 1974-73 1.32 2-4 1973-72 1. 28 2.1 1972-71 1.14 1.7 1971-70 1. 24 1.7 1970-69 1.18 1.3
Average I.I7 2.1

Q.UELCCAYA ICE CAP 81 ParTicles (lI.JQ3)
1974
1973
1972 .5 8
1971
1970
1969
"� 1 4J1ii; 1968
1967
Fig. 13. Variations in concentration of microparticles between 0.62 and 0.80 I-'m per 500 I-'l of sample in 16 m of firn samples from the south dome. The solid line connecting individual samples in the particle histogram represents the two-sample running mean. The ice-core stratigraphy is illustraied on the tight, where solid and dashed lines represent ice lenses and oblique lines indicate visually dirtier layers.
1969 to 1978 for the summit dome (Table I) was calculated using the measured density profile from Figure 7. As demonstrated by Thompson and others ( 1979) the year-to-year variations in annual net accumulation as calculated from these measured ice-core parameters for the summit dome parallels the year-ta-year variation in hydro-meteorological conditions in neighboring regions of the Andes.
FUTURE WORK
The best stratigraphic records from the three test sites are those from the summit and south domes, which have been chosen for 100 m drilling in 1979. The apparent difficulties in interpreting the oxygen-isotope" variations in terms of temperature are not expected to present a severe problem for a subsequent ice-core interpretation, because, like many tropical areas, the most important paleoclimatic parameter may well be precipitation and not temperature. The summit-dome microparticle, oxygen-isotope, and total-,B-activity data indicate that there is an excellent stratigraphic record and hence the net-balance chronology should be preserved in the Quelccaya snow stratigraphy.

Summit Dome Omeon--19.40%.
JOURNAL OF GLAC10LOGY
Ouelccaya Oxygen Isotope and Beta Activity
Middle Dome Omlono-19.18%.
8 8 II 8 -20 � -10","
South Dome Bm,an. -18.91%.
.. _----.... --+-. ,96�
Fig. I4. The shaded hjstogram illustrates variations in f3 activity measured in dphfkg while the non-shaded histogram illustrates variations in oxygen isotopes measured in parts per mil in firn cores from the summit dome, middle dome, and south dome. The dashed lines indicate the tendancy for the 0.80 values to become less negative with depth.
First, the current variations. in the microparticle, oxygen isotope, and total (3 activity must be correlated with the current weather conditions as obtained from weather stations if accurate climatic interpretations are to be made from the ice cores obtained from this ice cap. Secondly, the occurrence of the annual total-(3-activity peaks needs further investigation. It is likely that the annual nature of the total-(3-activity variation on Quelccaya ice cap is related to its seasonal position in the decending arm of the Southern Hemisphere Hadley cell. The literature indicates that there is an exchange of tropospheric and stratospheric air at the top of the Hadley cell (Telegadas, 1971; Reiter, 1 977) providing a mechanism for radioactive stratospheric material to enter the troposphere and subsequently to be deposited on Quelccaya.
Thirdly, the relationship between microparticle peaks and total-f3-activity peaks must be understood. Although initially the f3 activity and microparticles appear to be dependent upon
Ccotcco 200
13·37' S
71° 34'W 100
3700m
87km to NW
Ollocheo 13·44'5
70032'W
2725m
o
400
300
200
38 km to NE 100
Nunoo 14°28' 5
70'3S'W
3980m
49km to SSE
Sicuani 14·17' 5
71°13'W 3!5!50m
60km to SW
200
100
o
200
100
o
QUELCCAYA ICE CAP
64 65 66 67 68 69 70 71 72 73 74 75 76 77
1963 64 65 66 67 68 69 70 71 72 73 74 75 76 77 1978
Years
Fig. I5. Precipitation records from four stations in the vicillity of the Quelccaya ice cap. For each station the following are given: the name of the town, the location in degrees of latitude and longitude, the elevation in meters, and the direction and distance in kilometers from the Q.uelccaya ice cap. A distinct annual pattern exists in each of these precipitation records.
the same mechanisms for transportation and deposition, the 1972 particle peak is quite small, while the 1972 total (3 activity exhibits no reduction. During 1972-73, a major El Nino occurred along the coast of Peru and a low particle concentration was found in June and ] uly 1972 snow stratigraphy. On the other hand, the presence of a "normal" total-(3-activity peak suggests there was little disruption of the mechanisms which are responsible for the deposition of (3-radioactive material. Further research must be conducted to determine the mechanism responsible for the concentration of (3-active material and microparticles and to establish whether a major El Nino year leaves an identifiable record in the Quelccaya ice stratigraphy.
CONCLUDING REMAR KS
Investigations of the present climate and its relation to the microparticle, oxygen-isotope, and total-(3-activity variations in current snowfall will allow the proper paleoclimatic interpretation of deeper core records. The tropical Quelccaya ice cap is located in an area which
"exhibits a small annual temperature range yet a pronounced annual variation in precipitation. An annual variation exists in microparticle, oxygen-isotope, and total-(3-activity profiles from the Quelccaya snow pits and firn cores. The annual variation in these ice-core parameters offers the prospect for reconstructing the net-balance chronology and examining past climatic variations in this tropical area. These studies indicate that for this ice cap the low mean values and large seasonal range of the 0180 values cannot be explained solely in terms of temperature.
In 1979 an attempt will be made to recover 100 m ice cores from this tropical ice cap. These cores may provide a key for reconstruction of climate and atmospheric circulation history in the tropical Americas during the recent past, and further our basic understanding of the chemical and physical processes creating the variations in microparticle, oxygenisotope, and (3-activity data.
JOU R NAL OF G L AC IOLO GY
ACKNOWLEDGEM ENTS
This research was supported by research grants from the Division of Climate Dynamics (ATM 75-15513Ao2) and the Division of Polar Programs (National Science Foundation Grant GV-4I41 I) as well as assistance from the Division of International Programs of the National Science Foundation. Participants in some or all of the expeditions were A. Ames, D. Corzino, D. de Gruyter, T. Goldthwait, T. Guio, S. Hastenrath, J. Ricker, J. Mercer, C. Marangunic, L. Thompson, A. Valverde, and M. Zamora. The author thanks Dr Hem:ik Clausen for his sample analysis and data reduction of the oxygen-isotope and �-activity data. This research is being carried out under a formalized agreement between the Institute of Polar Studies of Ohio State University and the Peruvian Instituto de Geologia y Mineria.
MS. received 13 November 1978 and in revisedform 5 February 1979
R EFER ENC E S
Benson, C . S. 1962. Strati graphic studies in the snow and firn of the Greenland ice sheet. U.S. Snow, Ice and Permafrost Research Establishment. Research Report 70.
Dansgaard, W. 1964. Stable isotopes in precipitation. Tellus, Vol. 16, No. 4, p. 436-68. Hastenrath, S. 1978. Heat-budget measurements on the Quelccaya ice cap, Peruvian Andes. Journal qfGlaciology,
Vol. 2 0, No. 82, p. 85-97. Lliboutry, L. A. 1964-65. Traite de glaciologie. Paris, Masson et Cie. Lliboutry, L. A., and others. 1976. 15 m deep temperatures in the glaciers of Mont Blanc (French Alps), by L. [A.]
Lliboutry, M. Briat, M. Creseveur, and M. Pourchet. Journal rifGlaciology, Vol. 16, No. 74, p. 197-2 03. Loewe, F. 1970. Screen temperatures and 1 0 m temperatures. Journal of Glaciol0irY, Vol. 9, No. 56, p. 2 63-68. Mercer, J. H. 1977. Radiocarbon dating of the last glaciation in Peru. Geology, Vol. 5, No. 10, p. 6 00- 04. Mercer, J. H., and others. 1975. Peru's Quelccaya ice cap: glaciological and glacial geological studies 1974, [by]
J. H. Mercer and L. G. Thompson, C. Marangunic, J. Ricker. Antarctic Journal of the United States, Vol. 10, No. I, p. 19-24.
Reiter, E. R. 1977. The transport of tracers by global circulation systems of the atmosphere. [Union Gcodesique et Gcophysique Internationale. Association Internationale des Sciences Hydrologiques. Commission des Neiges et Glace!.] Symposium. Isotopes et impuretcs dans les neiges et glaces. Actes du coUoque de Grenoble, aout/septembre 1975, p. 53-62. (IAHS-AISH Publication No. 118.)
Telegadas, K. 1971. The upper portion of the Hadley cell circulation as deduced from the 1968 French and Chinese nuclear tests. Journal of Geophysical Research, Vol. 76, No. 21, p. 5018-24.
Thompson, L. G., and Dansgaard, W. 1975. Oxygen isotope and microparticle studies of snow samples from Quelccaya ice cap, Peru. Antarctic Journal of the United States, Vol. 10, No. I, p. 24-26.
Thompson, L. G., and others. 1979. Climatic ice core r.ecords from the tropical Quelccaya ice cap, by L. G. Thompson, S. Hastenrath, and B. Morales. Science, Vol. 2 03, No. 4386, p. 124 0-43.
Vallon, M., and others. 1976. Study of an ice core to the bedrock in the accumulation zone of an Alpine glacier, by M. Vallon, J.-R. Petit, and B. Fabre. Journal rifGlaciology, Vol. 17, No. 75, p. 13-28.