Embed Size (px)
Citation preview

FFh= d (Q_ d -edMPmmT!p �
From Vital and Health Statistics of the National Center for Health Statistics Number 80. July 22, 1982
Medication Therapy in Office Visits for Hypertension: National Ambulatory Medical Care Survey, 1980
by Beulah K. Cypress, Ph. D., Division of Health Care Statistics
According to data collected by the National Center for Health Statistics by means of the National Ambulatory Medical Care Survey, patients with essential hypertension made an estimated 25.1 million visits to office-based physicians in 1980. During these visits there were about 46.5 million mentions of drugs, either new or continued, for an average of 1.85 drug mentions per visit.
The National Ambulatory Medical Care Survey (NAMCS) is a probability sample survey conducted annually by the Division of Health Care Statistics of the National Center for Health Statistics. The technical notes at the end of this report provide brief in-formation about the source of the data, sampling errors, and definitions of terms. A complete description of the survey including limitations and definitions was published in Vital and Health Statistics, Series 13, No. 44.1
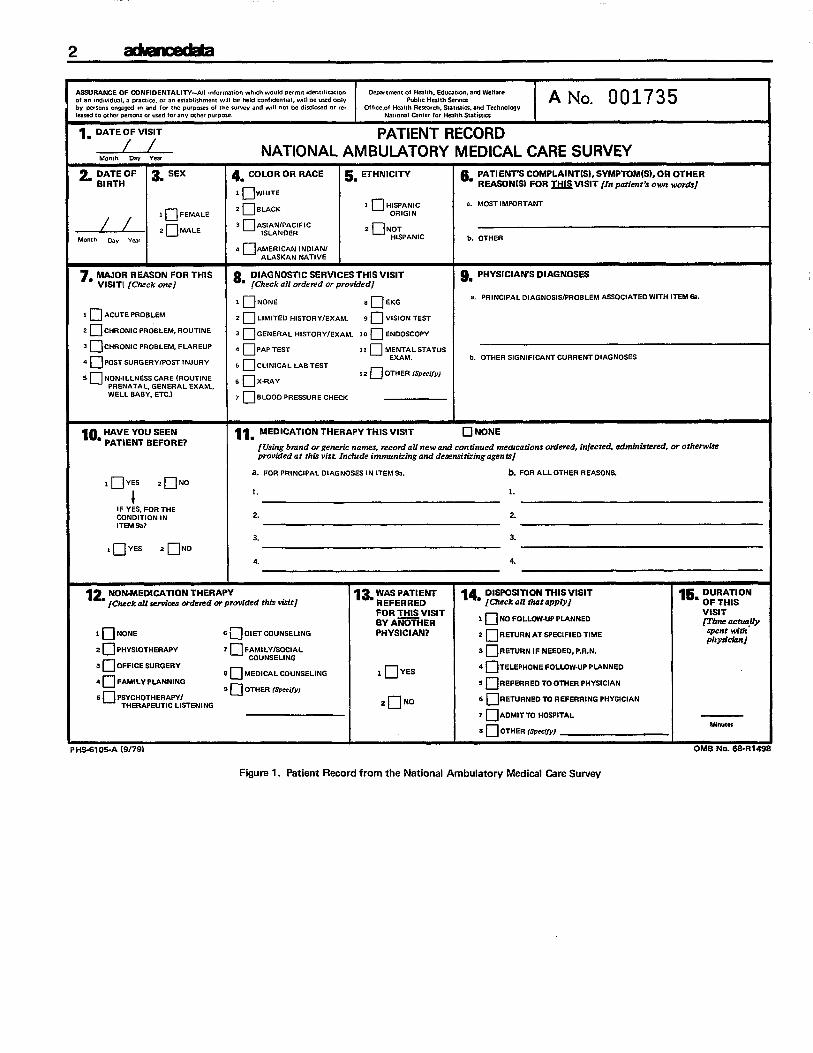
Until 1980, an item on the Patient Record form (figure 1) indicating whether or not medication therapy was offered by the physician was the only available information from NAMCS regarding drug utilization by office-based physicians. In 1980, the item was expanded to include the reporting of specific drugs, prescription or nonprescription, ordered or provided by any route of administration during. the visit (see figure 1, item 11). The methodology used to collect and process this drug information is described in Vital and Health Statistics, Series 2, No. 90.2
Data on drugs utilized during visits with essential hypertension as the principal (first-listed) diagnosis
1NationaI Center for Health Statistics, T. Ezzati rmd T. McLemore: The National Ambulatory Medical Care Survey, 1977 Summary, United States, January-December 1977. Vital and Health Statistics. Series 13-No. 44. DHEW Pub. No. (PHS) 80-1795. Public Health Service. Washington. U.S. Government Printing Office, Apr. 1980. 2Nationrd Center for Health Statistics, H. Koch: The collection and processing of drug information, National Ambulatory Medical Care Survey, United States, 1980. Vital and Health Statistics. Seiies 2-No. 90. DHHS Pub. No. (PHS) 82-1364. Public Health Service. Washington. U.S. Government Printing Office. In press.
are presented in this report. In order to report accurately what the physician prescribed, drug mentions used in this report are based on the physicians’ entries on the Patient Record forms. These entries may be brand or generic names of prescription or over-the-
mentions”counter drugs. “Drug includes all drugs listed in item 11, parts a and b. Part b, it should be noted, may relate to diagnoses other than hypertension. Therefore, it is assumed that medications described in this report were ordered for patients with hypertension but may not necessarily be therapeutic agents for that condition.
Medication therapy status and number of medications
During 1980, hypertension was the leading illness–related principal diagnosis and accounted for 9 percent of all visits. In about 89 percent of these visits patients were provided medication therapy (table 1). This proportion exceeded the average pro-portion of drug visits for all diagnoses (63 percent). Table 1 shows that a hypertension visit with one drug ordered or provided was the most likely event (36 percent), and proportions of visits decreased as the number of drugs increased. This paralleled the average prescription pattern shown in figure 2, except that proportions of visits for hypertension were higher in every category greater than zero.
Drug mentions r
Table 2 shows the number of visits for hypertension by sex, age, and race of the patient, and by problem status and major reason for the visit. The number and percent of visits in which one or more drugs were mentioned are shown. These two sets of visit frequencies provide the denominators for the drug mention rates (DMR) and the drug intensity rates (DIR). The numerator for both rates is the number of all-listed
U.S. DEPARTMENT OF HEALTH AND HUMAN SERVICES, Public Health Service, Office of Health Research, Statistics, and Technology
-----
2
ASSURANCE OF CONFIDENTALlm-AN mf.rmatmn whch w.uld !xrrml adenlffmx,m De$amnem of Hcahh. Ed.c.ttw.. and welfare ..1 m mdnvadual. pracwe, m . . e$tabt,$hmmtw,ll be held ,mnf,dent,.1,wdl be w$d O.IY Pub!,cHealthServIm A No. 001735
b“ Pwmm CIV+WKI,. and for Ihe p.rpo$m .zJthe SUrvwand WIN..1 be d,$closed.r [e. Of f,ce.of Hfal,h Rese.,ch. Sf.,,,,,cs, and Technc,lcqYIk.$edto ollmr permm m usedf.. ..v OtherDurp.Se Namnd Omwr 10, HealthStatima
1. DATE OF VISIT PATlENT RECORD * NATIONAL AMBULATORY MEDICAL CARE SURVEY
2, :::HOF 3mSEX & COLOR OR RACE 5. ETHNICITY & PATIENT’SCOMPLAINT(S).SYMPTOM(S),OR OTHER
I � WHITE REASON(S)FOR ~VISIT [In patient’s own words]
2 � BLACK 1 Q HISPANIC a. MOST IMPORTANT
__.zl_ :::Z 3 �A::!3$FIC
2 � NOT
Month Day Year HISPANIC b. OTHER
ORIGIN
4 HAMERICANINOIAN/ ALASKAN NATIVE
7. MAJORREASONFOR THIS 8 DIAGNOSTICSERVICESTHISVISIT & PHYSICIAN’SDIAGNOSES VISITI [Check one] ‘ [Check all ordered or prov6ded]
1 � NONE 8 DEKG a PRINCIPAL OIAGNOSIS/PROBLEM ASSOCIATED WITH ITEM Sa.
1 � ACUTE PROBLEM 2 � LIMITEtJ HISTORY/EXAM. 9 QvIsIor4TEsT
2 � C14RONIC PROBLEM, ROUTINE 3 � GENERAL HLSTORY/EXAM. ,0 OENOOSCOPY
3 � ckIRON,cpROBLEM. FLAREUp ~ � pAp,EsT 11 � MENTAL STATUS
4 � pOsTS.RGERY/POm,WURY 5 � CL!NICALUBTEST EXAM. b. OTHER SIGNIFICANT CURRENT OIAGNOSES
,2 (_JOTHER(SPeC,jY) * � NoN.1 LLNESS CARE (ROLIT, NE 6 � X-F6AY
PRENATAL. GENERAL EXAM., WELL BABY, ETC.) 7 � BLOOO PRESSURE CHECK
10. &~B:::;E7 llm MEDICATIONTHERAPY THISVISIT � NONE
[Using brand or generic names, record all new and continued mearcations ordered, injected, adtrdiistered, or otherwife provided at this vist. Include immunizing and desensitizing agents]
a. FOR PRINCIPAL DIAGNOSES IN ITEM 93. b. FOR ALL OTHER REASONS.
,DYES 2DN0
1. L
1 IF YES, FOR THE CONOITION IN 2. 2.
ITEM E%?
3. 3.
, � YES 2 � NO
4. 4.
12. NON-MEDICATIONTHERAPY 13. WASPATlENT 14m:$K#lll$ttl’K#SIT l& D#RV#ON [Chsck all servises o?de?ed or provided this visit] REFERREO
VISITFOR THISVISIT 1 � NO FOLLCW-UP PLANNEO [Time asssquyBY A=HER
1 � NoNE 6~OlETCOUNSELlNG PHYSICIAN? 2DR~RNATSPEC[FlEOTlME3pent m“th physician]
2DPHYS!OTHERAPY 7 � FAMILy/sOclAL 3 � RETURN IF NEEDE13, P.R.N. COUNSELING
3 � OFFICE SURGERY 8 n MEOICAL COUNSELING I � YES
4 � Telephone FottJ3w-up pLANNEo
4 � FAMILY PLANNING 9DOTHER (SP&-i,,, 5 � REFERREo To OTHER PHYSICIAN
5 � PSYCHOTHERAPY/ TOREFERRING PHYSICIANTHERAPEUTIC LISTENING ,nNO 6 �RETURNED7 lJAOMITTO HOSPITAL
F4n.m 8 � OTHER (Spec(/y)
“e-e. “c- a /a J-Jo} nssm w. U%nl.lal “- . . . . .“-” , “-- ,.?, ? .7, ..-.
Figure 1. Patient Record from the National Ambulatory Medical Care Survey

ad-ceda3
Table 1. Number and percent distribution of office visits for essential hypertension, by medication therapy status and number of medications: United States, 1980
Medication therapy status and number of medications
Total . . . . . . . . . . . . . . . . . . . . . . . . . . . . . . . . . . . . . . . . . . . . . . . . . . . . . . . . . . . . . . . .
Medication therapy status
With medication . . . . . . . . . . . . . . . . . . . . . . . . . . . . . . . . . . . . . . . . . . . . . . . . . . . . . . . . . Withoutmedication . . . . . . . . . . . . . . . . . . . . . . . . . . . . . . . . . . . . . . . . . . . . . . . . . . . . . . .
Numberofmedications
None . . . . . . . . . . . . . . . . . . . . . . . . . . . . . . . . . . . . . . . . . . . . . . . . . . . . . . . . . . . . . . . . 1 . . . . . . . . . . . . . . . . . . . . . . . . . . . . . . . . . . . . . . . . . . . . . . . . . . . . . . . . . . . . . . . . . . . 2 . . . . . . . . . . . . . . . . . . . . . . . . . . . . . . . . . . . . . . . . . . . . . . . . . . . . . . . . . . . . . . . . . . . 3 . . . . . . . . . . . . . . . . . . . . . . . . . . . . . . . . . . . . . . . . . . . . . . . . . . . . . . . . . . . . . . . . . . . 4 . . . . . . . . . . . . . . . . . . . . . . . . . . . . . . . . . . . . . . . . . . . . . . . . . . . . . . . . . . . . . . . . . . . 5ormore . . . . . . . . . . . . . . . . . . . . . . . . . . . . . . . . . . . . . . . . . . . . . . . . . . . . . . . . . . . . .
40
36.9 35.5
30 27.4
20
14.2
10
0
Number of Percent visitsin
distribution thousands
25.137 100.0
22,282 88.6 2,855 11.4
2,855 11.4 8,932 35.5 6,884 27.4 3,661 14.2 2,040 8.1
856 3.4
Essential hypertension
AH diagnosesm
None 1 2 3 4 5 6 7or8
Number of medications
Figure2. Percent ofo~cevisi* foressential hype~ension and foralIdiagnoses bynumber ofmeti*ions: Unitad States, 1980
4
Table2. Number of office visits foressential hypertension, number andpercent ofdrugvisits, andnumkr ofall-listed drug mentions, drug mention
rate, and drug intensity rate, by selected characteristics United States, 1980
Selected characteristic
Total . . . . . . . . . . . . . . . . . . . . . . . . . . . . . . . . . . . . . . . . . . .
Sex
Female . . . . . . . . . . . . . . . . . . . . . . . . . . . . . . . . . . . . . . . . . . Male . . . . . . . . . . . . . . . . . . . . . . . . . . . . . . . . . . . . . . . . . . .
Age
Under45years . . . . . . . . . . . . . . . . . . . . . . . . . . . . . . . . . . . . 45yearsand over . . . . . . . . . . . . . . . . . . . . . . . . . . . . . . . . . . .
Race
White . . . . . . . . . . . . . . . . . . . . . . . . . . . . . . . . . . . . . . . . . . . Black . . . . . . . . . . . . . . . . . . . . . . . . . . . . . . . . . . . . . . . . . . . Other . . . . . . . . . . . . . . . . . . . . . . . . . . . . . . . . . . . . . . . . . . .
Problem status
Newproblem . . . . . . . . . . . . . . . . . . . . . . . . . . . . . . . . . . . . . . Oldproblem . . . . . . . . . . . . . . . . . . . . . . . . . . . . . . . . . . . . . .
Major reason for visit
Acute problem . . . . . . . . . . . . . . . . . . . . . . . . . . . . . . . . . . . . .Chronic problem, routine . . . . . . . . . . . . . . . . . . . . . . . . . . . . . .Chronicproblem,flareup . . . . . . . . . . . . . . . . . . . . . . . . . . . . . .
Postsurgery orpostinjury . . . . . . . . . . . . . . . . . . . . . . . . . . . . .
Nonillnesscare . . . . . . . . . . . . . . . . . . . . . . . . . . . . . . . . . . . . .
I A visit i~ which orie or more drugs were ordered.2A11.1isted drugs+ number of visits.3Al[.listed drugs + number of drug VkitS.
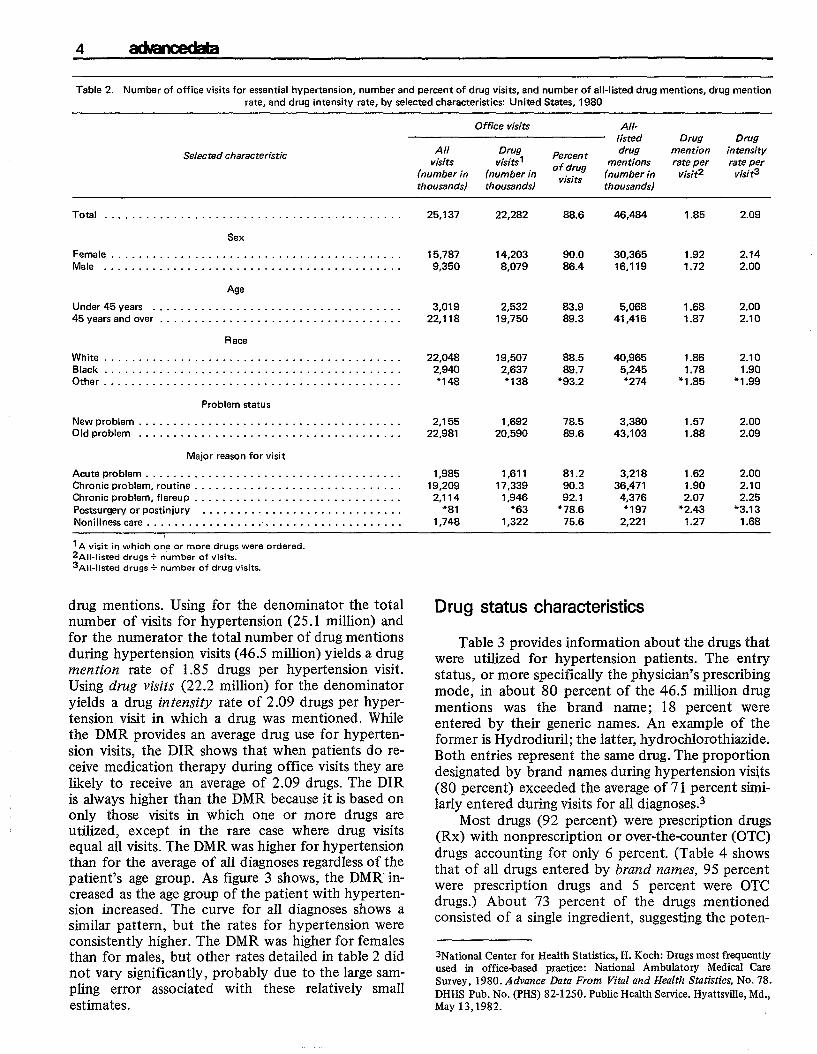
drug mentions. Using for the denominator the total number ofvisits for hypertension (25.1 million) and for the numerator the total number ofdrug mentions during hypertension visits (46.5 million) yields a drug mention rate of 1.85 drugs per hypertension visit. Using drug visits (22.2 million) for the denominator yields a drug interzsity rate of 2.09 drugs perhypertension visit in which a drug was mentioned. While the DMR providesan average drug use forhypertension visits, the DIR shows that when patients do receive medication therapy during office visits they are likely to receive an average of 2.09 drugs. The DIR is always higher than the DMR because itis basedon only those visits in which one or more drugs are utilized, except in the rare case where drug visits equal all visits. The DMRwashigher forhypertension than for the average ofalldiagnoses regardless of the patient’s age group. As figure 3 shows, the DMRincreased as the age group of the patient with hypertension increased. The curve for all diagnoses shows a similar pattern, but the rates for hypertension were consistently higher. The DMR was higher for females than for males, but other rates detailed intable2 did not vary significantly, probably due tothe large sampling error associated with these relatively small estimates.
Office visits All-Iisted Drug Drug
visits visits1 mentions rate per rate per (numberin (numberin ‘~,~~ (number in visit2 visi~
thousands) thousands) thousands)
25,137 22,282 88.6 46,484 1.85 2.09
All Drug Percent drug mention intensity
15,787 14,203 90.0 30,365 1.92 2.14 9,350 8,079 86.4 16,119 1.72 2.00
3,019 2,532 83.9 5,068 1.68 2.00 22,118 19,750 89.3 41,416 1.87 2.10
22,048 19,507 88.5 40,965 1.86 2.10 2,940 2,637 89.7 5,245 1.78 1.90 �148 ’138 *93.2 *274 * 1.85 + 1.99
2,155 1,692 78.5 3,380 1.57 2.00 22,981 20,590 89.6 43,103 1.88 2.09
1,985 1,611 81.2 3,218 1.62 2.00 19,209 17,339 90.3 36,471 1.90 2.10
2,114 1,946 92.1 4,376 2.07 2.25
*81 *63 *78.6 *197 * 2.43 *3.13
1,748 1,322 75.6 2,221 1.27 1.68
Drug status characteristics
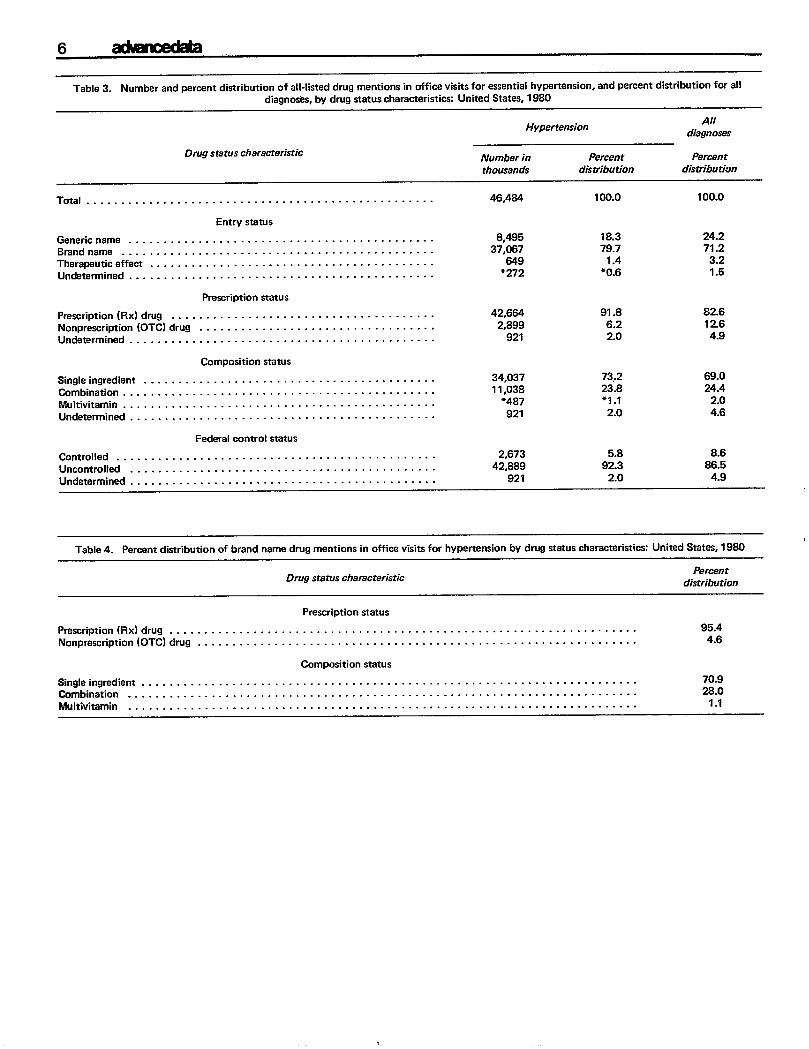
Table 3 provides information about the drugs that were utilized for hypertension patients. The entry status, or more specifically the physician’s prescribing mode, in about 80 percent of the 46.5 million drug mentions was the brand name; 18 percent were entered by their generic names. An example of the former is Hydrodiuril; the latter, hydrochlorothiazide. Both entries represent the same drug. The proportion designated by brand names during hypertension visits (80 percent) exceeded the average of71 percent similarly entered during visits for all diagnoses.3
Most drugs (92 percent) were prescription drugs (Rx) with nonprescription or over-the-counter (OTC) drugs accounting for only 6 percent. (Table 4 shows that of all drugs entered by brand names, 95 percent were prescription drugs and 5 percent were OTC drugs.) About 73 percent of the drugs mentioned consisted of a single ingredient, suggesting the poten-
3Natjon~ Centel for He~th Statistics, H. Koch: Drugs most frequently used in office-based practice: National Ambulatory Medical Care Survey, 1980. Advance Data From Vital and Health Statistics, No. 78. DHHS Pub. No. (PHS) 82-1250. Public Health Service. Hyattsville, Md., May 13,1982.

ackmdaa5
2.0 r1.9 Essential
t hypertension1.8
t 1.7
k
.E 1.6
.;
b 1.5 Q I
o~ 15-24 25-44 45-64 65 years years years years and over
Age of patient
Figure 3. Drug mention rate per office visit for essential hypertension and for all diagnoses, by age of patient: United States, 1980
tial for ordering by generic name. On the average, 69 percent of drugs mentioned for all viiits regardless of diagnosis were single ingredient drugs.
Only 6 percent of the total-drug mentions during hypertension visits consisted of drugs under the regulatory control of the Drug Enforcement Administration, compared with 9 percent dufing visits for all diagnoses.
Most frequently mentioned drugs
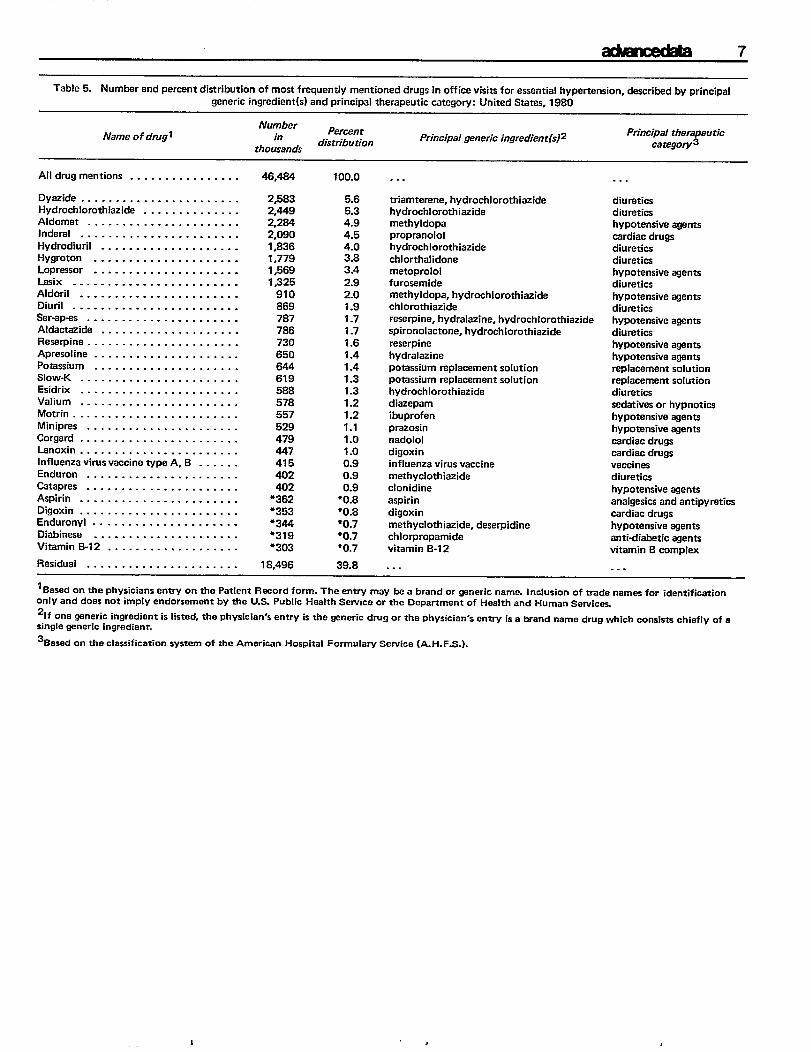
The 30 drugs listed in table 5 accounted for about 60 percent of all drug mentions in office visits for hypertension. The reader is cautioned that the ranking may be somewhat artificial because some estimates do not differ significantly from other near estimates due to sampling variability.
As may be expected, 2 therapeutic categories, hypotensive agents and diuretics, were predominant among drug mentions when patients visited for hyper-tension. (In NAMCS, therapeutic categories were based on the classification system of the American Hospital Formulary Service.A) Of the 30 listed drugs,
4Ameficm Society of Hospital Pharmacists, Inc., i’%eA mericanHospital Formulary Service. Washington. Jan. 1980.
10 are hypotensive agents, 9 are diuretics, 4 are cardiac drugs, and 2 are replacement solutions (potassium). Only one is a tranquilizer.
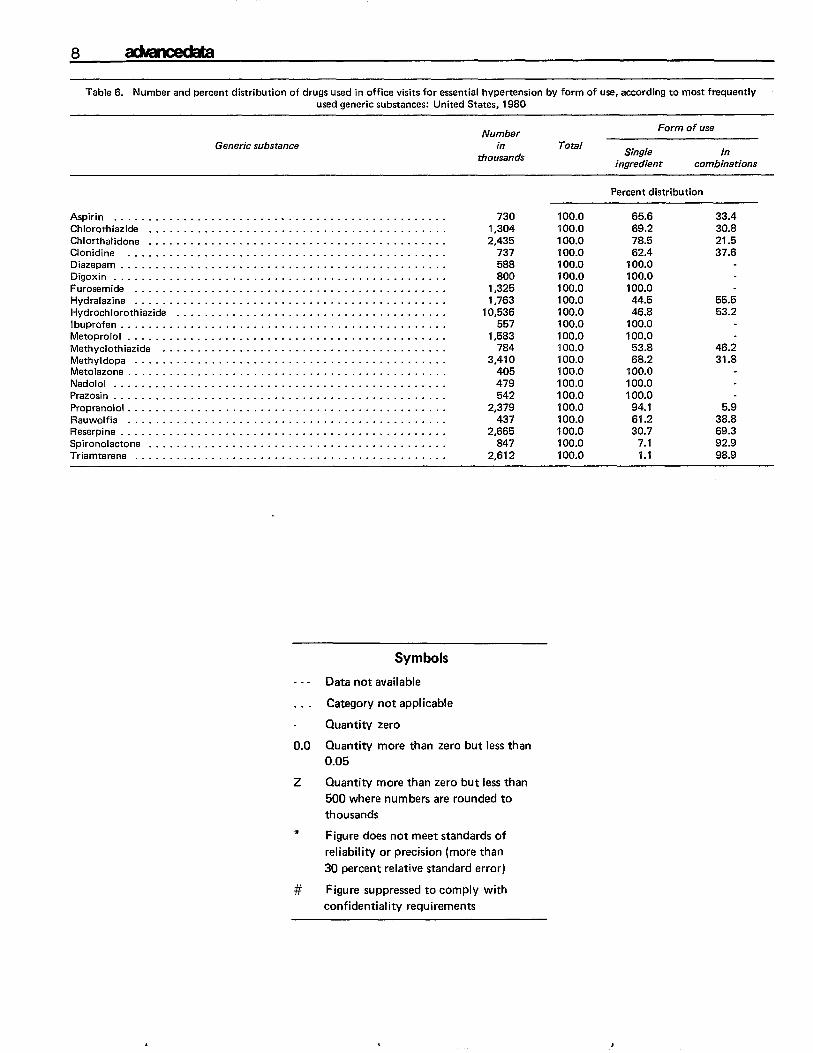
The most frequently utilized generic substances are shown in table 6. The data in this table represent the utilization of the generic substance regardless of whether the substance was prescribed by brand or generic name. The form of use indicates whether the substance was used as a single ingredient or in combination with other substances. Hydrochlorothiazide (10.5 million) was clearly the most frequently used generic ingredient. About 53 percent of its use was in combination with other drugs. Some generic drugs such as diazepam, digoxin, furosemide, ibuprofen, metoprolol, metalozone, nadolol, and prazosin were never prescribed in combination with another sub-stance. Others, such as spironolactone and triamterene, were ahnost always found in combination prescriptions.
Additional data on medication therapy in office visits for hypertension, as well as for other diagnoses, will appear in a future Vital and lifealth Statistics publication. Questions regarding this report may be directed to the Ambulatory Care Statistics Branch by calling 301436-7132.
4
6 admcecw.
Table 3. Number and percent distribution of all-listed drug mentions in office visits for essential hypertension, and percent distribution for all diagnosix, by drug status characteristic= United States, 1980
AllHypertension
diagnoses
Drug Watus characteristic Numbar in Percent Percent
thousands distribution distribution
Total . . . . . . . . . . . . . . . . . . . . . . . . . . . . . . . . . . . . . . . . . . . . . . . . . . 46,484 100.0 100.0
Entry status
Genericname . . . . . . . . . . . . . . . . . . . . . . . . . . . . . . . . . . . . . . . . . . . . 8,495 18.3 24.2
Brand name . . . . . . . . . . . . . . . . . . . . . . . . . . . . . . . . . . . . . . . . . . . . . 37,067 79.7 71.2
Therapeuticeffect . . . . . . . . . . . . . . . . . . . . . . . . . . . . . . . . . . . . . . . . . 649 1.4 3.2
Undetermined . . . . . . . . . . . . . . . . . . . . . . . . . . . . . . . . . . . . . . . . . . . . *272 �0.6 1.5
Prescription status
Prescription (Rx)drug . . . . . . . . . . . . . . . . . . . . . . . . . . . . . . . . . . . . . . 42,664 91.8 82.6
Nonprescription (OTC)drug . . . . . . . . . . . . . . . . . . . . . . . . . . . . . . . . . . 2,899 6.2 12.6
Undetermined . . . . . . . . . . . . . . . . . . . . . . . . . . . . . . . . . . . . . . . . . . . . 921 2.0 4.9
Composition status
Singleingredient . . . . . . . . . . . . . . . . . . . . . . . . . . . . . . . . . . . . . . . . . . 34,037 73,2 69.0
Combination . . . . . . . . . . . . . . . . . . . . . . . . . . . . . . . . . . . . . . . . . . . . . 11,038 23.8 24.4
Multivitamin . . . . . . . . . . . . . . . . . . . . . . . . . . . . . . . . . . . . . . . . . . . . . �487 *1.1 2.0 Undetermined . . . . . . . . . . . . . . . . . . . . . . . . . . . . . . . . . . . . . . . . . . . . 921 2.0 4.6
Federal corrtrol status
Controlled . . . . . . . . . . . . . . . . . . . . . . . . . . . . . . . . . . . . . . . . . . . . . . 2,673 5.8 8.6
Uncontrolled . . . . . . . . . . . . . . . . . . . . . . . . . . . . . . . . . . . . . . . . . . . . 42,889 92.3 86.5
Undetermined . . . . . . . . . . . . . . . . . . . . . . . . . . . . . . . . . . . . . . . . . . . . 921 2.0 4.9
Table4. Permntdisttibution of brand name drugmentions ino~cevisits forhypetiension bydrug Wauscharactetisti= United States,l98O
Drug status characteristic Percent
distribution
Prescription status
Prescription (Rx)drug . . . . . . . . . . . . . . . . . . . . . . . . . . . . . . . . . . . . . . . . . . . . . . . . . . . . . . . . . . . . . . . . . . . 95.4
Nonprescription (OTC)drug . . . . . . . . . . . . . . . . . . . . . . . . . . . . . . . . . . . . . . . . . . . . . . . . . . . . . . . . . . . . . . . 4.6
Composition status
Single ingredient . . . . . . . . . . . . . . . . . . . . . . . . . . . . . . . . . . . . . . . . . . . . . . . . . . . . . . . . . . . . . . . . . . . . . . . 70.9
Combination . . . . . . . . . . . . . . . . . . . . . . . . . . . . . . . . . . . . . . . . . . . . . . . . . . . . . . . . . . . . . . . . . . . . . . . . . 28.0
Multivitamin . . . . . . . . . . . . . . . . . . . . . . . . . . . . . . . . . . . . . . . . . . . . . . . . . . . . . . . . . . . . . . . . . . ....... 1.1
admcdaa7
Table 5. Number and percent distribution of most frequently mentioned drugs in office visits for essential hypertension, described by principal
generic ingredient(s) and principal therapeutic category: United States, 1980
Name of drug~
All drug mentions . . . . . . . . . . . . . . . .
Dyezide . . . . . . . . . . . . . . . . . . . . . . . Hydrochlorothiazide . . . . . . . . . . . . . . Aldomet . . . . . . . . . . . . . . . . . . . . . . Inderal . . . . . . . . . . . . . . . . . . . . . . .
Hydrodiuril . . . . . . . . . . . . . . . . . . . . Hygroton . . . . . . . . . . . . . . . . . . . . . Lopressor . . . . . . . . . . . . . . . . . . . . . LaSix . . . . . . . . . . . . . . . . . . . . . . . . Aldoril . . . . . . . . . . . . . . . . . . . . . . . Diuril . . . . . . . . . . . . . . . . . . . . . . . . Ser-ep-as . . . . . . . . . . . . . . . . . . . . . . Aldactezide . . . . . . . . . . . . . . . . . . . . Reserpine . . . . . . . . . . . . . . . . . . . . . . Apresoline . . . . . . . . . . . . . . . . . . . . . Potassium . . . . . . . . . . . . . . . . . . . . . Slow-K . . . . . . . . . . . . . . . . . . . . . . . Esidrix . . . . . . . . . . . . . . . . . . . . . . . Valium . . . . . . . . . . . . . . . . . . . . . . . Motrin . . . . . . . . . . . . . . . . . . . . . . . . Minipres . . . . . . . . . . . . . . . . . . . . . .
Corgerd . . . . . . . . . . . . . . . . . . . . . . . Lenoxin . . . . . . . . . . . . . . . . . . . . . . . lnfksenzavimsveccinetype A,B . . . . . . Enduron . . . . . . . . . . . . . . . . . . . . . .
Cetapres . . . . . . . . . . . . . . . . . . . . . . Aspirin . . . . . . . . . . . . . . . . . . . . . . .
Dioxin . . . . . . . . . . . . . . . . . . . . . . . Enduronyl . . . . . . . . . . . . . . . . . . . . . Diabtnese . . . . . . . . . . . . . . . . . . . . .
Vitamin B-12 . . . . . . . . . . . . . . . . . . .
Residual . . . . . . . . . . . . . . . . . . . . . .
Number in
thousands
Percentdistribution
Principal generic ingredient
46,484 100.0 . . .
2,583 5.6 2,449 5.3 2,284 4.9 2,090 4.5 1,836 4.0 1,779 3.8
1,569 3.4
1 J25 2.9
910 2.0 869 1.9
7B7 1.7 786 1.7 730 1.6 650 1.4 644 1.4 619 1.3 588 1.3 578 1.2 557 1.2 529 1.1 479 1.0 447 1.0 415 0.9 402 0.9 402 0.9
*362 “0.8 *353 *0.8 *344 �0.7 �319 ‘0.7 *303 *0.7
18,496 39.8
triamterene, hydrochlorothiezidehydrochlorothiez idemeth yldopaproprenololhydrochlorothiazide
chlorthalidonemetoprololfurosemidemethyldopa, hydrochlorothiazidechlorothiazidereserpine, hydralazine, hydrochlorothiazidespironolactone, hydrochlorothiazide
reserpine hydralazine potassium replacement solution potassium replacement solution hydrochlorothiez ide diazepam ibuprofen prazosin nadolol digoxin influenza virus vaccine methyclothiazide clonidlne
aspirin
digoxin methyclothiazide, deserpidine chlorpropamide vitamin B-12
. . .
Principal therapeutic catagory3
. . .
diuretics diuretics hypotensive agents cardiac drugs diuretics diuretics hypotensive agents diuretics
hypotensive agents diuretics hypotensive agents diuretics hypotensive agents hypotensiveagents replacement solution replacement sohstion diuretics
sedatives or hypnotics hypotensive agents hypotensive agents
cerdiacdrugs cardiac drugs vaccinesdiureticshypotensive agents
analgesics and antipyreticscerdiacdrugshypotensive agentsanti-diabetic agentsvitamin Bcomplex
. . .
lBa~ed~n thephYsician~entry on the patient Rwordform. Theentry may beabrand organeric name. Inclusion oftradenamasfor identification only and doesnotirnply endorsementbythe U.S. Public Health Serviceorthe Departmentof Heelthand HumenSemices Zlfonewneric ingredient islisted, theph~icianJs enmyisthe ~nericdrug orthephysician's entiyis aWandname drUgwhich COnsi5* chieflY of a single generic ingredient.
3Based on the classification system of the American Hospital Formulary Service (A. H. F.S.).
,
---
8
Table6. Number andpercent distribution ofdrugs used inoffice visits foressential hypertension by form ofuse, according tomost frequently used generic substances: United States, 1980
Generic substance
Aspirin . . . . . . . . . . . . . . . . . . . . . . . . . . . . . . . . . . . . . . . . . . . . . . . .
Chlorothiazide . . . . . . . . . . . . . . . . . . . . . . . . . . . . . . . . . . . . . . . . . . . Chlorthalidone . . . . . . . . . . . . . . . . . . . . . . . . . . . . . . . . . . . . . . . . . . . Clonidine . . . . . . . . . . . . . . . . . . . . . . . . . . . . . . . . . . . . . . . . . . . . . . Diazapam . . . . . . . . . . . . . . . . . . . . . . . . . . . . . . . . . . . . . . . . . . . . . . . Digoxin . . . . . . . . . . . . . . . . . . . . . . . . . . . . . . . . . . . . . . . . . . . . . . . . Furosemide . . . . . . . . . . . . . . . . . . . . . . . . . . . . . . . . . . . . . . . . . . . . . Hydralazine . . . . . . . . . . . . . . . . . . . . . . . . . . . . . . . . . . . . . . . . . . . . . Hydrochlorothiazide . . . . . . . . . . . . . . . . . . . . . . . . . . . . . . . . . . . . . . . Ibuprofen . . . . . . . . . . . . . . . . . . . . . . . . . . . . . . . . . . . . . . . . . . . . . . . Metoprolol . . . . . . . . . . . . . . . . . . . . . . . . . . . . . . . . . . . . . . . . . . . . . .
Methyclothiazide . . . . . . . . . . . . . . . . . . . . . . . . . . . . . . . . . . . . . . . . . Methyldopa . . . . . . . . . . . . . . . . . . . . . . . . . . . . . . . . . . . . . . . . . . . . . Nfetolazone . . . . . . . . . . . . . . . . . . . . . . . . . . . . . . . . . . . . . . . . . . . . . . Nadolol . . . . . . . . . . . . . . . . . . . . . . . . . . . . . . . . . . . . . . . . . . . . . . . . Prazosin . . . . . . . . . . . . . . . . . . . . . . . . . . . . . . . . . . . . . . . . . . . . . . . .
Propranolol . . . . . . . . . . . . . . . . . . . . . . . . . . . . . . . . . . . . . . . . . . . . . . Rauwolfia . . . . . . . . . . . . . . . . . . . . . . . . . . . . . . . . . . . . . . . . . . . . . . Reserpine . . . . . . . . . . . . . . . . . . . . . . . . . . . . . . . . . . . . . . . . . . . . . . .
Spironolactone . . . . . . . . . . . . . . . . . . . . . . . . . . . . . . . . . . . . . . . . . . . Triamterene . . . . . . . . . . . . . . . . . . . . . . . . . . . . . . . . . . . . . . . . . . . . .
Symbols
Data notavailable
. . . Category not applicable
Quantity zero
Number Form of use
in thousands
Total Single In
ingredient combinations
Percent distribution
730 100.0 65.6 33.4 1,304 100,0 69.2 30.8 2,435 100.0 78.5 21.5
737 100.0 62.4 37.6 588 100.0 100.0 800 100.0 100.0
1,325 100.0 100.0 1,763 100.0 44.5 55.5
10,536 100.0 46.8 53.2
557 100.0 100.0 1,583 100.0 100.0
784 100.0 53.8 46.2 3,410 100.0 68.2 31.8
405 100.0 100.0 479 100.0 100.0 542 100.0 100.0
2,379 100.0 94.1 5.9 437 100.0 61.2 38.8
2,665 100.0 30.7 69.3 847 100.0 7.1 92.9
2,612 100.0 1.1 98.9
0.0 Quantity more than zero but lessthan 0.05
z Quantity more than zero butless than
500 where numbers are roundedto
thousands *
Figure does not meet standards of reliability or precision (more than
30 percent relative standard error)
# Figure suppressed to comply with
confidentiality requirements
L I
Technical notes
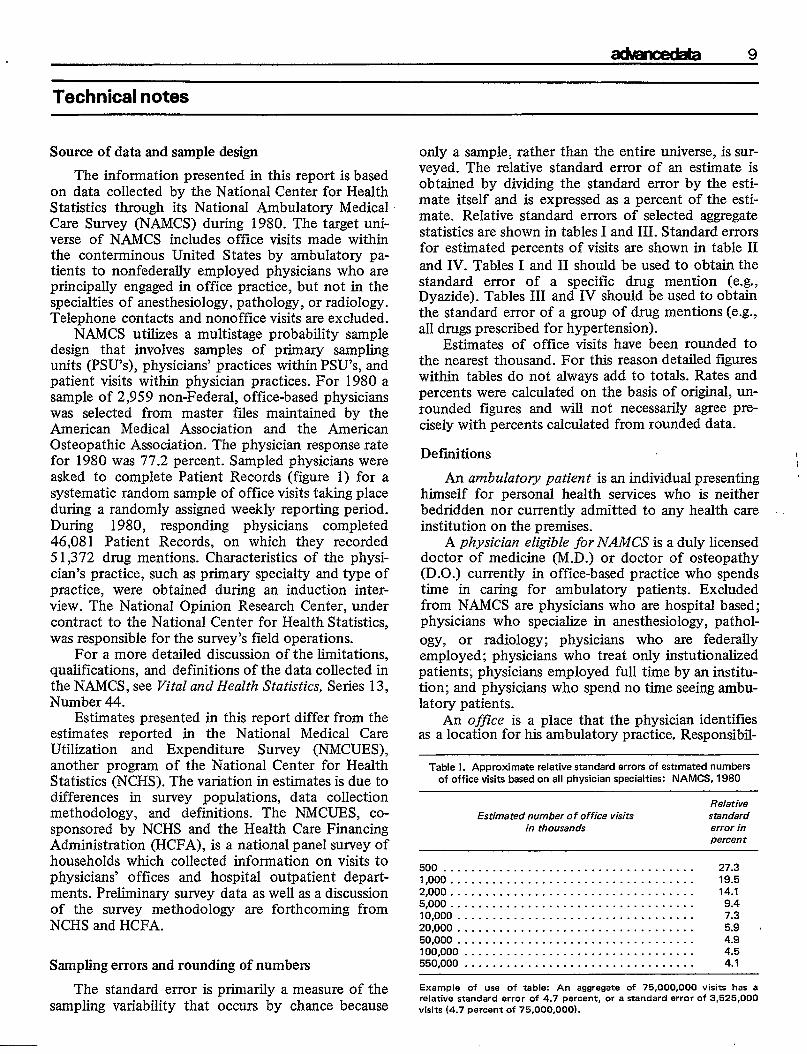
Source of data and sample design
The information presented in this report is based on data collected by the National Center for Health Statistics through its National Ambulatory Medical Care Survey (NAMCS) during 1980. The target universe of NAMCS includes office visits made within the contenninous United States by ambulatory patients to nonfederally employed physicians who are principally engaged in office practice, but not in the specialties of anesthesiology, pathology, or radiology. Telephone contacts and nonoffice visits are excluded.
NAMCS utilizes a multistage probability sample design that involves samples of primary sampling units (PSU’S), physicians’ practices within PSU’S, and patient visits within physician practices. For 1980 a sample of 2,959 non-Federal, office-based physicians was selected from master fdes maintained by the American Medical Association and the American Osteopathic Association. The physician response rate for 1980 was 77.2 percent. Sampled physicians were asked to complete Patient Records (figure 1) for a systematic random sample of office visits taking place during a randomly assigned weekly reporting period. During 1980, responding physicians completed 46,081 Patient Records, on which they recorded 51,372 drug mentions. Characteristics of the physician’s practice, such as primary specialty and type of practice, were obtained during an induction inter-view. The National Opinion Research Center, under contract to the National Center for Health Statistics, was responsible for the survey’s field operations.
For a more detailed discussion of the limitations, qualifications, and definitions of the data collected in the NAMCS, see Vital and Health Statistics, Series 13, Number 44.
Estimates presented in this report differ from the estimates reported in the National Medical Care Utilization and Expenditure Survey (NMCUES), another program of the National Center for Health Statistics (NCHS). The variation in estimates is due to differences in survey populations, data collection methodology, and definitions. The NMCUES, cosponsored by NCHS and the Health Care Financing Administration (HCFA), is a national panel survey of households which collected information on visits to physicians’ offices and hospital outpatient departments. Preliminary survey data as well as a discussion of the survey methodology are forthcoming from NCHS and HCFA.
Sampling errors and rounding of numbers
The standard error is primarily a measure of the sampling variability that occurs by chance because
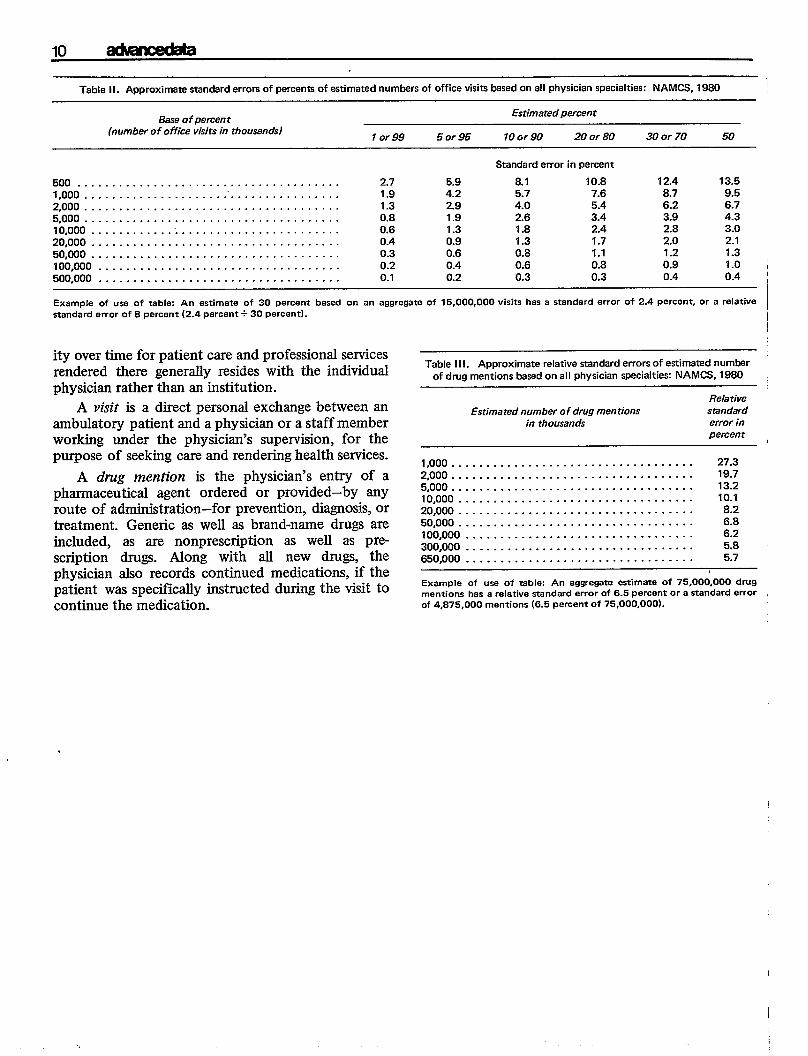
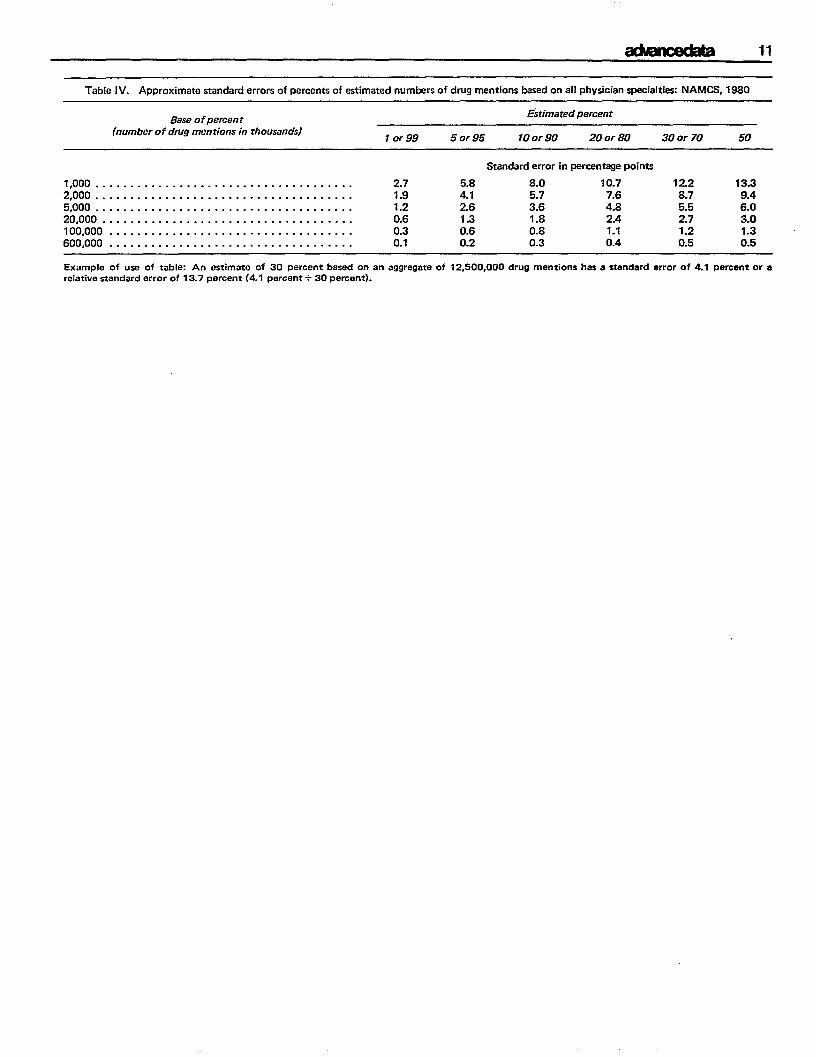
only a sample, rather than the entire universe, is surveyed. The relative standard error of an estimate is obtained by dividing the standard error by the estimate itself and is expressed as a percent of the estimate. Relative standard errors of selected aggregate statistics are shown in tables I and 111.Standard errors for estimated percents of visits are shown in table II and IV. Tables I and 11 should be used to obtain the standard emor of a specific drug mention (e.g., Dyazide). Tables III and IV should be used to obtain the standard error of a group of drug mentions (e.g., all drugs prescribed for hypertension).
Estimates of office visits have been rounded to the nearest thousand. For this reason detailed figures within tables do not always add to totals. Rates and percents were calculated on the basis of origimd, unrounded figures and will not necessmily agree preciseIy with percents calculated from rounded data.
Definitions i\
An ambulatory patient is an individual presenting himself for personal health services who is neither bedridden nor currently admitted to any health care institution on the premises.
A physician eligz”blefor NAMCS is a duly licensed doctor of medicine (M.D.) or doctor of osteopathy (D.O.) currently in office-based practice who spends time in caring for ambulatory patients. Excluded from NAMCS are physicians who are hospital based; physicians who specialize in anesthesiology, pathology, or radiology; physicians who are federally employed; physicians who treat only instutionaked patients; physicians employed full time by an institution; and physicians who spend no time seeing ambulatory patients.
An office is a place that the physician identifies as a location for his ambulatory practice. Responsibil-
Table 1. Approximate relative standard errors of estimated numbers of office visits based on all physician specialties: NAMC8, 1980
Relative Estimated number of office visits standard
in thousands error in percent
500 . . . . . . . . . . . . . . . . . . . . . . . . . . . . . . . . . . . . 27.3 1,000 . . . . . . . . . . . . . . . . . . . . . . . . . . . . . . . . . . . 19.5 2,000 . . . . . . . . . . . . . . . . . . . . . . . . . . . . . . . . . . . 14.1 58000 . . . . . . . . . . . . . . . . . . . . . . . . . . . . . . . . . . . 9.4 10,000 . . . . . . . . . . . . . . . . . . . . . . . . . . . . . . . . . . 7.3 20,000 . . . . . . . . . . . . . . . . . . . . . . . . . . . . . . . . . . 5.9 . 50,000 . . . . . . . . . . . . . . . . . . . . . . . . . . . . . . . . . . 4.9 100,000 . . . . . . . . . . . . . . . . . . . . . . . . . . . . . . . . . 4.5 550,000 . . . . . . . . . . . . . . . . . . . . . . . . . . . . . . . . . 4.7
Example of usa of table: An aggregate of 75,000,000 visits has a ralative standard error of 4.7 percent, or a standard error of 3,525,000 visits (4.7 percent of 75,000,000).
10
Table II. Approximate standard errors of percents Of estimated numbars of office visits based on all physician specialties: NAMCS, 1980
Base of percen t Estimated percent
(number of office visits in thousands) 1 or 99 5 or 95 10 c-r 90 20 or 80 30 or 70 50
Standard error in percent
500 . . . . . . . . . . . . . . . . . . . . . . . . . . . . . . . . . . . . . . 2.7 5.9 8.1 10.8 12.4 13.5 1,000 . . . . . . . . . . . . . . . . . . . . .. . . . . . . . . . . . . . . . . 1.9 4.2 5.7 7.6 8.7 9.5 2,000 . . . . . . . . . . . . . . . . . . . . . . . . . . . . . . . . . . . . . 1.3 2.9 4.0 5.4 6.2 6.7 5,000 . . . . . . . . . . . . . . . . . . . . . . . . . . . . . . . . . . . . . 0.8 1.9 2.6 3.4 3.9 4.3 10,000 . . . . . . . . . . ..”...... . . . . . . . . . . . . . . . . . . 0.6 1.3 1.8 2.4 2.8 3.0 20,000 . . . . . . . . . . . . . . . . . . . . . . . . . . . . . . . . . . . . 0.4 0.9 1.3 1.7 2.0 2.1 50,000 . . . . . . . . . . . . . . . . . . . . . . . . . . . . . . . . . . . . 0.3 0.6 0.8 1.1 1.2 1.3 100,000 . . . . . . . . . . . . . . . . . . . . . . . . . . . . . . . . . . . 0.2 0.4 0.6 0.8 0.9 1.0 ; 500,000 . . . . . . . . . . . . . . . . . . . . . . . . . . . . . . . . . . . 0.1 0.2 0.3 0.3 0.4 0.4
I
Example of use of table An estimate of 30 percent based on an aggregate of 15,000,000 visits hasastandard error of 2.4percent, or a relative / standard error of 8 percent (2.4 percent+ 30 percent).
ityovertimefor patientcareand professional services rendered there generally resides with the individual physician rather than an institution.
A visit is adirect personal exchange between an ambulatory patient and aphysician orastaffmember working under the physician’s supervision, for the purpose of seeking care andrendering health services.
A drug mention is the physician’s entry of a pharmaceutical agent ordered or provided-by any route of administration-for prevention, diagnosis, or treatment. Generic as well as brand-name drugs are included, as are nonprescription as well as prescription drugs. Along with all new drugs, the physician also records continued medications, if the patient was spectilcally instructed during the visit to continue the medication.
,
Table II 1. Approximate relative standard errors of estimated numlx?r of drug mentions besed on all physician specialties NAMCS, 1980
Relative Estimated number of drug mentions standard ~
in thousands error in percent ,
1,000 . . . . . . . . . . . . . . . . . . . . . . . . . . . . . . . . . . . 27.3
2,000 . . . . . . . . . . . . . . . . . . . . . . . . . . . . . . . . . . . 19.7 5,000 . . . . . . . . . . . . . . . . . . . . . . . . . . . . . . . . . . . 13.2 10,000 . . . . . . . . . . . . . . . . . . . . . . . . . . . . . . . . . . 10.1 ~ 20,000 . . . . . . . . . . . . . . . . . . . . . . . . . . . . . . . . . . 8.2 50,000 . . . . . . . . . . . . . . . . . . . . . . . . . . . . . . . . . . 6.8 100,000 . . . . . . . . . . . . . . . . . . . . . . . . . . . . . . . . . 6.2 300,000 . . . . . . . . . . . . . . . . . . . . . . . . . . . . . . . . . 5.8 650,000 . . . . . . . . . . . . . . . . . . . . . . . . . . . . . . . . . 5.7
Example of usa of table: An aggregate estimate of 75.000,000 drug mentions has arelative standard error of 6.5 percent ora standard error of 4,875,000 mentions (6.5 percent of 75,000,00@.
I
aklmdaa 11
TabIelV. Approximate wandard errors ofpercents ofeWimated num&mof drug mentions ksedonall physician specialties NAMCS,1860
Base ofpercent Estimated percent
(number of drug mentions in thousands) 1 or 99 5 or 95 10 or 90 20 or 80 30 or 70 50
Standard error in percentage points
1,000..................................... 2.7 5.8 8.0 ‘10.7 12.2 13.3 2,000 . . . . . . . . . . . . . . . . . . . . . . . . . . . . . . . . . . . . . 1.9 4.1 5.7 7.6 8.7 9.4 5,000 . . . . . . . . . . . . . . . . . . . . . . . . . . . . . . . . . . . . . 1.2 2.6 3.6 4.8 5.5 6.0 20,000 . . . . . . . . . . . . . . . . . . . . . . . . . . . . . . . . . . . . 0.6 1.3 1.8 2.4 2.7 3.0 100,000 . . . . . . . . . . . . . . . . . . . . . . . . . . . . . . . . . . . 0.3 0.6 0.8 1.1 1.2 1.3 600,000 . . . . . . . . . . . . . . . . . . . . . . . . . . . . . . . . . . . 0.1 0.2 0.3 0.4 0.5 0.5
Example of use of table: An estimate of 30 percent based on an aggregate of 12,500,000 drug mentions hese standard error of 4.1 percant ora relative standard error of 13.7 percent (4.1 percent +30 percent).
12 .
Recent Issues O(Advance Data From Vital and Health Statistics
No. 79. Blood Lead Levels for Persons 6 Months-74 Years of No. 76. Blood Carbon Monoxide Levels in Persons 3-74 Years Age: United States, 1976-80 (Issued: May 12, 1982) of Age: United States, 1976-1980 (Issued: March 17, 1982)
No. 78. Drugs Most Frequently Used in Office-Based Practice: No. 75. Expected Principal Source of Payment for Hospital National Ambulatory Medical Care Survey, 1980 (Issued: Discharge: United States, 1979 (Issued: February 16, 1982) May 12, 1982)
No. 77. 1980 Summary: National Ambulatory Medical Care Survey (Issued: February 22, 1982)
SUGGESTED CITATION
National Center for Health Statistics, B. K. Cypress: Medication therapy in office visits for hypertension: National Ambulatory Medical Care Surveyr 1980. Advance Data From Vital and Health Statistics, No. 80. DHHS Pub. No. (PHS) 82-1250. PublicHealth Service, Hyattsville, Md.
U.S. DEPARTMENT OF HEALTH AND HUMAN SERVICES POSTAGE AND FEES PAIDPublic Health Service U.S. DEPARTMENT OF HHSOffice of Health Research, Statistics, and Technology HHS 396 .
* . 3700 East-West Highway THIRD CLASS Hyattsville, Maryland 20782 BULK RATE LLS.MAIL
OFFICIAL BUSINESS PENALTY FOR PRIVATE USE, $300
To receive this publication regularly,
cOMaCt the National Center for Health Statistics by calling 301.436. NCHS.
National Center for Health Statistics
HR. From the Office of Health Research, Statistics, and Technology OHHS Publication No. (PHS) 82.1250