Embed Size (px)
Citation preview
MCrunch User’s Guide 1 Last revised on May 15, 2008 for version 1.0
Technical Report NREL/TP-500-43139 May 2008
MCrunch User’s Guide for Version 1.00 M. Buhl, Jr. Revised May 15, 2008 for MCrunch v1.00.00

Technical Report NREL/TP-500-43139 May 2008
MCrunch User’s Guide for Version 1.00 M. Buhl, Jr. Prepared under Subtasks No. WER8.2101 and WER8.2104

NOTICE
This report was prepared as an account of work sponsored by an agency of the United States government. Neither the United States government nor any agency thereof, nor any of their employees, makes any warranty, express or implied, or assumes any legal liability or responsibility for the accuracy, completeness, or usefulness of any information, apparatus, product, or process disclosed, or represents that its use would not infringe privately owned rights. Reference herein to any specific commercial product, process, or service by trade name, trademark, manufacturer, or otherwise does not necessarily constitute or imply its endorsement, recommendation, or favoring by the United States government or any agency thereof. The views and opinions of authors expressed herein do not necessarily state or reflect those of the United States government or any agency thereof.
Available electronically at http://www.osti.gov/bridge Available for a processing fee to U.S. Department of Energy and its contractors, in paper, from:
U.S. Department of Energy Office of Scientific and Technical Information P.O. Box 62 Oak Ridge, TN 37831-0062 phone: 865.576.8401 fax: 865.576.5728 email: mailto:[email protected]
Available for sale to the public, in paper, from:
U.S. Department of Commerce National Technical Information Service 5285 Port Royal Road Springfield, VA 22161 phone: 800.553.6847 fax: 703.605.6900 email: [email protected] online ordering: http://www.ntis.gov/ordering.htm
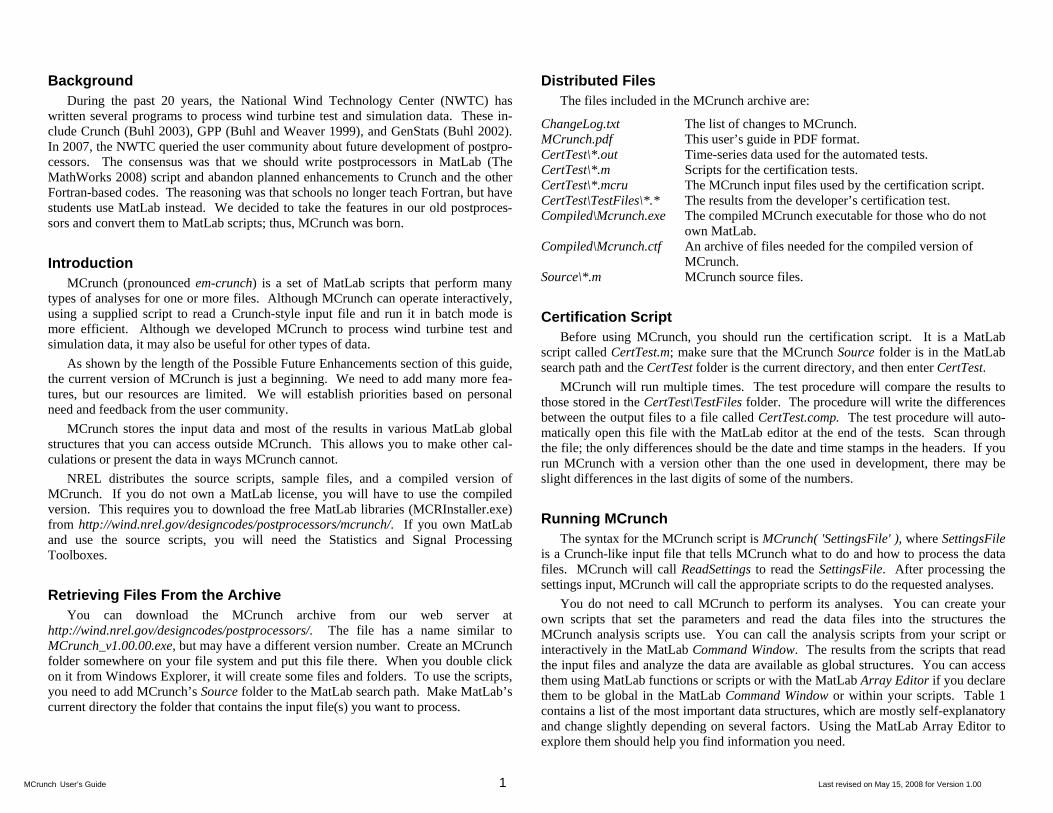
Background During the past 20 years, the National Wind Technology Center (NWTC) has
written several programs to process wind turbine test and simulation data. These in-clude Crunch (Buhl 2003), GPP (Buhl and Weaver 1999), and GenStats (Buhl 2002). In 2007, the NWTC queried the user community about future development of postpro-cessors. The consensus was that we should write postprocessors in MatLab (The MathWorks 2008) script and abandon planned enhancements to Crunch and the other Fortran-based codes. The reasoning was that schools no longer teach Fortran, but have students use MatLab instead. We decided to take the features in our old postproces-sors and convert them to MatLab scripts; thus, MCrunch was born.
Introduction MCrunch (pronounced em-crunch) is a set of MatLab scripts that perform many
types of analyses for one or more files. Although MCrunch can operate interactively, using a supplied script to read a Crunch-style input file and run it in batch mode is more efficient. Although we developed MCrunch to process wind turbine test and simulation data, it may also be useful for other types of data.
As shown by the length of the Possible Future Enhancements section of this guide, the current version of MCrunch is just a beginning. We need to add many more fea-tures, but our resources are limited. We will establish priorities based on personal need and feedback from the user community.
MCrunch stores the input data and most of the results in various MatLab global structures that you can access outside MCrunch. This allows you to make other cal-culations or present the data in ways MCrunch cannot.
NREL distributes the source scripts, sample files, and a compiled version of MCrunch. If you do not own a MatLab license, you will have to use the compiled version. This requires you to download the free MatLab libraries (MCRInstaller.exe) from http://wind.nrel.gov/designcodes/postprocessors/mcrunch/. If you own MatLab and use the source scripts, you will need the Statistics and Signal Processing Toolboxes.
Retrieving Files From the Archive You can download the MCrunch archive from our web server at
http://wind.nrel.gov/designcodes/postprocessors/. The file has a name similar to MCrunch_v1.00.00.exe, but may have a different version number. Create an MCrunch folder somewhere on your file system and put this file there. When you double click on it from Windows Explorer, it will create some files and folders. To use the scripts, you need to add MCrunch’s Source folder to the MatLab search path. Make MatLab’s current directory the folder that contains the input file(s) you want to process.
Distributed Files The files included in the MCrunch archive are:
ChangeLog.txt The list of changes to MCrunch. MCrunch.pdf This user’s guide in PDF format. CertTest\*.out Time-series data used for the automated tests. CertTest\*.m Scripts for the certification tests. CertTest\*.mcru The MCrunch input files used by the certification script. CertTest\TestFiles\*.* The results from the developer’s certification test. Compiled\Mcrunch.exe The compiled MCrunch executable for those who do not
own MatLab. Compiled\Mcrunch.ctf An archive of files needed for the compiled version of
MCrunch. Source\*.m MCrunch source files.
Certification Script Before using MCrunch, you should run the certification script. It is a MatLab
script called CertTest.m; make sure that the MCrunch Source folder is in the MatLab search path and the CertTest folder is the current directory, and then enter CertTest.
MCrunch will run multiple times. The test procedure will compare the results to those stored in the CertTest\TestFiles folder. The procedure will write the differences between the output files to a file called CertTest.comp. The test procedure will auto-matically open this file with the MatLab editor at the end of the tests. Scan through the file; the only differences should be the date and time stamps in the headers. If you run MCrunch with a version other than the one used in development, there may be slight differences in the last digits of some of the numbers.
Running MCrunch The syntax for the MCrunch script is MCrunch( 'SettingsFile' ), where SettingsFile
is a Crunch-like input file that tells MCrunch what to do and how to process the data files. MCrunch will call ReadSettings to read the SettingsFile. After processing the settings input, MCrunch will call the appropriate scripts to do the requested analyses.
You do not need to call MCrunch to perform its analyses. You can create your own scripts that set the parameters and read the data files into the structures the MCrunch analysis scripts use. You can call the analysis scripts from your script or interactively in the MatLab Command Window. The results from the scripts that read the input files and analyze the data are available as global structures. You can access them using MatLab functions or scripts or with the MatLab Array Editor if you declare them to be global in the MatLab Command Window or within your scripts. Table 1 contains a list of the most important data structures, which are mostly self-explanatory and change slightly depending on several factors. Using the MatLab Array Editor to explore them should help you find information you need.
MCrunch User’s Guide 1 Last revised on May 15, 2008 for Version 1.00
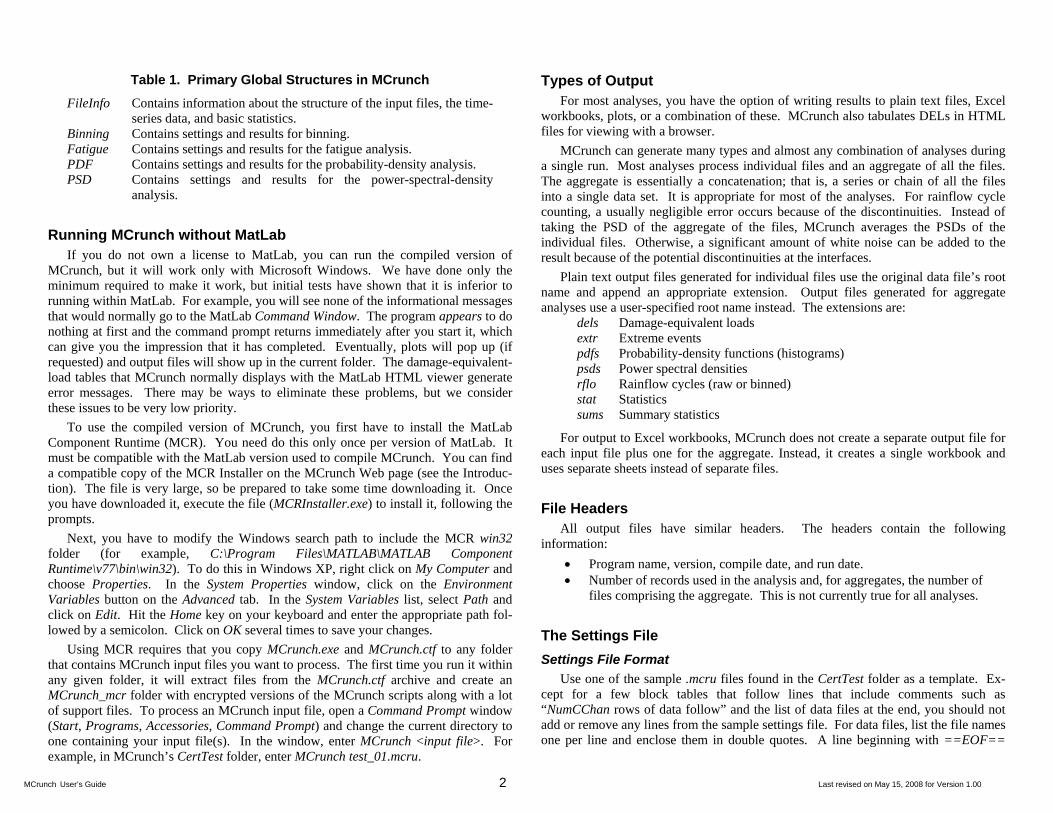
Table 1. Primary Global Structures in MCrunch
FileInfo Contains information about the structure of the input files, the time-series data, and basic statistics.
Binning Contains settings and results for binning. Fatigue Contains settings and results for the fatigue analysis. PDF Contains settings and results for the probability-density analysis. PSD Contains settings and results for the power-spectral-density
analysis.
Running MCrunch without MatLab If you do not own a license to MatLab, you can run the compiled version of
MCrunch, but it will work only with Microsoft Windows. We have done only the minimum required to make it work, but initial tests have shown that it is inferior to running within MatLab. For example, you will see none of the informational messages that would normally go to the MatLab Command Window. The program appears to do nothing at first and the command prompt returns immediately after you start it, which can give you the impression that it has completed. Eventually, plots will pop up (if requested) and output files will show up in the current folder. The damage-equivalent-load tables that MCrunch normally displays with the MatLab HTML viewer generate error messages. There may be ways to eliminate these problems, but we consider these issues to be very low priority.
To use the compiled version of MCrunch, you first have to install the MatLab Component Runtime (MCR). You need do this only once per version of MatLab. It must be compatible with the MatLab version used to compile MCrunch. You can find a compatible copy of the MCR Installer on the MCrunch Web page (see the Introduc-tion). The file is very large, so be prepared to take some time downloading it. Once you have downloaded it, execute the file (MCRInstaller.exe) to install it, following the prompts.
Next, you have to modify the Windows search path to include the MCR win32 folder (for example, C:\Program Files\MATLAB\MATLAB Component Runtime\v77\bin\win32). To do this in Windows XP, right click on My Computer and choose Properties. In the System Properties window, click on the Environment Variables button on the Advanced tab. In the System Variables list, select Path and click on Edit. Hit the Home key on your keyboard and enter the appropriate path fol-lowed by a semicolon. Click on OK several times to save your changes.
Using MCR requires that you copy MCrunch.exe and MCrunch.ctf to any folder that contains MCrunch input files you want to process. The first time you run it within any given folder, it will extract files from the MCrunch.ctf archive and create an MCrunch_mcr folder with encrypted versions of the MCrunch scripts along with a lot of support files. To process an MCrunch input file, open a Command Prompt window (Start, Programs, Accessories, Command Prompt) and change the current directory to one containing your input file(s). In the window, enter MCrunch <input file>. For example, in MCrunch’s CertTest folder, enter MCrunch test_01.mcru.
Types of Output For most analyses, you have the option of writing results to plain text files, Excel
workbooks, plots, or a combination of these. MCrunch also tabulates DELs in HTML files for viewing with a browser.
MCrunch can generate many types and almost any combination of analyses during a single run. Most analyses process individual files and an aggregate of all the files. The aggregate is essentially a concatenation; that is, a series or chain of all the files into a single data set. It is appropriate for most of the analyses. For rainflow cycle counting, a usually negligible error occurs because of the discontinuities. Instead of taking the PSD of the aggregate of the files, MCrunch averages the PSDs of the individual files. Otherwise, a significant amount of white noise can be added to the result because of the potential discontinuities at the interfaces.
Plain text output files generated for individual files use the original data file’s root name and append an appropriate extension. Output files generated for aggregate analyses use a user-specified root name instead. The extensions are:
dels Damage-equivalent loads extr Extreme events pdfs Probability-density functions (histograms) psds Power spectral densities rflo Rainflow cycles (raw or binned) stat Statistics sums Summary statistics
For output to Excel workbooks, MCrunch does not create a separate output file for each input file plus one for the aggregate. Instead, it creates a single workbook and uses separate sheets instead of separate files.
File Headers All output files have similar headers. The headers contain the following
information: • Program name, version, compile date, and run date. • Number of records used in the analysis and, for aggregates, the number of
files comprising the aggregate. This is not currently true for all analyses.
The Settings File Settings File Format
Use one of the sample .mcru files found in the CertTest folder as a template. Ex-cept for a few block tables that follow lines that include comments such as “NumCChan rows of data follow” and the list of data files at the end, you should not add or remove any lines from the sample settings file. For data files, list the file names one per line and enclose them in double quotes. A line beginning with ==EOF==
MCrunch User’s Guide 2 Last revised on May 15, 2008 for Version 1.00
must come after the last data file. MCrunch’s ReadSettings function ignores anything after the ==EOF== line.
As long as the parameter(s) being read is (are) the first “word(s)” on the line and it is (they are) separated from the comment portion of the line with white space, MCrunch will not be affected. The amount of spacing is not important—use whatever looks good to you. You must separate any lists of numbers with white space—not commas. Block tables have their own special formats.
Title Line The second line of the file is for a job title. The line can be of any length and con-
tain anything you might find useful. Although MCrunch does not currently use this line for anything, it may someday include it in output files.
Job Options There are currently five inputs in the Job Options section of the settings file. The
first, EchoInp, allows you to request MCrunch to echo your settings file input parame-ters to another file so you can debug your settings file. The echo file has the same root name as your settings file and echo for an extension.
One common complaint about our old Crunch postprocessor is that if you add new channels to your data files, you have to change the channel numbers used in the set-tings file. We find that quite tedious and prone to error when we have more than 100 channels in our data files. We decided to allow users to specify channels by their names instead of numbers. If you want to take advantage of this feature, set StrNames to true and use the channel names following a $ anywhere channel numbers would normally go. Here’s an example:
$RootFxc1 $RootFyc1 $RootFzc1 SFChans If you enable StrNames, you don’t have to use them exclusively; numbers will still
work as ReadSettings simply replaces all the $ChanName strings found in the settings file with the channel numbers before processing the file.
A future release will allow you to write out the input data after MCrunch applies scales and offsets, filters the data, and adds calculated channels.
Use the RealFmt parameter to specify the formatting of fixed-point numbers in the output. The standard MatLab sprintf syntax applies. You must enclose this string in double quotes.
AggRoot holds the root name of output files that contain analysis results based on using all input files as a single time series. You must enclose this string in double quotes.
Input-Data Layout MCrunch can automatically determine the number of columns and rows in your
data files, or you can specify these things explicitly. If you want this, set the number of input channels to zero and don’t give it a list of channels.
If you want MCrunch to parse channel names and units from the input file, specify the lines that contain such information. If you specify a zero for either, MCrunch assumes there is no such line. If you tell MCrunch which line contains names, it will use that line to determine the number of channels. It assumes that channel titles are a contiguous group of letters and/or symbols that do not contain any whitespace. For example, if the channel-names line is as follows:
Chan1 "Chan2"'Chan_3, Chan-4 " Chan 5", MCrunch would find six channels whose titles would be <Chan1>, <"Chan2"'Chan_3,>, <Chan-4>, <">, <Chan>, and <5"> (without the angle brackets). If your input file has a title line similar to this:
“Chan 1” “Chan 2” “Chan 3” and it has three columns of data, you cannot use the auto-detection feature for columns because MCrunch will think it has six channels (three named "Chan). If something such as this is the case, you should specify the channel information in the parameter input file.
Currently, you must either specify channel names and units within the settings file, or tell MCrunch to read them from the data file(s). A future release will assign default names such as Chan001 if there is no source of names.
If you choose autodetection of channels and give a zero for the line containing the units, MCrunch will not include any unit strings in the output. If that is the case, you must not specify the units for calculated channels.
If you want to specify channel layout, set NumChans to a number greater than zero. After the comment line describing the format for the channel table, enter NumChans lines with the channel names in double quotes, the units in doubles quotes, a fixed-point number for the scale, and another for the offset.
MCrunch cannot currently reorder or use a subset of channels, but it can rename channels from the original data file with this feature. It will apply scales and offsets as it reads the data. If you let MCrunch autodetect channels, it cannot apply scales and offsets.
Unlike Crunch, MCrunch does not require that all files have the same number of lines. Like Crunch, it does require that the channel layout be the same for all files; that is, all data files must have the same number of channels and the same number of header lines.
MCrunch can also create new channels using typical MatLab expressions with references to other channels. (See the Calculated-Channels section.)
Filtering We have yet to add filtering to MCrunch, but the Filtering header line must still be
in the settings file.
Calculated Channels You can create new channels of data through the calculated-channels feature,
which allows you to specify a single MatLab expression for each new channel.
MCrunch User’s Guide 3 Last revised on May 15, 2008 for Version 1.00
MCrunch numbers calculated channels in the order created; the number of the first one is one more than the number of input channels.
NumCChan specifies the number of new channels being created. If a calculated channel will need a seed to initialize a pseudo-random sequence, use Seed to store that value. Even if you don’t use the random-number generator, you must include seed in the input file. A comment line describing the format for the lines describing the cal-culated channels is next. After that, enter one line for each calculated channel. These lines contain three fields; each should be enclosed in double quotes and separated by white space. The first field is for the channel name. The second is for the channel units (omit this if you are not using units). The last field is the MatLab-style expression.
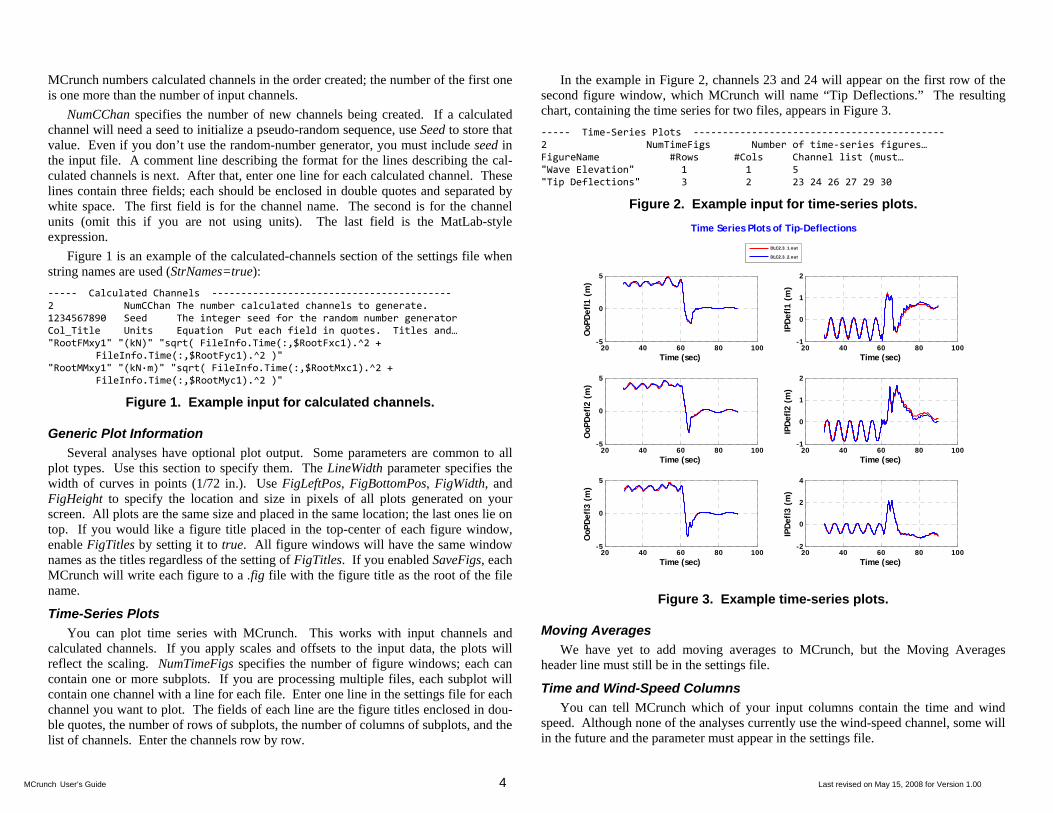
Figure 1 is an example of the calculated-channels section of the settings file when string names are used (StrNames=true): ‐‐‐‐‐ Calculated Channels ‐‐‐‐‐‐‐‐‐‐‐‐‐‐‐‐‐‐‐‐‐‐‐‐‐‐‐‐‐‐‐‐‐‐‐‐‐‐‐‐‐ 2 NumCChan The number calculated channels to generate. 1234567890 Seed The integer seed for the random number generator Col_Title Units Equation Put each field in quotes. Titles and… "RootFMxy1" "(kN)" "sqrt( FileInfo.Time(:,$RootFxc1).^2 +
FileInfo.Time(:,$RootFyc1).^2 )" "RootMMxy1" "(kN∙m)" "sqrt( FileInfo.Time(:,$RootMxc1).^2 +
FileInfo.Time(:,$RootMyc1).^2 )"
Figure 1. Example input for calculated channels.
Generic Plot Information Several analyses have optional plot output. Some parameters are common to all
plot types. Use this section to specify them. The LineWidth parameter specifies the width of curves in points (1/72 in.). Use FigLeftPos, FigBottomPos, FigWidth, and FigHeight to specify the location and size in pixels of all plots generated on your screen. All plots are the same size and placed in the same location; the last ones lie on top. If you would like a figure title placed in the top-center of each figure window, enable FigTitles by setting it to true. All figure windows will have the same window names as the titles regardless of the setting of FigTitles. If you enabled SaveFigs, each MCrunch will write each figure to a .fig file with the figure title as the root of the file name.
Time-Series Plots You can plot time series with MCrunch. This works with input channels and
calculated channels. If you apply scales and offsets to the input data, the plots will reflect the scaling. NumTimeFigs specifies the number of figure windows; each can contain one or more subplots. If you are processing multiple files, each subplot will contain one channel with a line for each file. Enter one line in the settings file for each channel you want to plot. The fields of each line are the figure titles enclosed in dou-ble quotes, the number of rows of subplots, the number of columns of subplots, and the list of channels. Enter the channels row by row.
In the example in Figure 2, channels 23 and 24 will appear on the first row of the second figure window, which MCrunch will name “Tip Deflections.” The resulting chart, containing the time series for two files, appears in Figure 3. ‐‐‐‐‐ Time‐Series Plots ‐‐‐‐‐‐‐‐‐‐‐‐‐‐‐‐‐‐‐‐‐‐‐‐‐‐‐‐‐‐‐‐‐‐‐‐‐‐‐‐‐‐‐ 2 NumTimeFigs Number of time‐series figures… FigureName #Rows #Cols Channel list (must… "Wave Elevation" 1 1 5 "Tip Deflections" 3 2 23 24 26 27 29 30
Figure 2. Example input for time-series plots.
20 40 60 80 100-5
0
5
Time (sec)
OoP
Def
l1 (
m)
20 40 60 80 100-1
0
1
2
Time (sec)
IPD
efl1
(m
)
20 40 60 80 100-5
0
5
Time (sec)
OoP
Def
l2 (
m)
20 40 60 80 100-1
0
1
2
Time (sec)
IPD
efl2
(m
)
20 40 60 80 100-5
0
5
Time (sec)
OoP
Def
l3 (
m)
20 40 60 80 100-2
0
2
4
Time (sec)
IPD
efl3
(m
)
DLC2.3_1.out
DLC2.3_2.out
Time Series Plots of Tip-Deflections
Figure 3. Example time-series plots.
Moving Averages We have yet to add moving averages to MCrunch, but the Moving Averages
header line must still be in the settings file.
Time and Wind-Speed Columns You can tell MCrunch which of your input columns contain the time and wind
speed. Although none of the analyses currently use the wind-speed channel, some will in the future and the parameter must appear in the settings file.
MCrunch User’s Guide 4 Last revised on May 15, 2008 for Version 1.00
Load Roses We have yet to add load roses to MCrunch, but the Load Roses header line must
still be in the settings file.
Azimuth Averages We have yet to add azimuth averages to MCrunch, but the Azimuth Averages
header line must still be in the settings file. You may be able to use the Binning fea-ture (see Binning subsection) to generate azimuth averages.
Crosstalk Removal We have yet to add crosstalk removal to MCrunch, but the Crosstalk Removal
header line must still be in the settings file.
Peak Finding We have yet to add peak finding to MCrunch, but the Peak Finding header line
must still be in the settings file.
Statistics and Extreme Events MCrunch can generate the following statistics:
• Minimum • Mean • Maximum • Standard Deviation • Skewness • Maximum Range (Maximum-Minimum)
If you set WrStatsTxt to true, MCrunch will write a table of statistics for each input data file with a .stat extension. When there is more than one data file, MCrunch will use the aggregate of all the data to generate a statistics table and use the value of AggRoot followed by .stat to name the plain text file (if requested).
If you set WrStatsXLS to true, MCrunch will create an Excel workbook with one tab for each data file and one for the aggregate if you processed more than one data file. The tabs will have names using the root names of the data files and Aggregate for the aggregate statistics. MCrunch will use the root name of the settings file followed by _Stats.xls to name the workbook.
MCrunch can also create summary files of the statistics for selected channels. Set NumSFChans to the number of channels you want processed this way and list the channels on the SFChans line that follows. MCrunch generates files of statistics for each requested channel. The file names use the channel names for the root and .sums for the extension. Each summary file contains one line for each data file with the sta-tistics following on the line. The resulting files are plain text files. A future release will include an option for Excel workbooks.
MCrunch can also generate extreme-event tables. It creates one plain text file for each data file, plus another for the aggregate data if there are multiple data files. The file names use the roots of the data files followed by .extr. For the aggregates, it uses
the value of AggRoot followed by .extr. Within each output file, MCrunch writes one table for each extreme-event block. Each block has two lines for each tested chan-nel—one for the minimum and one for the maximum. The tables have one column for each tested channel, plus one for each information channel. The minima and maxima are not computed for information channels. These channels are available for channels such as time and wind speed so you know what they are when the extremes for the tested channels occur.
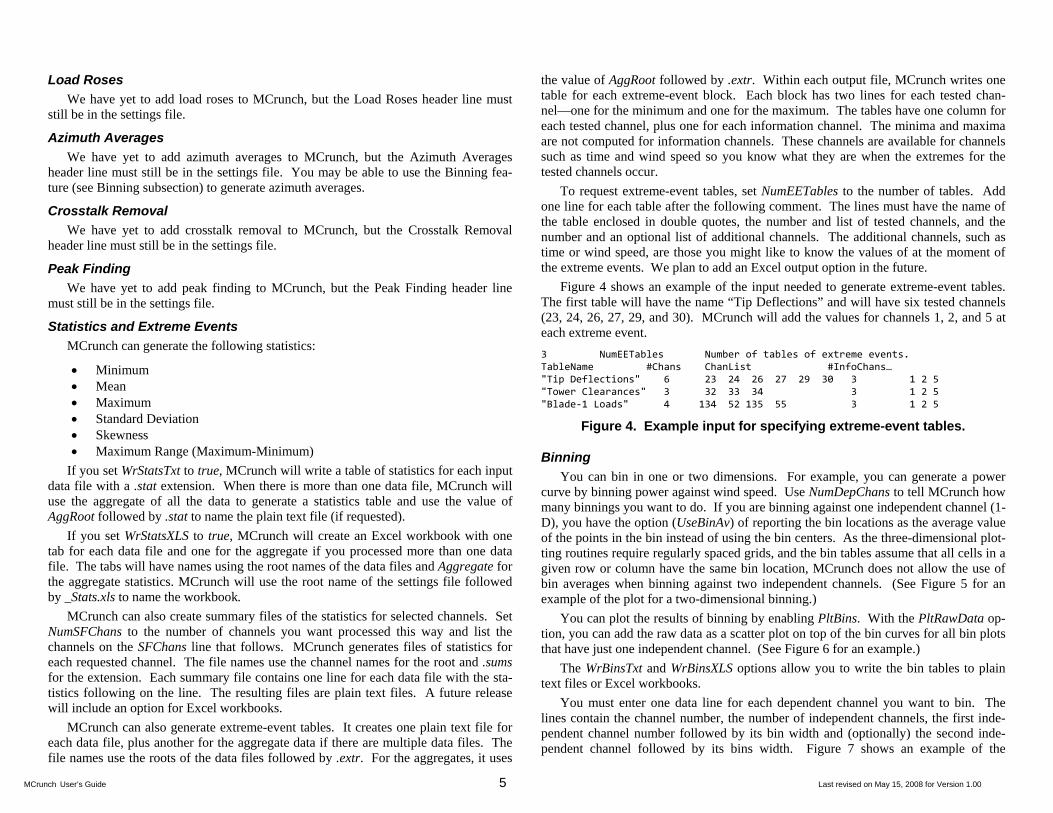
To request extreme-event tables, set NumEETables to the number of tables. Add one line for each table after the following comment. The lines must have the name of the table enclosed in double quotes, the number and list of tested channels, and the number and an optional list of additional channels. The additional channels, such as time or wind speed, are those you might like to know the values of at the moment of the extreme events. We plan to add an Excel output option in the future.
Figure 4 shows an example of the input needed to generate extreme-event tables. The first table will have the name “Tip Deflections” and will have six tested channels (23, 24, 26, 27, 29, and 30). MCrunch will add the values for channels 1, 2, and 5 at each extreme event. 3 NumEETables Number of tables of extreme events. TableName #Chans ChanList #InfoChans… "Tip Deflections" 6 23 24 26 27 29 30 3 1 2 5 "Tower Clearances" 3 32 33 34 3 1 2 5 "Blade‐1 Loads" 4 134 52 135 55 3 1 2 5
Figure 4. Example input for specifying extreme-event tables.
Binning You can bin in one or two dimensions. For example, you can generate a power
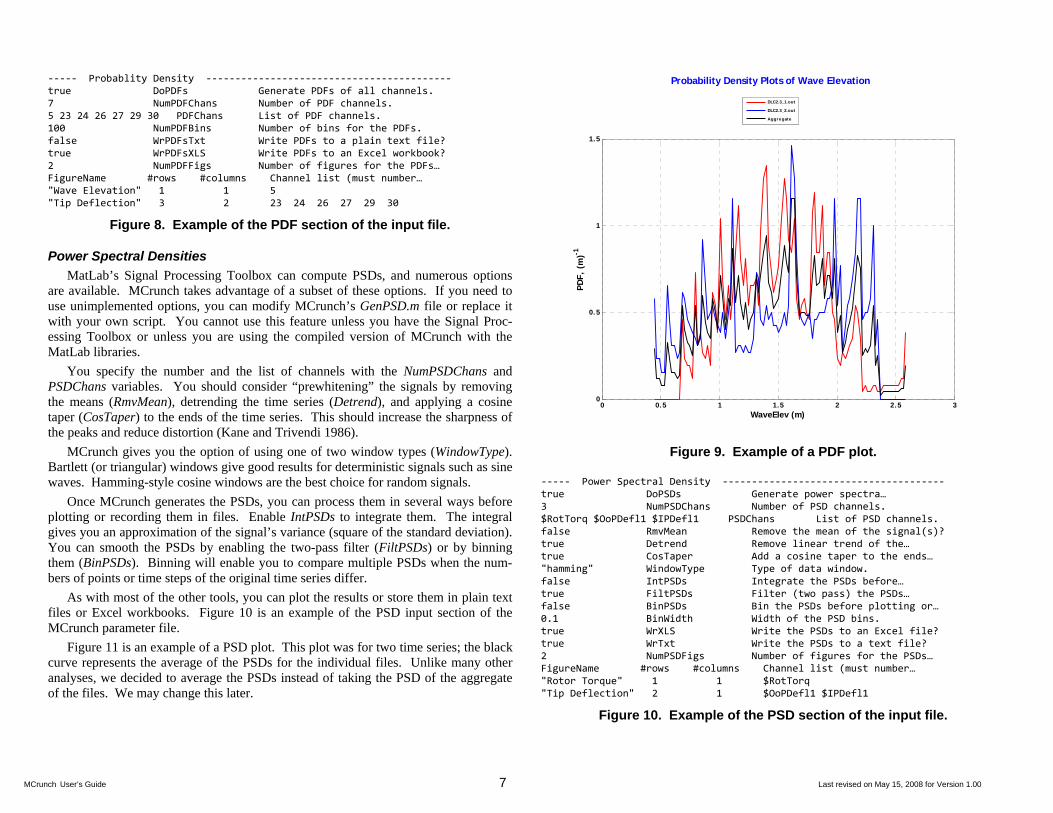
curve by binning power against wind speed. Use NumDepChans to tell MCrunch how many binnings you want to do. If you are binning against one independent channel (1-D), you have the option (UseBinAv) of reporting the bin locations as the average value of the points in the bin instead of using the bin centers. As the three-dimensional plot-ting routines require regularly spaced grids, and the bin tables assume that all cells in a given row or column have the same bin location, MCrunch does not allow the use of bin averages when binning against two independent channels. (See Figure 5 for an example of the plot for a two-dimensional binning.)
You can plot the results of binning by enabling PltBins. With the PltRawData op-tion, you can add the raw data as a scatter plot on top of the bin curves for all bin plots that have just one independent channel. (See Figure 6 for an example.)
The WrBinsTxt and WrBinsXLS options allow you to write the bin tables to plain text files or Excel workbooks.
You must enter one data line for each dependent channel you want to bin. The lines contain the channel number, the number of independent channels, the first inde-pendent channel number followed by its bin width and (optionally) the second inde-pendent channel followed by its bins width. Figure 7 shows an example of the
MCrunch User’s Guide 5 Last revised on May 15, 2008 for Version 1.00
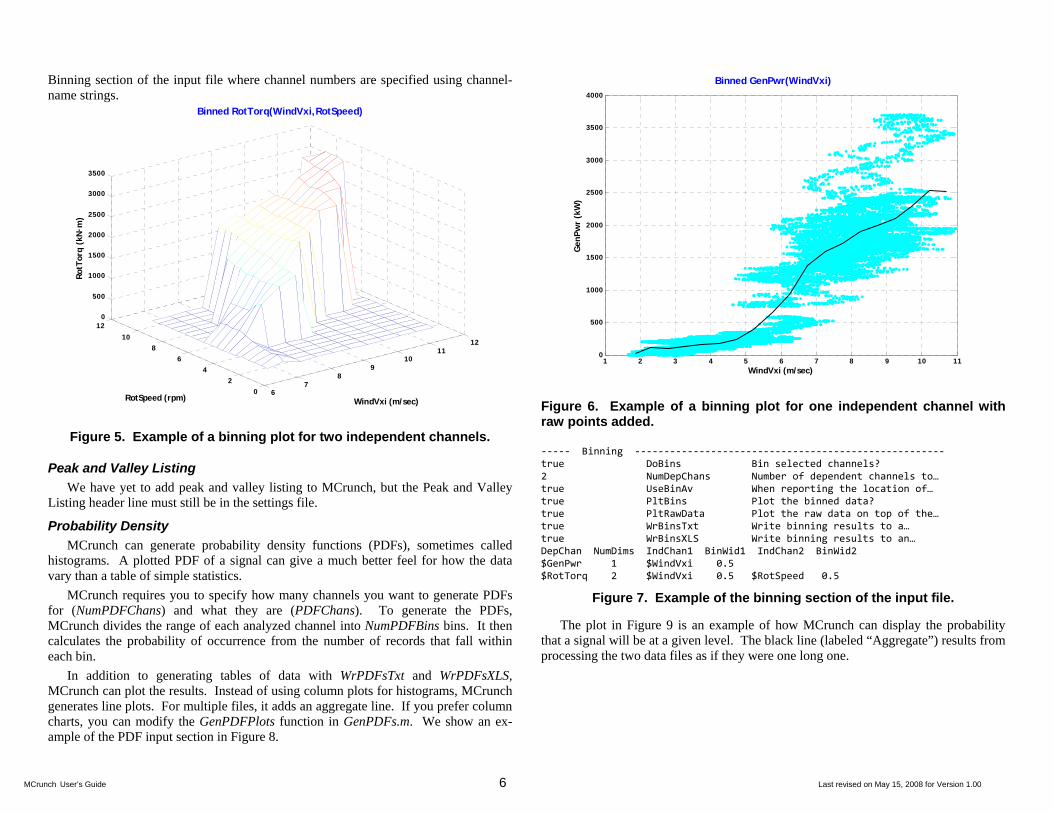
Binning section of the input file where channel numbers are specified using channel-name strings.
1 2 3 4 5 6 7 8 9 10 110
500
1000
1500
2000
2500
3000
3500
4000
WindVxi (m/sec)
Gen
Pwr
(kW
)
Binned GenPwr(WindVxi)
67
89
1011
12
02
46
810
120
500
1000
1500
2000
2500
3000
3500
WindVxi (m/sec)RotSpeed (rpm)
RotT
orq
(kN
·m)
Binned RotTorq(WindVxi,RotSpeed)
Figure 5. Example of a binning plot for two independent channels.
Peak and Valley Listing We have yet to add peak and valley listing to MCrunch, but the Peak and Valley
Listing header line must still be in the settings file.
Probability Density MCrunch can generate probability density functions (PDFs), sometimes called
histograms. A plotted PDF of a signal can give a much better feel for how the data vary than a table of simple statistics.
MCrunch requires you to specify how many channels you want to generate PDFs for (NumPDFChans) and what they are (PDFChans). To generate the PDFs, MCrunch divides the range of each analyzed channel into NumPDFBins bins. It then calculates the probability of occurrence from the number of records that fall within each bin.
In addition to generating tables of data with WrPDFsTxt and WrPDFsXLS, MCrunch can plot the results. Instead of using column plots for histograms, MCrunch generates line plots. For multiple files, it adds an aggregate line. If you prefer column charts, you can modify the GenPDFPlots function in GenPDFs.m. We show an ex-ample of the PDF input section in Figure 8.
Figure 6. Example of a binning plot for one independent channel with raw points added.
‐‐‐‐‐ Binning ‐‐‐‐‐‐‐‐‐‐‐‐‐‐‐‐‐‐‐‐‐‐‐‐‐‐‐‐‐‐‐‐‐‐‐‐‐‐‐‐‐‐‐‐‐‐‐‐‐‐‐‐‐ true DoBins Bin selected channels? 2 NumDepChans Number of dependent channels to… true UseBinAv When reporting the location of… true PltBins Plot the binned data? true PltRawData Plot the raw data on top of the… true WrBinsTxt Write binning results to a… true WrBinsXLS Write binning results to an… DepChan NumDims IndChan1 BinWid1 IndChan2 BinWid2 $GenPwr 1 $WindVxi 0.5 $RotTorq 2 $WindVxi 0.5 $RotSpeed 0.5
Figure 7. Example of the binning section of the input file.
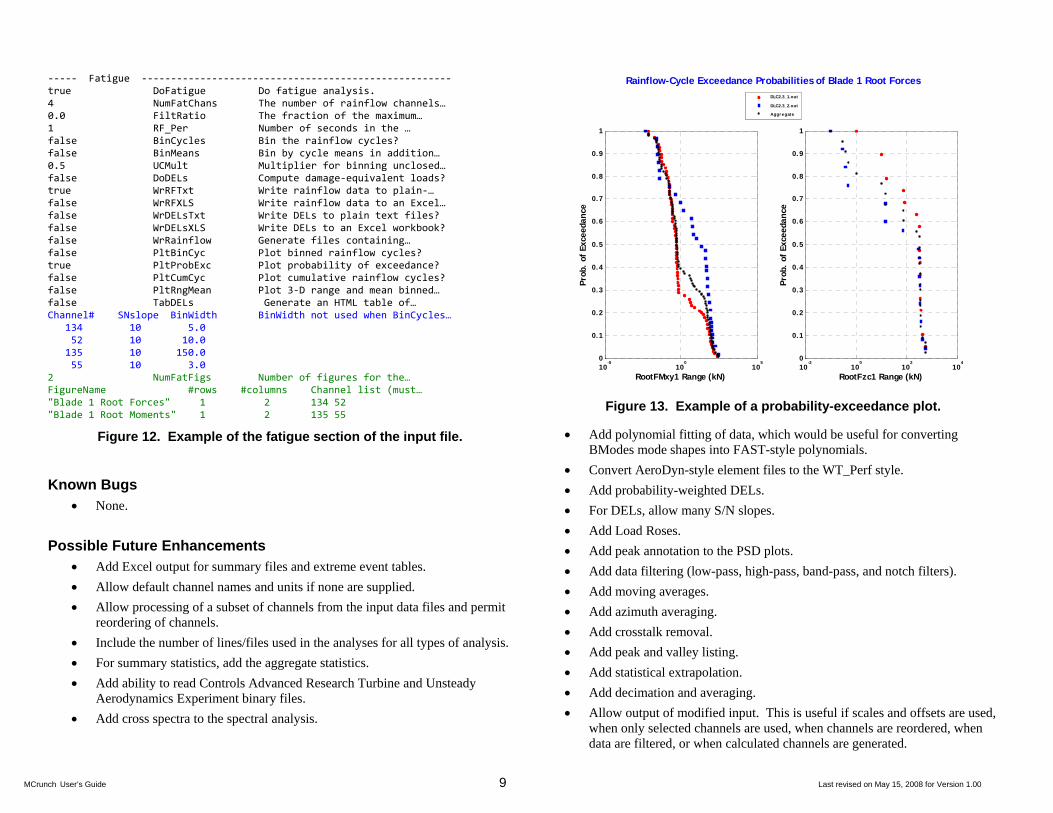
The plot in Figure 9 is an example of how MCrunch can display the probability that a signal will be at a given level. The black line (labeled “Aggregate”) results from processing the two data files as if they were one long one.
MCrunch User’s Guide 6 Last revised on May 15, 2008 for Version 1.00
‐‐‐‐‐ Probablity Density ‐‐‐‐‐‐‐‐‐‐‐‐‐‐‐‐‐‐‐‐‐‐‐‐‐‐‐‐‐‐‐‐‐‐‐‐‐‐‐‐‐‐
0 0.5 1 1.5 2 2.5 30
0.5
1
1.5
WaveElev (m)
PDF,
(m
)-1
DLC2.3_1.out
DLC2.3_2.out
Ag g reg ate
Probability Density Plots of Wave Elevationtrue DoPDFs Generate PDFs of all channels. 7 NumPDFChans Number of PDF channels. 5 23 24 26 27 29 30 PDFChans List of PDF channels. 100 NumPDFBins Number of bins for the PDFs. false WrPDFsTxt Write PDFs to a plain text file? true WrPDFsXLS Write PDFs to an Excel workbook? 2 NumPDFFigs Number of figures for the PDFs… FigureName #rows #columns Channel list (must number… "Wave Elevation" 1 1 5 "Tip Deflection" 3 2 23 24 26 27 29 30
Figure 8. Example of the PDF section of the input file.
Power Spectral Densities MatLab’s Signal Processing Toolbox can compute PSDs, and numerous options
are available. MCrunch takes advantage of a subset of these options. If you need to use unimplemented options, you can modify MCrunch’s GenPSD.m file or replace it with your own script. You cannot use this feature unless you have the Signal Proc-essing Toolbox or unless you are using the compiled version of MCrunch with the MatLab libraries.
You specify the number and the list of channels with the NumPSDChans and PSDChans variables. You should consider “prewhitening” the signals by removing the means (RmvMean), detrending the time series (Detrend), and applying a cosine taper (CosTaper) to the ends of the time series. This should increase the sharpness of the peaks and reduce distortion (Kane and Trivendi 1986).
MCrunch gives you the option of using one of two window types (WindowType). Bartlett (or triangular) windows give good results for deterministic signals such as sine waves. Hamming-style cosine windows are the best choice for random signals.
Once MCrunch generates the PSDs, you can process them in several ways before plotting or recording them in files. Enable IntPSDs to integrate them. The integral gives you an approximation of the signal’s variance (square of the standard deviation). You can smooth the PSDs by enabling the two-pass filter (FiltPSDs) or by binning them (BinPSDs). Binning will enable you to compare multiple PSDs when the num-bers of points or time steps of the original time series differ.
As with most of the other tools, you can plot the results or store them in plain text files or Excel workbooks. Figure 10 is an example of the PSD input section of the MCrunch parameter file.
Figure 11 is an example of a PSD plot. This plot was for two time series; the black curve represents the average of the PSDs for the individual files. Unlike many other analyses, we decided to average the PSDs instead of taking the PSD of the aggregate of the files. We may change this later.
Figure 9. Example of a PDF plot.
‐‐‐‐‐ Power Spectral Density ‐‐‐‐‐‐‐‐‐‐‐‐‐‐‐‐‐‐‐‐‐‐‐‐‐‐‐‐‐‐‐‐‐‐‐‐‐‐ true DoPSDs Generate power spectra… 3 NumPSDChans Number of PSD channels. $RotTorq $OoPDefl1 $IPDefl1 PSDChans List of PSD channels. false RmvMean Remove the mean of the signal(s)? true Detrend Remove linear trend of the… true CosTaper Add a cosine taper to the ends… "hamming" WindowType Type of data window. false IntPSDs Integrate the PSDs before… true FiltPSDs Filter (two pass) the PSDs… false BinPSDs Bin the PSDs before plotting or… 0.1 BinWidth Width of the PSD bins. true WrXLS Write the PSDs to an Excel file? true WrTxt Write the PSDs to a text file? 2 NumPSDFigs Number of figures for the PSDs… FigureName #rows #columns Channel list (must number… "Rotor Torque" 1 1 $RotTorq "Tip Deflection" 2 1 $OoPDefl1 $IPDefl1
Figure 10. Example of the PSD section of the input file.
MCrunch User’s Guide 7 Last revised on May 15, 2008 for Version 1.00
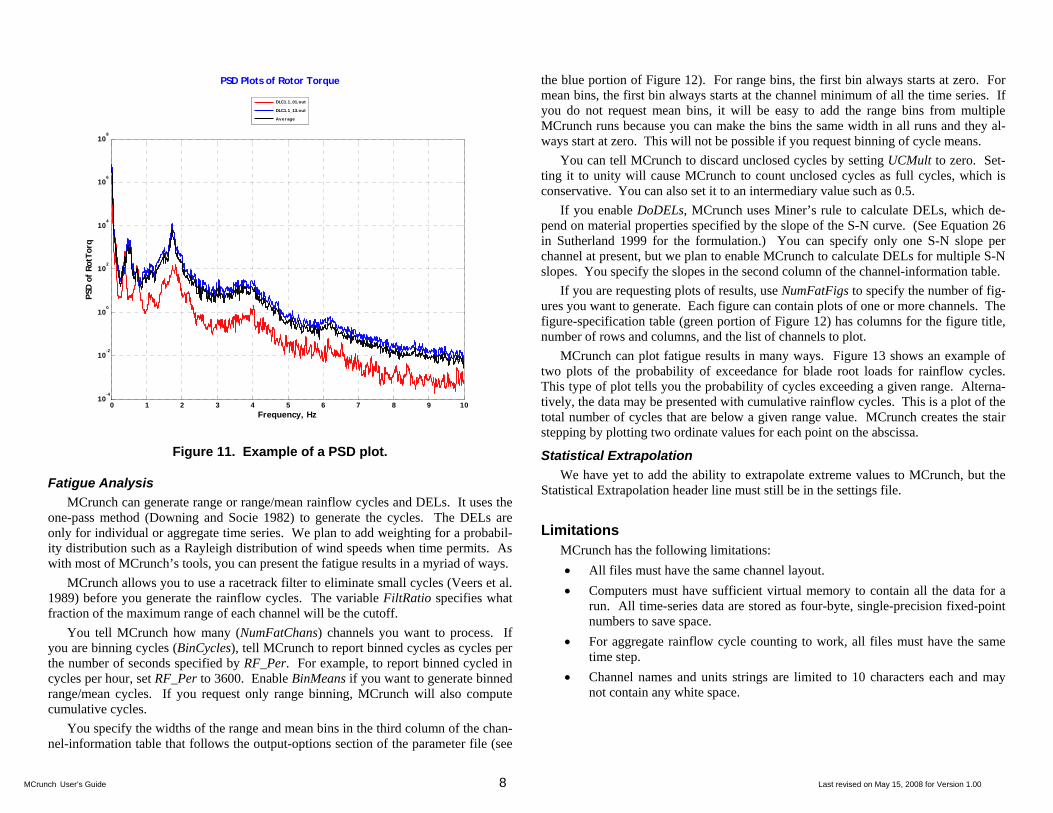
Figure 11. Example of a PSD plot.
Fatigue Analysis MCrunch can generate range or range/mean rainflow cycles and DELs. It uses the
one-pass method (Downing and Socie 1982) to generate the cycles. The DELs are only for individual or aggregate time series. We plan to add weighting for a probabil-ity distribution such as a Rayleigh distribution of wind speeds when time permits. As with most of MCrunch’s tools, you can present the fatigue results in a myriad of ways.
MCrunch allows you to use a racetrack filter to eliminate small cycles (Veers et al. 1989) before you generate the rainflow cycles. The variable FiltRatio specifies what fraction of the maximum range of each channel will be the cutoff.
You tell MCrunch how many (NumFatChans) channels you want to process. If you are binning cycles (BinCycles), tell MCrunch to report binned cycles as cycles per the number of seconds specified by RF_Per. For example, to report binned cycled in cycles per hour, set RF_Per to 3600. Enable BinMeans if you want to generate binned range/mean cycles. If you request only range binning, MCrunch will also compute cumulative cycles.
You specify the widths of the range and mean bins in the third column of the chan-nel-information table that follows the output-options section of the parameter file (see
the blue portion of Figure 12). For range bins, the first bin always starts at zero. For mean bins, the first bin always starts at the channel minimum of all the time series. If you do not request mean bins, it will be easy to add the range bins from multiple MCrunch runs because you can make the bins the same width in all runs and they al-ways start at zero. This will not be possible if you request binning of cycle means.
0 1 2 3 4 5 6 7 8 9 1010
-4
10-2
100
102
104
106
108
Frequency, Hz
PSD
of
RotT
orq
DLC1.1_01.out
DLC1.1_13.out
A verag e
PSD Plots of Rotor Torque
You can tell MCrunch to discard unclosed cycles by setting UCMult to zero. Set-ting it to unity will cause MCrunch to count unclosed cycles as full cycles, which is conservative. You can also set it to an intermediary value such as 0.5.
If you enable DoDELs, MCrunch uses Miner’s rule to calculate DELs, which de-pend on material properties specified by the slope of the S-N curve. (See Equation 26 in Sutherland 1999 for the formulation.) You can specify only one S-N slope per channel at present, but we plan to enable MCrunch to calculate DELs for multiple S-N slopes. You specify the slopes in the second column of the channel-information table.
If you are requesting plots of results, use NumFatFigs to specify the number of fig-ures you want to generate. Each figure can contain plots of one or more channels. The figure-specification table (green portion of Figure 12) has columns for the figure title, number of rows and columns, and the list of channels to plot.
MCrunch can plot fatigue results in many ways. Figure 13 shows an example of two plots of the probability of exceedance for blade root loads for rainflow cycles. This type of plot tells you the probability of cycles exceeding a given range. Alterna-tively, the data may be presented with cumulative rainflow cycles. This is a plot of the total number of cycles that are below a given range value. MCrunch creates the stair stepping by plotting two ordinate values for each point on the abscissa.
Statistical Extrapolation We have yet to add the ability to extrapolate extreme values to MCrunch, but the
Statistical Extrapolation header line must still be in the settings file.
Limitations MCrunch has the following limitations: • All files must have the same channel layout. • Computers must have sufficient virtual memory to contain all the data for a
run. All time-series data are stored as four-byte, single-precision fixed-point numbers to save space.
• For aggregate rainflow cycle counting to work, all files must have the same time step.
• Channel names and units strings are limited to 10 characters each and may not contain any white space.
MCrunch User’s Guide 8 Last revised on May 15, 2008 for Version 1.00
‐‐‐‐‐ Fatigue ‐‐‐‐‐‐‐‐‐‐‐‐‐‐‐‐‐‐‐‐‐‐‐‐‐‐‐‐‐‐‐‐‐‐‐‐‐‐‐‐‐‐‐‐‐‐‐‐‐‐‐‐‐
10-5
100
105
0
0.1
0.2
0.3
0.4
0.5
0.6
0.7
0.8
0.9
1
RootFMxy1 Range (kN)
Prob
. of
Exc
eeda
nce
10-2
100
102
104
0
0.1
0.2
0.3
0.4
0.5
0.6
0.7
0.8
0.9
1
RootFzc1 Range (kN)
Prob
. of
Exc
eeda
nce
DLC2.3_1.out
DLC2.3_2.out
Ag g reg ate
Rainflow-Cycle Exceedance Probabilities of Blade 1 Root Forcestrue DoFatigue Do fatigue analysis. 4 NumFatChans The number of rainflow channels… 0.0 FiltRatio The fraction of the maximum… 1 RF_Per Number of seconds in the … false BinCycles Bin the rainflow cycles? false BinMeans Bin by cycle means in addition… 0.5 UCMult Multiplier for binning unclosed… false DoDELs Compute damage‐equivalent loads? true WrRFTxt Write rainflow data to plain‐… false WrRFXLS Write rainflow data to an Excel… false WrDELsTxt Write DELs to plain text files? false WrDELsXLS Write DELs to an Excel workbook? false WrRainflow Generate files containing… false PltBinCyc Plot binned rainflow cycles? true PltProbExc Plot probability of exceedance? false PltCumCyc Plot cumulative rainflow cycles? false PltRngMean Plot 3‐D range and mean binned… false TabDELs Generate an HTML table of… Channel# SNslope BinWidth BinWidth not used when BinCycles… 134 10 5.0 52 10 10.0 135 10 150.0 55 10 3.0 2 NumFatFigs Number of figures for the… FigureName #rows #columns Channel list (must… "Blade 1 Root Forces" 1 2 134 52 "Blade 1 Root Moments" 1 2 135 55
Figure 12. Example of the fatigue section of the input file.
Known Bugs • None.
Possible Future Enhancements • Add Excel output for summary files and extreme event tables. • Allow default channel names and units if none are supplied. • Allow processing of a subset of channels from the input data files and permit
reordering of channels. • Include the number of lines/files used in the analyses for all types of analysis. • For summary statistics, add the aggregate statistics. • Add ability to read Controls Advanced Research Turbine and Unsteady
Aerodynamics Experiment binary files. • Add cross spectra to the spectral analysis.
Figure 13. Example of a probability-exceedance plot.
• Add polynomial fitting of data, which would be useful for converting BModes mode shapes into FAST-style polynomials.
• Convert AeroDyn-style element files to the WT_Perf style. • Add probability-weighted DELs. • For DELs, allow many S/N slopes. • Add Load Roses. • Add peak annotation to the PSD plots. • Add data filtering (low-pass, high-pass, band-pass, and notch filters). • Add moving averages. • Add azimuth averaging. • Add crosstalk removal. • Add peak and valley listing. • Add statistical extrapolation. • Add decimation and averaging. • Allow output of modified input. This is useful if scales and offsets are used,
when only selected channels are used, when channels are reordered, when data are filtered, or when calculated channels are generated.
MCrunch User’s Guide 9 Last revised on May 15, 2008 for Version 1.00
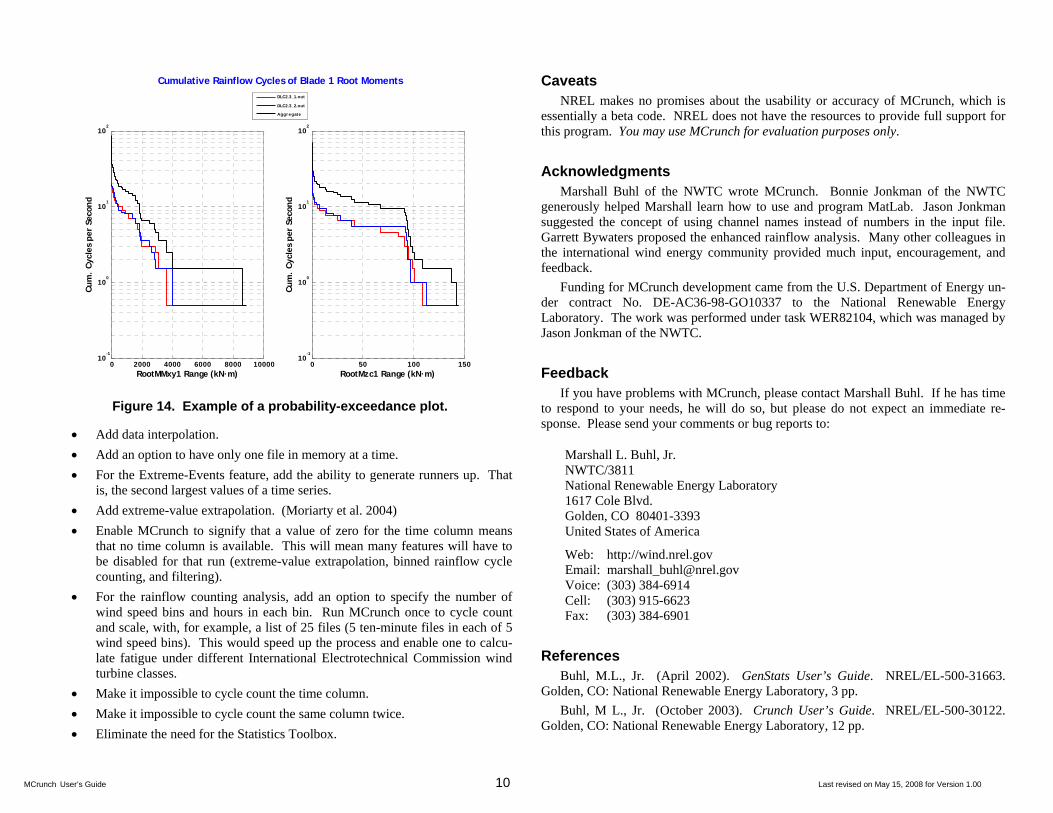
Figure 14. Example of a probability-exceedance plot.
• Add data interpolation. • Add an option to have only one file in memory at a time. • For the Extreme-Events feature, add the ability to generate runners up. That
is, the second largest values of a time series. • Add extreme-value extrapolation. (Moriarty et al. 2004) • Enable MCrunch to signify that a value of zero for the time column means
that no time column is available. This will mean many features will have to be disabled for that run (extreme-value extrapolation, binned rainflow cycle counting, and filtering).
• For the rainflow counting analysis, add an option to specify the number of wind speed bins and hours in each bin. Run MCrunch once to cycle count and scale, with, for example, a list of 25 files (5 ten-minute files in each of 5 wind speed bins). This would speed up the process and enable one to calcu-late fatigue under different International Electrotechnical Commission wind turbine classes.
• Make it impossible to cycle count the time column. • Make it impossible to cycle count the same column twice. • Eliminate the need for the Statistics Toolbox.
Caveats
0 2000 4000 6000 8000 1000010
-1
100
101
102
RootMMxy1 Range (kN·m)
Cum
. Cy
cles
per
Sec
ond
0 50 100 15010
-1
100
101
102
RootMzc1 Range (kN·m)
Cum
. Cy
cles
per
Sec
ond
DLC2.3_1.out
DLC2.3_2.out
Ag g reg ate
Cumulative Rainflow Cycles of Blade 1 Root Moments
NREL makes no promises about the usability or accuracy of MCrunch, which is essentially a beta code. NREL does not have the resources to provide full support for this program. You may use MCrunch for evaluation purposes only.
Acknowledgments Marshall Buhl of the NWTC wrote MCrunch. Bonnie Jonkman of the NWTC
generously helped Marshall learn how to use and program MatLab. Jason Jonkman suggested the concept of using channel names instead of numbers in the input file. Garrett Bywaters proposed the enhanced rainflow analysis. Many other colleagues in the international wind energy community provided much input, encouragement, and feedback.
Funding for MCrunch development came from the U.S. Department of Energy un-der contract No. DE-AC36-98-GO10337 to the National Renewable Energy Laboratory. The work was performed under task WER82104, which was managed by Jason Jonkman of the NWTC.
Feedback If you have problems with MCrunch, please contact Marshall Buhl. If he has time
to respond to your needs, he will do so, but please do not expect an immediate re-sponse. Please send your comments or bug reports to:
Marshall L. Buhl, Jr. NWTC/3811 National Renewable Energy Laboratory 1617 Cole Blvd. Golden, CO 80401-3393 United States of America
Web: http://wind.nrel.gov Email: [email protected] Voice: (303) 384-6914 Cell: (303) 915-6623 Fax: (303) 384-6901
References Buhl, M.L., Jr. (April 2002). GenStats User’s Guide. NREL/EL-500-31663.
Golden, CO: National Renewable Energy Laboratory, 3 pp. Buhl, M L., Jr. (October 2003). Crunch User’s Guide. NREL/EL-500-30122.
Golden, CO: National Renewable Energy Laboratory, 12 pp.
MCrunch User’s Guide 10 Last revised on May 15, 2008 for Version 1.00
MCrunch User’s Guide 11 Last revised on May 15, 2008 for Version 1.00
Buhl, M.L., Jr.; Weaver, N.L. (July 1999). GPP Version 6 User’s Guide. NREL/TP-500-25815. Golden, CO: National Renewable Energy Laboratory, 42 pp.
Downing, S.D.; Socie, D.F. (1982). “Simple Rainflow Counting Algorithms.” International Journal of Fatigue; Vol. 4, [N.1], pp. 31–40.
Kane, R.P.; Trivendi, N.B. (1986). “Effects of Linear Trend and Mean Value on Maximum Entropy Spectral Analysis.” Proceedings of the Indian Academy of Sciences: Earth and Planetary Sciences, Vol. 95, No. 2, pp. 201–208.
Moriarty, P.J.; Holley, W.E.; Butterfield, S.P. (2004). Extrapolation of Extreme and Fatigue Loads Using Probabilistic Methods. NREL/TP-500-34421. Golden, CO: National Renewable Energy Laboratory, 32 pp.
Sutherland, H.J. (1999). On the Fatigue Analysis of Wind Turbines. SAND99-0089. Albuquerque, NM: Sandia National Laboratories.
The MathWorks. “The MathWorks – MatLab and Simulink for Technical Com-puting.” http://www.mathworks.com. Accessed March 28, 2008.
Veers, P.S.; Winterstein, S.R.; Nelson, D.V.; Cornell, C.A. (1989). “Variable Amplitude Load Models for Fatigue Damage and Crack Growth.” Potter, J.M. and Watanabe, R.T., eds. Development of Fatigue Loading Spectra, ASTM STP 1006, p. 172.