Embed Size (px)
Citation preview
Applied Engineering in Agriculture
Vol. 23(6): 747‐755 � 2007 American Society of Agricultural and Biological Engineers ISSN 0883-8542 747
EVALUATION OF NUTRIENT MANAGEMENT PLANS USING AN INTEGRATED MODELING APPROACH
M. A. Thomas, B. A. Engel, M. Arabi, T. Zhai, R. Farnsworth, J. R. Frankenberger
ABSTRACT. Agricultural best management practices (BMPs) are implemented to abate nonpoint source (NPS) pollution.Evaluation of these conservation practices requires an approach that can account for the complexities of natural systems.The overall goal of this research was to quantify changes in nutrients reaching water sources attributable to the nutrientmanagement portion of the Natural Resources Conservation Service (NRCS) Environmental Quality Incentives Program(EQIP) as implemented in Indiana. A modeling framework, composed of a nonpoint source pollution model(GLEAMS‐NAPRA) and geographic information system (GIS), was used to estimate annual nutrient loading reduction dueto nutrient management plans funded by EQIP in 2005.
The GLEAMS‐NAPRA model results indicated that nutrient management plans could potentially reduce field‐scale nitrateloadings to water by 33%. At the scale of the 8‐digit hydrologic unit (HUC), county and state, the estimated annual reductionin nitrate attributed to funded 2005 EQIP nutrient management plans was less than 1%. This study also shows that ahydrologic/water quality model, such as GLEAMS‐NAPRA, could potentially serve as a tool to better target nutrientmanagement applicants while improving EQIP's resource allocation. The estimated nutrient loading reduction maps createdfor Indiana could aid the NRCS and other organizations in better targeting nutrient management to maximize the benefitsof program resources.
Keywords. Best management practices, Nutrient losses, Geographical information systems, Modeling, GLEAMS, Nonpointsource pollution, Water quality, EQIP.
The U.S. Department of Agriculture (USDA)Natural Resources Conservation Service (NRCS)has implemented numerous conservation programsand activities aimed at improving environmental
quality while sustaining economic development andagricultural productivity. The Farm Security and RuralInvestment Act of 2002 authorized $9 billion for the NRCSEnvironmental Quality Incentives Program (EQIP) tosupport producers who voluntarily implement approvedconservation practices. EQIP promotes the dual objectives ofprofitable agricultural production and environmentalprotection through cost‐share funds and incentive paymentsto ranchers and producers. Practices must conform to NRCSstandards as described in the Electronic Field OfficeTechnical Guide (eFOTG).
Submitted for review in January 2007 as manuscript number SW 6834;approved for publication by the Soil & Water Division of ASABE in August2007.
The authors are Mark A. Thomas, ASABE Member Engineer,Graduate Student, Department of Agricultural and Biological Engineering,Purdue University, West Lafayette, Indiana; Bernard A. Engel, ASABEMember Engineer, Professor, Department of Agricultural and BiologicalEngineering, Purdue University, West Lafayette, Indiana; Mazdak Arabi,ASABE Member Engineer, Post Doc, Department of Agricultural andBiological Engineering. Purdue University, West Lafayette, Indiana; TongZhai, Post Doc, Department of Agricultural and Biological Engineering.Purdue University, West Lafayette, Indiana; Richard Farnsworth,Associate Professor, Department of Forestry and Natural Resources.Purdue University, West Lafayette, Indiana; and Jane R. Frankenberger,ASABE Member Engineer, Professor, Department of Agricultural andBiological Engineering. Purdue University, West Lafayette, Indiana.Corresponding author: Bernard A. Engel, 225 S. University St., WestLafayette, IN 47907‐2093; phone: 765‐494‐1162; fax: 765‐496‐1115;e‐mail: [email protected].
Each year, participating state NRCS offices hold acompetitive signup process and encourage producers toapply for possible enrollment and funding. The stateallocation of EQIP funds is guided by national and statepriorities that are embedded in a scoring system to evaluatesubmitted applications (USDA‐NRCS, 2005). Among thenational priorities of EQIP is the reduction of nonpoint sourcepollution such as nutrients, sediments, pesticides, and excesssalinity in impaired watersheds consistent with TotalMaximum Daily Load (TMDL) goals (USDA‐NRCS, 2005).Indiana NRCS established scoring variables to representthose national priorities.
The Indiana NRCS collaborated with Purdue Universityand developed E‐SCORE, a secure, web‐based program(http://pasture.ecn.purdue.edu/~eqip/E‐SCORE_DEMO/main_menu.cgi) for scoring, ranking, and storing EQIPapplications within Indiana. The EQIP system allocatescost‐share funds and incentive payments based on resourceconcerns and scoring rules. Although the scoring ruleschange periodically, they remain subjective. The evaluationof EQIP applicants using the E‐SCORE system is based ona ranking process which gives higher priorities to applicantswhose proposed plans would have higher scores which, tosome extent, represent environmental benefits. However, thescoring system was based on expert opinion and theseenvironmental benefits have not been validated.
Cost‐share programs, technical assistance, and educationare strategies employed to promote the use of practices thatwill reduce nutrients and sediments, thereby abatingagricultural nonpoint source pollution (Boesch et al., 2001).Over the years, the Natural Resources Conservation Services(NRCS) has implemented several conservation programsaimed at improving the environment while sustaining
T
748 APPLIED ENGINEERING IN AGRICULTURE
agricultural productivity and economic development.Currently there are 91 conservation practices in the eFOTGs,referenced by EQIP, that describe structural and managementBMPs for livestock and non‐livestock practices. The nutrientmanagement plan (NRCS practice code 590) is one of themany EQIP BMPs available to agricultural producers.Nutrient management is defined as managing the amount,source, placement, form, and timing of the application ofplant nutrients and soil amendments. The purpose of thenutrient management plan is to minimize agriculturalnonpoint source pollution to surface and ground watersources and to maintain or improve the chemical, biological,and physical structure of the soil (USDA‐NRCS, 2005).
In the Midwestern United States, arable lands arecommonly used for the production of corn and soybeans.Generally, commercial fertilizer is used to enhance or sustainprofitable crop production. Producers often apply more thanthe required amount of fertilizer in order to attain higheryields, which may translate to increased revenues. Excessivefertilization of agricultural lands often results in pollution ofwater sources via runoff, leaching and sediment transfer.Pollution from Midwest agricultural fields contributes to thecontamination of surface and ground water sources as well ashypoxia in the Gulf of Mexico (Bakhsh and Kanwar, 2001;Power et al., 2001). These increasing environmentalconcerns have caused researchers and federal agencies tofocus on altering the rate of chemical input usage inagriculture as a passive method for environmentalimprovement (Hertel et al., 1996).
OBJECTIVESThe overall goal of this research was to quantify changes
in nutrients reaching surface water and shallow ground watersources for the Indiana participants in the nutrientmanagement portion of the NRCS EQIP. The estimates ofnutrient loading reductions were used to address the researchquestions: What are the estimated spatial variations innutrient loadings across the state of Indiana from croppedareas? What are the field‐scale, watershed‐scale, countylevel, and state reductions in nitrate loadings byimplementing the 2005 EQIP funded nutrient managementplans? Were 2005 EQIP applicants selected for funding in theregions where the nitrate loading reduction would be thegreatest? Would there be additional nitrate loadingreductions by targeting EQIP nutrient management planapplicants based on hydrologic/water quality model results?
MODELING BEST MANAGEMENT PRACTICES
Computer models represent an intermediate step inunderstanding changes in nonpoint source levels and may beuseful in improving EQIP's resource allocations, prior to anyin‐field monitoring. The use of computer models to forecastnaturally occurring conditions (e.g., daily precipitation andhurricane paths) have become prevalent in thedecision‐making process of today's society. Models havebeen proven valuable in cases where data are limited orunavailable (Tim, 1996). Computer simulation can reducetime, is relatively inexpensive, and is an environmentallysafe technique to evaluate the effects of agriculturalmanagement practices on surface and subsurface watersources (Mahmood et al., 2002).
Numerous computer models, with applications foragriculture, have been developed to predict pollutants suchas pesticides, fertilizers, and sediments reaching regionalsurface and subsurface water sources. Traditionally, themodels are used to evaluate the impact of BMPs such asgrassed waterways, filter strips, and buffer strips at field‐ andwatershed‐scales (e.g., Vaché et al., 2002). Researchers haveused models such as Groundwater Loading Effects ofAgricultural Management Systems (GLEAMS) (Leonard etal., 1987), Soil Water Assessment Tool (SWAT) (Arnold etal., 1998), and Environmental Policy Integrated Climate(EPIC) (Williams et al., 1990) to simulate the environmentalimpacts of management and structural best managementpractices (Arabi et al., 2006).
The GLEAMS model was selected to perform waterquality simulation of agricultural BMPs due to the modelingscale (statewide), research time‐frame, and the model'sbroad‐scale batch run capabilities. The GLEAMS model wasdeveloped to simulate the edge‐of‐field andbottom‐of‐root‐zone loadings of water, sediment, pesticides,and plant nutrients (Leonard et al., 1987). Hydrology,erosion, nutrient, and pesticides are four major componentsof the GLEAMS model. The model incorporates varioushydrological processes, such as infiltration, runoff, soilevaporation, plant transpiration, rainfall/irrigation, snowmelt, and soil water movement within the root zone (Leonardet al., 1987). GLEAMS can be used to perform regionalsimulations by dividing regions into smaller “representative”fields based on National Agricultural Statistics Service(NASS) land use data (Lim and Engel, 2003). The plantnutrient component of GLEAMS considers the complexity ofthe nitrogen and phosphorus cycles. The model accounts fordaily, monthly or yearly nitrate‐nitrogen andammonia‐nitrogen loadings to surface runoff, leached andbound to sediments (Knisel and Davis, 2000). Complexmodels such as GLEAMS have been used in conjunction withGIS to retrieve and manipulate data to new formats (Lim,2001).
The National Agricultural Pesticide Risk Analysis(NAPRA) model was extended and now includes a nutrientcomponent (Lim and Engel, 2003). The NAPRA model usesGLEAMS as the core model to simulate nutrient loadings andcan perform simulations for county or watershed areas fornutrient loadings to surface and shallow ground water(Bagdon et al., 1994; Lim and Engel, 2003). Thepostprocessor of the NAPRA model aggregates and convertsGLEAMS output into time series data which can beexternally linked to GIS layers associated with STATSGOsoil units to display spatial information.
METHODOLOGYThe methodology employed to evaluate the water quality
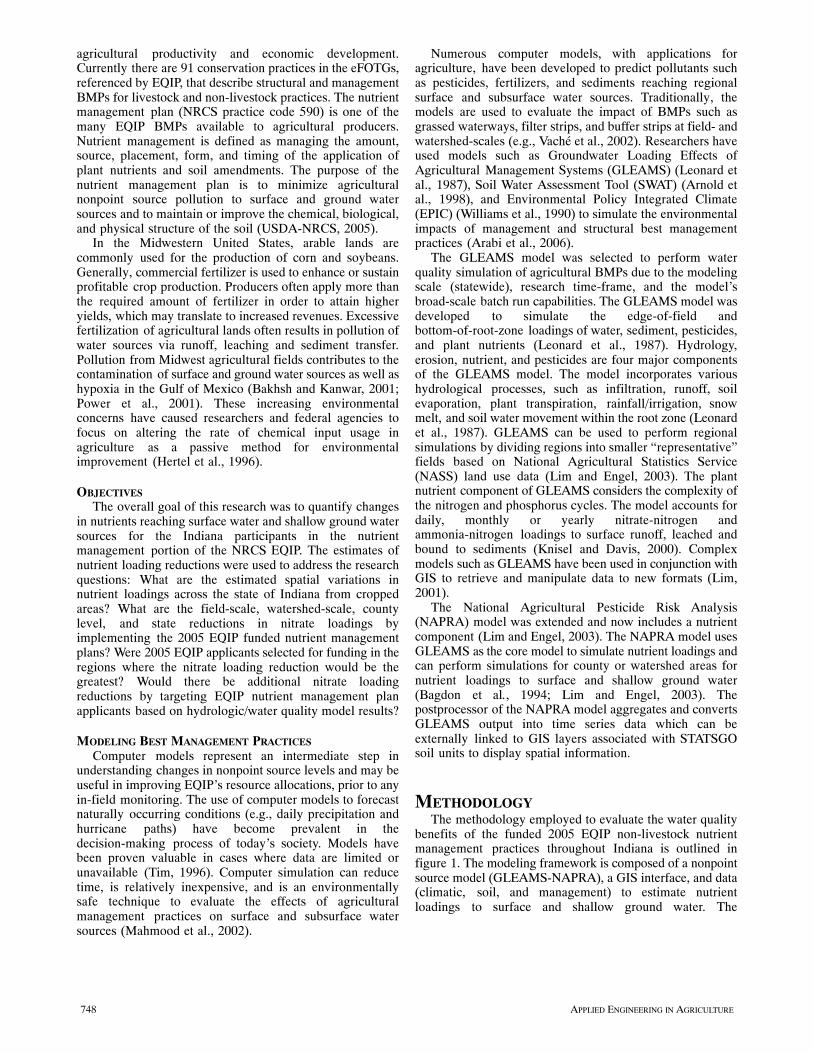
benefits of the funded 2005 EQIP non‐livestock nutrientmanagement practices throughout Indiana is outlined infigure 1. The modeling framework is composed of a nonpointsource model (GLEAMS‐NAPRA), a GIS interface, and data(climatic, soil, and management) to estimate nutrientloadings to surface and shallow ground water. The
749Vol. 23(6): 747‐755
Pre-BMP(USDA
surveyed data)
ÇÇÇÇÇÇÇÇÇÇÇÇ
Pre-BMP(USDA
surveyed data)
Nutrient Output(per soil unit)ÓÓÓÓÓÓÓÓNutrient Output
(per soil unit)
NPS Model(GLEAMS-NAPRA)
ÇÇÇÇÇÇÇÇÇÇÇÇ
NPS Model(GLEAMS-NAPRA)
Nutrient Output(per soil unit)ÓÓÓÓÓÓÓÓ
Nutrient Output(per soil unit)
NPS Model(GLEAMS-NAPRA)
ÇÇÇÇÇÇÇÇÇÇÇÇ
NPS Model(GLEAMS-NAPRA)
Post-BMP(Tri-state rates)
ÓÓÓÓÓÓÓÓÓÓÓÓ
Post-BMP(Tri-state rates)
Difference
ÇÇÇÇÇÇÇÇÇÇÇÇ
Difference
Nutrient LossReductionÇÇÇÇÇÇÇÇ
Nutrient LossReduction
SOIL
CLIMATE
Figure 1. GLEAMS‐NAPRA modeling approach for estimating EQIPnutrient loading reduction. Tri‐state rates are recommended fertilizerapplication rates for corn in Indiana, Ohio and Michigan (Vitosh et al.,1995; USDA‐NRCS, 2006).
GLEAMS‐NAPRA model was applied to estimate statewidenutrient loadings to surface water and shallow ground waterbefore and after implementation of nutrient managementplans (NRCS practice code 590). Numerous scenarios weresimulated based on varying fertilizer application rates. In thepre‐BMP scenario, nutrient application rates were based on5 years of USDA‐surveyed field data throughout Indiana(USDA‐ERS, 1990‐1995). This represented the baselinescenario or pre‐best management practices for nutrientapplication. In the post‐BMP scenario, nutrient applicationrates were based on Indiana extension recommendations(Tri‐State fertilizer recommendation; Vitosh et al., 1995)associated with crop potential yields. The difference in thescenarios was used to estimate the field‐scale water qualitybenefits of implementing nutrient management plans (fig. 1).
CLIMATE DATA
Continuous daily precipitation and temperature, requiredclimatic inputs for the GLEAMS‐NAPRA model, weregenerated by the modified Climate Generator (CLIGEN‐v5)(Nicks et. al, 1995) for Marion County, Indiana (center ofstate). CLIGEN, a stochastic weather generator, has beenproven adequate in generating daily precipitation andtemperature from observed historical data associated withweather stations (Elliot and Arnold, 2001; Yu, 2002; Zhangand Garbrecht, 2003). In all model simulations, the samelong‐term precipitation and temperature data generated for a60‐year period were used.
SOILS DATA
The STATSGO (1:250,000) soil database (USDA‐NRCS,1995) was used to obtain required properties of Indiana soil.STATSGO soils are composed of map unit identifiers(muids), each of which has a set of up to 21 components(USDA‐NRCS, 1995). The components contain physical andchemical properties' data for each soil unit. TheGLEAMS‐NAPRA model simulated nutrient loading to theedge‐of‐field or bottom‐of‐root‐zone for each of thecomponents. Simulated results for each component wereaggregated by a weighted approach to obtain output valuesfor each STATSGO soil unit.
MANAGEMENT INPUTSTable 1 shows the agricultural management inputs used to
simulate nutrient loadings. Thomas (2006) provides detailson the method used to obtain application rates correspondingto the 90th percentile distribution (222 N kg/ha and 125 P2O5kg/ha) of fertilizer application rates for Indiana producers.Nitrogen application rates of 222 N kg/ha on corn weregenerally considered high and were likely to increase thenitrate levels in surface and shallow ground water (Brouderet al., 2005). Based on the assumption that EQIP providedsupport primarily to producers that over‐apply commercialfertilizers, analyses of EQIP nutrient management plans werefocused at the nitrate reduction for higher baselineapplication rates.
Planting, harvesting, and maturity dates were based on thetypical median dates from the Indiana Agricultural StatisticsReport (Indiana Agricultural Statistics, 2000‐2004).Cropping management input data, such as planting date,harvesting date, maturity date, method of fertilizerapplication, fertilizer type, and tillage method were the samefor both the pre‐ and post‐BMP scenarios. Corn‐soybeanrotation was the cropping system used since it was thedominant rotation of Indiana agricultural producers, asindicated by analysis of NASS data (2002‐2004). The croprotation used in the model was corn in one‐year followed bysoybean the next year.
To represent the general pre‐BMP behavioral practice ofIndiana producers eligible for EQIP nutrient managementplan implementation, application rates in model simulationswere not adjusted for added nitrogen from soybeans in croprotation systems. This representation was based on responsesto a question posed in the 1995 USDA Cropping PracticesSurveys, in which 73% of Indiana producers indicated thatthey did not adjust fertilizer application rates when theprevious year's crop was soybean. Extensionrecommendations in Indiana are to adjust nitrogenapplication when the previous year's crop was soybean.
Post‐BMP application rates for corn were based onextension fertilizer recommendations for Indiana (Vitoshet al., 1995), which uses the following relationship:
N = -27 + (1.36 × Cwy) - N credit (1)
whereN = nitrogen fertilizer application rate (lb/acre)Cwy = yield potential units (bu/acre)
Table 1. Management inputs used in GLEAMS‐NAPRA simulations.
Description Corn Input Soybean Input
Planting date 6 May 24 May
Maturity date 15 September 10 September
Harvest date 14 October 7 October
Tillage Fall chisel/springdisk
Fall chisel/spring disk
Root zone depth 76 cm 76 cm
Slope length 30 m 30 m
Nitrogen application date 5 May -
Nitrogen application rate (pre‐BMP)
222 N kg/ha -
P2O5 application date 6 May -
P2O5 application rate(pre‐BMP)
125 P2O5 kg/ha -
750 APPLIED ENGINEERING IN AGRICULTURE
N credits: soybeans = 30 lb/acre, grass sod/pastures = 40lb/acre, annual legume cover crop = 30 lb/acre, corn and mostother crops = 0 lb/acre.
Potential corn yield associated with soils, and available inthe Indiana STATSGO soils database, was used to computepost‐BMP fertilizer application rates. The weighted potentialcorn yield associated with STATSGO soils was adjusted,using a factor of 1.32, to account for development of newcultivars, improved technology and agronomic practices.This adjustment factor was determined by the ratio ofexpected corn yield in 2006 (based on Indiana corn grainyield trend since 1930; Nielson, 2005) and the average ofweighted corn yields associated with STATSGO soil units.
Thus, the equation used to adjust corn potential yield is:
awy
ey
C
C=λ (2)
where� = the adjustment factor for corn yieldCey = the trend line expected yield for a given yearCawy = average of weighted corn yield of STATSGO soil
unitsAlso, the equation used to estimate corn yield potential per
STATSGO soil unit is:
λ×=
∑
∑
=
=n
ii
n
iii
comppct
nirryldcomppct
Cwy
1
1
)(
))((
(3)
whereCwy = the weighted potential corn yield per soil
unitn = number of components with estimated yield
per soil unitcomppct = the percentage of the component of the map
unitnirryld = the expected yield for corn without
supplemental irrigation in an average year under a high level of management.
� = the adjustment factor for corn yield.It was assumed that all producers followed sound
agronomic principles with regards to fertilizer timing andmethod of application on corn when following the nutrientmanagement plan.
NITRATE LOADING ADJUSTMENTS FOR TILE DRAINAGE
Numerous agricultural lands in Indiana have tile drainagesystems causing nitrate leached to subsoil to be redistributedto the surface water (Kladivko et al., 2004). Water andhydrophilic compounds such as nitrates that are transportedbelow the root zone are likely to be captured by thesenetworks of tile drains and eventually discharge to surfacewaters, thus degrading water quality (Randall and Vetsch,2005). To account for an estimate of the leached nitrateintercepted by tile drains, an adjustment factor of 0.75 wasused to redirect estimated nitrate leached in soil to surfacewater (Adeuya et al., 2005).The equation used to estimate netnitrate to surface water is:
NNO3 = NO3ro + (NO3lea × Tde) (4)
whereNNO3 = net nitrate‐nitrogen to surface water (kg/ha)NO3ro = nitrate‐nitrogen loading in surface runoff (kg/ha)NO3lea = nitrate‐nitrogen leached to shallow groundwater
(kg/ha)Tde = adjustment factor for tile drain
COUNTY AND 8‐DIGIT HUC ANALYSIS OF NUTRIENT
LOADING REDUCTION
Model simulated results linked to STATSGO map unitsand Indiana agricultural lands were used to obtain nutrientloading estimates in each U.S. Geological Survey (USGS)8‐digit hydrologic unit code (HUC) and county using the GISsoftware ArcMap� 9.1. Statistical analysis on EQIP relatednutrient reduction estimates were performed external to theGIS software.
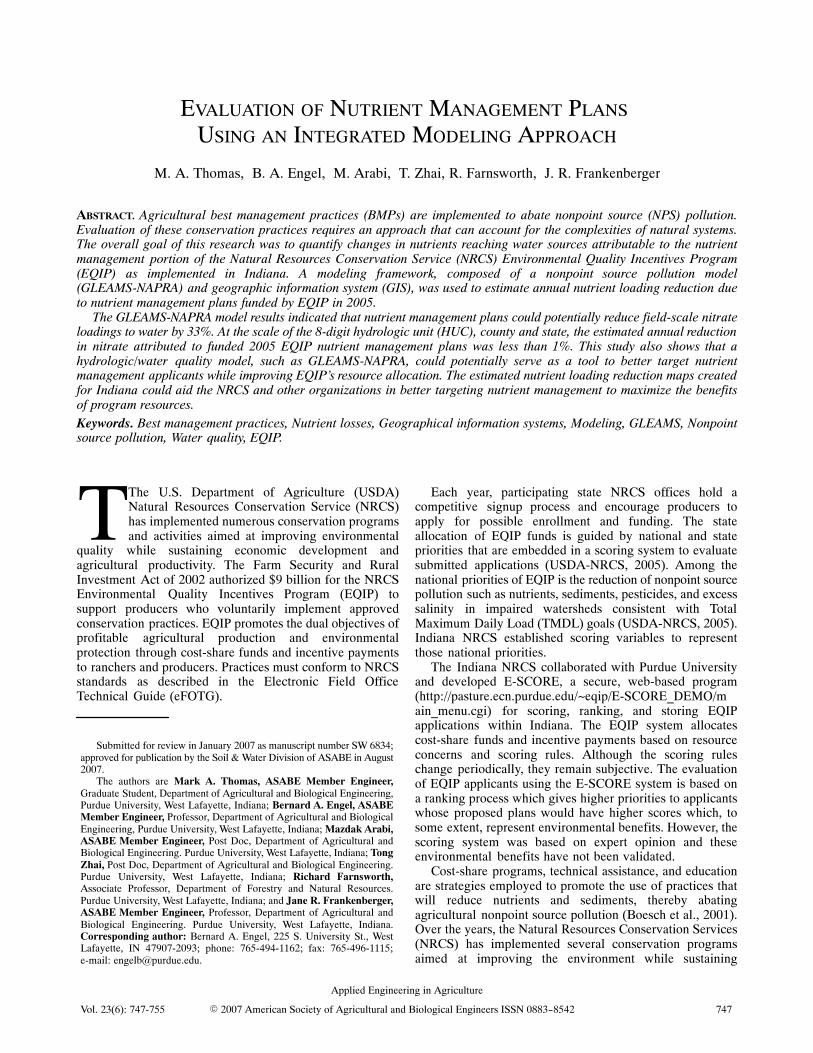
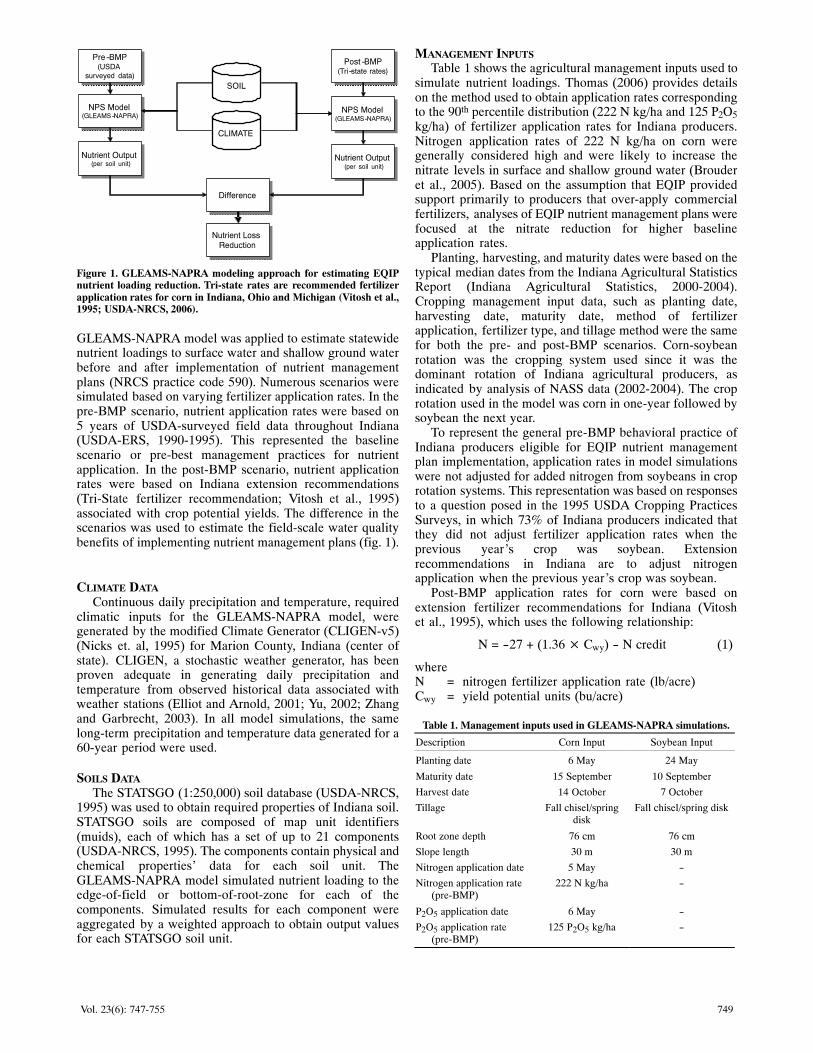
To understand whether the existing EQIP applicationscontributed to larger nutrient reductions, a comparison wasmade between EQIP applicants that were funded andapplicants that were not selected for funding (hereafterreferred to as unfunded EQIP plans or unfunded nutrientmanagement plans). The funded non‐livestock nutrientmanagement applications throughout Indiana are illustratedin figure 2.The statistical significance of means in nitrateloading reduction attributed to funded and unfunded nutrientmanagement plans were assessed using the Wilcoxontwo‐sample test (an appropriate alternative to the two‐samplet‐test for nonparametric population) (Walpole et al., 1998).
Figure 2. EQIP funded non‐livestock nutrient management applicationsin 8‐digit HUC watersheds for 2005.
751Vol. 23(6): 747‐755
RESULTS AND DISCUSSIONSPATIAL VARIATIONS IN NITRATE AND P LOADINGS
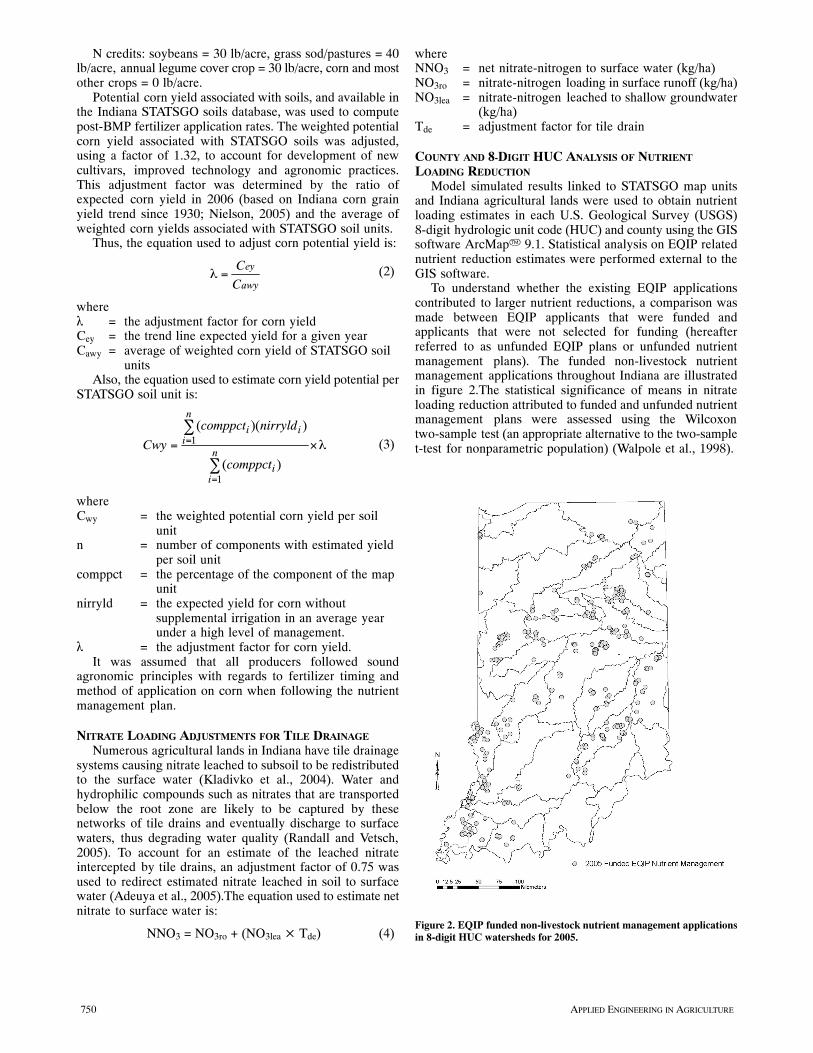
The estimated annual nitrate loadings to surface waterranged from 0 kg/ha to 21.70 kg/ha based onGLEAMS‐NAPRA simulations of fertilizer application ratescorresponding to the pre‐BMP level (222 N kg/ha) under acorn‐soybean cropping system (fig. 3).
The variability indicated in figure 3 was due to soilproperties because other inputs were the same. The highestimates in nitrate loadings shown in northwest andsouthwest Indiana were consistent with the behavior ofnitrate in Indiana soils (Adeuya et al., 2005) In 2005,scientists working with the Agricultural Research Service(ARS) on a similar project observed nitrate loadings in therange of 0.1 to 17.92 kg/ha for the St. Joseph watershed inIndiana (Smith, personal communication, 27 July 2006).Although the simulated model results were not comparedwith observed data, partly due to unavailability at the modelscale, the values were within the expected ranges for Indianasoils. Soils in regions of high nitrate loadings, illustrated infigure 3, are predominantly sandy loam where high nitrateleaching was expected. However, the approach to estimatenet nitrate loadings assumed that a fraction (0.75) of leachednitrates was intercepted by tile drains and redirected tosurface water sources, which could potentially overestimatenitrate loadings on lands without tile drains.
Figure 3. Median annual estimates in net NO3‐N loading to surface water,under a corn‐soybean cropping system, based on long‐term (60‐years)GLEAMS‐NAPRA simulation of baseline nitrogen application rate of222 N kg/ha.
As part of this study, P loadings were also estimated beforeand after the application of a nutrient management plan.Estimated annual P loadings were higher than expected,based on knowledge of observed P loadings throughoutIndiana (S. Brouder, personal communication, 4 August2006). The model was not calibrated and validated due to thescale of our modeling efforts. Several reasons can be givenfor the higher‐than‐expected P loadings to surface water.First, sediment P accounted for most of the estimated Ploadings in model simulations. Therefore, P loadings wouldbe high if estimated erosion rates were high (Thomas, 2006).Second, sedimentation processes were not simulated.Therefore, one would expect observed P loadings to be lessthan simulated P loadings because a portion of eroded soilsare deposited in low spots and never reach surface water.Third, studies have shown that GLEAMS often poorlyrepresents sediment bound and leached phosphorus (Gerwiget al., 2001). Due to those limitations in modeling P, theresults did not provide sufficient insight into P reductionpotentials attributed to EQIP applications. As a result of thoseuncertainties in modeling P, the results will not be discussedfurther in this article; however, additional details areprovided by Thomas (2006).
Information obtained from measured or simulated data areusually transferred from a smaller study area to largerregions. The use of measured or simulated data withoutconsideration of the spatial variability can be erroneous(Shirmohammadi et al., 2005). The statewide maps thatdisplay estimated annual nitrate loadings to surface watermaps eliminate the need to extrapolate data from small studyareas. Using these maps, program administrators could focusEQIP's efforts on the highest nutrient loading areas withinIndiana. The maps with estimates in nitrate loadings couldalso support the EQIP state scoring system which currentlyuses a web‐based GIS approach (known as E‐SCORE:http://pasture.ecn.purdue.edu/~eqip/E‐SCORE_DEMO/main_menu.cgi). Instead of assuming that all nutrientmanagement applicants could provide equal water qualityimprovements, the maps with estimates in nutrient loadingswould be used as overlays and, as such, create distinctionsamong nutrient management applicants.
NITRATE LOADING REDUCTIONThe simulation results suggested that long‐term, under
pre‐BMP conditions, 11.7 kg/ha was the average field‐scalenitrate loading attributed to nutrient management in 2005applications funded by EQIP. Producers who followedextension recommendations for fertilizer application rateswould contribute an estimated 3.89 kg/ha in reduced annualnitrates. Thus, at the field scale, EQIP‐funded applicationsprovided an estimated 33% reduction in NO3‐N loading towater sources.
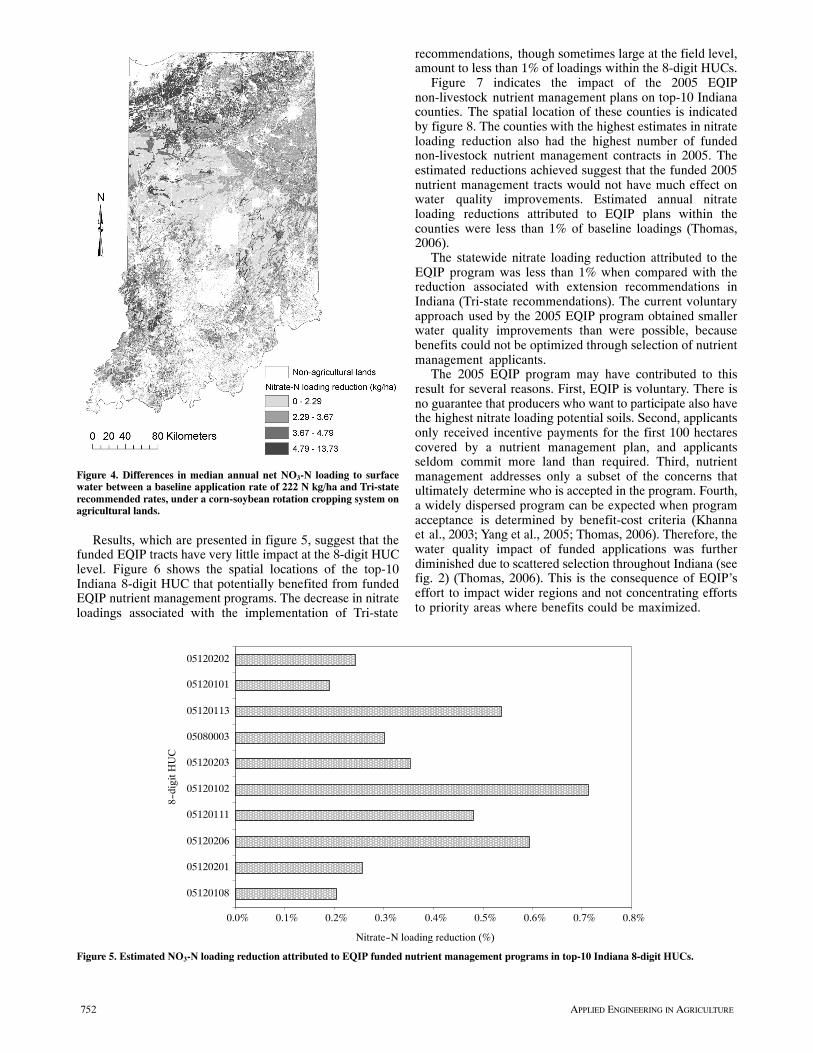
Figure 4 conveys the spatial results of field‐scaleestimates in annual nitrate loading reductions from Indianaagricultural lands, based on long‐term (60 years) modelsimulations. Considering the variations in soils, the nitrateloading reductions were expected to vary spatially. Thesemaps clarified the degree of variation, in estimated annualnutrient loading reductions, that would occur under the givenmanagement inputs, soils, and climatic conditions.
752 APPLIED ENGINEERING IN AGRICULTURE
Figure 4. Differences in median annual net NO3‐N loading to surfacewater between a baseline application rate of 222 N kg/ha and Tri‐staterecommended rates, under a corn‐soybean rotation cropping system onagricultural lands.
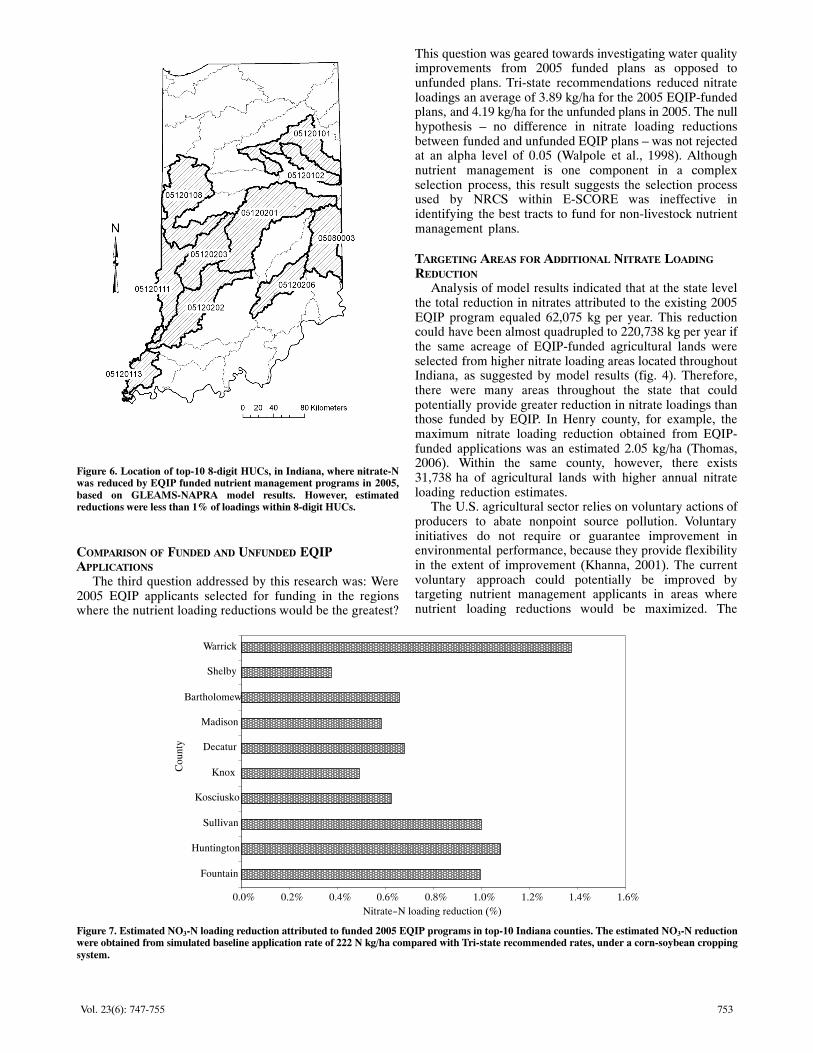
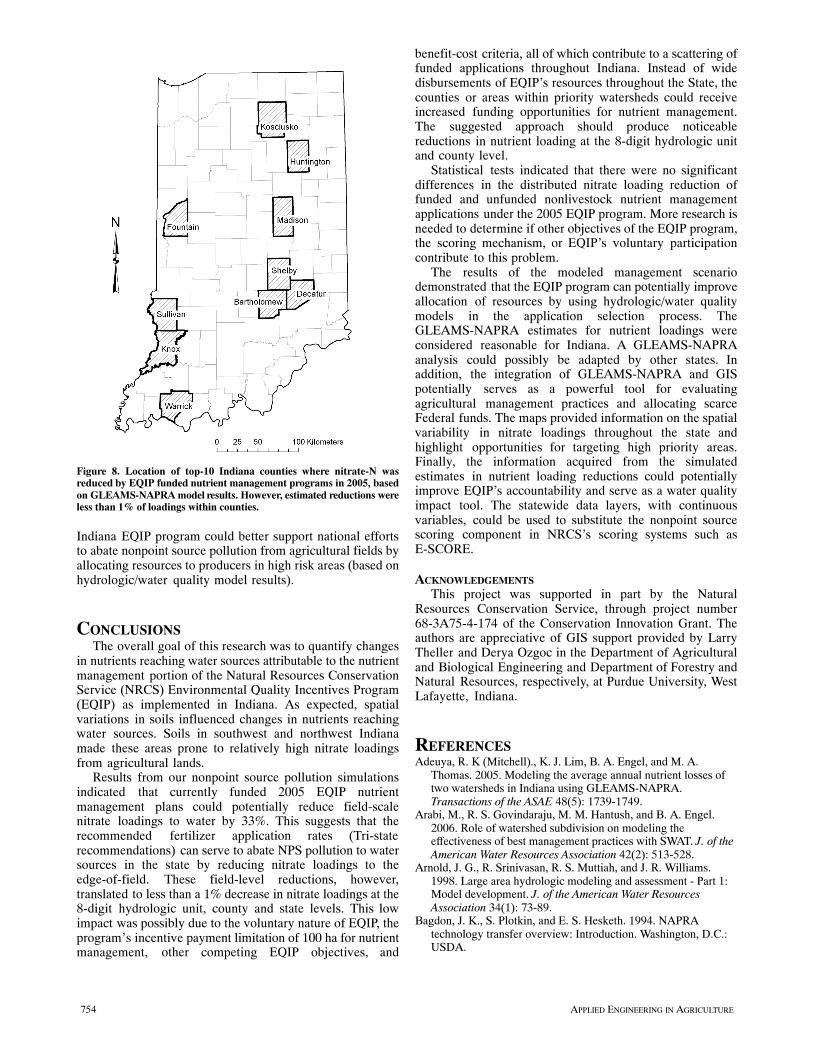
Results, which are presented in figure 5, suggest that thefunded EQIP tracts have very little impact at the 8‐digit HUClevel. Figure 6 shows the spatial locations of the top‐10Indiana 8‐digit HUC that potentially benefited from fundedEQIP nutrient management programs. The decrease in nitrateloadings associated with the implementation of Tri‐state
recommendations, though sometimes large at the field level,amount to less than 1% of loadings within the 8‐digit HUCs.
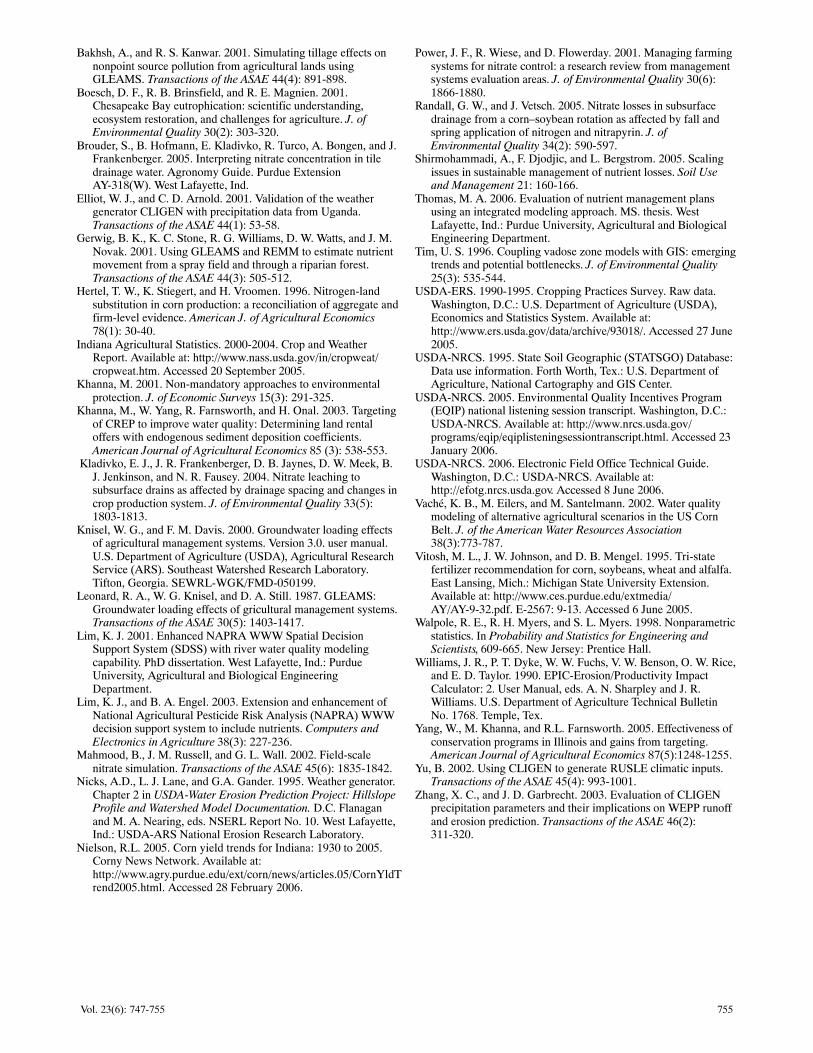
Figure 7 indicates the impact of the 2005 EQIPnon‐livestock nutrient management plans on top‐10 Indianacounties. The spatial location of these counties is indicatedby figure 8. The counties with the highest estimates in nitrateloading reduction also had the highest number of fundednon‐livestock nutrient management contracts in 2005. Theestimated reductions achieved suggest that the funded 2005nutrient management tracts would not have much effect onwater quality improvements. Estimated annual nitrateloading reductions attributed to EQIP plans within thecounties were less than 1% of baseline loadings (Thomas,2006).
The statewide nitrate loading reduction attributed to theEQIP program was less than 1% when compared with thereduction associated with extension recommendations inIndiana (Tri‐state recommendations). The current voluntaryapproach used by the 2005 EQIP program obtained smallerwater quality improvements than were possible, becausebenefits could not be optimized through selection of nutrientmanagement applicants.
The 2005 EQIP program may have contributed to thisresult for several reasons. First, EQIP is voluntary. There isno guarantee that producers who want to participate also havethe highest nitrate loading potential soils. Second, applicantsonly received incentive payments for the first 100 hectarescovered by a nutrient management plan, and applicantsseldom commit more land than required. Third, nutrientmanagement addresses only a subset of the concerns thatultimately determine who is accepted in the program. Fourth,a widely dispersed program can be expected when programacceptance is determined by benefit‐cost criteria (Khannaet al., 2003; Yang et al., 2005; Thomas, 2006). Therefore, thewater quality impact of funded applications was furtherdiminished due to scattered selection throughout Indiana (seefig. 2) (Thomas, 2006). This is the consequence of EQIP'seffort to impact wider regions and not concentrating effortsto priority areas where benefits could be maximized.
ÔÔÔÔÔÔÔÔÔÔÔÔ
ÔÔÔÔÔÔÔ
ÔÔÔÔÔÔÔÔÔÔÔÔÔÔÔÔÔÔÔÔÔÔÔÔÔÔÔÔÔÔ
ÔÔÔÔÔÔÔÔÔÔÔÔÔÔÔÔÔÔÔÔÔÔÔÔÔÔ
ÔÔÔÔÔÔÔÔÔÔÔÔÔÔÔÔÔÔÔÔÔÔÔÔÔÔÔÔ
ÔÔÔÔÔÔÔÔÔÔÔÔÔÔÔÔ
ÔÔÔÔÔÔÔÔÔÔÔÔÔÔÔÔÔÔÔÔÔÔÔÔÔÔÔÔ
ÔÔÔÔÔÔÔÔÔÔÔÔÔ
0.0% 0.1% 0.2% 0.3% 0.4% 0.5% 0.6% 0.7% 0.8%
05120108
05120201
05120206
05120111
05120102
05120203
05080003
05120113
05120101
05120202
8-di
git H
UC
Nitrate-N loading reduction (%)
Figure 5. Estimated NO3‐N loading reduction attributed to EQIP funded nutrient management programs in top‐10 Indiana 8‐digit HUCs.
753Vol. 23(6): 747‐755
Figure 6. Location of top‐10 8‐digit HUCs, in Indiana, where nitrate‐Nwas reduced by EQIP funded nutrient management programs in 2005,based on GLEAMS‐NAPRA model results. However, estimatedreductions were less than 1% of loadings within 8‐digit HUCs.
COMPARISON OF FUNDED AND UNFUNDED EQIPAPPLICATIONS
The third question addressed by this research was: Were2005 EQIP applicants selected for funding in the regionswhere the nutrient loading reductions would be the greatest?
This question was geared towards investigating water qualityimprovements from 2005 funded plans as opposed tounfunded plans. Tri‐state recommendations reduced nitrateloadings an average of 3.89 kg/ha for the 2005 EQIP‐fundedplans, and 4.19 kg/ha for the unfunded plans in 2005. The nullhypothesis – no difference in nitrate loading reductionsbetween funded and unfunded EQIP plans – was not rejectedat an alpha level of 0.05 (Walpole et al., 1998). Althoughnutrient management is one component in a complexselection process, this result suggests the selection processused by NRCS within E‐SCORE was ineffective inidentifying the best tracts to fund for non‐livestock nutrientmanagement plans.
TARGETING AREAS FOR ADDITIONAL NITRATE LOADING
REDUCTIONAnalysis of model results indicated that at the state level
the total reduction in nitrates attributed to the existing 2005EQIP program equaled 62,075 kg per year. This reductioncould have been almost quadrupled to 220,738 kg per year ifthe same acreage of EQIP‐funded agricultural lands wereselected from higher nitrate loading areas located throughoutIndiana, as suggested by model results (fig. 4). Therefore,there were many areas throughout the state that couldpotentially provide greater reduction in nitrate loadings thanthose funded by EQIP. In Henry county, for example, themaximum nitrate loading reduction obtained from EQIP‐funded applications was an estimated 2.05 kg/ha (Thomas,2006). Within the same county, however, there exists31,738 ha of agricultural lands with higher annual nitrateloading reduction estimates.
The U.S. agricultural sector relies on voluntary actions ofproducers to abate nonpoint source pollution. Voluntaryinitiatives do not require or guarantee improvement inenvironmental performance, because they provide flexibilityin the extent of improvement (Khanna, 2001). The currentvoluntary approach could potentially be improved bytargeting nutrient management applicants in areas wherenutrient loading reductions would be maximized. The
ÔÔÔÔÔÔÔÔÔÔÔÔÔÔÔÔÔÔÔÔÔÔÔÔÔÔ
ÔÔÔÔÔÔÔÔÔÔÔÔÔÔÔÔÔÔÔÔÔÔÔÔÔÔÔ
ÔÔÔÔÔÔÔÔÔÔÔÔÔÔÔÔÔÔ
ÔÔÔÔÔÔÔÔÔÔÔÔÔÔ
ÔÔÔÔÔÔÔÔÔÔÔÔÔÔÔÔÔ
ÔÔÔÔÔÔÔÔÔÔÔÔÔÔÔÔÔÔ
ÔÔÔÔÔÔÔÔÔÔÔÔ
ÔÔÔÔÔÔÔÔÔÔÔÔÔÔÔÔÔ
0.0% 0.2% 0.4% 0.6% 0.8% 1.0% 1.2% 1.4% 1.6%
Fountain
Huntington
Sullivan
Kosciusko
Knox
Decatur
Madison
Bartholomew
Shelby
Warrick
Cou
nty
Nitrate-N loading reduction (%)
Figure 7. Estimated NO3‐N loading reduction attributed to funded 2005 EQIP programs in top‐10 Indiana counties. The estimated NO3‐N reductionwere obtained from simulated baseline application rate of 222 N kg/ha compared with Tri‐state recommended rates, under a corn‐soybean croppingsystem.
754 APPLIED ENGINEERING IN AGRICULTURE
Figure 8. Location of top‐10 Indiana counties where nitrate‐N wasreduced by EQIP funded nutrient management programs in 2005, basedon GLEAMS‐NAPRA model results. However, estimated reductions wereless than 1% of loadings within counties.
Indiana EQIP program could better support national effortsto abate nonpoint source pollution from agricultural fields byallocating resources to producers in high risk areas (based onhydrologic/water quality model results).
CONCLUSIONSThe overall goal of this research was to quantify changes
in nutrients reaching water sources attributable to the nutrientmanagement portion of the Natural Resources ConservationService (NRCS) Environmental Quality Incentives Program(EQIP) as implemented in Indiana. As expected, spatialvariations in soils influenced changes in nutrients reachingwater sources. Soils in southwest and northwest Indianamade these areas prone to relatively high nitrate loadingsfrom agricultural lands.
Results from our nonpoint source pollution simulationsindicated that currently funded 2005 EQIP nutrientmanagement plans could potentially reduce field‐scalenitrate loadings to water by 33%. This suggests that therecommended fertilizer application rates (Tri‐staterecommendations) can serve to abate NPS pollution to watersources in the state by reducing nitrate loadings to theedge‐of‐field. These field‐level reductions, however,translated to less than a 1% decrease in nitrate loadings at the8‐digit hydrologic unit, county and state levels. This lowimpact was possibly due to the voluntary nature of EQIP, theprogram's incentive payment limitation of 100 ha for nutrientmanagement, other competing EQIP objectives, and
benefit‐cost criteria, all of which contribute to a scattering offunded applications throughout Indiana. Instead of widedisbursements of EQIP's resources throughout the State, thecounties or areas within priority watersheds could receiveincreased funding opportunities for nutrient management.The suggested approach should produce noticeablereductions in nutrient loading at the 8‐digit hydrologic unitand county level.
Statistical tests indicated that there were no significantdifferences in the distributed nitrate loading reduction offunded and unfunded nonlivestock nutrient managementapplications under the 2005 EQIP program. More research isneeded to determine if other objectives of the EQIP program,the scoring mechanism, or EQIP's voluntary participationcontribute to this problem.
The results of the modeled management scenariodemonstrated that the EQIP program can potentially improveallocation of resources by using hydrologic/water qualitymodels in the application selection process. TheGLEAMS‐NAPRA estimates for nutrient loadings wereconsidered reasonable for Indiana. A GLEAMS‐NAPRAanalysis could possibly be adapted by other states. Inaddition, the integration of GLEAMS‐NAPRA and GISpotentially serves as a powerful tool for evaluatingagricultural management practices and allocating scarceFederal funds. The maps provided information on the spatialvariability in nitrate loadings throughout the state andhighlight opportunities for targeting high priority areas.Finally, the information acquired from the simulatedestimates in nutrient loading reductions could potentiallyimprove EQIP's accountability and serve as a water qualityimpact tool. The statewide data layers, with continuousvariables, could be used to substitute the nonpoint sourcescoring component in NRCS's scoring systems such asE‐SCORE.
ACKNOWLEDGEMENTSThis project was supported in part by the Natural
Resources Conservation Service, through project number68‐3A75‐4‐174 of the Conservation Innovation Grant. Theauthors are appreciative of GIS support provided by LarryTheller and Derya Ozgoc in the Department of Agriculturaland Biological Engineering and Department of Forestry andNatural Resources, respectively, at Purdue University, WestLafayette, Indiana.
REFERENCESAdeuya, R. K (Mitchell)., K. J. Lim, B. A. Engel, and M. A.
Thomas. 2005. Modeling the average annual nutrient losses oftwo watersheds in Indiana using GLEAMS‐NAPRA.Transactions of the ASAE 48(5): 1739‐1749.
Arabi, M., R. S. Govindaraju, M. M. Hantush, and B. A. Engel.2006. Role of watershed subdivision on modeling theeffectiveness of best management practices with SWAT. J. of theAmerican Water Resources Association 42(2): 513‐528.
Arnold, J. G., R. Srinivasan, R. S. Muttiah, and J. R. Williams.1998. Large area hydrologic modeling and assessment ‐ Part 1:Model development. J. of the American Water ResourcesAssociation 34(1): 73‐89.
Bagdon, J. K., S. Plotkin, and E. S. Hesketh. 1994. NAPRAtechnology transfer overview: Introduction. Washington, D.C.:USDA.
755Vol. 23(6): 747‐755
Bakhsh, A., and R. S. Kanwar. 2001. Simulating tillage effects onnonpoint source pollution from agricultural lands usingGLEAMS. Transactions of the ASAE 44(4): 891‐898.
Boesch, D. F., R. B. Brinsfield, and R. E. Magnien. 2001.Chesapeake Bay eutrophication: scientific understanding,ecosystem restoration, and challenges for agriculture. J. ofEnvironmental Quality 30(2): 303‐320.
Brouder, S., B. Hofmann, E. Kladivko, R. Turco, A. Bongen, and J.Frankenberger. 2005. Interpreting nitrate concentration in tiledrainage water. Agronomy Guide. Purdue ExtensionAY‐318(W). West Lafayette, Ind.
Elliot, W. J., and C. D. Arnold. 2001. Validation of the weathergenerator CLIGEN with precipitation data from Uganda.Transactions of the ASAE 44(1): 53‐58.
Gerwig, B. K., K. C. Stone, R. G. Williams, D. W. Watts, and J. M.Novak. 2001. Using GLEAMS and REMM to estimate nutrientmovement from a spray field and through a riparian forest.Transactions of the ASAE 44(3): 505‐512.
Hertel, T. W., K. Stiegert, and H. Vroomen. 1996. Nitrogen‐landsubstitution in corn production: a reconciliation of aggregate andfirm‐level evidence. American J. of Agricultural Economics78(1): 30‐40.
Indiana Agricultural Statistics. 2000‐2004. Crop and WeatherReport. Available at: http://www.nass.usda.gov/in/cropweat/cropweat.htm. Accessed 20 September 2005.
Khanna, M. 2001. Non‐mandatory approaches to environmentalprotection. J. of Economic Surveys 15(3): 291‐325.
Khanna, M., W. Yang, R. Farnsworth, and H. Onal. 2003. Targetingof CREP to improve water quality: Determining land rentaloffers with endogenous sediment deposition coefficients.American Journal of Agricultural Economics 85 (3): 538‐553.
Kladivko, E. J., J. R. Frankenberger, D. B. Jaynes, D. W. Meek, B.J. Jenkinson, and N. R. Fausey. 2004. Nitrate leaching tosubsurface drains as affected by drainage spacing and changes incrop production system. J. of Environmental Quality 33(5):1803‐1813.
Knisel, W. G., and F. M. Davis. 2000. Groundwater loading effectsof agricultural management systems. Version 3.0. user manual.U.S. Department of Agriculture (USDA), Agricultural ResearchService (ARS). Southeast Watershed Research Laboratory.Tifton, Georgia. SEWRL‐WGK/FMD‐050199.
Leonard, R. A., W. G. Knisel, and D. A. Still. 1987. GLEAMS:Groundwater loading effects of gricultural management systems.Transactions of the ASAE 30(5): 1403‐1417.
Lim, K. J. 2001. Enhanced NAPRA WWW Spatial DecisionSupport System (SDSS) with river water quality modelingcapability. PhD dissertation. West Lafayette, Ind.: PurdueUniversity, Agricultural and Biological EngineeringDepartment.
Lim, K. J., and B. A. Engel. 2003. Extension and enhancement ofNational Agricultural Pesticide Risk Analysis (NAPRA) WWWdecision support system to include nutrients. Computers andElectronics in Agriculture 38(3): 227‐236.
Mahmood, B., J. M. Russell, and G. L. Wall. 2002. Field‐scalenitrate simulation. Transactions of the ASAE 45(6): 1835‐1842.
Nicks, A.D., L. J. Lane, and G.A. Gander. 1995. Weather generator.Chapter 2 in USDA‐Water Erosion Prediction Project: HillslopeProfile and Watershed Model Documentation. D.C. Flanaganand M. A. Nearing, eds. NSERL Report No. 10. West Lafayette,Ind.: USDA‐ARS National Erosion Research Laboratory.
Nielson, R.L. 2005. Corn yield trends for Indiana: 1930 to 2005.Corny News Network. Available at:http://www.agry.purdue.edu/ext/corn/news/articles.05/CornYldTrend2005.html. Accessed 28 February 2006.
Power, J. F., R. Wiese, and D. Flowerday. 2001. Managing farmingsystems for nitrate control: a research review from managementsystems evaluation areas. J. of Environmental Quality 30(6):1866‐1880.
Randall, G. W., and J. Vetsch. 2005. Nitrate losses in subsurfacedrainage from a corn–soybean rotation as affected by fall andspring application of nitrogen and nitrapyrin. J. ofEnvironmental Quality 34(2): 590‐597.
Shirmohammadi, A., F. Djodjic, and L. Bergstrom. 2005. Scalingissues in sustainable management of nutrient losses. Soil Useand Management 21: 160‐166.
Thomas, M. A. 2006. Evaluation of nutrient management plansusing an integrated modeling approach. MS. thesis. WestLafayette, Ind.: Purdue University, Agricultural and BiologicalEngineering Department.
Tim, U. S. 1996. Coupling vadose zone models with GIS: emergingtrends and potential bottlenecks. J. of Environmental Quality25(3): 535‐544.
USDA‐ERS. 1990‐1995. Cropping Practices Survey. Raw data.Washington, D.C.: U.S. Department of Agriculture (USDA),Economics and Statistics System. Available at:http://www.ers.usda.gov/data/archive/93018/. Accessed 27 June2005.
USDA‐NRCS. 1995. State Soil Geographic (STATSGO) Database:Data use information. Forth Worth, Tex.: U.S. Department ofAgriculture, National Cartography and GIS Center.
USDA‐NRCS. 2005. Environmental Quality Incentives Program(EQIP) national listening session transcript. Washington, D.C.:USDA‐NRCS. Available at: http://www.nrcs.usda.gov/programs/eqip/eqiplisteningsessiontranscript.html. Accessed 23January 2006.
USDA‐NRCS. 2006. Electronic Field Office Technical Guide.Washington, D.C.: USDA‐NRCS. Available at:http://efotg.nrcs.usda.gov. Accessed 8 June 2006.
Vaché, K. B., M. Eilers, and M. Santelmann. 2002. Water qualitymodeling of alternative agricultural scenarios in the US CornBelt. J. of the American Water Resources Association38(3):773‐787.
Vitosh, M. L., J. W. Johnson, and D. B. Mengel. 1995. Tri‐statefertilizer recommendation for corn, soybeans, wheat and alfalfa.East Lansing, Mich.: Michigan State University Extension.Available at: http://www.ces.purdue.edu/extmedia/AY/AY‐9‐32.pdf. E‐2567: 9‐13. Accessed 6 June 2005.
Walpole, R. E., R. H. Myers, and S. L. Myers. 1998. Nonparametricstatistics. In Probability and Statistics for Engineering andScientists, 609‐665. New Jersey: Prentice Hall.
Williams, J. R., P. T. Dyke, W. W. Fuchs, V. W. Benson, O. W. Rice,and E. D. Taylor. 1990. EPIC‐Erosion/Productivity ImpactCalculator: 2. User Manual, eds. A. N. Sharpley and J. R.Williams. U.S. Department of Agriculture Technical BulletinNo. 1768. Temple, Tex.
Yang, W., M. Khanna, and R.L. Farnsworth. 2005. Effectiveness ofconservation programs in Illinois and gains from targeting.American Journal of Agricultural Economics 87(5):1248‐1255.
Yu, B. 2002. Using CLIGEN to generate RUSLE climatic inputs.Transactions of the ASAE 45(4): 993‐1001.
Zhang, X. C., and J. D. Garbrecht. 2003. Evaluation of CLIGENprecipitation parameters and their implications on WEPP runoffand erosion prediction. Transactions of the ASAE 46(2):311‐320.

756 APPLIED ENGINEERING IN AGRICULTURE