Embed Size (px)
DESCRIPTION
_
Citation preview
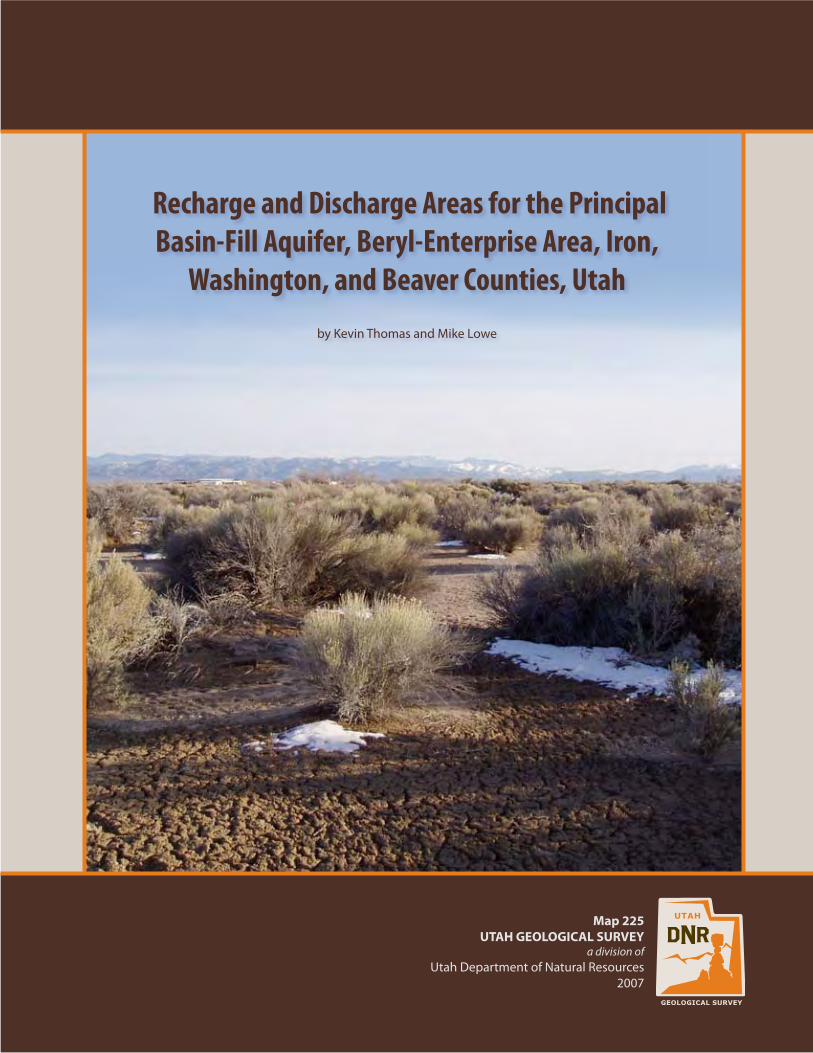
Recharge and Discharge Areas for the PrincipalBasin-Fill Aquifer, Beryl-Enterprise Area, Iron,
Washington, and Beaver Counties, Utahby Kevin Thomas and Mike Lowe
Map 225UTAH GEOLOGICAL SURVEY
a division ofUtah Department of Natural Resources
2007
Recharge and Discharge Areas for the PrincipalBasin-Fill Aquifer, Beryl-Enterprise Area, Iron,
Washington, and Beaver Counties, Utah
by Kevin Thomas and Mike Lowe
ISBN 1-55791-770-1
Map 225UTAH GEOLOGICAL SURVEYa division ofUtah Department of Natural Resources2007
STATE OF UTAHJon Huntsman, Jr., Governor
DEPARTMENT OF NATURAL RESOURCESMichael Styler, Executive Director
UTAH GEOLOGICAL SURVEYRichard G. Allis, Director
PUBLICATIONScontact
Natural Resources Map & Bookstore1594 W. North Temple
Salt Lake City, UT 84116telephone: 801-537-3320
toll-free: 1-888-UTAH MAPWeb site: http://mapstore.utah.gov
email: [email protected]
THE UTAH GEOLOGICAL SURVEYcontact
1594 W. North Temple, Suite 3110Salt Lake City, UT 84116telephone: 801-537-3300
fax: 801-537-3400 Web site: http://geology.utah.gov
Although this product represents the work of professional scientists, the Utah Department of Natural Resources, Utah Geological Survey, makes no warranty, expressed or implied, regarding its suitability for a particular use. The Utah Department of Natural Resources, Utah Geological Survey, shall not be liable under any circumstances for any direct, indirect, special, incidental, or consequential damages with respect to claims by users of this product.
The Utah Department of Natural Resources receives federal aid and prohibits discrimination on the basis of race, color, sex, age, national origin, or disability. For informa-tion or complaints regarding discrimination, contact Executive Director, Utah Department of Natural Resources, 1594 West North Temple #3710, Box 145610, Salt Lake City, UT 84116-5610, Salt Lake City, UT 84116-5610 or Equal Employment Opportunity Commission, 1801 L. Street, NW, Washington DC 20507.
CONTENTS
ABSTRACT ................................................................................................................................................................................................1INTRODUCTION .....................................................................................................................................................................................1
Background .........................................................................................................................................................................................1Purpose and Scope .............................................................................................................................................................................1Setting ..................................................................................................................................................................................................2
Physiography and Drainage .....................................................................................................................................................2Climate .........................................................................................................................................................................................2Population and Land Use ..........................................................................................................................................................2
Previous Studies .................................................................................................................................................................................2METHODS .................................................................................................................................................................................................4GEOLOGY ..................................................................................................................................................................................................6
Bedrock ................................................................................................................................................................................................6Unconsolidated Sediments ...............................................................................................................................................................6
GROUND WATER ....................................................................................................................................................................................6Fractured-Rock Aquifers ...................................................................................................................................................................6Unconsolidated Basin-Fill Aquifer ..................................................................................................................................................6
Occurrence ...................................................................................................................................................................................6Aquifer Characteristics ..............................................................................................................................................................9Recharge and Discharge to the Basin-Fill Aquifer .................................................................................................................9Water Quality ..............................................................................................................................................................................9Ground-Water Flow Direction and Water Levels in Wells .................................................................................................11
RESULTS...................................................................................................................................................................................................11Recharge and Discharge Areas ......................................................................................................................................................11Potential for Water-Quality Degradation .....................................................................................................................................11
SUMMARY AND CONCLUSIONS .....................................................................................................................................................11ACKNOWLEDGMENTS .......................................................................................................................................................................13REFERENCES ..........................................................................................................................................................................................13APPENDIX ...............................................................................................................................................................................................15
FIGURES
Figure 1. Geographic features of the Beryl-Enterprise area, southwestern Utah ...........................................................................3Figure 2. Schematic block diagram showing recharge areas, location of the water table during 1937 and 1978, direction of
ground-water movement, and discharge areas in the Beryl-Enterprise area (modified from Mower and Sand-berg, 1982). ................................................................................................................................................................................4
Figure 3. Relative water levels in wells in recharge and discharge areas (modified from Snyder and Lowe, 1998) ................5Figure 4. Numbering system for wells in Utah (see text for additional explanation) ...................................................................7Figure 5. Simplified geologic map of the Beryl-Enterprise area, southwestern Utah (modified from Hintze and others,
2000). ..........................................................................................................................................................................................8Figure 6. Total-dissolved-solids concenration for ground water in the Beryl-Enterprise area, southwestern Utah (modified
from Mower and Sandberg, 1982). ......................................................................................................................................10Figure 7. Water-level change from 1975 to 2005 in the Beryl-Enterprise area, southwestern Utah (modified from Burden
and others, 2005). ...................................................................................................................................................................12
PLATE
Plate 1. Ground-water recharge and discharge areas of the Beryl-Enterprise area.
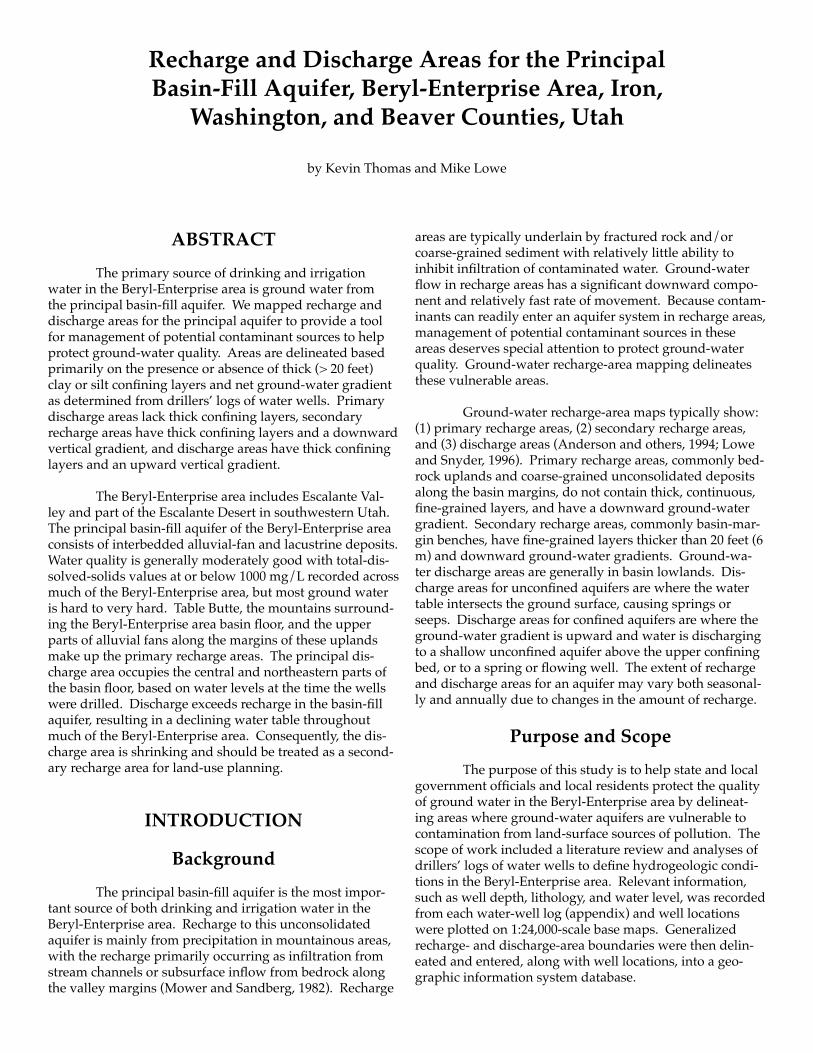
ABSTRACT
The primary source of drinking and irrigation water in the Beryl-Enterprise area is ground water from the principal basin-fill aquifer. We mapped recharge and discharge areas for the principal aquifer to provide a tool for management of potential contaminant sources to help protect ground-water quality. Areas are delineated based primarily on the presence or absence of thick (> 20 feet) clay or silt confining layers and net ground-water gradient as determined from drillers’ logs of water wells. Primary discharge areas lack thick confining layers, secondary recharge areas have thick confining layers and a downward vertical gradient, and discharge areas have thick confining layers and an upward vertical gradient.
The Beryl-Enterprise area includes Escalante Val-ley and part of the Escalante Desert in southwestern Utah. The principal basin-fill aquifer of the Beryl-Enterprise area consists of interbedded alluvial-fan and lacustrine deposits. Water quality is generally moderately good with total-dis-solved-solids values at or below 1000 mg/L recorded across much of the Beryl-Enterprise area, but most ground water is hard to very hard. Table Butte, the mountains surround-ing the Beryl-Enterprise area basin floor, and the upper parts of alluvial fans along the margins of these uplands make up the primary recharge areas. The principal dis-charge area occupies the central and northeastern parts of the basin floor, based on water levels at the time the wells were drilled. Discharge exceeds recharge in the basin-fill aquifer, resulting in a declining water table throughout much of the Beryl-Enterprise area. Consequently, the dis-charge area is shrinking and should be treated as a second-ary recharge area for land-use planning.
INTRODUCTION
Background
The principal basin-fill aquifer is the most impor-tant source of both drinking and irrigation water in the Beryl-Enterprise area. Recharge to this unconsolidated aquifer is mainly from precipitation in mountainous areas, with the recharge primarily occurring as infiltration from stream channels or subsurface inflow from bedrock along the valley margins (Mower and Sandberg, 1982). Recharge
areas are typically underlain by fractured rock and/or coarse-grained sediment with relatively little ability to inhibit infiltration of contaminated water. Ground-water flow in recharge areas has a significant downward compo-nent and relatively fast rate of movement. Because contam-inants can readily enter an aquifer system in recharge areas, management of potential contaminant sources in these areas deserves special attention to protect ground-water quality. Ground-water recharge-area mapping delineates these vulnerable areas.
Ground-water recharge-area maps typically show: (1) primary recharge areas, (2) secondary recharge areas, and (3) discharge areas (Anderson and others, 1994; Lowe and Snyder, 1996). Primary recharge areas, commonly bed-rock uplands and coarse-grained unconsolidated deposits along the basin margins, do not contain thick, continuous, fine-grained layers, and have a downward ground-water gradient. Secondary recharge areas, commonly basin-mar-gin benches, have fine-grained layers thicker than 20 feet (6 m) and downward ground-water gradients. Ground-wa-ter discharge areas are generally in basin lowlands. Dis-charge areas for unconfined aquifers are where the water table intersects the ground surface, causing springs or seeps. Discharge areas for confined aquifers are where the ground-water gradient is upward and water is discharging to a shallow unconfined aquifer above the upper confining bed, or to a spring or flowing well. The extent of recharge and discharge areas for an aquifer may vary both seasonal-ly and annually due to changes in the amount of recharge.
Purpose and Scope
The purpose of this study is to help state and local government officials and local residents protect the quality of ground water in the Beryl-Enterprise area by delineat-ing areas where ground-water aquifers are vulnerable to contamination from land-surface sources of pollution. The scope of work included a literature review and analyses of drillers’ logs of water wells to define hydrogeologic condi-tions in the Beryl-Enterprise area. Relevant information, such as well depth, lithology, and water level, was recorded from each water-well log (appendix) and well locations were plotted on 1:24,000-scale base maps. Generalized recharge- and discharge-area boundaries were then delin-eated and entered, along with well locations, into a geo-graphic information system database.
Recharge and Discharge Areas for the PrincipalBasin-Fill Aquifer, Beryl-Enterprise Area, Iron,
Washington, and Beaver Counties, Utah
by Kevin Thomas and Mike Lowe
Utah Geological Survey2
Setting
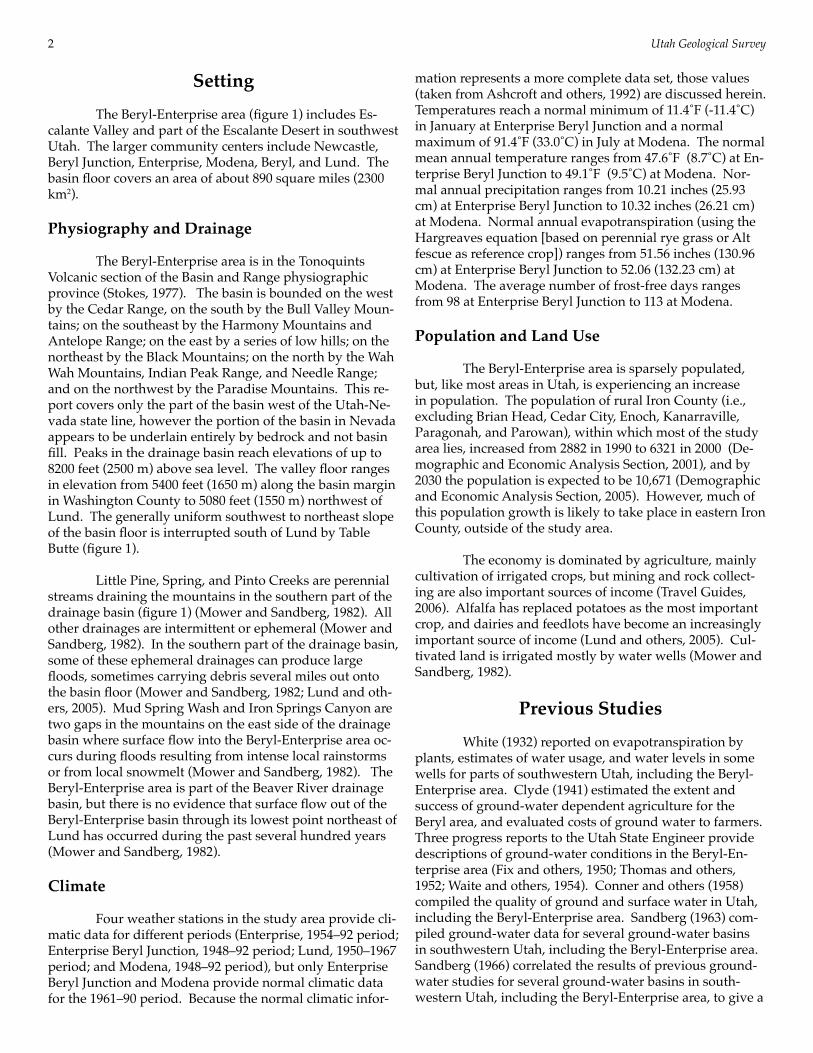
The Beryl-Enterprise area (figure 1) includes Es-calante Valley and part of the Escalante Desert in southwest Utah. The larger community centers include Newcastle, Beryl Junction, Enterprise, Modena, Beryl, and Lund. The basin floor covers an area of about 890 square miles (2300 km2).
Physiography and Drainage
The Beryl-Enterprise area is in the Tonoquints Volcanic section of the Basin and Range physiographic province (Stokes, 1977). The basin is bounded on the west by the Cedar Range, on the south by the Bull Valley Moun-tains; on the southeast by the Harmony Mountains and Antelope Range; on the east by a series of low hills; on the northeast by the Black Mountains; on the north by the Wah Wah Mountains, Indian Peak Range, and Needle Range; and on the northwest by the Paradise Mountains. This re-port covers only the part of the basin west of the Utah-Ne-vada state line, however the portion of the basin in Nevada appears to be underlain entirely by bedrock and not basin fill. Peaks in the drainage basin reach elevations of up to 8200 feet (2500 m) above sea level. The valley floor ranges in elevation from 5400 feet (1650 m) along the basin margin in Washington County to 5080 feet (1550 m) northwest of Lund. The generally uniform southwest to northeast slope of the basin floor is interrupted south of Lund by Table Butte (figure 1).
Little Pine, Spring, and Pinto Creeks are perennial streams draining the mountains in the southern part of the drainage basin (figure 1) (Mower and Sandberg, 1982). All other drainages are intermittent or ephemeral (Mower and Sandberg, 1982). In the southern part of the drainage basin, some of these ephemeral drainages can produce large floods, sometimes carrying debris several miles out onto the basin floor (Mower and Sandberg, 1982; Lund and oth-ers, 2005). Mud Spring Wash and Iron Springs Canyon are two gaps in the mountains on the east side of the drainage basin where surface flow into the Beryl-Enterprise area oc-curs during floods resulting from intense local rainstorms or from local snowmelt (Mower and Sandberg, 1982). The Beryl-Enterprise area is part of the Beaver River drainage basin, but there is no evidence that surface flow out of the Beryl-Enterprise basin through its lowest point northeast of Lund has occurred during the past several hundred years (Mower and Sandberg, 1982).
Climate
Four weather stations in the study area provide cli-matic data for different periods (Enterprise, 1954–92 period; Enterprise Beryl Junction, 1948–92 period; Lund, 1950–1967 period; and Modena, 1948–92 period), but only Enterprise Beryl Junction and Modena provide normal climatic data for the 1961–90 period. Because the normal climatic infor-
mation represents a more complete data set, those values (taken from Ashcroft and others, 1992) are discussed herein. Temperatures reach a normal minimum of 11.4˚F (-11.4˚C) in January at Enterprise Beryl Junction and a normal maximum of 91.4˚F (33.0˚C) in July at Modena. The normal mean annual temperature ranges from 47.6˚F (8.7˚C) at En-terprise Beryl Junction to 49.1˚F (9.5˚C) at Modena. Nor-mal annual precipitation ranges from 10.21 inches (25.93 cm) at Enterprise Beryl Junction to 10.32 inches (26.21 cm) at Modena. Normal annual evapotranspiration (using the Hargreaves equation [based on perennial rye grass or Alt fescue as reference crop]) ranges from 51.56 inches (130.96 cm) at Enterprise Beryl Junction to 52.06 (132.23 cm) at Modena. The average number of frost-free days ranges from 98 at Enterprise Beryl Junction to 113 at Modena.
Population and Land Use
The Beryl-Enterprise area is sparsely populated, but, like most areas in Utah, is experiencing an increase in population. The population of rural Iron County (i.e., excluding Brian Head, Cedar City, Enoch, Kanarraville, Paragonah, and Parowan), within which most of the study area lies, increased from 2882 in 1990 to 6321 in 2000 (De-mographic and Economic Analysis Section, 2001), and by 2030 the population is expected to be 10,671 (Demographic and Economic Analysis Section, 2005). However, much of this population growth is likely to take place in eastern Iron County, outside of the study area.
The economy is dominated by agriculture, mainly cultivation of irrigated crops, but mining and rock collect-ing are also important sources of income (Travel Guides, 2006). Alfalfa has replaced potatoes as the most important crop, and dairies and feedlots have become an increasingly important source of income (Lund and others, 2005). Cul-tivated land is irrigated mostly by water wells (Mower and Sandberg, 1982).
Previous Studies
White (1932) reported on evapotranspiration by plants, estimates of water usage, and water levels in some wells for parts of southwestern Utah, including the Beryl-Enterprise area. Clyde (1941) estimated the extent and success of ground-water dependent agriculture for the Beryl area, and evaluated costs of ground water to farmers. Three progress reports to the Utah State Engineer provide descriptions of ground-water conditions in the Beryl-En-terprise area (Fix and others, 1950; Thomas and others, 1952; Waite and others, 1954). Conner and others (1958) compiled the quality of ground and surface water in Utah, including the Beryl-Enterprise area. Sandberg (1963) com-piled ground-water data for several ground-water basins in southwestern Utah, including the Beryl-Enterprise area. Sandberg (1966) correlated the results of previous ground-water studies for several ground-water basins in south-western Utah, including the Beryl-Enterprise area, to give a
Recharge and discharge areas for the principal basin-fill aquifer, Beryl-Enterprise area, Iron, Washington, and Beaver Counties, Utah 3
R.1
8W
.R
.17
W.
113º
22' 3
0"
113º
30' 0
"
R. 1
3W
.R
. 12
W.
113º
45' 0
"
R. 2
0W
.R
. 19
W.
113º
37' 3
0"
38º 0' 0"
T. 33 S.T. 34 S.
T. 35 S.T. 36 S.
T. 32 S.T. 33 S.
38º 7' 30"
T. 34 S.T. 35 S.
37º 37' 30"
T. 30 S.T. 31 S.
T. 31 S.T. 32 S.
37º 45' 0"
R.1
9W
.R
. 18
W.
113º
52'3
0"
R. 1
6W
.R
. 15
W.
R. 1
5W
.R
. 14
W.
37º 30' 0"
T. 37 S.T. 38 S.
37º 52' 30"
T. 36 S.T. 37 S.
R.1
7W
.R
.16
W.
R. 1
4W
.R
. 13
W.
114º
0'0"
113º
15' 0
"
LostPeak
MountEscalante
MountElenore
Indian Peak Range
GraniteMountain
IronMountain
HarrisonPeak
Bull ValleyMountains
Escalante Desert
AntelopeRange
TheBaldHills
Iron Springs Canyon
Para
dise
Mou
ntai
nsWah WahMountains
HarmonyMountains
TableButte
Nee
dle
Ran
ge
BlackMountains
TheThreePeaks
The DryW ash
Spring C reek
MudSp r ing Wash
IronSp
r in gsC
r eek
G
o ld Springs Wash
Fou
rMile
Wash
JacksonWash
NegroLi za
Was h
Hogan s Wash
Gra
ssy C
reek
Shoal Creek
Til lieC
ree kB ig
Hollo
wW
ash
Dic
kPalm
er
WashP rou
t Wash
Mc
Do nal d Wash
F ishers
Wash
LittlePinto
Creek
BullSp rin
gWa sh
WhiteRocks Wash
Cot
tonw
ood
Was
h
Rock HoleW
a sh
Pino
n
Park Wash
1856
18
56
219Enterprise
IronMountain
Newcastle
BerylJunctionUvada
IronSprings
Modena
Heist
YaleCrossing
AvonBeryl
Zane
Lund
Latimer
Geographic features of the Beryl-Enterprise area, southwestern Utah.
Beaver County
Iron County
Washington County
Uta
hN
evad
a
Location of Study Area
Figure 1.
0 4 8 12 162Miles
0 4 8 12 162Kilometers
Utah ExplanationPopulation centers
Road
Water course
Water body
Study area boundary
Bedrock
County lines
Valley fill
Figure 1. Geographic features of the Beryl-Enterprise area, southwestern Utah.
Utah Geological Survey4
unified concept of ground-water conditions in those basins. Mower (1981) compiled ground-water data for the Beryl-Enterprise area. These data were used to produce the most recent comprehensive evaluation of ground-water condi-tions for the area (Mower and Sandberg, 1982). Burden and others (2005) evaluated water-level changes in wells in Utah from March 1970 to March 2005, including the Beryl-Enterprise area. Lund and others (2005) evaluated the origin and extent of earth fissures in Escalante Valley and the southern Escalante Desert.
METHODS
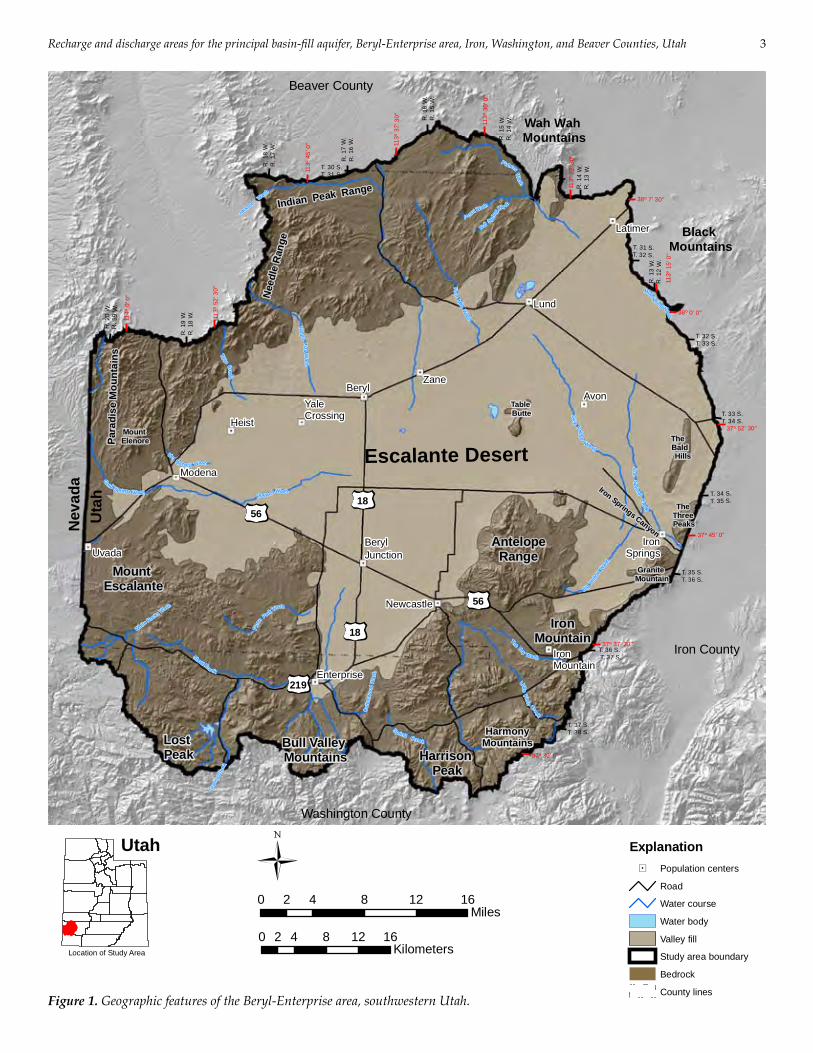
In this study, we used the methods of Anderson and others (1994) as modified by Snyder and Lowe (1998) for identifying confining layers, and delineating recharge and discharge areas for basin-fill aquifers; much of the text in this section is from Snyder and Lowe (1998). To delineate recharge and discharge areas, we evaluated both the principal aquifer and local overlying shallow uncon-fined aquifers (figure 2). The principal aquifer is the most important source of ground water, and may be confined
or unconfined. The principal aquifer begins at the moun-tain front along the valley margins where coarse-grained alluvial-fan sediments predominate and ground water is generally unconfined. Away from bedrock exposures, fine-grained silt and clay may form confining layers above and within the principal aquifer. Water in sediments above the upper confining layer is in a shallow unconfined aquifer. Shallow unconfined aquifers are generally not an important source of drinking water.
We used drillers’ logs of water wells to delineate primary and secondary recharge areas and discharge areas, based on the presence or absence of confining layers and relative water levels in the principal and shallow uncon-fined aquifers. Well-log information is summarized in the appendix. The use of drillers’ logs requires careful inter-pretation because of the variable quality of the logs. Cor-relation of geology from water-well logs is difficult because lithologic descriptions are generalized and commonly inconsistent among various drillers. The use of water-level data from water-well logs is also problematic because levels in the shallow unconfined aquifer are commonly not recorded, and because water levels were measured during different seasons and years.
Gaining
stream
Figure 2. Schematic block diagram showing recharge areas, location of the water table during 1937 and 1978, direction of ground-water movement, and discharge areas in the Beryl-Enterprise area (modified from Mower and Sandberg, 1982).
Recharge area
PrimaryRecharge Area
PrimaryRecharge Area
SecondaryRecharge Area
SecondaryRecharge Area
DischargeArea
DischargeArea
Phreatophytes
NOT TO SCALE
Water Table 1937
Water Table1978
Well
IrrigatedFields
WellLosing ephemeral stream
B U L L VA L L E YM O U N TA I N S
A N T E L O P ER A N G E
I R O NM O U N TA I N
THE THREEPEAKS
BALDHILLS
Consolidatedrock
Quaternary
Quaternary (?) or Tertiary (?)
Shallow Confined Aquifer
Partly Consolidated Material
Unsolidated Material
Water flow direction
Principal Aquifer
Figure 2. Schematic block diagram showing recharge areas, location of the water table during 1937 and 1978, direction of ground-wa-ter movement, and discharge areas in the Beryl-Enterprise area (modified from Mower and Sandberg, 1982).
Recharge and discharge areas for the principal basin-fill aquifer, Beryl-Enterprise area, Iron, Washington, and Beaver Counties, Utah 5
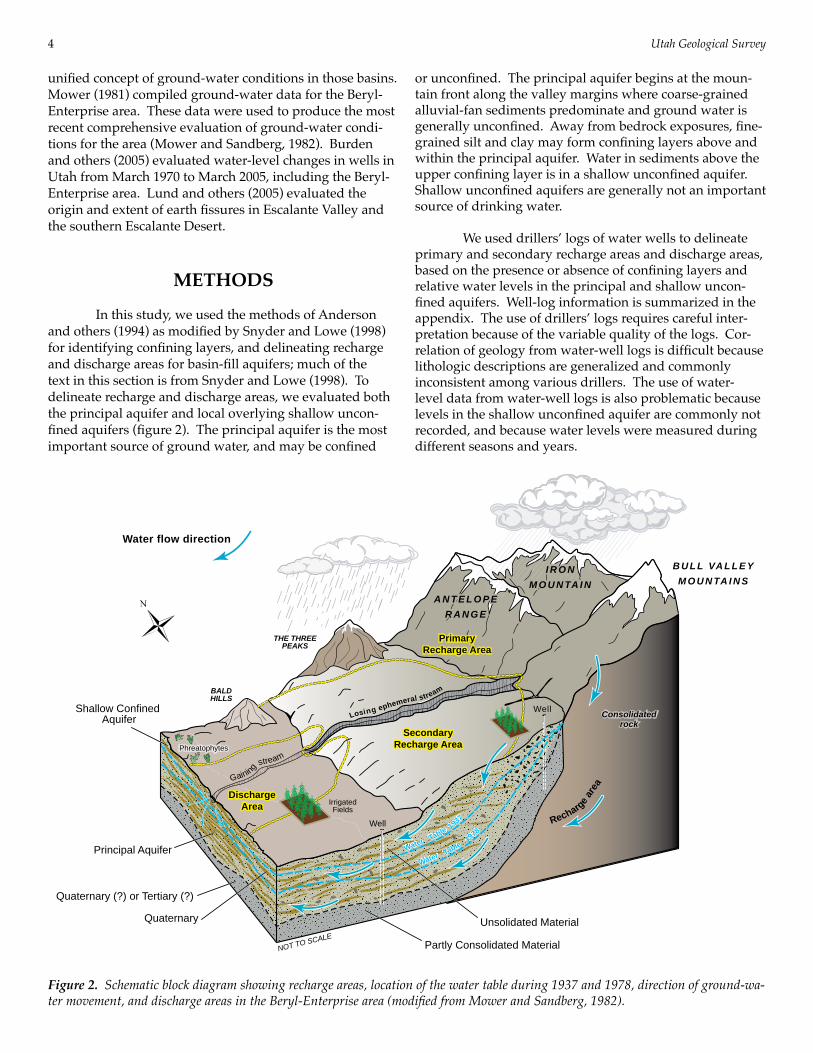
Confining layers are defined as any fine-grained (clay and/or silt) layer thicker than 20 feet (6 m) (Anderson and others, 1994). Some logs note both clay and sand in the same depth interval, without giving relative percentages; these are not classified as confining layers (Anderson and others, 1994). If both clay and sand are checked and the word “sandy” is written in the remarks column, then the layer is as-sumed to be a primarily clay confining layer (Anderson and others, 1994). Sometimes a driller will mark clay and gravel, cobbles, or boulders; these units also are not classified as confining layers, although in parts of the Beryl-Enterprise area, they may behave as confining layers.
The primary recharge areas for the principal aquifer are the bedrock uplands surrounding and within the valley, and basin fill lacking thick clay layers, generally along valley margins (figure 3). Ground-water flow in primary recharge areas has a significant downward component. If pres-ent, secondary recharge areas begin where clay layers are thicker than 20 feet (6 m) and the hydraulic gradient is downward. Areas of secondary recharge extend toward the valley center until the hydraulic gradient is upward (figure 3). The hydraulic gradient is upward when the potentiometric surface of the principal aquifer is higher than the water table in the shallow unconfined aqui-fer (Anderson and others, 1994). Water-lev-el data for the shallow unconfined aquifer are not common, but are recorded on some water-well logs. Where confining layers extend to the ground surface, secondary re-charge is mapped when the potentiometric surface in the principal aquifer is below the ground surface.
Ground-water discharge areas are at lower elevations than recharge areas. In discharge areas, the water in confined aquifers discharges to the land surface or to a shallow unconfined aquifer (figure 3). For this to happen, the hydraulic head in the principal aquifer must be higher than the water table in the shallow unconfined aqui-fer. Otherwise, downward pressure from the shallow aquifer will exceed the upward pressure from the confined aquifer, creating a net downward hydraulic gradient indica-tive of secondary recharge areas. Flowing (artesian) wells are marked on drillers’ logs and some flowing wells are shown on U.S. Figure 3. Relative water levels in wells in recharge and discharge areas (modified from
Snyder and Lowe, 1998).
SECONDARY RECHARGE AREAS
shallow aquifer
confining layer
principal aquifer
confining layer
principal aquifer
DISCHARGE AREAS, CONFINED AQUIFER
confining layer
principal aquifer
flowing well
shallow aquifer
confining layer
principal aquifer
DISCHARGE AREA, UNCONFINED AQUIFER
principal aquifer
valley fillaquifer
fractured bedrock
Explanation
Water level in well
Well with perforated intervals
Direction of ground-water flow
PRIMARY RECHARGE AREA
Figure 3. Relative water levels in wells in recharge and discharge areas (modified from Snyder and Lowe, 1998).
Explanation
Utah Geological Survey6
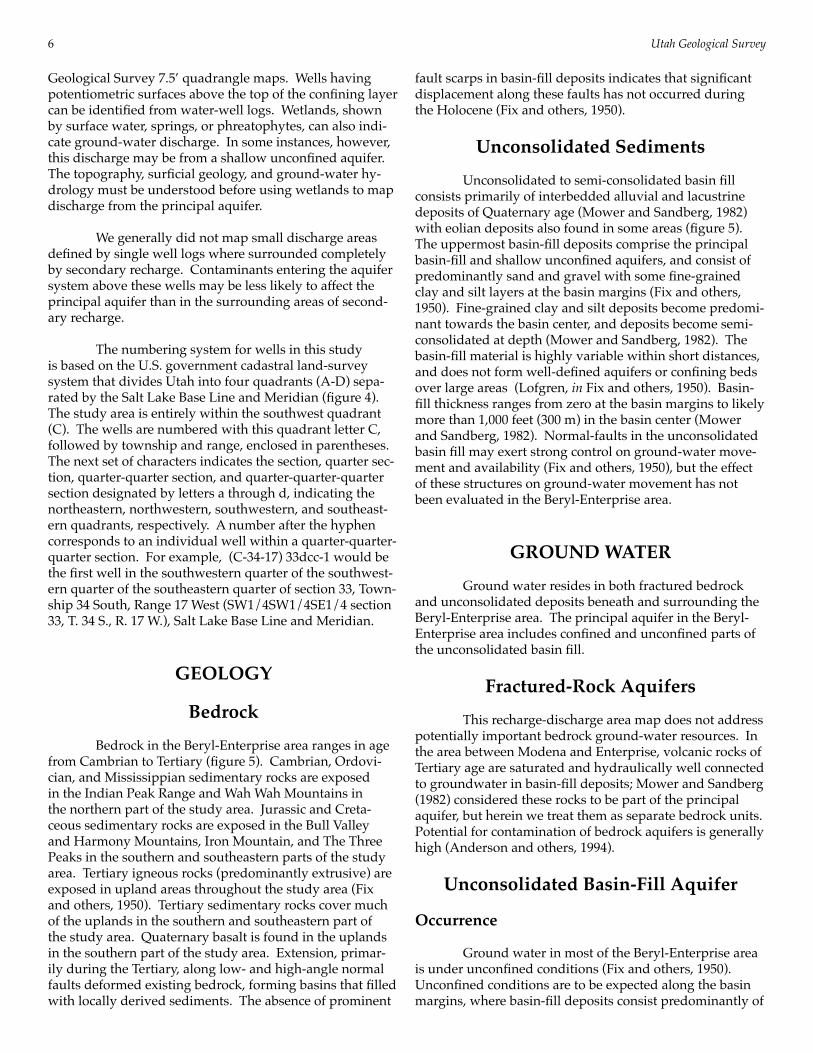
Geological Survey 7.5’ quadrangle maps. Wells having potentiometric surfaces above the top of the confining layer can be identified from water-well logs. Wetlands, shown by surface water, springs, or phreatophytes, can also indi-cate ground-water discharge. In some instances, however, this discharge may be from a shallow unconfined aquifer. The topography, surficial geology, and ground-water hy-drology must be understood before using wetlands to map discharge from the principal aquifer.
We generally did not map small discharge areas defined by single well logs where surrounded completely by secondary recharge. Contaminants entering the aquifer system above these wells may be less likely to affect the principal aquifer than in the surrounding areas of second-ary recharge.
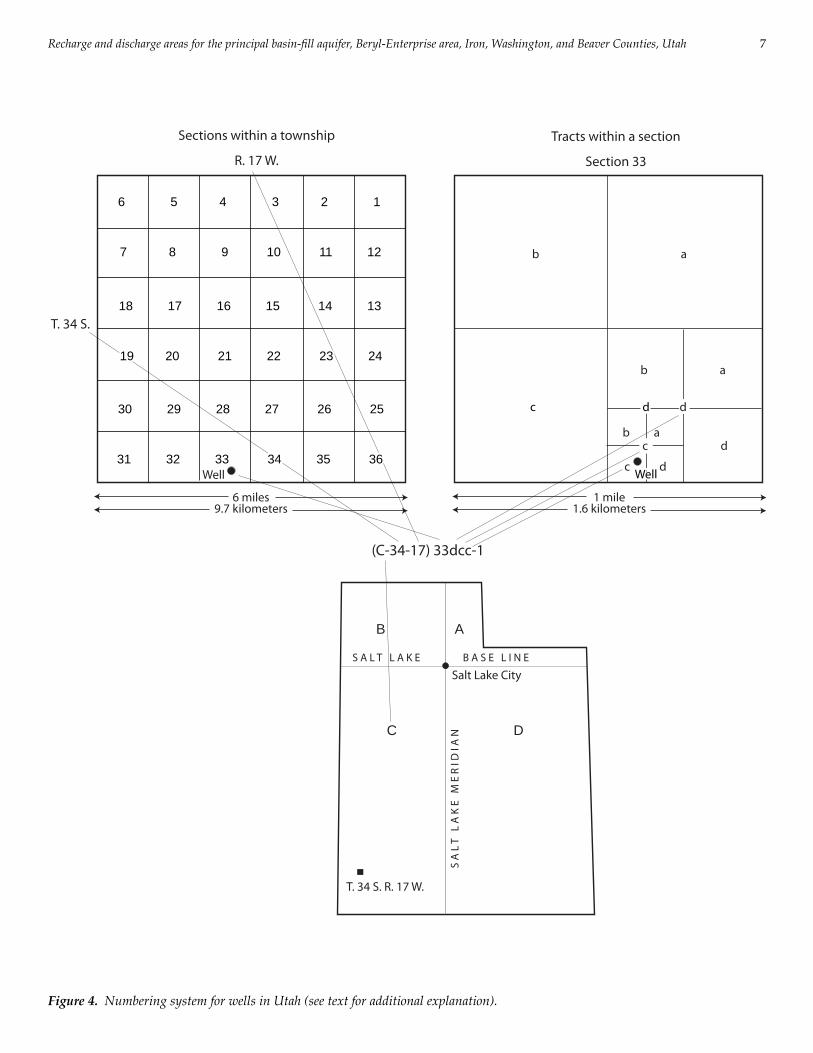
The numbering system for wells in this study is based on the U.S. government cadastral land-survey system that divides Utah into four quadrants (A-D) sepa-rated by the Salt Lake Base Line and Meridian (figure 4). The study area is entirely within the southwest quadrant (C). The wells are numbered with this quadrant letter C, followed by township and range, enclosed in parentheses. The next set of characters indicates the section, quarter sec-tion, quarter-quarter section, and quarter-quarter-quarter section designated by letters a through d, indicating the northeastern, northwestern, southwestern, and southeast-ern quadrants, respectively. A number after the hyphen corresponds to an individual well within a quarter-quarter-quarter section. For example, (C-34-17) 33dcc-1 would be the first well in the southwestern quarter of the southwest-ern quarter of the southeastern quarter of section 33, Town-ship 34 South, Range 17 West (SW1/4SW1/4SE1/4 section 33, T. 34 S., R. 17 W.), Salt Lake Base Line and Meridian.
GEOLOGY
Bedrock
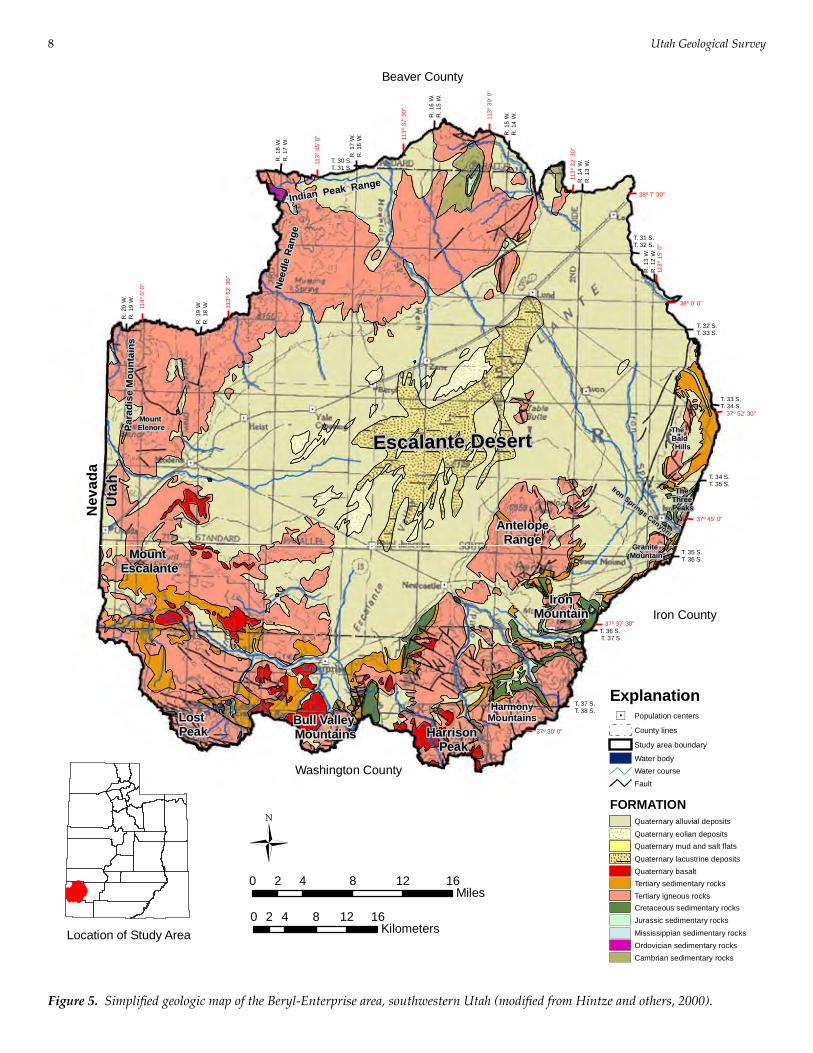
Bedrock in the Beryl-Enterprise area ranges in age from Cambrian to Tertiary (figure 5). Cambrian, Ordovi-cian, and Mississippian sedimentary rocks are exposed in the Indian Peak Range and Wah Wah Mountains in the northern part of the study area. Jurassic and Creta-ceous sedimentary rocks are exposed in the Bull Valley and Harmony Mountains, Iron Mountain, and The Three Peaks in the southern and southeastern parts of the study area. Tertiary igneous rocks (predominantly extrusive) are exposed in upland areas throughout the study area (Fix and others, 1950). Tertiary sedimentary rocks cover much of the uplands in the southern and southeastern part of the study area. Quaternary basalt is found in the uplands in the southern part of the study area. Extension, primar-ily during the Tertiary, along low- and high-angle normal faults deformed existing bedrock, forming basins that filled with locally derived sediments. The absence of prominent
fault scarps in basin-fill deposits indicates that significant displacement along these faults has not occurred during the Holocene (Fix and others, 1950).
Unconsolidated Sediments
Unconsolidated to semi-consolidated basin fill consists primarily of interbedded alluvial and lacustrine deposits of Quaternary age (Mower and Sandberg, 1982) with eolian deposits also found in some areas (figure 5). The uppermost basin-fill deposits comprise the principal basin-fill and shallow unconfined aquifers, and consist of predominantly sand and gravel with some fine-grained clay and silt layers at the basin margins (Fix and others, 1950). Fine-grained clay and silt deposits become predomi-nant towards the basin center, and deposits become semi-consolidated at depth (Mower and Sandberg, 1982). The basin-fill material is highly variable within short distances, and does not form well-defined aquifers or confining beds over large areas (Lofgren, in Fix and others, 1950). Basin-fill thickness ranges from zero at the basin margins to likely more than 1,000 feet (300 m) in the basin center (Mower and Sandberg, 1982). Normal-faults in the unconsolidated basin fill may exert strong control on ground-water move-ment and availability (Fix and others, 1950), but the effect of these structures on ground-water movement has not been evaluated in the Beryl-Enterprise area.
GROUND WATER
Ground water resides in both fractured bedrock and unconsolidated deposits beneath and surrounding the Beryl-Enterprise area. The principal aquifer in the Beryl-Enterprise area includes confined and unconfined parts of the unconsolidated basin fill.
Fractured-Rock Aquifers
This recharge-discharge area map does not address potentially important bedrock ground-water resources. In the area between Modena and Enterprise, volcanic rocks of Tertiary age are saturated and hydraulically well connected to groundwater in basin-fill deposits; Mower and Sandberg (1982) considered these rocks to be part of the principal aquifer, but herein we treat them as separate bedrock units. Potential for contamination of bedrock aquifers is generally high (Anderson and others, 1994).
Unconsolidated Basin-Fill Aquifer
Occurrence
Ground water in most of the Beryl-Enterprise area is under unconfined conditions (Fix and others, 1950). Unconfined conditions are to be expected along the basin margins, where basin-fill deposits consist predominantly of
Recharge and discharge areas for the principal basin-fill aquifer, Beryl-Enterprise area, Iron, Washington, and Beaver Counties, Utah 7
b
b a
b a
c d
Sections within a township
R. 17 W.
Tracts within a section
Section 33
1 mile1.6 kilometers
(C-34-17) 33dcc-1
T. 34 S.
6 miles9.7 kilometers
d
a
B A
C D
T. 34 S. R. 17 W.
Salt Lake City S A L T L A K E B A S E L I N E
S A
L T
L
A K
E
M E
R I
D I
A N
Figure 4. Numbering system for wells in Utah (see text for additional explanation).
6 5 4 3 2 16 5 4 3 2 1
7 8 9 10 11 127 8 9 10 11 12
18 17 16 15 14 1318 17 16 15 14 13
30 29 28 27 26 2530 29 28 27 26 25
31 32 33 34 35 3631 32 33 34 35 36
19 20 21 22 23 2419 20 21 22 23 24
c dc d
c
Well WellWell
d
Figure 4. Numbering system for wells in Utah (see text for additional explanation).
Utah Geological Survey8
R.1
8W
.R
.17
W.
R.1
3W
.R
.12
W.
R.2
0W
.R
.19
W.
T. 33 S.T. 34 S.
T. 35 S.T. 36 S.
T. 32 S.T. 33 S.
T. 34 S.T. 35 S.
T. 30 S.T. 31 S.
T. 31 S.T. 32 S.
R.1
9W
.R
.18
W.
R.1
6W
.R
.15
W.
R.1
5W
.R
.14
W.
T. 37 S.T. 38 S.
T. 36 S.T. 37 S.
R.1
7W
.R
.16
W.
R.1
4W
.R
.13
W.
113º
22'3
0"
113º
52'3
0"
37º 45' 0"
37º 37' 30"
38º 7' 30"
114º
0'0"
37º 52' 30"
38º 0' 0"
113º
30'0
"
113º
37'3
0"
113º
45'0
"
113º
15'0
"
37º 30' 0"
LostPeak
MountEscalante
MountElenore
Indian Peak Range
GraniteMountain
IronMountain
HarrisonPeak
Bull ValleyMountains
Escalante Desert
AntelopeRange
TheBaldHills
Iron Springs Canyon
Para
dise
Mou
ntai
ns
HarmonyMountains
Nee
dle
Ran
ge
TheThreePeaks
Figure 5. Simplified geologic map of the Beryl-Enterprise area, southwestern Utah (modified from Hintze and others, 2000).
Beaver County
Iron County
Washington County
Uta
hN
evad
a
Location of Study Area
0 4 8 12 162Miles
0 4 8 12 162Kilometers
Explanation
FORMATION
Jurassic sedimentary rocksCretaceous sedimentary rocks
Mississippian sedimentary rocksOrdovician sedimentary rocks
Quaternary alluvial depositsQuaternary eolian depositsQuaternary mud and salt flats
Tertiary sedimentary rocksTertiary igneous rocks
Quaternary basaltQuaternary lacustrine deposits
Cambrian sedimentary rocks
Fault
Population centers
Study area boundary
Water courseWater body
County lines
Figure 5. Simplified geologic map of the Beryl-Enterprise area, southwestern Utah (modified from Hintze and others, 2000).
Recharge and discharge areas for the principal basin-fill aquifer, Beryl-Enterprise area, Iron, Washington, and Beaver Counties, Utah 9
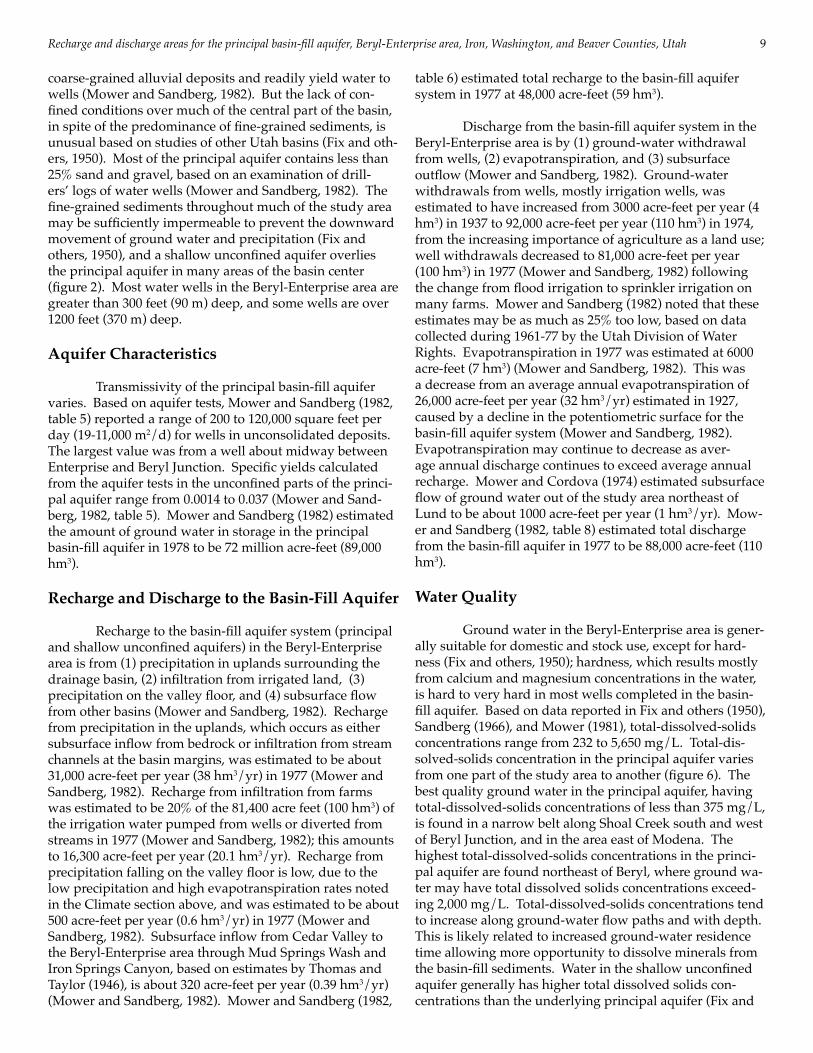
coarse-grained alluvial deposits and readily yield water to wells (Mower and Sandberg, 1982). But the lack of con-fined conditions over much of the central part of the basin, in spite of the predominance of fine-grained sediments, is unusual based on studies of other Utah basins (Fix and oth-ers, 1950). Most of the principal aquifer contains less than 25% sand and gravel, based on an examination of drill-ers’ logs of water wells (Mower and Sandberg, 1982). The fine-grained sediments throughout much of the study area may be sufficiently impermeable to prevent the downward movement of ground water and precipitation (Fix and others, 1950), and a shallow unconfined aquifer overlies the principal aquifer in many areas of the basin center (figure 2). Most water wells in the Beryl-Enterprise area are greater than 300 feet (90 m) deep, and some wells are over 1200 feet (370 m) deep.
Aquifer Characteristics
Transmissivity of the principal basin-fill aquifer varies. Based on aquifer tests, Mower and Sandberg (1982, table 5) reported a range of 200 to 120,000 square feet per day (19-11,000 m2/d) for wells in unconsolidated deposits. The largest value was from a well about midway between Enterprise and Beryl Junction. Specific yields calculated from the aquifer tests in the unconfined parts of the princi-pal aquifer range from 0.0014 to 0.037 (Mower and Sand-berg, 1982, table 5). Mower and Sandberg (1982) estimated the amount of ground water in storage in the principal basin-fill aquifer in 1978 to be 72 million acre-feet (89,000 hm3).
Recharge and Discharge to the Basin-Fill Aquifer Recharge to the basin-fill aquifer system (principal and shallow unconfined aquifers) in the Beryl-Enterprise area is from (1) precipitation in uplands surrounding the drainage basin, (2) infiltration from irrigated land, (3) precipitation on the valley floor, and (4) subsurface flow from other basins (Mower and Sandberg, 1982). Recharge from precipitation in the uplands, which occurs as either subsurface inflow from bedrock or infiltration from stream channels at the basin margins, was estimated to be about 31,000 acre-feet per year (38 hm3/yr) in 1977 (Mower and Sandberg, 1982). Recharge from infiltration from farms was estimated to be 20% of the 81,400 acre feet (100 hm3) of the irrigation water pumped from wells or diverted from streams in 1977 (Mower and Sandberg, 1982); this amounts to 16,300 acre-feet per year (20.1 hm3/yr). Recharge from precipitation falling on the valley floor is low, due to the low precipitation and high evapotranspiration rates noted in the Climate section above, and was estimated to be about 500 acre-feet per year (0.6 hm3/yr) in 1977 (Mower and Sandberg, 1982). Subsurface inflow from Cedar Valley to the Beryl-Enterprise area through Mud Springs Wash and Iron Springs Canyon, based on estimates by Thomas and Taylor (1946), is about 320 acre-feet per year (0.39 hm3/yr) (Mower and Sandberg, 1982). Mower and Sandberg (1982,
table 6) estimated total recharge to the basin-fill aquifer system in 1977 at 48,000 acre-feet (59 hm3).
Discharge from the basin-fill aquifer system in the Beryl-Enterprise area is by (1) ground-water withdrawal from wells, (2) evapotranspiration, and (3) subsurface outflow (Mower and Sandberg, 1982). Ground-water withdrawals from wells, mostly irrigation wells, was estimated to have increased from 3000 acre-feet per year (4 hm3) in 1937 to 92,000 acre-feet per year (110 hm3) in 1974, from the increasing importance of agriculture as a land use; well withdrawals decreased to 81,000 acre-feet per year (100 hm3) in 1977 (Mower and Sandberg, 1982) following the change from flood irrigation to sprinkler irrigation on many farms. Mower and Sandberg (1982) noted that these estimates may be as much as 25% too low, based on data collected during 1961-77 by the Utah Division of Water Rights. Evapotranspiration in 1977 was estimated at 6000 acre-feet (7 hm3) (Mower and Sandberg, 1982). This was a decrease from an average annual evapotranspiration of 26,000 acre-feet per year (32 hm3/yr) estimated in 1927, caused by a decline in the potentiometric surface for the basin-fill aquifer system (Mower and Sandberg, 1982). Evapotranspiration may continue to decrease as aver-age annual discharge continues to exceed average annual recharge. Mower and Cordova (1974) estimated subsurface flow of ground water out of the study area northeast of Lund to be about 1000 acre-feet per year (1 hm3/yr). Mow-er and Sandberg (1982, table 8) estimated total discharge from the basin-fill aquifer in 1977 to be 88,000 acre-feet (110 hm3).
Water Quality
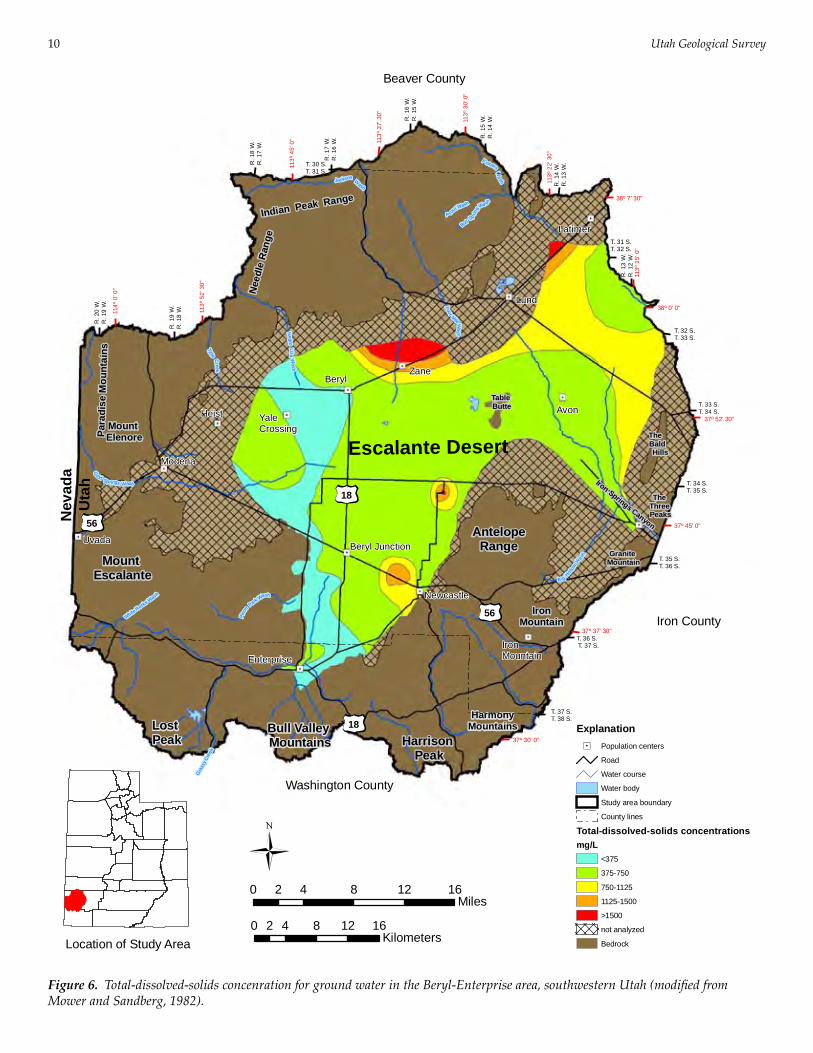
Ground water in the Beryl-Enterprise area is gener-ally suitable for domestic and stock use, except for hard-ness (Fix and others, 1950); hardness, which results mostly from calcium and magnesium concentrations in the water, is hard to very hard in most wells completed in the basin-fill aquifer. Based on data reported in Fix and others (1950), Sandberg (1966), and Mower (1981), total-dissolved-solids concentrations range from 232 to 5,650 mg/L. Total-dis-solved-solids concentration in the principal aquifer varies from one part of the study area to another (figure 6). The best quality ground water in the principal aquifer, having total-dissolved-solids concentrations of less than 375 mg/L, is found in a narrow belt along Shoal Creek south and west of Beryl Junction, and in the area east of Modena. The highest total-dissolved-solids concentrations in the princi-pal aquifer are found northeast of Beryl, where ground wa-ter may have total dissolved solids concentrations exceed-ing 2,000 mg/L. Total-dissolved-solids concentrations tend to increase along ground-water flow paths and with depth. This is likely related to increased ground-water residence time allowing more opportunity to dissolve minerals from the basin-fill sediments. Water in the shallow unconfined aquifer generally has higher total dissolved solids con-centrations than the underlying principal aquifer (Fix and
Utah Geological Survey10
R.1
8W
.R
.17
W.
R.1
3W
.R
.12
W.
R.2
0W
.R
.19
W.
T. 33 S.T. 34 S.
T. 35 S.T. 36 S.
T. 32 S.T. 33 S.
T. 34 S.T. 35 S.
T. 30 S.T. 31 S.
T. 31 S.T. 32 S.
R.1
9W
.R
.18
W.
R.1
6W
.R
.15
W.
R.1
5W
.R
.14
W.
T. 37 S.T. 38 S.
T. 36 S.T. 37 S.
R.1
7W
.R
.16
W.
R.1
4W
.R
.13
W.
EnterpriseIronMountain
Newcastle
Beryl JunctionUvada
Modena
Heist YaleCrossing
Avon
BerylZane
Lund
Latimer
113º
22'3
0"
113º
52'3
0"
37º 45' 0"
37º 37' 30"
38º 7' 30"
114º
0'0"
37º 52' 30"
38º 0' 0"
113º
30'0
"
113º
37'3
0"
113º
45'0
"
113º
15'0
"
37º 30' 0"
LostPeak
MountEscalante
MountElenore
Indian Peak Range
GraniteMountain
IronMountain
HarrisonPeak
Bull ValleyMountains
Escalante Desert
AntelopeRange
TheBaldHills
Iron Springs Canyon
Para
dise
Mou
ntai
ns
HarmonyMountains
TableButte
Nee
dle
Ran
ge
TheThreePeaks
G
old Spri ngs Wash
Four MileW
ash
JacksonW
ash
Negr o
LizaW
ash
Gra
ssy C
reek
Ti l lieC
ree k
B ig
Hollow
Was
h
P rout Wash
F ishers
Wash
BullSp rin
gWa sh
WhiteRocks Wash
Pino
n
Park Wash
18
56
56
18
Figure 6. Total-dissolved-solids concentration for ground water in the Beryl-Enterprise area, southwestern Utah (modified fromMower and Sandberg, 1982).
Beaver County
Iron County
Washington County
Uta
hN
evad
a
Location of Study Area
0 4 8 12 162Miles
0 4 8 12 162Kilometers
ExplanationPopulation centers
Road
Water course
Water body
Study area boundary
County lines
Total-dissolved-solids concentrationsmg/L
<375
375-750
750-1125
1125-1500
>1500
not analyzed
Bedrock
Figure 6. Total-dissolved-solids concenration for ground water in the Beryl-Enterprise area, southwestern Utah (modified from Mower and Sandberg, 1982).
Recharge and discharge areas for the principal basin-fill aquifer, Beryl-Enterprise area, Iron, Washington, and Beaver Counties, Utah 11
others, 1950). Some wells in the study area have exceeded primary water-quality (health) standards for nitrate and fluoride, and some wells have exceeded secondary water-quality (taste, odor, etc.) for sulfate and chloride (Fix and others, 1950; Mower and Sandberg, 1982).
Ground-Water Flow Direction and Water Levels in Wells
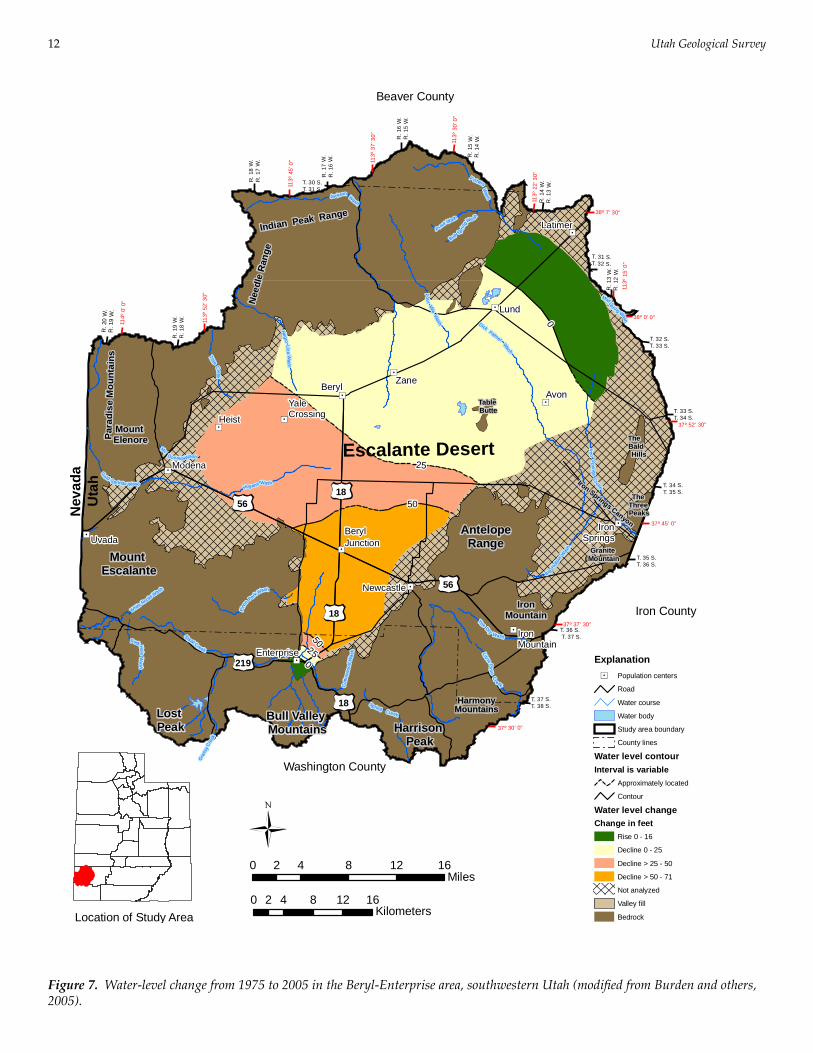
Prior to large-scale water-well pumping in the Beryl-Enterprise area, ground-water flow in the principal aquifer was from the valley margins toward the valley center, and then to the northeast out of the study area (Fix and others, 1950). Large-scale water-well pumping, needed to support the predominantly agricultural land uses in this arid area, caused decline of the water table by more than 5 feet (1.5 m) over a 30 square-mile (80 km2) area between 1945 and 1949 (Fix and others, 1950). By 1951, water-level declines of as much as 13 feet (4 m) were observed in some water wells in the southern end of the Beryl-Enterprise area (Thomas and others, 1952), and Fix and others (1950) attrib-uted these declines to discharge from water wells exceed-ing natural replenishment to the principal aquifer. From 1951 to 1953, water levels in some wells in the central part of the basin declined an additional 5 feet (1.5 m) despite an above-average precipitation year in 1952 (Waite and others, 1954). Between 1952 and 1962, water-level declines of up to 32 feet (10 m) occurred in some wells in the southern part of the basin (Sandberg, 1966). For the period between 1937 to 1978, water levels in some wells in the southern part of the basin had declined as much as 70 feet (20 m) (Mower and Sandberg, 1982, figure 5), and had caused ground water in the southern part of the basin to flow towards the Beryl Junction area (Mower and Sandberg, 1982, plate 8) rather than northward. Figure 7 shows the change in water level between 1975 and 2005 (illustrating a consistent trend in water-level declines over time in the Beryl-Enter-prise area). In addition to altering the configuration of the potentiometric surface, dewatering of the upper part of the principal aquifer and concomitant aquifer compaction may have caused ground-surface subsidence and resultant earth fissures, identified in the southern part of the basin follow-ing a flood in January 2005 (Lund and others, 2005).
RESULTS
Recharge and Discharge Areas
Primary recharge areas (plate 1) include the bedrock uplands (including Table Butte) and the upper parts of alluvial fans along the basin margins in the west-ern, southern, and southeastern part of the study area; an area of basin fill north of Lund is also a primary recharge area. Basin fill in these areas consists mostly of sand and gravel lacking thick silt and clay layers (figure 2). Areas of secondary recharge (plate 1), having a thick confining
layer and a downward vertical ground-water flow gradient (figure 2), cover much of the central and northwestern parts of the study area.
We mapped discharge areas (plate 1) in a zone extending from the central part of the basin north of Beryl Junction to the northeastern study area boundary. This mapping is based on the presence of thick clay layers and an upward ground-water gradient (figure 2) derived from information recorded on water-well drillers’ logs at the time the wells were drilled. Because the potentio-metric surface of the principal aquifer has been lowered, as discussed above, the discharge areas within the Beryl-Enterprise area have likely shrunk and became secondary recharge areas. Defining the current potentiometric surface by obtaining new-water level data for existing wells is beyond the scope of this study.
Potential for Water-Quality Degradation
Based solely on ground-water recharge- and dis-charge-area mapping, the potential for ground-water con-tamination in the Beryl-Enterprise area is moderate. Much of the water in the principal basin-fill aquifer comes from bedrock uplands where few pollutants exist that could enter the system, but many potential contamination sources exist on the basin-fill deposits.
Some of these potential contamination sources are in primary recharge areas where the principal aquifer has no significant hydrogeologic barriers to contamination by pesticides or other water-borne contaminants. Care must be taken in siting potential contaminant sources, such as feed lots and septic tanks, especially in primary recharge areas. The widespread clay layers in the center of the Beryl-En-terprise area may provide some protection to the principal aquifer, but their lateral continuity is not assured. Ground water in discharge areas in the central part of the basin is least susceptible to potential contaminants, but the areal extent of these discharge areas is likely decreasing as the potentiometric surface for the aquifer lowers because of ground-water pumping. Consequently, the discharge areas should be treated as secondary recharge areas for land-use planning purposes. Additionally, earth fissures associated with land-surface subsidence from aquifer compaction may provide preferential pathways for aquifer contamination. Further study is required to make specific evaluations of sources and fate of contaminants.
SUMMARY AND CONCLUSIONS
The principal basin-fill aquifer of the Beryl-Enter-prise area consists of interbedded alluvial-fan and lacus-trine deposits. Confined and unconfined parts of the prin-cipal aquifer provide both culinary and agricultural water. Most ground water resides in unconfined parts of the prin-cipal aquifer. The mountains that surround the basin-fill
Utah Geological Survey12Utah Geological Survey12
R.1
8W
.R
.17
W.
113º
22' 3
0"
113º
30' 0
"
R. 1
3W
.R
. 12
W.
113º
45' 0
"
R. 2
0W
.R
. 19
W.
113º
37' 3
0"
38º 0' 0"
T. 33 S.T. 34 S.
T. 35 S.T. 36 S.
T. 32 S.T. 33 S.
38º 7' 30"
T. 34 S.T. 35 S.
37º 37' 30"
T. 30 S.T. 31 S.
T. 31 S.T. 32 S.
37º 45' 0"
R.1
9W
.R
. 18
W.
113º
52'3
0"
R. 1
6W
.R
. 15
W.
R. 1
5W
.R
. 14
W.
37º 30' 0"
T. 37 S.T. 38 S.
37º 52' 30"
T. 36 S.T. 37 S.
R.1
7W
.R
.16
W.
R. 1
4W
.R
. 13
W.
114º
0'0"
113º
15' 0
"
1856
18
56
219
18LostPeak
MountEscalante
MountElenore
Indian Peak Range
GraniteMountain
IronMountain
HarrisonPeak
Bull ValleyMountains
Escalante Desert
AntelopeRange
TheBaldHills
Iron Springs Canyon
Para
dise
Mou
ntai
ns
TableButte
Nee
dle
Ran
ge
TheThreePeaks
TheDry
Wash
Spring C reek
MudSp ring Wash
IronS
pri n
gsC
reek
G
o ld Springs Wash
Fou
rMile
Wash
Jackson Wash
NegroL iz a
Was
h
Hog an s Wash
Gra
ssy
Cree
k
Shoal C reek
Til lieC
reek
B igHoll
owW
ash
DickPalmer
Wash
P rout Wash
Mc
D o nal d Wash
F is hers
Wash
Li tt le Pin toC
r eek
Bull Sp ringW
a sh
WhiteRocks
Wash
Cot
tonw
ood
Was
h
Rock HoleW
as h
Pino
n
ParkWash
0
25
0
5050
25Enterprise
IronMountain
Newcastle
BerylJunctionUvada
IronSprings
Modena
Heist
YaleCrossing
AvonBeryl
Zane
Lund
Latimer
Beaver County
Iron County
Washington County
Uta
hN
evad
a
Location of Study Area
0 4 8 12 162Miles
0 4 8 12 162Kilometers
ExplanationPopulation centers
Road
Water course
Water body
Study area boundary
County lines
Water level contourInterval is variable
Approximately located
Contour
Water level changeChange in feet
Rise 0 - 16
Decline 0 - 25
Decline > 25 - 50
Decline > 50 - 71
Not analyzed
Valley fill
Bedrock
HarmonyMountainsHarmony
Mountains
Figure 7. Water-level change from 1975-2005 in the Beryl-Enterprise area, southwestern Utah(modified from Burden and others, 2005).Figure 7. Water-level change from 1975 to 2005 in the Beryl-Enterprise area, southwestern Utah (modified from Burden and others,
2005).
Recharge and discharge areas for the principal basin-fill aquifer, Beryl-Enterprise area, Iron, Washington, and Beaver Counties, Utah 13
deposits, Table Butte, and the uppermost parts of alluvial fans along the margins of the basin make up the primary recharge areas. Secondary recharge areas, which contain clay or silt confining layers greater than 20 feet (6 m) thick, cover much of the central part of the basin fill. Discharge areas for the principal aquifer occur in the central part of the basin in a zone extending from north of Beryl Junc-tion to the northeastern study area boundary. Declining ground-water levels in the principal basin-fill aquifer are causing the discharge area to shrink, while the secondary recharge area is expanding. Accordingly, zones currently plotted as discharge areas should be treated as secondary recharge areas for land-use planning. Ground-water flow is generally from the mountains toward the center of the valley, and then northeastward toward the Milford area. Water quality is generally moderate, with total-dissolved-solids concentrations of less than 1000 mg/L across most of the Beryl-Enterprise area, but most ground water is hard to very hard. High nitrate concentrations in some wells completed in the basin-fill aquifer underscore the need to consider the potential for ground-water contamination in land-use decisions.
ACKNOWLEDGMENTS
We thank Lucy Jordan, Robert Ressetar, and Kimm Harty, Utah Geological Survey, for their comments and reviews. Scott Horn and Kim Nay assisted with preparing the map and figures used in this report.
REFERENCES
Anderson, P.B., Susong, D.D., Wold, S.R., Heilweil, V.M., and Baskin, R.L., 1994, Hydrogeology of recharge areas and water quality of the principal aquifers along the Wasatch Front and adjacent areas, Utah: U.S. Geologi-cal Survey Water-Resources Investigations Report 93-4221, 74 p., scale 1:100,000.
Ashcroft, G.L., Jensen, D.T., and Brown, J.L., 1992, Utah climate: Utah Climate Center, Utah State University, 127 p.
Burden, C.B., and others, 2005, Ground-water conditions in Utah, spring of 2005: Utah Division of Water Resources Cooperative Investigations Report No. 46, 138 p.
Clyde, G.D., 1941, Irrigation water pumping costs in Beryl area, investigated: Farm and Home Science, v. 2, no. 1, p. 7-8.
Connor, J.G., Mitchell, C.G., and others, 1958, A compila-tion of chemical quality data for ground and surface waters in Utah: Utah State Engineer Technical Publica-tion 10, 276 p.
Demographic and Economic Analysis Section, 2001, Utah
data guide, spring 2001: Salt Lake City, Utah Gover-nor’s Office of Budget and Planning, 16 p.
—2005, Utah data guide, summer/fall 2005: Salt Lake City, Utah Governor’s Office of Budget and Planning, 12 p.
Fix, P.F., Nelson, W.B., Lofgren, B.E., and Butler, R.G., 1950, Ground-water in the Escalante Valley, Beaver, Iron, and Washington Counties, Utah: Utah State Engineer 27th Biennial Report, p. 109-210.
Hintze, L.F., Willis, G.C., Laes, D.Y.M., Sprinkel, D.A., and Brown, K.D., 2000, Digital geologic map of Utah: Utah Geological Survey Map 179DM, CD-ROM.
Lowe, M., and Snyder, N.P., 1996, Protecting ground water at its source through recharge-area mapping: Utah Geological Survey, Survey Notes, v. 28, no. 1, p. 6-7.
Lund, W.R., DuRoss, C.B., Kirby, S.M., McDonald, G.N., Hunt, G., and Vice, G.S., 2005, The origin and extent of earth fissures in Escalante Valley, southern Escalante Desert, Iron County, Utah: Utah Geological Survey Special Study 115, 30 p., CD-ROM.
Mower, R.W., 1981, Ground-water data for the Beryl-Enter-prise area, Escalante Desert, Utah: Utah Hydrologic-Data Report 35, 64 p.
Mower, R.W., and Cordova, R.M., 1974, Water resources of the Milford area, Utah, with emphasis on ground wa-ter: Utah Department of Natural Resources Technical Publication No. 43, 106 p.
Mower, R.W., and Sandberg, G.W., 1982, Hydrology of the Beryl-Enterprise area, Escalante Desert, Utah, with em-phasis on ground water: Utah Department of Natural Resources Technical Publication No. 73, 66 p.
Sandberg, G.W., 1963, Ground-water data, parts of Wash-ington, Iron, Beaver, and Millard Counties: Utah Basic-Data Report No. 6, 26 p.
—1966, Ground-water resources of selected basins in south-western Utah: Utah State Engineer Technical Publica-tion No. 13, 46 p.
Snyder, N.P., and Lowe, M., 1998, Map of recharge and dis-charge areas for the principal valley-fill aquifer, Sanpete Valley, Sanpete County, Utah: Utah Geological Survey Map 174, 21 p., scale 1:125,000.
Stokes, W.L., 1977, Subdivisions of the major physiographic provinces in Utah: Utah Geology, v. 4, no. 1, p. 1-17.
Thomas, H.E., Nelson, W.B., Lofgren, B.E., and Butler, R.G., 1952, Status of development of selected ground-water basins in Utah: Utah State Engineer Technical Publica-
Utah Geological Survey14
tion No. 7, p. 22-56.
Thomas, H.E., and Taylor, G.H., 1946, Geology and ground-water resources of Cedar City and Parowan Valleys, Iron County, Utah: U.S. Geological Survey Water-Sup-ply Paper 993, 210 p.
Travel Guides, 2006, Escalante Valley: available online at http://escalantevalley.com/, accessed September 29, 2006.
Utah Division of Water Rights, 2005, Water well drilling database, available online at http://www.waterrights.utah.gov/wellinfo/default.asp, accessed August 10, 2005.
Waite, H.A., Nelson, W.B., Lofgren, B.E., Barnell, R.L., and Butler, R.G., 1954, Progress report on selected ground-water basins in Utah: Utah State Engineer Technical Publication 9, 128 p.
White, W.N., 1932, A method of estimating ground-water supplies based on discharge by plants and evaporation from soil: U.S. Geological Survey Water Supply Paper 569-A, p. 48-74.
Recharge and discharge areas for the principal basin-fill aquifer, Beryl-Enterprise area, Iron, Washington, and Beaver Counties, Utah 15
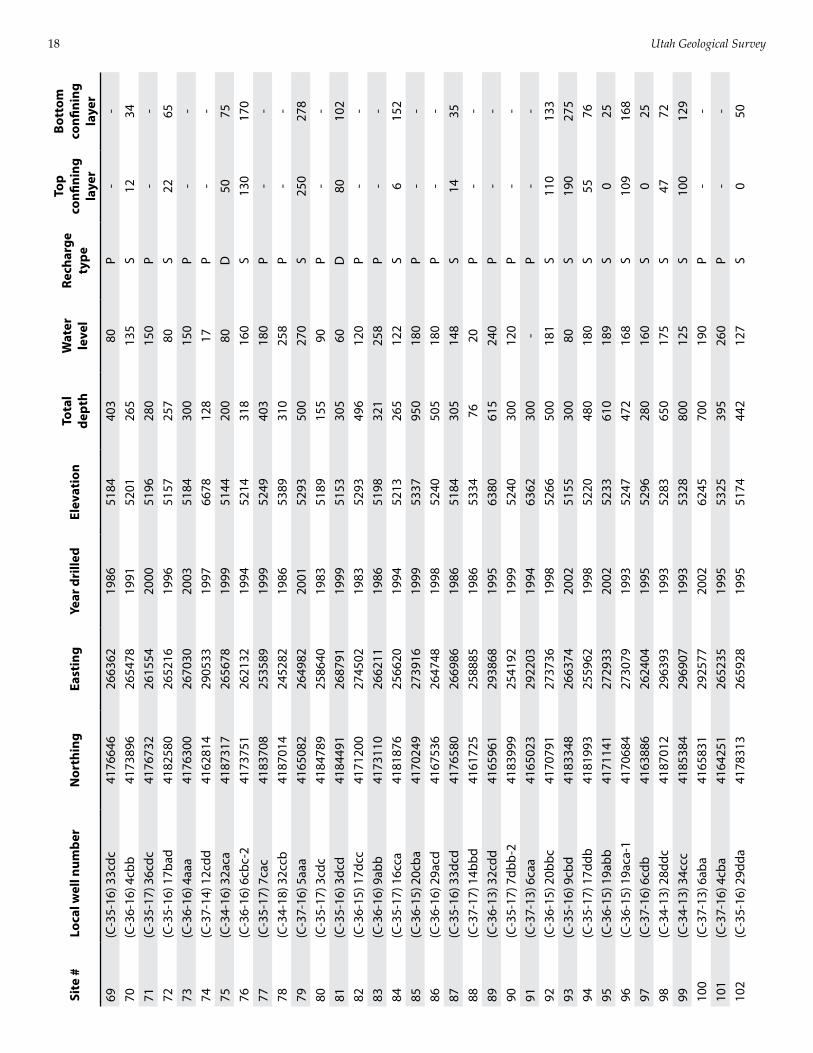
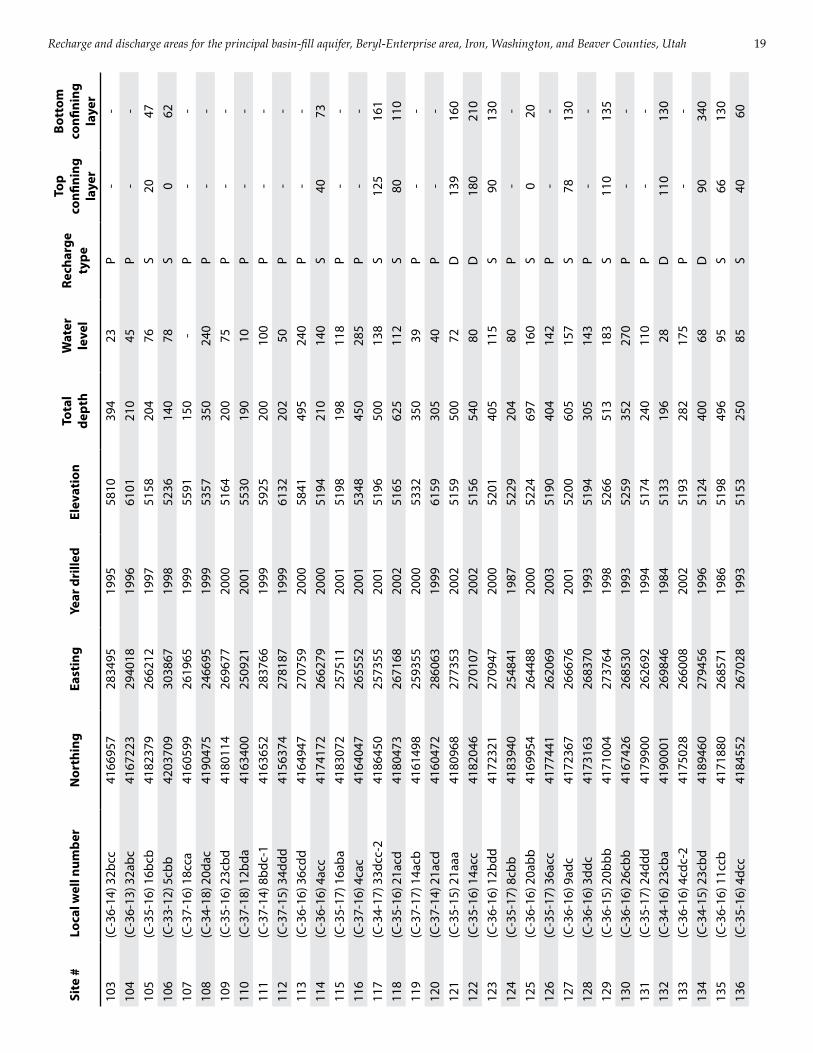
APPENDIX
Records of Wells, Beryl-Enterprise Area, Utah
Explanation
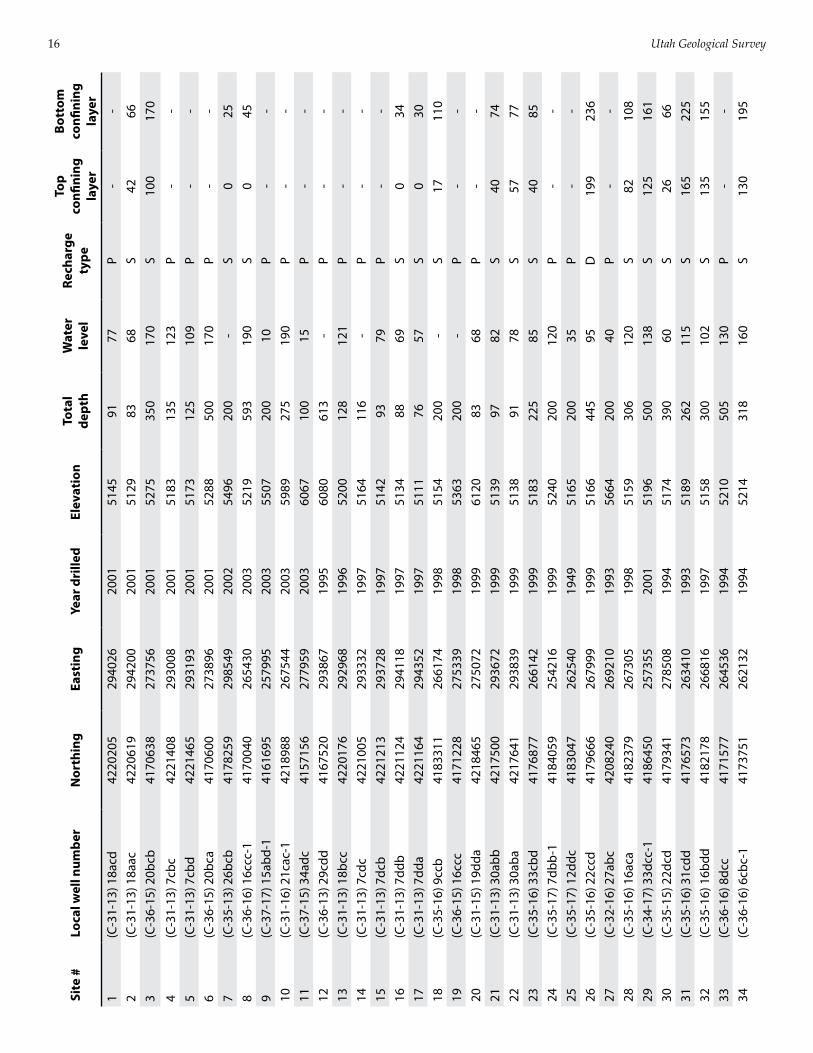
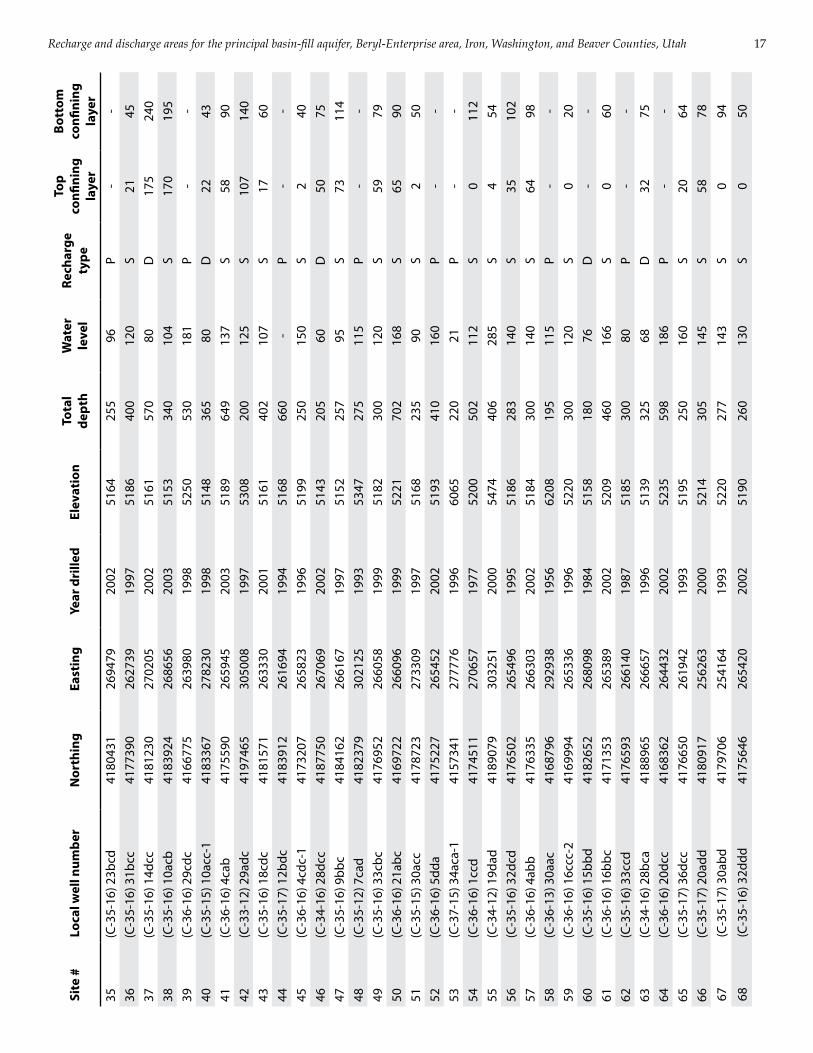
Site number: See plate 1 for well location. Wells not used to define recharge and discharge areas are not plotted.
Local well number or spring cadastral identifier: See text for explanation of well numbering system; spring names and locations from the Utah Division of Water Rights.
Northing: UTM northing coordinate, NAD 27.
Easting: UTM easting coordinate, NAD 27.
Year drilled.
Elevation of wellhead: In feet above sea level.
Total depth: In feet below land surface.
Water level: In feet below land surface; F, flowing well.
Recharge type: P, primary recharge area; S, secondary recharge; D, discharge area.
Top of confining layer: Depth to first confining layer, in feet below land surface.
Bottom of confining layer: Depth to bottom of first confining layer, in feet below land surface.
Utah Geological Survey16
Site
#Lo
cal w
ell n
umbe
rN
orth
ing
East
ing
Year
dri
lled
Elev
atio
nTo
tal
dept
hW
ater
le
vel
Rech
arge
ty
pe
Top
confi
ning
la
yer
Bott
om
confi
ning
la
yer
1(C
-31-
13) 1
8acd
4220
205
2940
2620
0151
4591
77P
--
2(C
-31-
13) 1
8aac
4220
619
2942
0020
0151
2983
68S
4266
3(C
-36-
15) 2
0bcb
4170
638
2737
5620
0152
7535
017
0S
100
170
4(C
-31-
13) 7
cbc
4221
408
2930
0820
0151
8313
512
3P
--
5(C
-31-
13) 7
cbd
4221
465
2931
9320
0151
7312
510
9P
--
6(C
-36-
15) 2
0bca
4170
600
2738
9620
0152
8850
017
0P
--
7(C
-35-
13) 2
6bcb
4178
259
2985
4920
0254
9620
0-
S0
258
(C-3
6-16
) 16c
cc-1
4170
040
2654
3020
0352
1959
319
0S
045
9(C
-37-
17) 1
5abd
-141
6169
525
7995
2003
5507
200
10P
--
10(C
-31-
16) 2
1cac
-142
1898
826
7544
2003
5989
275
190
P-
-11
(C-3
7-15
) 34a
dc41
5715
627
7959
2003
6067
100
15P
--
12(C
-36-
13) 2
9cdd
4167
520
2938
6719
9560
8061
3-
P-
-13
(C-3
1-13
) 18b
cc42
2017
629
2968
1996
5200
128
121
P-
-14
(C-3
1-13
) 7cd
c42
2100
529
3332
1997
5164
116
-P
--
15(C
-31-
13) 7
dcb
4221
213
2937
2819
9751
4293
79P
--
16(C
-31-
13) 7
ddb
4221
124
2941
1819
9751
3488
69S
034
17(C
-31-
13) 7
dda
4221
164
2943
5219
9751
1176
57S
030
18(C
-35-
16) 9
ccb
4183
311
2661
7419
9851
5420
0-
S17
110
19(C
-36-
15) 1
6ccc
4171
228
2753
3919
9853
6320
0-
P-
-20
(C-3
1-15
) 19d
da42
1846
527
5072
1999
6120
8368
P-
-21
(C-3
1-13
) 30a
bb42
1750
029
3672
1999
5139
9782
S40
7422
(C-3
1-13
) 30a
ba42
1764
129
3839
1999
5138
9178
S57
7723
(C-3
5-16
) 33c
bd41
7687
726
6142
1999
5183
225
85S
4085
24(C
-35-
17) 7
dbb-
141
8405
925
4216
1999
5240
200
120
P-
-25
(C-3
5-17
) 12d
dc41
8304
726
2540
1949
5165
200
35P
--
26(C
-35-
16) 2
2ccd
4179
666
2679
9919
9951
6644
595
D19
923
627
(C-3
2-16
) 27a
bc42
0824
026
9210
1993
5664
200
40P
--
28(C
-35-
16) 1
6aca
4182
379
2673
0519
9851
5930
612
0S
8210
829
(C-3
4-17
) 33d
cc-1
4186
450
2573
5520
0151
9650
013
8S
125
161
30(C
-35-
15) 2
2dcd
4179
341
2785
0819
9451
7439
060
S26
6631
(C-3
5-16
) 31c
dd41
7657
326
3410
1993
5189
262
115
S16
522
532
(C-3
5-16
) 16b
dd41
8217
826
6816
1997
5158
300
102
S13
515
533
(C-3
6-16
) 8dc
c41
7157
726
4536
1994
5210
505
130
P-
-34
(C-3
6-16
) 6cb
c-1
4173
751
2621
3219
9452
1431
816
0S
130
195
Recharge and discharge areas for the principal basin-fill aquifer, Beryl-Enterprise area, Iron, Washington, and Beaver Counties, Utah 17
Site
#Lo
cal w
ell n
umbe
rN
orth
ing
East
ing
Year
dri
lled
Elev
atio
nTo
tal
dept
hW
ater
le
vel
Rech
arge
ty
pe
Top
confi
ning
la
yer
Bott
om
confi
ning
la
yer
35(C
-35-
16) 2
3bcd
4180
431
2694
7920
0251
6425
596
P-
-36
(C-3
5-16
) 31b
cc41
7739
026
2739
1997
5186
400
120
S21
4537
(C-3
5-16
) 14d
cc41
8123
027
0205
2002
5161
570
80D
175
240
38(C
-35-
16) 1
0acb
4183
924
2686
5620
0351
5334
010
4S
170
195
39(C
-36-
16) 2
9cdc
4166
775
2639
8019
9852
5053
018
1P
--
40(C
-35-
15) 1
0acc
-141
8336
727
8230
1998
5148
365
80D
2243
41(C
-36-
16) 4
cab
4175
590
2659
4520
0351
8964
913
7S
5890
42(C
-33-
12) 2
9adc
4197
465
3050
0819
9753
0820
012
5S
107
140
43(C
-35-
16) 1
8cdc
4181
571
2633
3020
0151
6140
210
7S
1760
44(C
-35-
17) 1
2bdc
4183
912
2616
9419
9451
6866
0-
P-
-45
(C-3
6-16
) 4cd
c-1
4173
207
2658
2319
9651
9925
015
0S
240
46(C
-34-
16) 2
8dcc
4187
750
2670
6920
0251
4320
560
D50
7547
(C-3
5-16
) 9bb
c41
8416
226
6167
1997
5152
257
95S
7311
448
(C-3
5-12
) 7ca
d41
8237
930
2125
1993
5347
275
115
P-
-49
(C-3
5-16
) 33c
bc41
7695
226
6058
1999
5182
300
120
S59
7950
(C-3
6-16
) 21a
bc41
6972
226
6096
1999
5221
702
168
S65
9051
(C-3
5-15
) 30a
cc41
7872
327
3309
1997
5168
235
90S
250
52(C
-36-
16) 5
dda
4175
227
2654
5220
0251
9341
016
0P
--
53(C
-37-
15) 3
4aca
-141
5734
127
7776
1996
6065
220
21P
--
54(C
-36-
16) 1
ccd
4174
511
2706
5719
7752
0050
211
2S
011
255
(C-3
4-12
) 19d
ad41
8907
930
3251
2000
5474
406
285
S4
5456
(C-3
5-16
) 32d
cd41
7650
226
5496
1995
5186
283
140
S35
102
57(C
-36-
16) 4
abb
4176
335
2663
0320
0251
8430
014
0S
6498
58(C
-36-
13) 3
0aac
4168
796
2929
3819
5662
0819
511
5P
--
59(C
-36-
16) 1
6ccc
-241
6999
426
5336
1996
5220
300
120
S0
2060
(C-3
5-16
) 15b
bd41
8265
226
8098
1984
5158
180
76D
--
61(C
-36-
16) 1
6bbc
4171
353
2653
8920
0252
0946
016
6S
060
62(C
-35-
16) 3
3ccd
4176
593
2661
4019
8751
8530
080
P-
-63
(C-3
4-16
) 28b
ca41
8896
526
6657
1996
5139
325
68D
3275
64(C
-36-
16) 2
0dcc
4168
362
2644
3220
0252
3559
818
6P
--
65(C
-35-
17) 3
6dcc
4176
650
2619
4219
9351
9525
016
0S
2064
66(C
-35-
17) 2
0add
4180
917
2562
6320
0052
1430
514
5S
5878
67(C
-35-
17) 3
0abd
4179
706
2541
6419
9352
2027
714
3S
094
68(C
-35-
16) 3
2ddd
4175
646
2654
2020
0251
9026
013
0S
050
Utah Geological Survey18
Site
#Lo
cal w
ell n
umbe
rN
orth
ing
East
ing
Year
dri
lled
Elev
atio
nTo
tal
dept
hW
ater
le
vel
Rech
arge
ty
pe
Top
confi
ning
la
yer
Bott
om
confi
ning
la
yer
69(C
-35-
16) 3
3cdc
4176
646
2663
6219
8651
8440
380
P-
-70
(C-3
6-16
) 4cb
b41
7389
626
5478
1991
5201
265
135
S12
3471
(C-3
5-17
) 36c
dc41
7673
226
1554
2000
5196
280
150
P-
-72
(C-3
5-16
) 17b
ad41
8258
026
5216
1996
5157
257
80S
2265
73(C
-36-
16) 4
aaa
4176
300
2670
3020
0351
8430
015
0P
--
74(C
-37-
14) 1
2cdd
4162
814
2905
3319
9766
7812
817
P-
-75
(C-3
4-16
) 32a
ca41
8731
726
5678
1999
5144
200
80D
5075
76(C
-36-
16) 6
cbc-
241
7375
126
2132
1994
5214
318
160
S13
017
077
(C-3
5-17
) 7ca
c41
8370
825
3589
1999
5249
403
180
P-
-78
(C-3
4-18
) 32c
cb41
8701
424
5282
1986
5389
310
258
P-
-79
(C-3
7-16
) 5aa
a41
6508
226
4982
2001
5293
500
270
S25
027
880
(C-3
5-17
) 3cd
c41
8478
925
8640
1983
5189
155
90P
--
81(C
-35-
16) 3
dcd
4184
491
2687
9119
9951
5330
560
D80
102
82(C
-36-
15) 1
7dcc
4171
200
2745
0219
8352
9349
612
0P
--
83(C
-36-
16) 9
abb
4173
110
2662
1119
8651
9832
125
8P
--
84(C
-35-
17) 1
6cca
4181
876
2566
2019
9452
1326
512
2S
615
285
(C-3
6-15
) 20c
ba41
7024
927
3916
1999
5337
950
180
P-
-86
(C-3
6-16
) 29a
cd41
6753
626
4748
1998
5240
505
180
P-
-87
(C-3
5-16
) 33d
cd41
7658
026
6986
1986
5184
305
148
S14
3588
(C-3
7-17
) 14b
bd41
6172
525
8885
1986
5334
7620
P-
-89
(C-3
6-13
) 32c
dd41
6596
129
3868
1995
6380
615
240
P-
-90
(C-3
5-17
) 7db
b-2
4183
999
2541
9219
9952
4030
012
0P
--
91(C
-37-
13) 6
caa
4165
023
2922
0319
9463
6230
0-
P-
-92
(C-3
6-15
) 20b
bc41
7079
127
3736
1998
5266
500
181
S11
013
393
(C-3
5-16
) 9cb
d41
8334
826
6374
2002
5155
300
80S
190
275
94(C
-35-
17) 1
7ddb
4181
993
2559
6219
9852
2048
018
0S
5576
95(C
-36-
15) 1
9abb
4171
141
2729
3320
0252
3361
018
9S
025
96(C
-36-
15) 1
9aca
-141
7068
427
3079
1993
5247
472
168
S10
916
897
(C-3
7-16
) 6cd
b41
6388
626
2404
1995
5296
280
160
S0
2598
(C-3
4-13
) 28d
dc41
8701
229
6393
1993
5283
650
175
S47
7299
(C-3
4-13
) 34c
cc41
8538
429
6907
1993
5328
800
125
S10
012
910
0(C
-37-
13) 6
aba
4165
831
2925
7720
0262
4570
019
0P
--
101
(C-3
7-16
) 4cb
a41
6425
126
5235
1995
5325
395
260
P-
-10
2(C
-35-
16) 2
9dda
4178
313
2659
2819
9551
7444
212
7S
050
Recharge and discharge areas for the principal basin-fill aquifer, Beryl-Enterprise area, Iron, Washington, and Beaver Counties, Utah 19
Site
#Lo
cal w
ell n
umbe
rN
orth
ing
East
ing
Year
dri
lled
Elev
atio
nTo
tal
dept
hW
ater
le
vel
Rech
arge
ty
pe
Top
confi
ning
la
yer
Bott
om
confi
ning
la
yer
103
(C-3
6-14
) 32b
cc41
6695
728
3495
1995
5810
394
23P
--
104
(C-3
6-13
) 32a
bc41
6722
329
4018
1996
6101
210
45P
--
105
(C-3
5-16
) 16b
cb41
8237
926
6212
1997
5158
204
76S
2047
106
(C-3
3-12
) 5cb
b42
0370
930
3867
1998
5236
140
78S
062
107
(C-3
7-16
) 18c
ca41
6059
926
1965
1999
5591
150
-P
--
108
(C-3
4-18
) 20d
ac41
9047
524
6695
1999
5357
350
240
P-
-10
9(C
-35-
16) 2
3cbd
4180
114
2696
7720
0051
6420
075
P-
-11
0(C
-37-
18) 1
2bda
4163
400
2509
2120
0155
3019
010
P-
-11
1(C
-37-
14) 8
bdc-
141
6365
228
3766
1999
5925
200
100
P-
-11
2(C
-37-
15) 3
4ddd
4156
374
2781
8719
9961
3220
250
P-
-11
3(C
-36-
16) 3
6cdd
4164
947
2707
5920
0058
4149
524
0P
--
114
(C-3
6-16
) 4ac
c41
7417
226
6279
2000
5194
210
140
S40
7311
5(C
-35-
17) 1
6aba
4183
072
2575
1120
0151
9819
811
8P
--
116
(C-3
7-16
) 4ca
c41
6404
726
5552
2001
5348
450
285
P-
-11
7(C
-34-
17) 3
3dcc
-241
8645
025
7355
2001
5196
500
138
S12
516
111
8(C
-35-
16) 2
1acd
4180
473
2671
6820
0251
6562
511
2S
8011
011
9(C
-37-
17) 1
4acb
4161
498
2593
5520
0053
3235
039
P-
-12
0(C
-37-
14) 2
1acd
4160
472
2860
6319
9961
5930
540
P-
-12
1(C
-35-
15) 2
1aaa
4180
968
2773
5320
0251
5950
072
D13
916
012
2(C
-35-
16) 1
4acc
4182
046
2701
0720
0251
5654
080
D18
021
012
3(C
-36-
16) 1
2bdd
4172
321
2709
4720
0052
0140
511
5S
9013
012
4(C
-35-
17) 8
cbb
4183
940
2548
4119
8752
2920
480
P-
-12
5(C
-36-
16) 2
0abb
4169
954
2644
8820
0052
2469
716
0S
020
126
(C-3
5-17
) 36a
cc41
7744
126
2069
2003
5190
404
142
P-
-12
7(C
-36-
16) 9
adc
4172
367
2666
7620
0152
0060
515
7S
7813
012
8(C
-36-
16) 3
ddc
4173
163
2683
7019
9351
9430
514
3P
--
129
(C-3
6-15
) 20b
bb41
7100
427
3764
1998
5266
513
183
S11
013
513
0(C
-36-
16) 2
6cbb
4167
426
2685
3019
9352
5935
227
0P
--
131
(C-3
5-17
) 24d
dd41
7990
026
2692
1994
5174
240
110
P-
-13
2(C
-34-
16) 2
3cba
4190
001
2698
4619
8451
3319
628
D11
013
013
3(C
-36-
16) 4
cdc-
241
7502
826
6008
2002
5193
282
175
P-
-13
4(C
-34-
15) 2
3cbd
4189
460
2794
5619
9651
2440
068
D90
340
135
(C-3
6-16
) 11c
cb41
7188
026
8571
1986
5198
496
95S
6613
013
6(C
-35-
16) 4
dcc
4184
552
2670
2819
9351
5325
085
S40
60
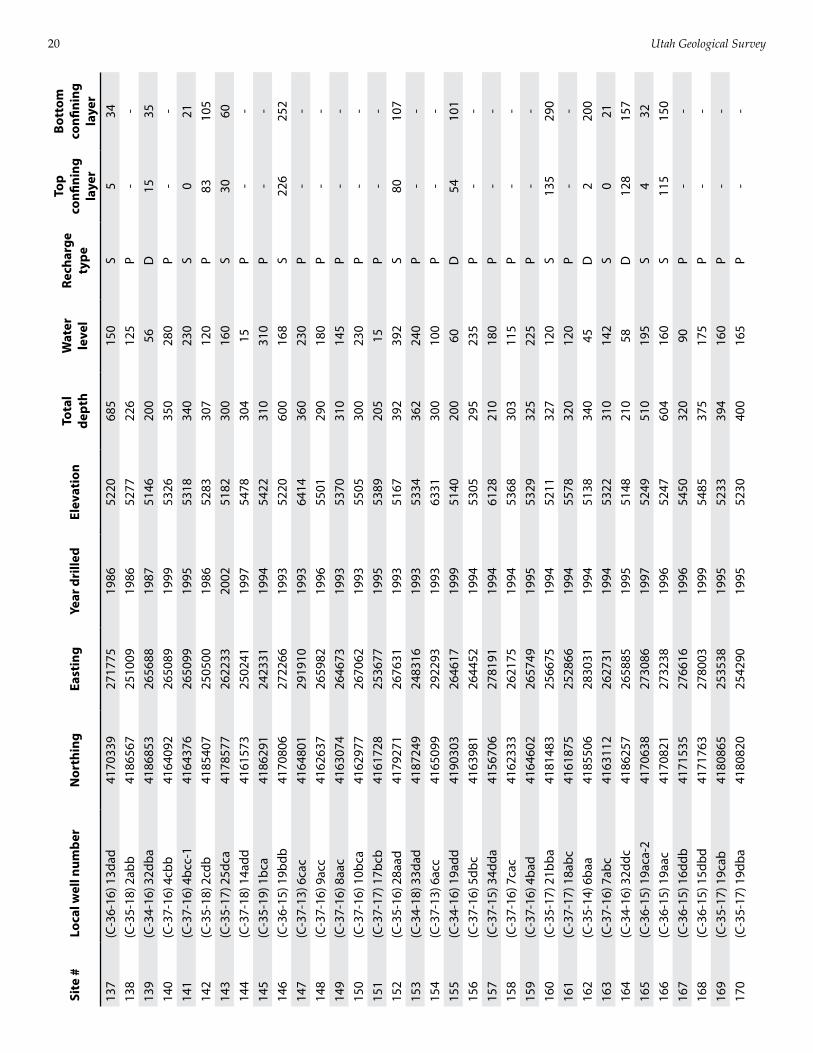
Utah Geological Survey20
Site
#Lo
cal w
ell n
umbe
rN
orth
ing
East
ing
Year
dri
lled
Elev
atio
nTo
tal
dept
hW
ater
le
vel
Rech
arge
ty
pe
Top
confi
ning
la
yer
Bott
om
confi
ning
la
yer
137
(C-3
6-16
) 13d
ad41
7033
927
1775
1986
5220
685
150
S5
3413
8(C
-35-
18) 2
abb
4186
567
2510
0919
8652
7722
612
5P
--
139
(C-3
4-16
) 32d
ba41
8685
326
5688
1987
5146
200
56D
1535
140
(C-3
7-16
) 4cb
b41
6409
226
5089
1999
5326
350
280
P-
-14
1(C
-37-
16) 4
bcc-
141
6437
626
5099
1995
5318
340
230
S0
2114
2(C
-35-
18) 2
cdb
4185
407
2505
0019
8652
8330
712
0P
8310
514
3(C
-35-
17) 2
5dca
4178
577
2622
3320
0251
8230
016
0S
3060
144
(C-3
7-18
) 14a
dd41
6157
325
0241
1997
5478
304
15P
--
145
(C-3
5-19
) 1bc
a41
8629
124
2331
1994
5422
310
310
P-
-14
6(C
-36-
15) 1
9bdb
4170
806
2722
6619
9352
2060
016
8S
226
252
147
(C-3
7-13
) 6ca
c41
6480
129
1910
1993
6414
360
230
P-
-14
8(C
-37-
16) 9
acc
4162
637
2659
8219
9655
0129
018
0P
--
149
(C-3
7-16
) 8aa
c41
6307
426
4673
1993
5370
310
145
P-
-15
0(C
-37-
16) 1
0bca
4162
977
2670
6219
9355
0530
023
0P
--
151
(C-3
7-17
) 17b
cb41
6172
825
3677
1995
5389
205
15P
--
152
(C-3
5-16
) 28a
ad41
7927
126
7631
1993
5167
392
392
S80
107
153
(C-3
4-18
) 33d
ad41
8724
924
8316
1993
5334
362
240
P-
-15
4(C
-37-
13) 6
acc
4165
099
2922
9319
9363
3130
010
0P
--
155
(C-3
4-16
) 19a
dd41
9030
326
4617
1999
5140
200
60D
5410
115
6(C
-37-
16) 5
dbc
4163
981
2644
5219
9453
0529
523
5P
--
157
(C-3
7-15
) 34d
da41
5670
627
8191
1994
6128
210
180
P-
-15
8(C
-37-
16) 7
cac
4162
333
2621
7519
9453
6830
311
5P
--
159
(C-3
7-16
) 4ba
d41
6460
226
5749
1995
5329
325
225
P-
-16
0(C
-35-
17) 2
1bba
4181
483
2566
7519
9452
1132
712
0S
135
290
161
(C-3
7-17
) 18a
bc41
6187
525
2866
1994
5578
320
120
P-
-16
2(C
-35-
14) 6
baa
4185
506
2830
3119
9451
3834
045
D2
200
163
(C-3
7-16
) 7ab
c41
6311
226
2731
1994
5322
310
142
S0
2116
4(C
-34-
16) 3
2ddc
4186
257
2658
8519
9551
4821
058
D12
815
716
5(C
-36-
15) 1
9aca
-241
7063
827
3086
1997
5249
510
195
S4
3216
6(C
-36-
15) 1
9aac
4170
821
2732
3819
9652
4760
416
0S
115
150
167
(C-3
6-15
) 16d
db41
7153
527
6616
1996
5450
320
90P
--
168
(C-3
6-15
) 15d
bd41
7176
327
8003
1999
5485
375
175
P-
-16
9(C
-35-
17) 1
9cab
4180
865
2535
3819
9552
3339
416
0P
--
170
(C-3
5-17
) 19d
ba41
8082
025
4290
1995
5230
400
165
P-
-
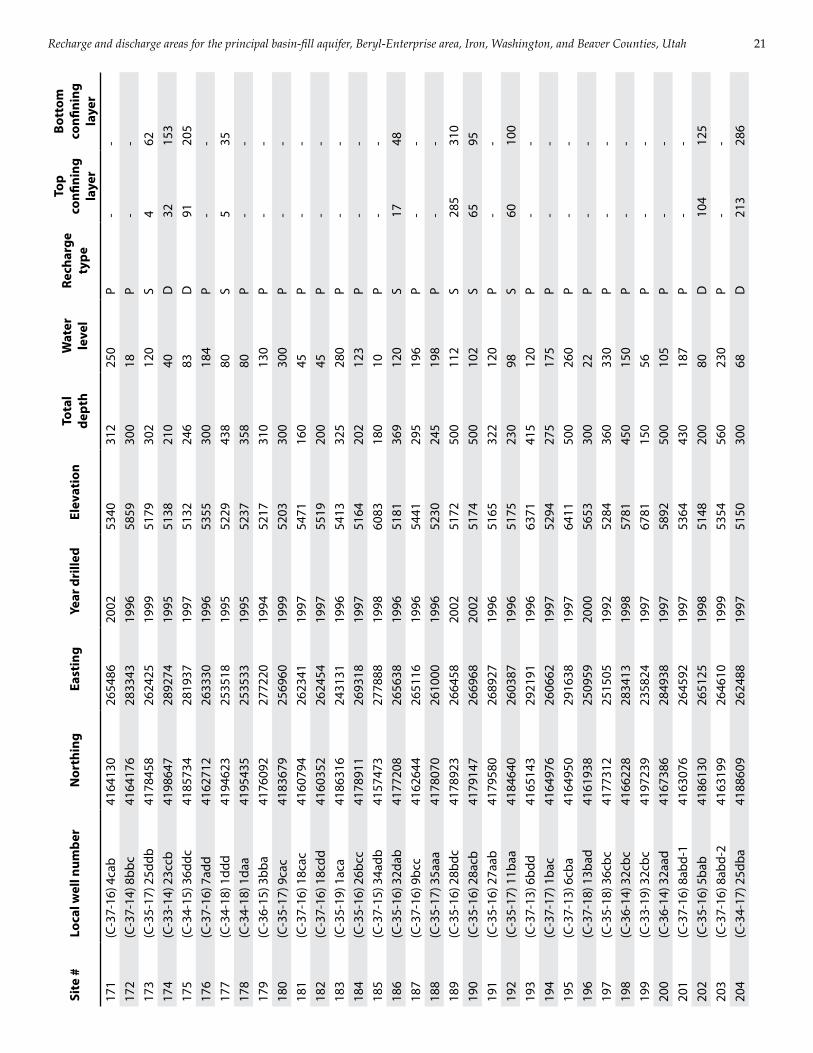
Recharge and discharge areas for the principal basin-fill aquifer, Beryl-Enterprise area, Iron, Washington, and Beaver Counties, Utah 21
Site
#Lo
cal w
ell n
umbe
rN
orth
ing
East
ing
Year
dri
lled
Elev
atio
nTo
tal
dept
hW
ater
le
vel
Rech
arge
ty
pe
Top
confi
ning
la
yer
Bott
om
confi
ning
la
yer
171
(C-3
7-16
) 4ca
b41
6413
026
5486
2002
5340
312
250
P-
-17
2(C
-37-
14) 8
bbc
4164
176
2833
4319
9658
5930
018
P-
-17
3(C
-35-
17) 2
5ddb
4178
458
2624
2519
9951
7930
212
0S
462
174
(C-3
3-14
) 23c
cb41
9864
728
9274
1995
5138
210
40D
3215
317
5(C
-34-
15) 3
6ddc
4185
734
2819
3719
9751
3224
683
D91
205
176
(C-3
7-16
) 7ad
d41
6271
226
3330
1996
5355
300
184
P-
-17
7(C
-34-
18) 1
ddd
4194
623
2535
1819
9552
2943
880
S5
3517
8(C
-34-
18) 1
daa
4195
435
2535
3319
9552
3735
880
P-
-17
9(C
-36-
15) 3
bba
4176
092
2772
2019
9452
1731
013
0P
--
180
(C-3
5-17
) 9ca
c41
8367
925
6960
1999
5203
300
300
P-
-18
1(C
-37-
16) 1
8cac
4160
794
2623
4119
9754
7116
045
P-
-18
2(C
-37-
16) 1
8cdd
4160
352
2624
5419
9755
1920
045
P-
-18
3(C
-35-
19) 1
aca
4186
316
2431
3119
9654
1332
528
0P
--
184
(C-3
5-16
) 26b
cc41
7891
126
9318
1997
5164
202
123
P-
-18
5(C
-37-
15) 3
4adb
4157
473
2778
8819
9860
8318
010
P-
-18
6(C
-35-
16) 3
2dab
4177
208
2656
3819
9651
8136
912
0S
1748
187
(C-3
7-16
) 9bc
c41
6264
426
5116
1996
5441
295
196
P-
-18
8(C
-35-
17) 3
5aaa
4178
070
2610
0019
9652
3024
519
8P
--
189
(C-3
5-16
) 28b
dc41
7892
326
6458
2002
5172
500
112
S28
531
019
0(C
-35-
16) 2
8acb
4179
147
2669
6820
0251
7450
010
2S
6595
191
(C-3
5-16
) 27a
ab41
7958
026
8927
1996
5165
322
120
P-
-19
2(C
-35-
17) 1
1baa
4184
640
2603
8719
9651
7523
098
S60
100
193
(C-3
7-13
) 6bd
d41
6514
329
2191
1996
6371
415
120
P-
-19
4(C
-37-
17) 1
bac
4164
976
2606
6219
9752
9427
517
5P
--
195
(C-3
7-13
) 6cb
a41
6495
029
1638
1997
6411
500
260
P-
-19
6(C
-37-
18) 1
3bad
4161
938
2509
5920
0056
5330
022
P-
-19
7(C
-35-
18) 3
6cbc
4177
312
2515
0519
9252
8436
033
0P
--
198
(C-3
6-14
) 32c
bc41
6622
828
3413
1998
5781
450
150
P-
-19
9(C
-33-
19) 3
2cbc
4197
239
2358
2419
9767
8115
056
P-
-20
0(C
-36-
14) 3
2aad
4167
386
2849
3819
9758
9250
010
5P
--
201
(C-3
7-16
) 8ab
d-1
4163
076
2645
9219
9753
6443
018
7P
--
202
(C-3
5-16
) 5ba
b41
8613
026
5125
1998
5148
200
80D
104
125
203
(C-3
7-16
) 8ab
d-2
4163
199
2646
1019
9953
5456
023
0P
--
204
(C-3
4-17
) 25d
ba41
8860
926
2488
1997
5150
300
68D
213
286
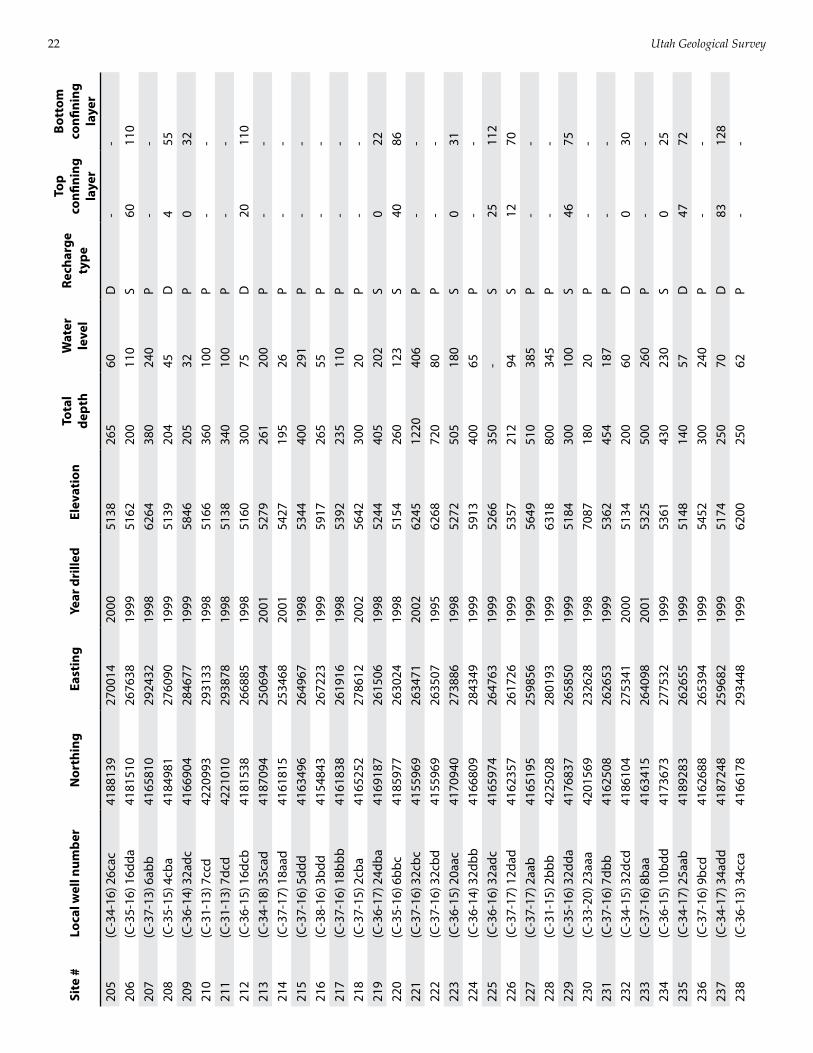
Utah Geological Survey22
Site
#Lo
cal w
ell n
umbe
rN
orth
ing
East
ing
Year
dri
lled
Elev
atio
nTo
tal
dept
hW
ater
le
vel
Rech
arge
ty
pe
Top
confi
ning
la
yer
Bott
om
confi
ning
la
yer
205
(C-3
4-16
) 26c
ac41
8813
927
0014
2000
5138
265
60D
--
206
(C-3
5-16
) 16d
da41
8151
026
7638
1999
5162
200
110
S60
110
207
(C-3
7-13
) 6ab
b41
6581
029
2432
1998
6264
380
240
P-
-20
8(C
-35-
15) 4
cba
4184
981
2760
9019
9951
3920
445
D4
5520
9(C
-36-
14) 3
2adc
4166
904
2846
7719
9958
4620
532
P0
3221
0(C
-31-
13) 7
ccd
4220
993
2931
3319
9851
6636
010
0P
--
211
(C-3
1-13
) 7dc
d42
2101
029
3878
1998
5138
340
100
P-
-21
2(C
-36-
15) 1
6dcb
4181
538
2668
8519
9851
6030
075
D20
110
213
(C-3
4-18
) 35c
ad41
8709
425
0694
2001
5279
261
200
P-
-21
4(C
-37-
17) 1
8aad
4161
815
2534
6820
0154
2719
526
P-
-21
5(C
-37-
16) 5
ddd
4163
496
2649
6719
9853
4440
029
1P
--
216
(C-3
8-16
) 3bd
d41
5484
326
7223
1999
5917
265
55P
--
217
(C-3
7-16
) 18b
bb41
6183
826
1916
1998
5392
235
110
P-
-21
8(C
-37-
15) 2
cba
4165
252
2786
1220
0256
4230
020
P-
-21
9(C
-36-
17) 2
4dba
4169
187
2615
0619
9852
4440
520
2S
022
220
(C-3
5-16
) 6bb
c41
8597
726
3024
1998
5154
260
123
S40
8622
1(C
-37-
16) 3
2cbc
4155
969
2634
7120
0262
4512
2040
6P
--
222
(C-3
7-16
) 32c
bd41
5596
926
3507
1995
6268
720
80P
--
223
(C-3
6-15
) 20a
ac41
7094
027
3886
1998
5272
505
180
S0
3122
4(C
-36-
14) 3
2dbb
4166
809
2843
4919
9959
1340
065
P-
-22
5(C
-36-
16) 3
2adc
4165
974
2647
6319
9952
6635
0-
S25
112
226
(C-3
7-17
) 12d
ad41
6235
726
1726
1999
5357
212
94S
1270
227
(C-3
7-17
) 2aa
b41
6519
525
9856
1999
5649
510
385
P-
-22
8(C
-31-
15) 2
bbb
4225
028
2801
9319
9963
1880
034
5P
--
229
(C-3
5-16
) 32d
da41
7683
726
5850
1999
5184
300
100
S46
7523
0(C
-33-
20) 2
3aaa
4201
569
2326
2819
9870
8718
020
P-
-23
1(C
-37-
16) 7
dbb
4162
508
2626
5319
9953
6245
418
7P
--
232
(C-3
4-15
) 32d
cd41
8610
427
5341
2000
5134
200
60D
030
233
(C-3
7-16
) 8ba
a41
6341
526
4098
2001
5325
500
260
P-
-23
4(C
-36-
15) 1
0bdd
4173
673
2775
3219
9953
6143
023
0S
025
235
(C-3
4-17
) 25a
ab41
8928
326
2655
1999
5148
140
57D
4772
236
(C-3
7-16
) 9bc
d41
6268
826
5394
1999
5452
300
240
P-
-23
7(C
-34-
17) 3
4add
4187
248
2596
8219
9951
7425
070
D83
128
238
(C-3
6-13
) 34c
ca41
6617
829
3448
1999
6200
250
62P
--
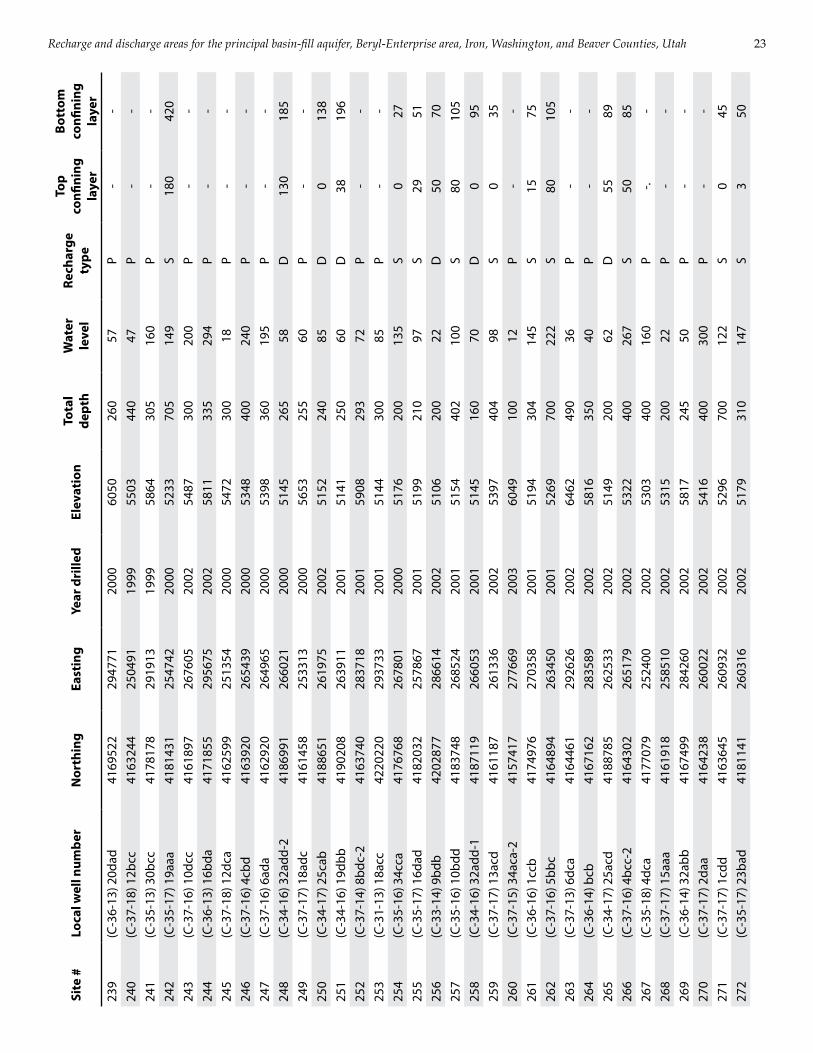
Recharge and discharge areas for the principal basin-fill aquifer, Beryl-Enterprise area, Iron, Washington, and Beaver Counties, Utah 23
Site
#Lo
cal w
ell n
umbe
rN
orth
ing
East
ing
Year
dri
lled
Elev
atio
nTo
tal
dept
hW
ater
le
vel
Rech
arge
ty
pe
Top
confi
ning
la
yer
Bott
om
confi
ning
la
yer
239
(C-3
6-13
) 20d
ad41
6952
229
4771
2000
6050
260
57P
--
240
(C-3
7-18
) 12b
cc41
6324
425
0491
1999
5503
440
47P
--
241
(C-3
5-13
) 30b
cc41
7817
829
1913
1999
5864
305
160
P-
-24
2(C
-35-
17) 1
9aaa
4181
431
2547
4220
0052
3370
514
9S
180
420
243
(C-3
7-16
) 10d
cc41
6189
726
7605
2002
5487
300
200
P-
-24
4(C
-36-
13) 1
6bda
4171
855
2956
7520
0258
1133
529
4P
--
245
(C-3
7-18
) 12d
ca41
6259
925
1354
2000
5472
300
18P
--
246
(C-3
7-16
) 4cb
d41
6392
026
5439
2000
5348
400
240
P-
-24
7(C
-37-
16) 6
ada
4162
920
2649
6520
0053
9836
019
5P
--
248
(C-3
4-16
) 32a
dd-2
4186
991
2660
2120
0051
4526
558
D13
018
524
9(C
-37-
17) 1
8adc
4161
458
2533
1320
0056
5325
560
P-
-25
0(C
-34-
17) 2
5cab
4188
651
2619
7520
0251
5224
085
D0
138
251
(C-3
4-16
) 19d
bb41
9020
826
3911
2001
5141
250
60D
3819
625
2(C
-37-
14) 8
bdc-
241
6374
028
3718
2001
5908
293
72P
--
253
(C-3
1-13
) 18a
cc42
2022
029
3733
2001
5144
300
85P
--
254
(C-3
5-16
) 34c
ca41
7676
826
7801
2000
5176
200
135
S0
2725
5(C
-35-
17) 1
6dad
4182
032
2578
6720
0151
9921
097
S29
5125
6(C
-33-
14) 9
bdb
4202
877
2866
1420
0251
0620
022
D50
7025
7(C
-35-
16) 1
0bdd
4183
748
2685
2420
0151
5440
210
0S
8010
525
8(C
-34-
16) 3
2add
-141
8711
926
6053
2001
5145
160
70D
095
259
(C-3
7-17
) 13a
cd41
6118
726
1336
2002
5397
404
98S
035
260
(C-3
7-15
) 34a
ca-2
4157
417
2776
6920
0360
4910
012
P-
-26
1(C
-36-
16) 1
ccb
4174
976
2703
5820
0151
9430
414
5S
1575
262
(C-3
7-16
) 5bb
c41
6489
426
3450
2001
5269
700
222
S80
105
263
(C-3
7-13
) 6dc
a41
6446
129
2626
2002
6462
490
36P
--
264
(C-3
6-14
) bcb
4167
162
2835
8920
0258
1635
040
P-
-26
5(C
-34-
17) 2
5acd
4188
785
2625
3320
0251
4920
062
D55
8926
6(C
-37-
16) 4
bcc-
241
6430
226
5179
2002
5322
400
267
S50
8526
7(C
-35-
18) 4
dca
4177
079
2524
0020
0253
0340
016
0P
-.-
268
(C-3
7-17
) 15a
aa41
6191
825
8510
2002
5315
200
22P
--
269
(C-3
6-14
) 32a
bb41
6749
928
4260
2002
5817
245
50P
--
270
(C-3
7-17
) 2da
a41
6423
826
0022
2002
5416
400
300
P-
-27
1(C
-37-
17) 1
cdd
4163
645
2609
3220
0252
9670
012
2S
045
272
(C-3
5-17
) 23b
ad41
8114
126
0316
2002
5179
310
147
S3
50
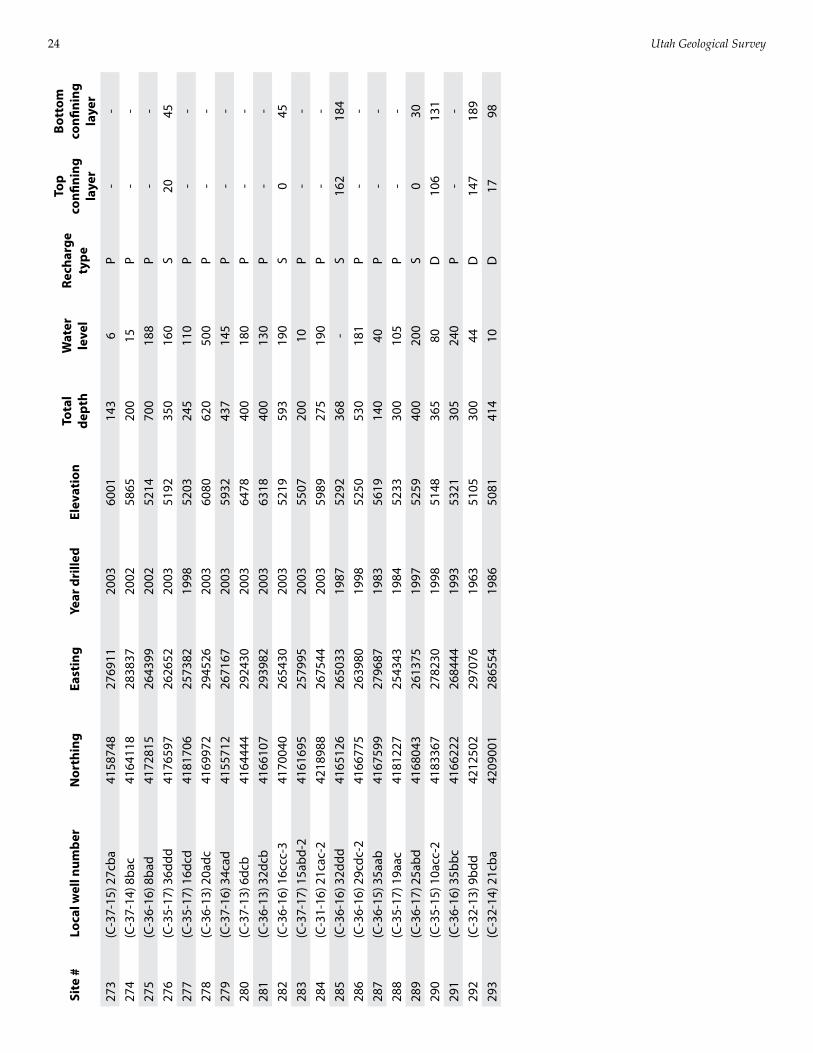
Utah Geological Survey24
Site
#Lo
cal w
ell n
umbe
rN
orth
ing
East
ing
Year
dri
lled
Elev
atio
nTo
tal
dept
hW
ater
le
vel
Rech
arge
ty
pe
Top
confi
ning
la
yer
Bott
om
confi
ning
la
yer
273
(C-3
7-15
) 27c
ba41
5874
827
6911
2003
6001
143
6P
--
274
(C-3
7-14
) 8ba
c41
6411
828
3837
2002
5865
200
15P
--
275
(C-3
6-16
) 8ba
d41
7281
526
4399
2002
5214
700
188
P-
-27
6(C
-35-
17) 3
6ddd
4176
597
2626
5220
0351
9235
016
0S
2045
277
(C-3
5-17
) 16d
cd41
8170
625
7382
1998
5203
245
110
P-
-27
8(C
-36-
13) 2
0adc
4169
972
2945
2620
0360
8062
050
0P
--
279
(C-3
7-16
) 34c
ad41
5571
226
7167
2003
5932
437
145
P-
-28
0(C
-37-
13) 6
dcb
4164
444
2924
3020
0364
7840
018
0P
--
281
(C-3
6-13
) 32d
cb41
6610
729
3982
2003
6318
400
130
P-
-28
2(C
-36-
16) 1
6ccc
-341
7004
026
5430
2003
5219
593
190
S0
4528
3(C
-37-
17) 1
5abd
-241
6169
525
7995
2003
5507
200
10P
--
284
(C-3
1-16
) 21c
ac-2
4218
988
2675
4420
0359
8927
519
0P
--
285
(C-3
6-16
) 32d
dd41
6512
626
5033
1987
5292
368
-S
162
184
286
(C-3
6-16
) 29c
dc-2
4166
775
2639
8019
9852
5053
018
1P
--
287
(C-3
6-15
) 35a
ab41
6759
927
9687
1983
5619
140
40P
--
288
(C-3
5-17
) 19a
ac41
8122
725
4343
1984
5233
300
105
P-
-28
9(C
-36-
17) 2
5abd
4168
043
2613
7519
9752
5940
020
0S
030
290
(C-3
5-15
) 10a
cc-2
4183
367
2782
3019
9851
4836
580
D10
613
129
1(C
-36-
16) 3
5bbc
4166
222
2684
4419
9353
2130
524
0P
--
292
(C-3
2-13
) 9bd
d42
1250
229
7076
1963
5105
300
44D
147
189
293
(C-3
2-14
) 21c
ba42
0900
128
6554
1986
5081
414
10D
1798