Embed Size (px)
Citation preview
Lyle ChinkinSonoma Technology, Inc.
Petaluma, CA
Presented at the Sierra Ozone Summit
Grass Valley, CaliforniaJune 4, 2008
Air Quality Primer
STI-708024
Overview
• The history of smog• The major air pollutants, formation processes, and
emission sources (emphasis on ozone)• The role of weather (meteorology) in ozone transport• Previous transport studies and findings• Conclusions
2
History of Smog (1 of 4)
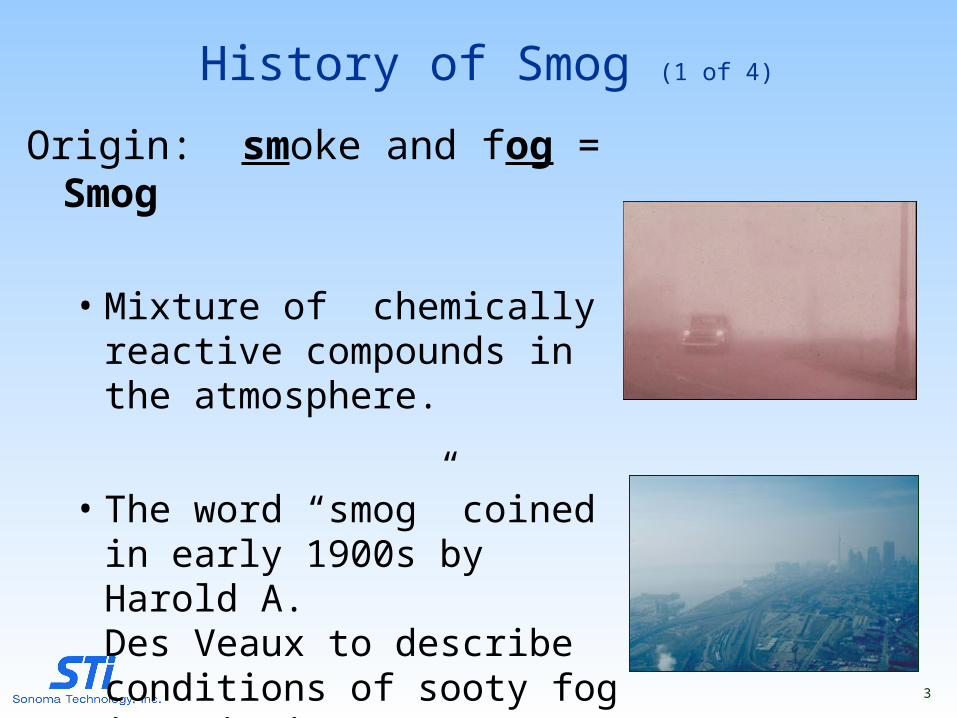
Origin: smoke and fog = Smog
• Mixture of chemically reactive compounds in the atmosphere.
• The word “smog” coined in early 1900s by Harold A. Des Veaux to describe conditions of sooty fog in Britain.
3
History of Smog (2 of 4)
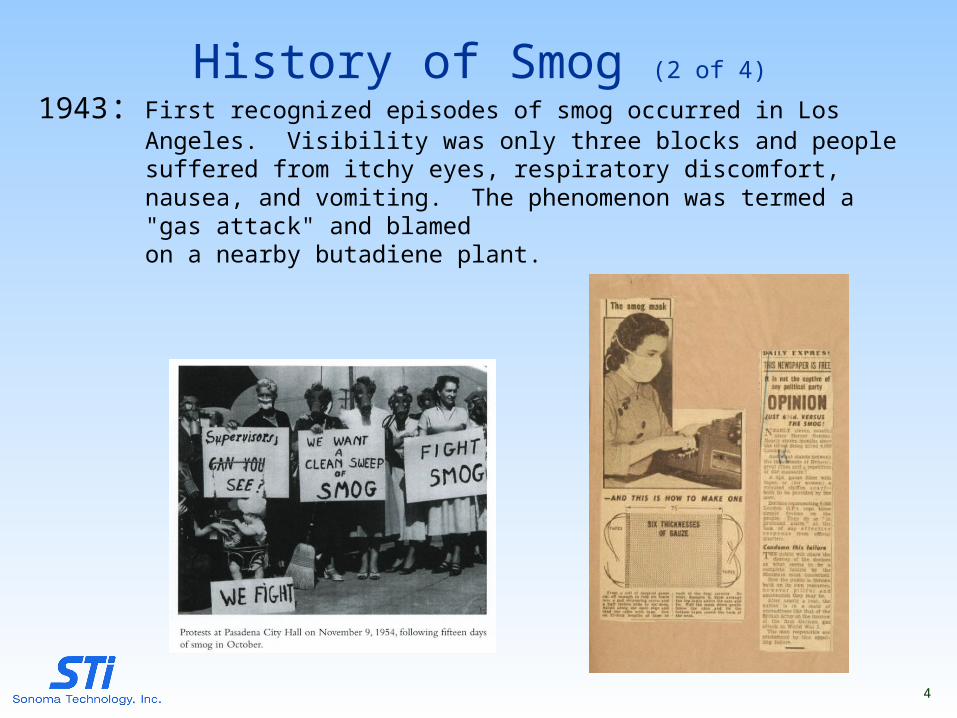
1943: First recognized episodes of smog occurred in Los Angeles. Visibility was only three blocks and people suffered from itchy eyes, respiratory discomfort, nausea, and vomiting. The phenomenon was termed a "gas attack" and blamed on a nearby butadiene plant.
4
History of Smog (3 of 4)
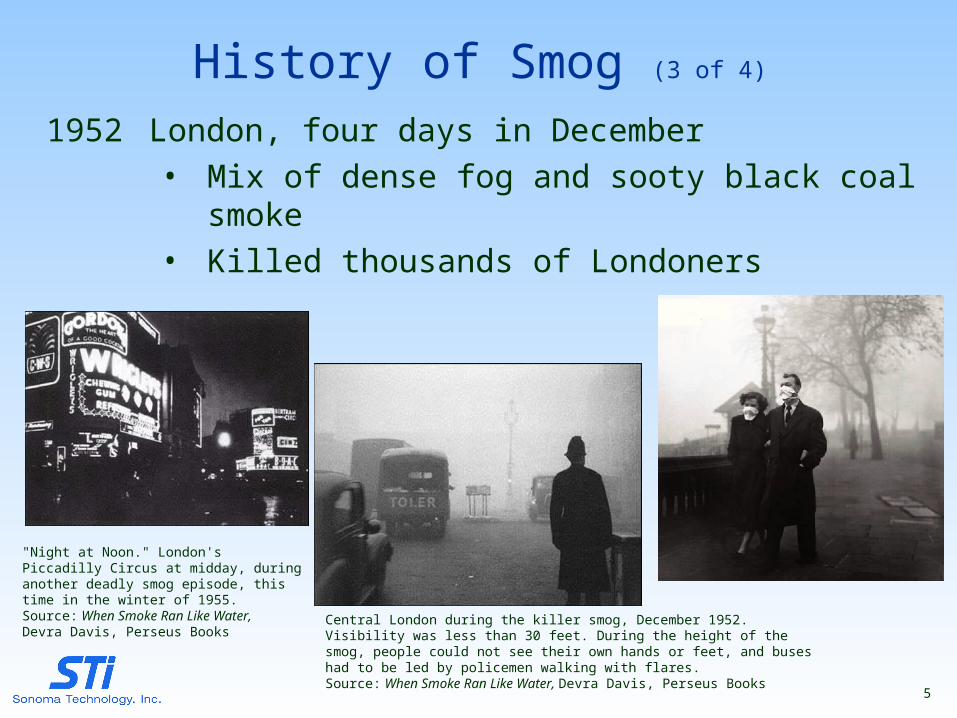
"Night at Noon." London's Piccadilly Circus at midday, during another deadly smog episode, this time in the winter of 1955.Source: When Smoke Ran Like Water, Devra Davis, Perseus Books Central London during the killer smog, December 1952. Visibility was less than 30
feet. During the height of the smog, people could not see their own hands or feet, and buses had to be led by policemen walking with flares.Source: When Smoke Ran Like Water, Devra Davis, Perseus Books
1952 London, four days in December• Mix of dense fog and sooty black coal smoke• Killed thousands of Londoners
5
History of Smog (4 of 4)
1960 Air Pollution Potential – forecasting began
1963 National Air Pollution Control Agency – started as a research body; not very effective
1967 The Air Quality Act of 1967• Designation of air quality regions• Regional approach to pollution control
1970 A turning point• Attitudinal change in U.S. society• National Environmental Policy Act (January 1) • Formation of Environmental Protection Agency (July 9) • Clean Air Act of 1970
– National Air Quality Standards
– Statutory deadlines for compliance
1990 Clean Air Act Amendments
6
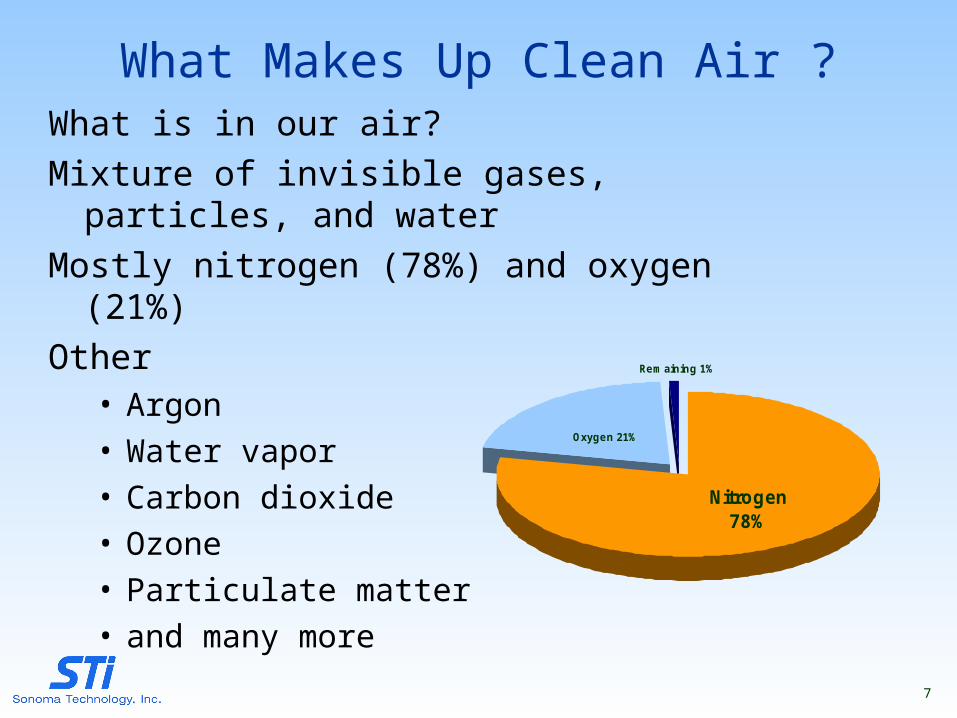
What Makes Up Clean Air ?What is in our air?
Mixture of invisible gases, particles, and water
Mostly nitrogen (78%) and oxygen (21%)
Other • Argon• Water vapor • Carbon dioxide• Ozone• Particulate matter• and many more
Rem aining 1%
Nitrogen 78%
Oxygen 21%
7
Major Types of Air PollutantsCategories of pollutants• PrimaryPrimary – emitted directly from source• SecondarySecondary – formed in atmosphere from reaction
of primary pollutants• PrecursorsPrecursors – primary pollutants (gases) that form
secondary pollutants
Pollutants originate from• CombustionCombustion - fossil fuels, organic matter• EvaporationEvaporation - petroleum products, solvents• Natural productionNatural production - smoke, dust, and emissions
from trees and plants8
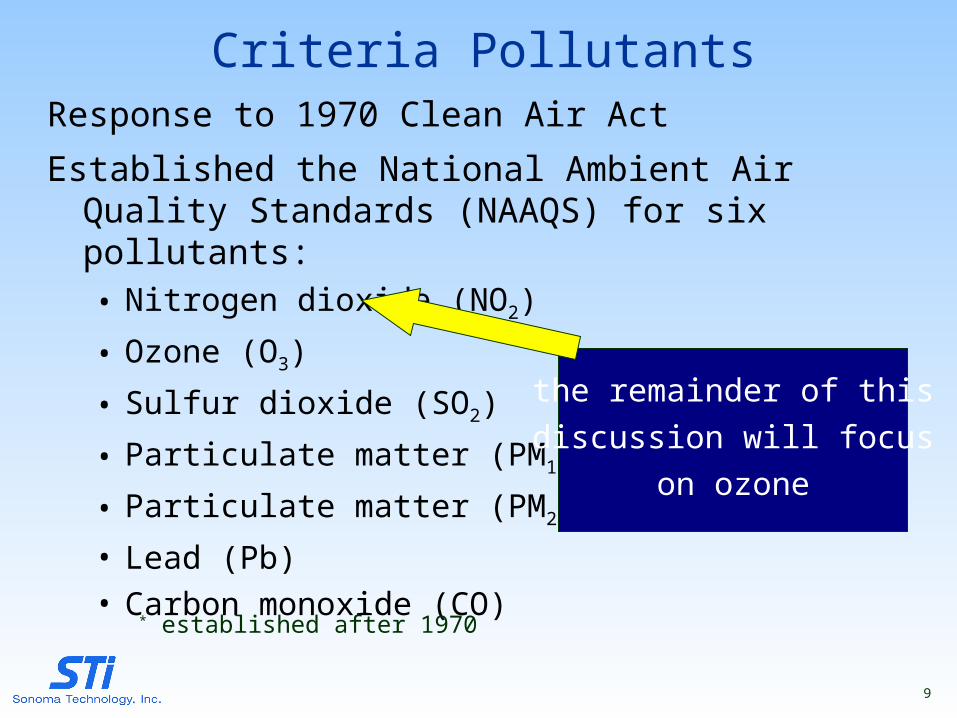
Criteria PollutantsResponse to 1970 Clean Air Act
Established the National Ambient Air Quality Standards (NAAQS) for six pollutants:• Nitrogen dioxide (NO2)
• Ozone (O3)
• Sulfur dioxide (SO2)
• Particulate matter (PM10)
• Particulate matter (PM2.5)*
• Lead (Pb)• Carbon monoxide (CO)
* established after 1970
the remainder of this
discussion will focus
on ozone
9
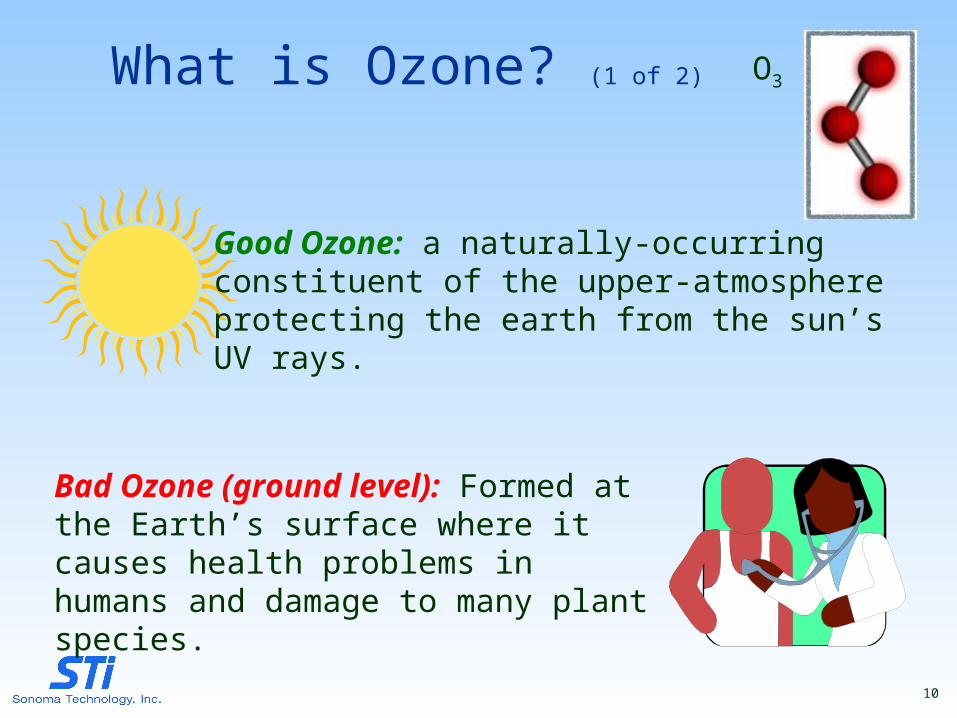
What is Ozone? (1 of 2)
Good Ozone: a naturally-occurringconstituent of the upper-atmosphereprotecting the earth from the sun’sUV rays.
Bad Ozone (ground level): Formed at the Earth’s surface where it causes health problems in humans and damage to many plant species.
O3
10
What is Ozone? (2 of 2)
A colorless gas composed of three oxygen atoms• Oxygen molecule (O2) – needed to breathe to sustain
life
• Ozone (O3) – extra oxygen atom makes ozone very reactive
A secondary pollutant that forms from precursor gases • NOx (nitrous oxides) – combustion product
• VOCs (volatile organic compounds) – evaporative and combustion products
11
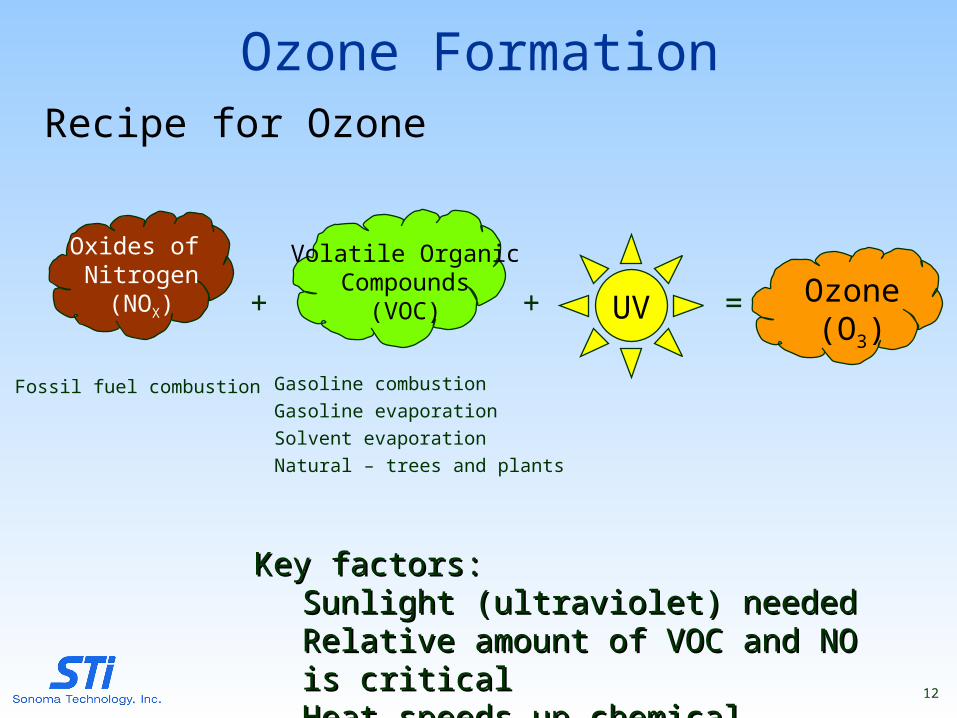
Ozone FormationRecipe for Ozone
Ozone(O3)
UV
Key factors:Key factors:Sunlight (ultraviolet) neededSunlight (ultraviolet) neededRelative amount of VOC and NO is criticalRelative amount of VOC and NO is criticalHeat speeds up chemical reactionsHeat speeds up chemical reactions
+ =+
Oxides of Nitrogen
(NOX)
Fossil fuel combustion
Volatile OrganicCompounds
(VOC)
Gasoline combustion
Gasoline evaporation
Solvent evaporation
Natural – trees and plants
12
Ozone CharacteristicsClean-air background levels are 35-40 ppb* (sometimes lower)
U.S. concentrations range from 0 to 250+ ppb*
Ozone health concerns• A severe irritant (reactive).• Inflames and irritates the respiratory tract, particularly during
physical activity. Breathing ozone can worsen asthma attacks.
• Symptoms include breathing difficulty, coughing, and throat irritation.
• Medical studies have shown that ozone damages lung tissue; complete recovery may take several days after exposure.
* One-hour averageOne-hour average13
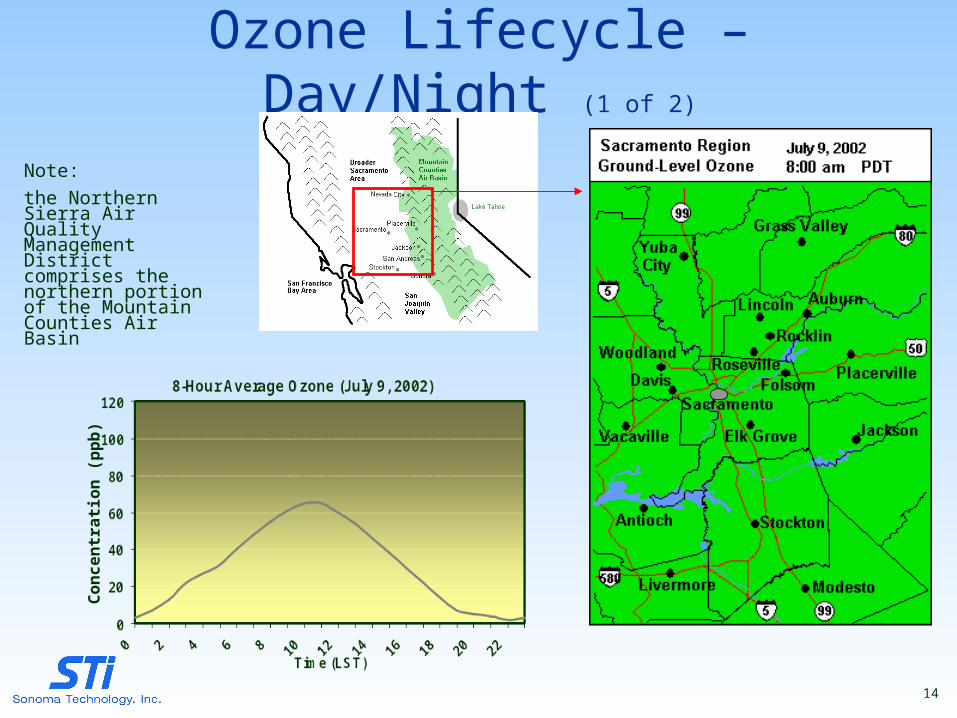
Ozone Lifecycle – Day/Night (1 of 2)C
on
ce
ntr
ati
on
(p
pb
)
Note:
the Northern Sierra Air Quality Management District comprises the northern portion of the Mountain Counties Air Basin
14
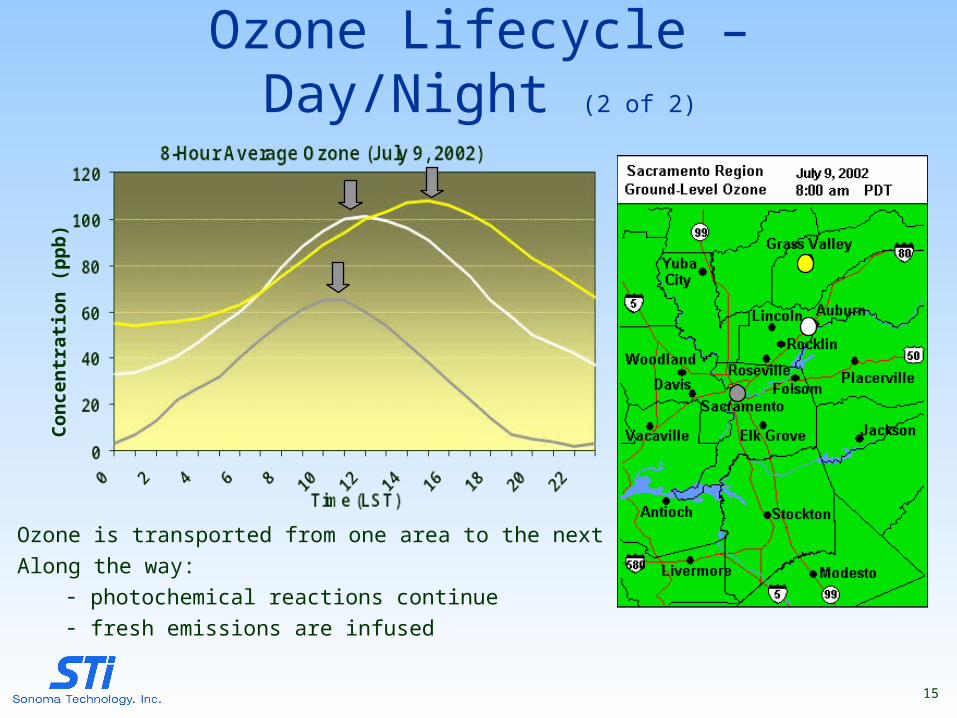
Ozone Lifecycle – Day/Night (2 of 2)C
on
cen
tra
tio
n (
pp
b)
Ozone is transported from one area to the next
Along the way:- photochemical reactions continue- fresh emissions are infused
15
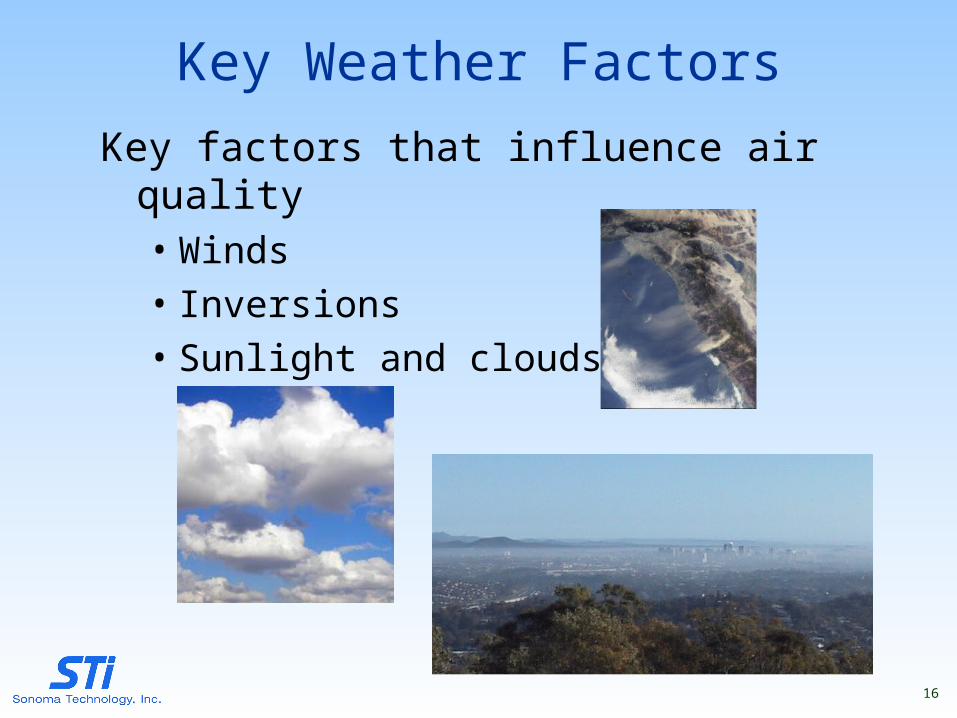
Key Weather Factors
Key factors that influence air quality• Winds• Inversions• Sunlight and clouds
16
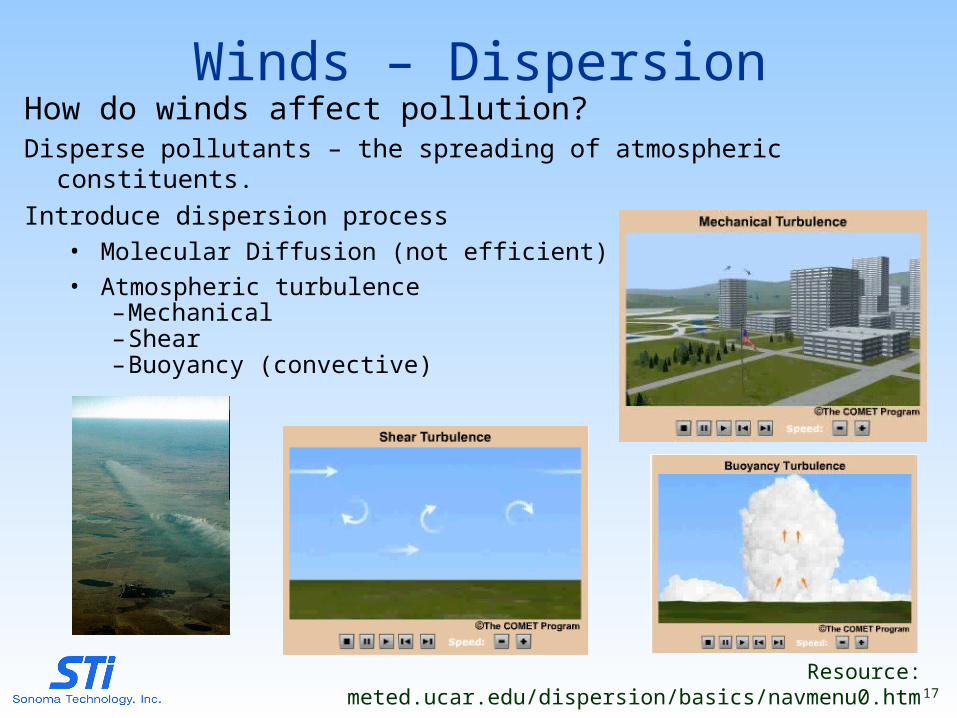
Winds – DispersionHow do winds affect pollution?Disperse pollutants – the spreading of atmospheric constituents.
Introduce dispersion process• Molecular Diffusion (not efficient)• Atmospheric turbulence
–Mechanical–Shear–Buoyancy (convective)
Resource: meted.ucar.edu/dispersion/basics/navmenu0.htm17
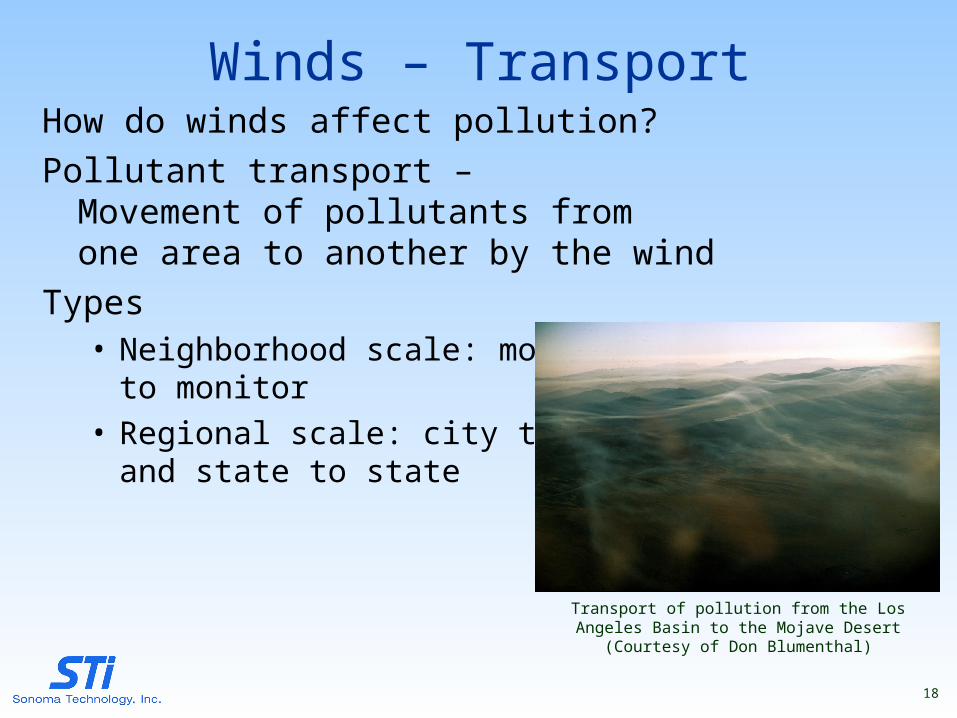
Winds – TransportHow do winds affect pollution?
Pollutant transport –Movement of pollutants from one area to another by the wind
Types• Neighborhood scale: monitor
to monitor• Regional scale: city to city
and state to state
Transport of pollution from the Los Angeles Basin to the Mojave Desert (Courtesy of Don Blumenthal)
18
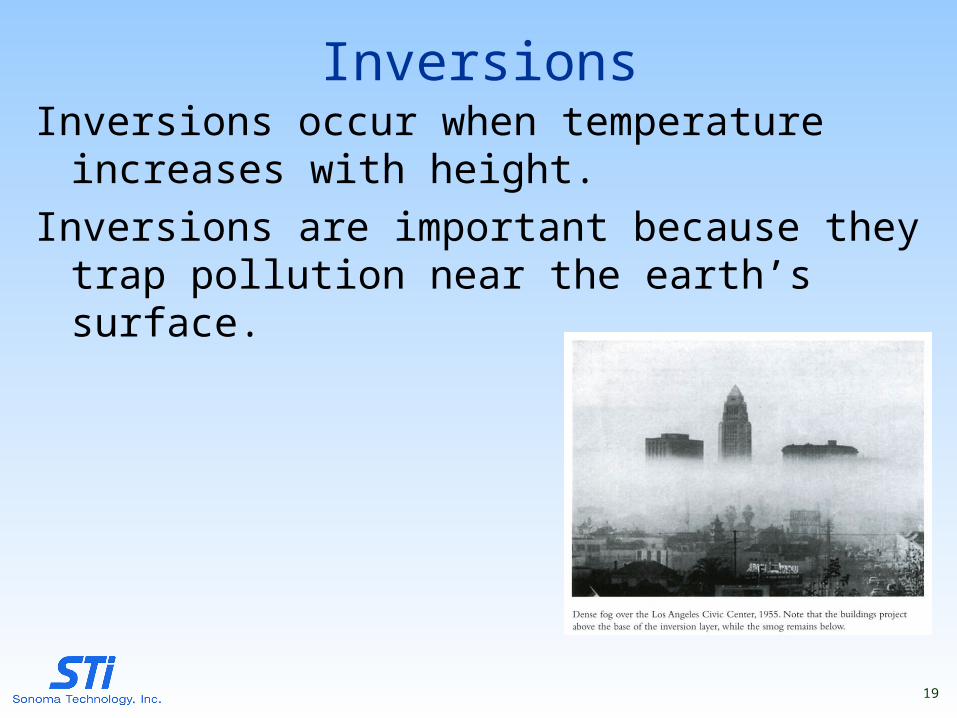
InversionsInversions occur when temperature increases with
height.
Inversions are important because they trap pollution near the earth’s surface.
19
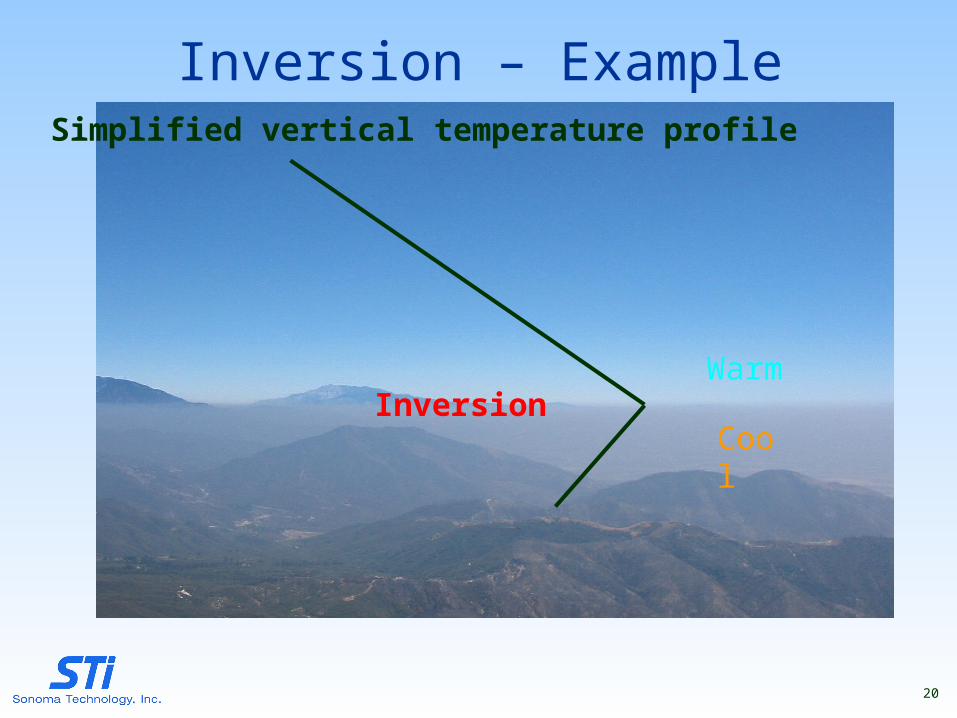
Inversion – Example
Warm
Cool
Simplified vertical temperature profile
Inversion
20
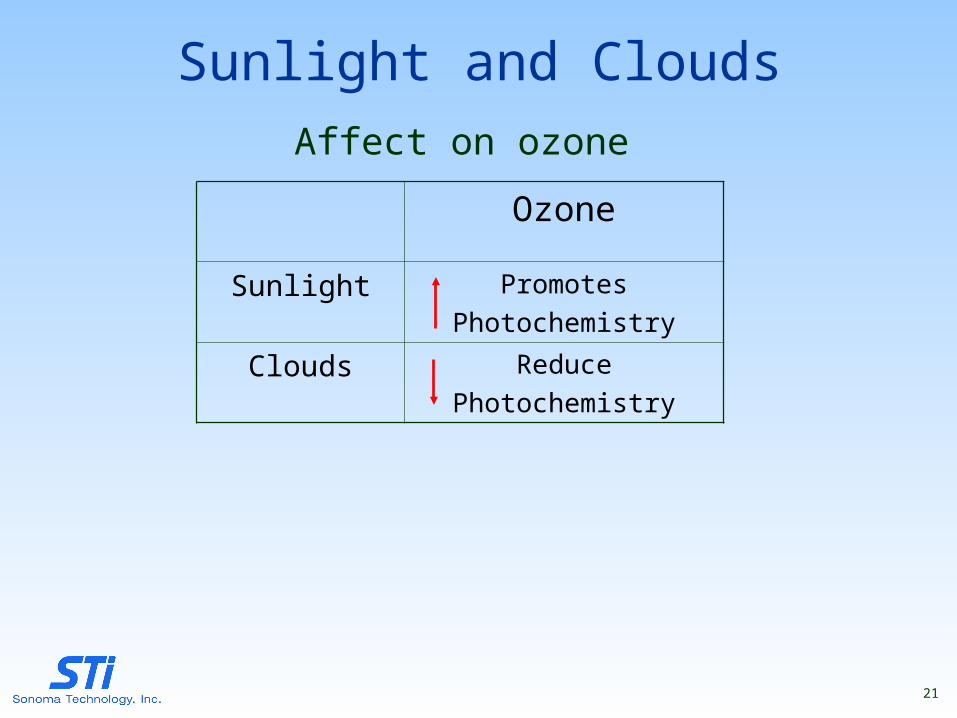
Sunlight and Clouds
Ozone
Sunlight Promotes
Photochemistry
Clouds Reduce
Photochemistry
Affect on ozone
21
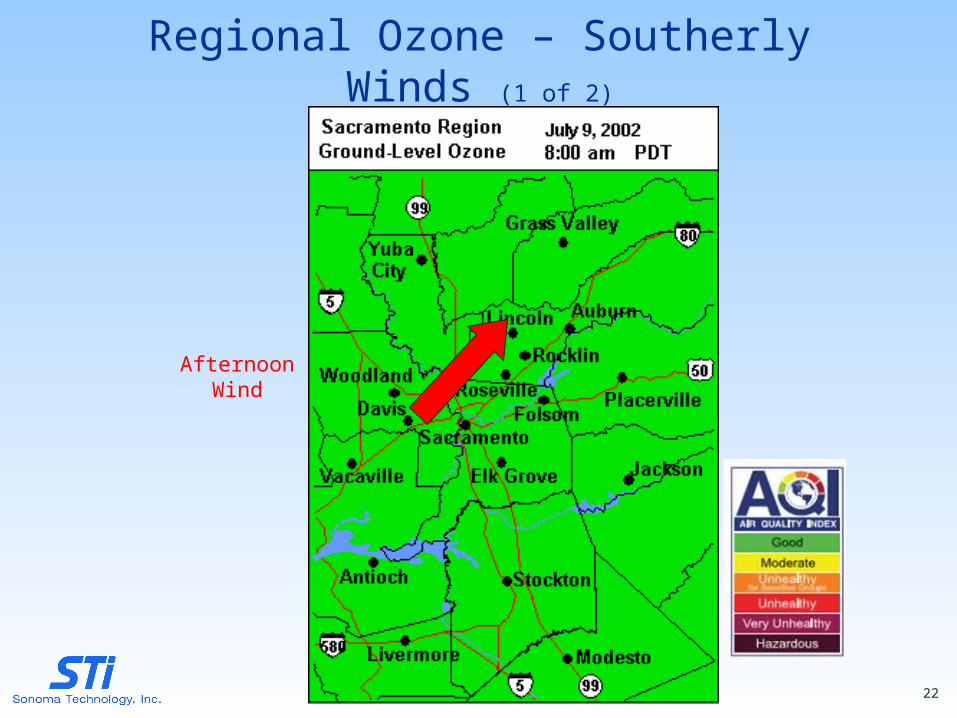
AfternoonWind
Regional Ozone – Southerly Winds (1 of 2)
22
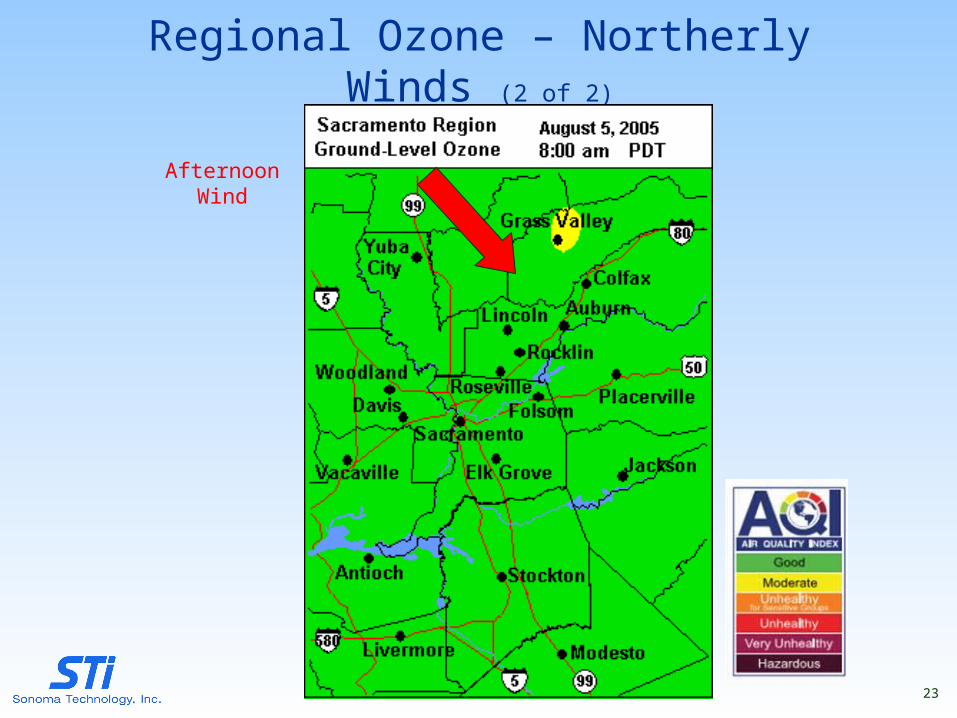
AfternoonWind
Regional Ozone – Northerly Winds (2 of 2)
23
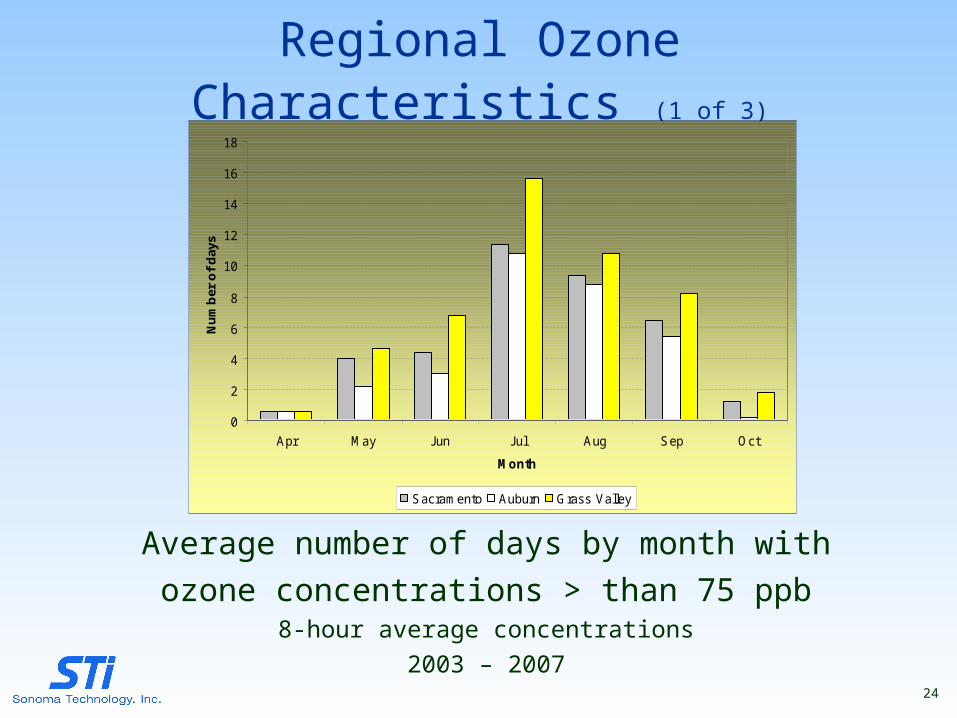
Regional Ozone Characteristics (1 of 3)
Average number of days by month with
ozone concentrations > than 75 ppb8-hour average concentrations
2003 – 2007
0
2
4
6
8
10
12
14
16
18
Apr May Jun Jul Aug Sep Oct
Month
Nu
mb
er o
f d
ays
Sacramento Auburn Grass Valley
24
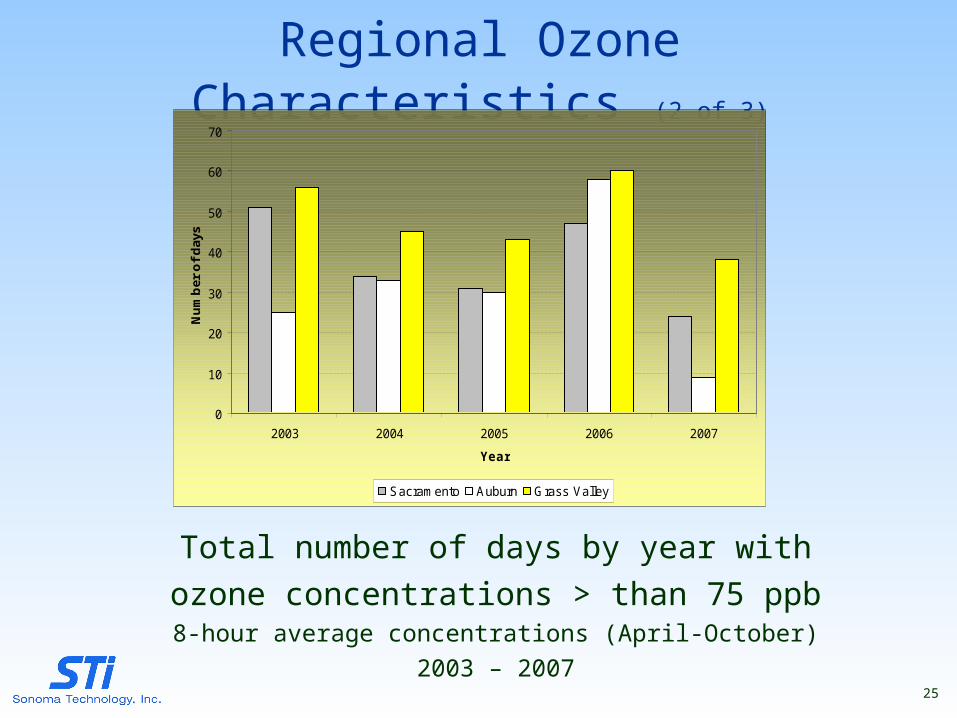
Regional Ozone Characteristics (2 of 3)
Total number of days by year with
ozone concentrations > than 75 ppb8-hour average concentrations (April-October)
2003 – 200725
0
10
20
30
40
50
60
70
2003 2004 2005 2006 2007
Year
Nu
mb
er o
f d
ays
Sacramento Auburn Grass Valley
0
20
40
60
80
100
120
140
Jan-
00
Apr
-00
Jul-0
0
Oct
-00
Jan-
01
Apr
-01
Jul-0
1
Oct
-01
Jan-
02
Apr
-02
Jul-0
2
Oct
-02
Jan-
03
Apr
-03
Jul-0
3
Oct
-03
Jan-
04
Apr
-04
Jul-0
4
Oct
-04
Jan-
05
Apr
-05
Jul-0
5
Oct
-05
Jan-
06
Apr
-06
Jul-0
6
Oct
-06
Sacramento Auburn Grass Valley
Ma
xim
um
Co
nce
ntr
atio
n (
pp
b)
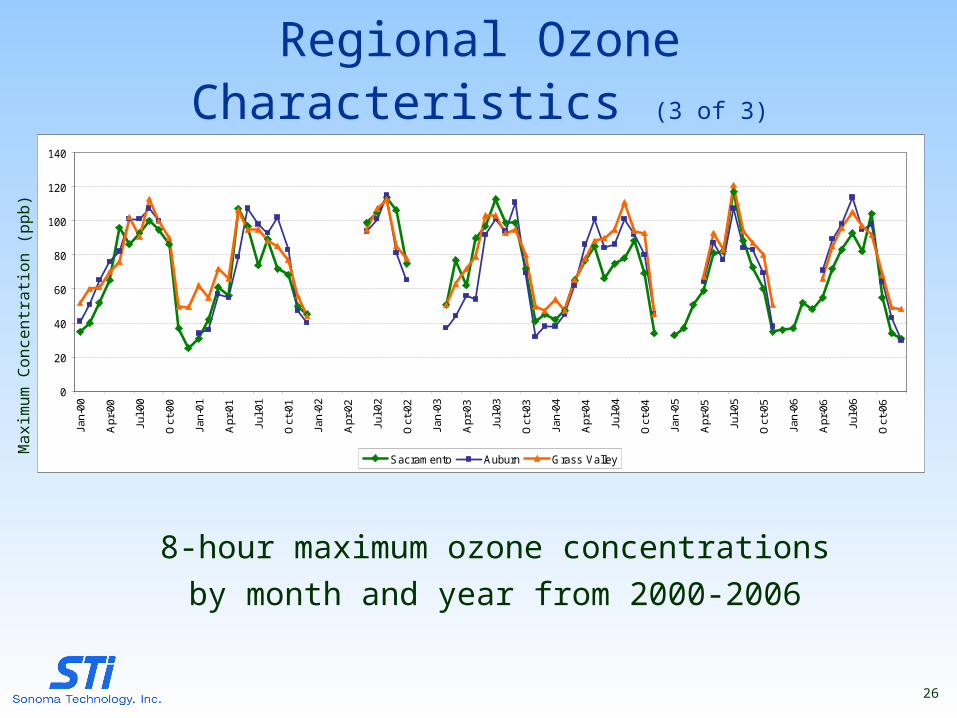
8-hour maximum ozone concentrations
by month and year from 2000-2006
Regional Ozone Characteristics (3 of 3)
26
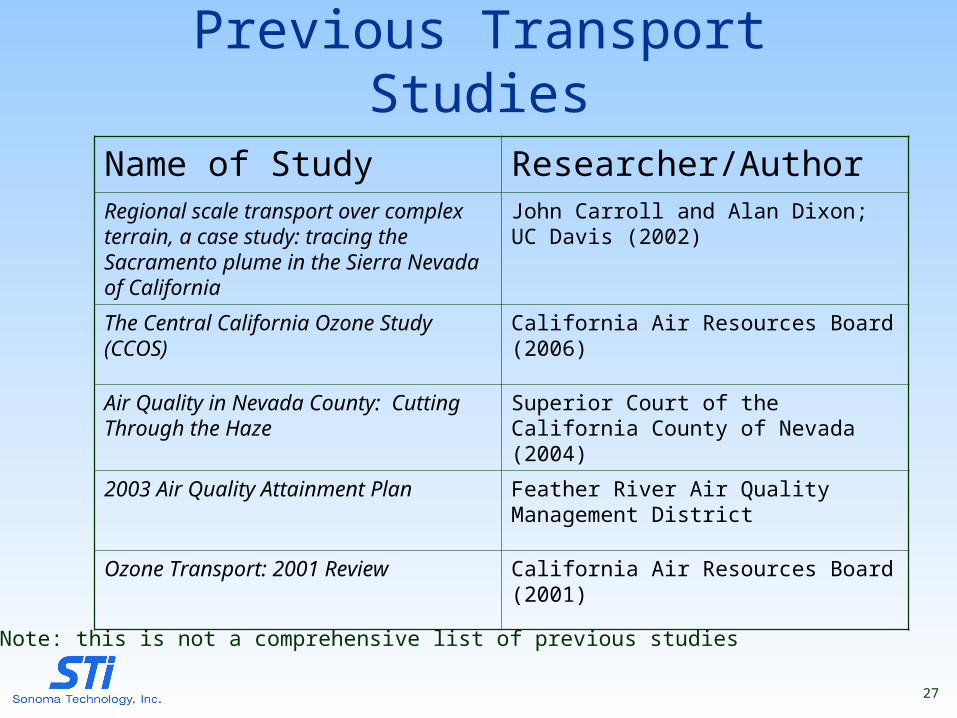
Previous Transport Studies
Name of Study Researcher/AuthorRegional scale transport over complex terrain, a case study: tracing the Sacramento plume in the Sierra Nevada of California
John Carroll and Alan Dixon; UC Davis (2002)
The Central California Ozone Study (CCOS)
California Air Resources Board (2006)
Air Quality in Nevada County: Cutting Through the Haze
Superior Court of the California County of Nevada (2004)
2003 Air Quality Attainment Plan Feather River Air Quality Management District
Ozone Transport: 2001 Review California Air Resources Board (2001)
Note: this is not a comprehensive list of previous studies
27
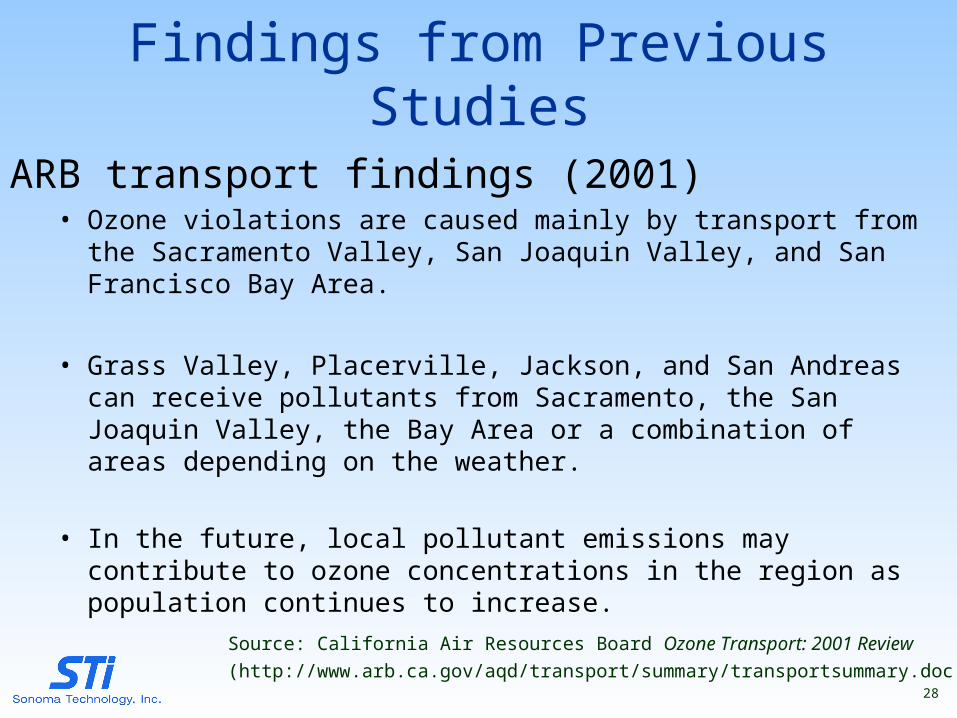
Findings from Previous Studies
ARB transport findings (2001)• Ozone violations are caused mainly by transport from the Sacramento
Valley, San Joaquin Valley, and San Francisco Bay Area.
• Grass Valley, Placerville, Jackson, and San Andreas can receive pollutants from Sacramento, the San Joaquin Valley, the Bay Area or a combination of areas depending on the weather.
• In the future, local pollutant emissions may contribute to ozone concentrations in the region as population continues to increase.
Source: California Air Resources Board Ozone Transport: 2001 Review
(http://www.arb.ca.gov/aqd/transport/summary/transportsummary.doc)28
Conclusions
• A literature review should be performed to synthesize the findings of recent transport studies in the Sacramento region to understand the state-of-the-science.
• Recommendations should be made for future activities that may include:– Field studies– Data analysis– Photochemical modeling
29