Embed Size (px)
Citation preview
814 PHILIP: FREEZING POINT CURVES FOR SOME
L XXXIV.-Freezing Point Ctwves f o r so me Binary Mixtures of Organic Substances, chieJy Phenols ccizd kmines.
By JAMES CHARLES PHILIP.
INTRODUCTORY. IT is well known that in general the addition of a small quantity of a substance A to another substance B lowers the freezing point of the latter, and if the freezing temperatures are plotted against concentra-
Publ
ishe
d on
01
Janu
ary
1903
. Dow
nloa
ded
by U
nive
rsity
of
Mic
higa
n L
ibra
ry o
n 28
/10/
2014
13:
59:3
1.
View Article Online / Journal Homepage / Table of Contents for this issue
BINARY MIXTURES O F ORGANIC SUBSTANCES 815
tioo, a freezing point curve is obtained, starting from the freezing point of B and falling towards the concentration axis. The same con- siderations apply to the effect of small quantities of B on the freezing point of A , from which also a freezing point curve starts. The initial portions of these curves, where one of the constituents is in large excess, have been very extensively studied with important practical results. But a further interesting field of investigation is opened up by the removal of the restricting condition that one of the constitu- ents should be present in large excess, The problem, which then involves the mutual relationship of the two, so far independent, freezing point curves, and the nature of the solid which separates when freezing takes place in mixtures of widely varying concentration, has been solved i n general terms by Roozeboom and Le Chatelier. Pro- viding that the two substances do not form mixed crystals, the com- plete freezing point curve conforms to one or other of two types according as the substances do or do not form compounds. If no compound is formed, the type of curve is that shown in Fig. 1, where
FIG. 1. PIG. 20.
the two curves starting from the freezing points of the constituents cut each other at the eutectic point, considerably below the freezing point of either constituent. If a compound is formed, a third curve intervenes (as in Figs. 2a and 2b), which cuts each of the ordinary freezing point curves, and may or may not have a maximum point or summit. If there is a summit, the composition of the mixture, which freezes at this maximum temperature, gives the formula of the com- pound produced. When the two constituent substauces form more than one compound, there is a branch of the composite curve corre- sponding with each, and when solidification commences in a mixture the composition of which lies within the limits of such a branch, the solid tha t separates is the compound to which this particular branch belongs.
These types of composite freezing point curves have been experi- mentally realised for binary systems of various kinds. Thus, curves like tha t in Fig. '1 have been obtained for mixtures of inorganic salts (Guthrie, Phil. Mag., 1884, 17, 643), for mixtures of metals, such as
Publ
ishe
d on
01
Janu
ary
1903
. Dow
nloa
ded
by U
nive
rsity
of
Mic
higa
n L
ibra
ry o
n 28
/10/
2014
13:
59:3
1.
View Article Online
816 PHILIP: FREEZIXG POINT CURVES FOX SOME
cadmium and zinc, tin and zinc, silver and lead (Heycock and Neville, Trans., 1897, 71, 383; Phil. Trans., A , 189, 25), and for mixtures of organic substances, such as acetic acid and benzene, naphthalene and diphenylamine, nitrobenzene and ethylene dibromide (Miolati, Zsit. physikal. Chem., 1892, 9, 649 ; Dahms, Wied, Ann., 1895, 54, 486 ; Crompton and Whiteley, Trans., 1895,67, 327 ; Roloff, Zeit. physikccl. Chrn., 1895, 1’7, 325 ; Paternb and Ampola, Gaxxetta, 1897, 2’7, 481). Examples of the curve type represented in Fig. 2a are supplied for the system salt - water by Roozeboom’s classical work on the hydrates of calcium chloride and ferric chloride; for alloys, by Heycock and Neville’s work on gold and aluminium (Phil. Trans., A , 194, Z O l ) , or Kurnakoff’s work on sodium and mercury (see Abstr., 1900, ji, 277) ; and for organic substances by KurilofPs work (Zeit. physikal. Chem,, 1897, 23, 547, 673), or by the freezing point curves for mixtures of optical isomerides (Roozeboom, Zeit. phpsikaZ. Chem., 1899, 28, 505 ; Adriani, {bid., 1900, 33, 462). Cases where a compound is indicated on the composite freezing point curve by a branch which does not reach a summit occur in freezing point curves for the system salt- water (see Donnan and Burt, this vol., p, 335), and are frequent in the freezing point curves of alloys. Very often a freezing point curve for mixtures of two metals combines the essential features of Fig. 2a and Fig. 26 (see Heycock and Neville, Zoc. cit., and Kurnakoff, Zoc. cit.). b Apart from Kuriloff’s curves, those given for mixtures of optical isomerides, and one or two isolated cases (for example, Schreinemakers, Zeit. physikal. Chem., 29, 581 ; Lidbury, ibid., 39, 453 ; van de Stadt, ibid., 41, 353), the freezing point curves hitherto obtained for mixtures of organic substances belong chiefly to the simple type shown in Fig. 1. The work described in the present paper was carried out with the view of obtaining additional examples of mixtures of organic compounds giving curves of the more complex types illustrated by Figs. 2a and 2 b.
Pairs of substances were chosen, chiefly phenols and amines, which might be expected to form compounds, and mixtures OF these were made up in different proportions ; the fused mixtures were allowed to cool slowly, and the point or points of solidification were determined in each case.
It will be seen from the experimental data given below and from the accompanying diagrams that freezing point curves exhibiting an inter- mediate branch with a marked summit (as in Fig. 2a) have been found for mixtures of p-cresol and aniline, phenol and urea, phenol and p-toluidine, phenol and a-naph thylamine, a-naphthol and p-tolu- idine, picric acid and phenol. The summit of the intermediate branch of the curve lies generally at 50 molecular per cent. ; in one case- phenol and urea-it lies at 33.3 molecular per cent. That is to say,
Publ
ishe
d on
01
Janu
ary
1903
. Dow
nloa
ded
by U
nive
rsity
of
Mic
higa
n L
ibra
ry o
n 28
/10/
2014
13:
59:3
1.
View Article Online
BlNARY MLXTURES O F ORGANIC SUBSTANCES. 817
the compounds, the existence of which is indicated by the form of the freezing point curve, contain in most cases a molecule of each con- stituent, whilst, in the exceptional case of phenol and urea, 2 mole- cdes of the former combine with one of the latter.
The most interesting case investigated is that of mixtures of phenol and p-toluidine, inasmuch as the compound of these two substances exists in two modifications, each of which has a corresponding branch of the freezing point curve, the one enveloping the other.
No case of a freezing point curve exactly of the type shown in Fig. 2b has been met with, but a close approximation is furnished by the phenol-urea curve, in which the intermediate branch ends just at the summit, so that one of the eutectic temperatures coincides with the summit temperature.
The extreme slowness with which some of these organic substances crystallise is well illustrated by the behaviour of mixtures of phenol and a-naphthylamine. Here it is possible to obtain a separation of phenol or a-naphthylamine in a mixture from which a t a considerably higher temperature the compound of these two substances should have cryst.allised; it is thus possible to realise portions of the primary freezing point curves underneath the intermediate branch,
Contrary to what might have been expected, there is no evidence for the formation of a compound in the case of either phenol and diphenylamine, or o-nitrophenol and P-toluidine, the freezing point curves for these two systems being of the simple type represented in Fig. 1.
Of the compounds dealt with in the course of the work, the r'ollow- ing have not been described : p-cresol and aniline, phenol and p-tolu- idine (as plates), picric acid and phenol ( I mol. of each), a-naphthol and p-toluidine.
It should be mentioned that the information given by the freezing point curves has been confirmed and supplemented by analysis of the crystals separating a t various points on the curves.
EX P E R I M E NT ILL.
The method adopted for the determination of the freezing points was essentially that due to Beckmann. Suitable quantities of the two con- stituents were weighed out in a tube or beaker, surrounded by a larger vessel of the same kind, and the whole was immersed in a bath of appropriate temperature. The fused mixture was allowed to cool, and the commencement of solidification was indicated by surfusion or merely by an alteration in the rate of cooling. Care was taken that the rate of cooling at the freezing point should not be too great, and in most cases excessive surfusion was avoided by introducing the
Publ
ishe
d on
01
Janu
ary
1903
. Dow
nloa
ded
by U
nive
rsity
of
Mic
higa
n L
ibra
ry o
n 28
/10/
2014
13:
59:3
1.
View Article Online
818 PHILIP: FREEZING POINT CURVES FOR SOME
appropriate solid. As pointed out by previous workers on this sub- ject, the accuracy of the temperature determination cannot be very great, since the temperature observed by the above method is not always the exact freezing point of the mixture under investigaation, but is usually a little too low. The error thus introduced will, under similar conditions, be most marked when the composition of the liquid mixture differs widely from that of the crystallising substance.
The composition of the mixtures was either va ied by adding fresh quantities of one constituent to the mixture under investigation ; or fresh quantities of each constituent were taken for each deter- mination.
The thermometer had a range from O-lOOo, and was divided into tenths of a degree; on examination and comparison with a standard thermometer, it was found to give readings which were in general 0.1' too high. In the following tables, the temperatures given are those actually read on this thermometer, for since the object of the in- vestigation was to determine the form of the freezing point curves, the correction of each separately observed freezing point was re- garded as superfluous. A second tharmometer ranging from - 20° to +30° and also divided into tenths, was occasionally used ; it was compared with the first thermometer, and its readings were cor- respondingly reduced.
The materials were redistilled or recry stallised before use, unless a determination of the freezing point had shown them to be sufficiently pure.
Phenol and Uipheibylanzine.
The freezing point curve for mixtures of these two substances is of the type shown in Fig. 1 ; the experimental numbers are given in the following Table I, and the curve itself is shown in Fig. 3. I n this curve, as in those to follow, temperature is plotted against molecular percentage.
Of the two freezing points given in the following table (p. 819) for the mixture with 29.3 molecular per cent. OF diphenylamine, the higher value, 1 9 * 8 O , is the point at which phenol begins to crystallise out, As the separation of phenol continues and the temperature accordingly falls, a second freezing point is observed at l8*lo, corresponding with the simultaneous separation of phenol and drphenylamine. The eutectic temperature is therefore 18.1°, and the eutectic mixture contains about 32 molecular per cent. of diphenylamine. This is not far removed from the composition of a mixture containing one mole- cular proportion of diphenylamine and two of phenol, and indeed the view was at one time held that the eutectic mixture always contains t t e constituents in simple molecular proportions, This interpretation
Publ
ishe
d on
01
Janu
ary
1903
. Dow
nloa
ded
by U
nive
rsity
of
Mic
higa
n L
ibra
ry o
n 28
/10/
2014
13:
59:3
1.
View Article Online
BINARY MIXTURES OF ORGANIC SUBSTAISCES. 819
TABLE I. ~~ ~
Weight of phenol.
29'08
22-28
19'05
19 *35 16-47 13'02 9.79 7-98 9.75 6-83 4.26 1.94 0-0
I ,
Y J
, J
Weight of iipheny lamine.
2'44 5 *29 7-91 8.35
11.29 14'21
18.10 22'14
Y Y
2 )
33)90 , Y
Y Y
3 ,
Y J
Percentage 01 diphenylaminc.
7.7 15'4 21'4 27 '3 33.6 42 -7
48.3 57.3 63.0 69 '3 73.5 77-7 83 *2 88 '8 94-6
1 0 0 ~ 0
Molecnl ar percentage of
dipheny lamine. Freezing point.
4 -5 9.2 13'1 17 *2 2.2.0 29*3
34'2 42'8 48'6 55 *7 60.7 65.9 73.4 81 *6 90.7
100.0
36-8" 33.3 30 *3 38.1 24-6
{ z {[;;:;I
25.0 28.3 32-0 34 '4 37.1 40 -4 44.1 48 -2 52-6
0 10 20 30 40 50 60 70 80 90 100 Molccwlar percciitage qf diphenylnnzine.
Phenol- Diphenylnmine. FIG. 3.
of the eutectic mixture has, however, been displaced in favour of the modern view (see Ostwald's Lehrbuch, I, 1023), and the experimental
Publ
ishe
d on
01
Janu
ary
1903
. Dow
nloa
ded
by U
nive
rsity
of
Mic
higa
n L
ibra
ry o
n 28
/10/
2014
13:
59:3
1.
View Article Online
820 PHILIP: FREEZING POINT CURVES FOR S O M E
work of Dahms and others has shown that in the great majority of cases the constituents of the eutectic mixture itre not in any exact molecular proportion, the simple ratios obtained in certain cases being probably nothing more than coincidences.
o-Nitrophelzol mzd p- Zbluidine.
I n this case, it might have been expected that t he freezing point curve would have the form indicated in Fig. 2, owing to the formation of a compound from the two constituents. This combination, how- ever, does not occur, and the freezing point curve consists only of two branches starting from the freezing points of the constituent substances, and melting a t a eutectic point, 15*6O, when the molecular percentage of p-toluidine is 52 (see Table I1 and Fig. 4, p. 821).
TABLE 11.
Weight of o-nitrophenoi.
35.52 9 )
9 9
9 9
25'*b2
20-26
18-49 16-60 18.66 13.55 10.03
7 '40 4 19 0'0
2 9
Weight of p - toluidine.
0 *o 3 *26 6 . 6 2 10*3& 13.96 13'42 17'63 17 -42
Y 7
27'b6 $ 2
9 2
30'i3 9 2
Percentage of y-toluidine.
0.0 8 *4
15.7 22'6 28 '2 34'1 40'5
46 '2 4 8 5 51 -2 59'4 66'8 73.1 78 '6 87'9
100.0
Molecular percentage of p-toluidine.
0.0 10 '6 19 .5 27.5 33'8 40 '2 46.9 52.8
55.0 57'7 65.5 72 '3 77.9 82.7 90.4
100 .o
Freeziug point.
44'1" 38 *9 34.4 30'2 26'7 22'8 18.2
17.8 20'0 24 '7 28 '9 32 '1 34-7 38 *5 43 a3
{ti..;
The double freezing point recorded for the 52.8 per cent. mixture is to be interpreted as before ; the higher point was obtained after sowing with p-toluidine, the lower steady eutectic point after further sowing with o-nitrophenol.
Liquid mixtures of o-nitrophenol and p-toluidine are deep red, and chis fact might be considered to indicate the formation of a compound. The evidence of the freezing point curve, and the examination of the crystals which separate on freezing, however, are both against this view. Thus, yellow crystals of o-nitrophenol, melting a t about 4 5 O ,
Publ
ishe
d on
01
Janu
ary
1903
. Dow
nloa
ded
by U
nive
rsity
of
Mic
higa
n L
ibra
ry o
n 28
/10/
2014
13:
59:3
1.
View Article Online

BINARY MIXTURES OF ORGANIC SUBSTANCES. 821
separated from the dark red mixture containing 46.9 per cent. of p-to1 uidino.
Molecular porcciztnge of toluidim.
o-Nihophcnol- p- Tokzcidine.
FIG. 4.
p-Cresol and Aniline.
The freezing point curve for mixtures containing from 0-67 molecular per cent. of aniline is shown in Fig. 5 p. 822).
TABLE 111.
Weight of p-cresol.
11 '94 9 -
I 9
7 1
8 *26 9 9
7 9
7 9
7 9
7 7
9 9
9 )
Weight of aniline.
0.0 1 '29 2.36 3-86 3.35 5'21 7 *06 7 -23 7 . 9 7 8.90
11.09 14'31
Percentage of aniline.
0.0 9.7
16'5 24'4 28'8 38 -7 46.1 46.7 49 '1 51 '9 57'3 63 '4
Molecular percentage of
aniline.
0.0 11'1 18.7 27.3 32.0 42'3 49 '8 50 '4 52.8 55% 60.9 66 '8
Freezing point.
33'4" 24.8 16.8
14'3 20.0 21 .2 21.1 21 '0 20.6 18'9 15'8
{ ::::
VOL. LXXXIII. 3 1
Publ
ishe
d on
01
Janu
ary
1903
. Dow
nloa
ded
by U
nive
rsity
of
Mic
higa
n L
ibra
ry o
n 28
/10/
2014
13:
59:3
1.
View Article Online

822 PHILIP: FREEZING POINT CURVES FOR SOME:
A compound is evidently formed i n this case, containing a molecular proportion of each constituent, inasmuch as there is an interitiediate branch of the freezing point curve with a well-marked summit at 50 molecular per cent. at 21.2'. According to tbeorg, the substance separating from any mixture which falls within the limits of the intermediate branch should have a composition defined by the position of the summit. This was borne out in the case of p-cresol and aniline by an analysis of the crystals separating from the last mixture, namely, that containing 66.8 per cent. uf aniline. The crystals were rapidly filtered a t the pump, pressed out on a porous plate, and thus obtained as colourless, scaly plates which were analysed without re- crystallisation, the object being to determine the composition of the
35'
30
25
20
15
10
0 10 20 30 40 50 60 5
illoZeciilar percentage of aitiline.
p-C~csol-AniZine,
Fru. 5 .
crystals as produced under the conditions of experiment. (by Kjeldahl's method) gave 7.2 per cent. of nitrogen in the crystals, whence the molecular ratio of p-cresol to aniline is 1 : 1.06. The high percentage of nitrogen was only to be expected, in view of the way in which the crystals were obtained.
This molecular compound of p-cresol and aniline has apparently not been previously prepared,
3
The analysis
Phenol and Urea.
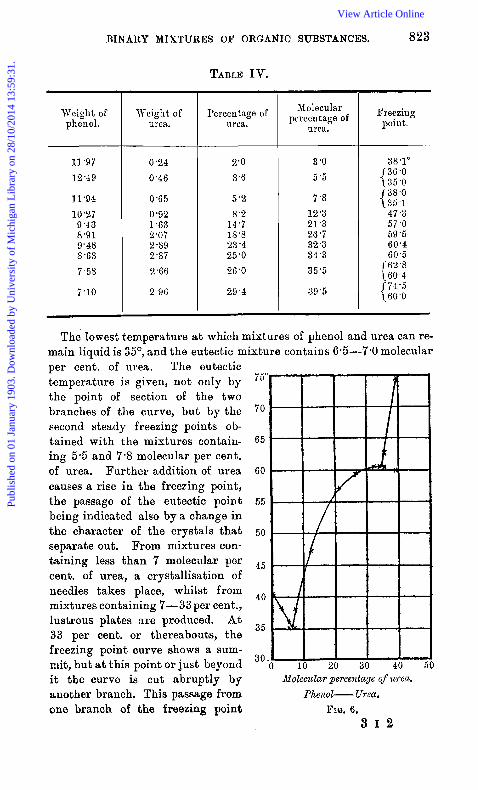
The results obtained with mixtures of phenol and urea containing from 0 to 39.5 molecular per cent, of urea are represented graphically in Fig. 6 (p. 823).
Publ
ishe
d on
01
Janu
ary
1903
. Dow
nloa
ded
by U
nive
rsity
of
Mic
higa
n L
ibra
ry o
n 28
/10/
2014
13:
59:3
1.
View Article Online
BINARY MIXTURES OF ORGANIC SUBSTANCES. 823
Weight of phenol.
11'97
12'49
11'94
10.27 9'43 8.91 9'48 8.63 7'58
7.10
Nr eig h t o f urea.
0.24
0.46
0 -65
0.92 1.63 2.07 2-59
2.66
2 9 6
2.87
TABLE IV.
Percentage of urea.
2'0
3.6
5 2 8'2 14'7 15'8 23 *4 25 -0 26 *O
29 '4
Molecular percentage of
urea.
3 *O 5 .5
7 *8 12 *3 21.3 26.7 32 *3 34'3
35.5
39 -5
Freezing point,
38.1"
{ ;;:; 138.0 L35.1
47.3 57 .o 59'5 60'4 60.5
{ g:4" (74.5 160 .0
The lowest temperature at which mixtures of phenol and urea can re- main liquid is 35", and the eutectic mixture contains 6-5-7.0 molecular per cent. of urea. The eutectic temperature is given, not only by the point of section of the two branches of the curve, but by the second steady freezing points ob- tained with the mixtures contain- ing 5.5 and 7% molecular per cent!. of urea. Further addition of urea causes a rise in the freezing point, the passage of the eutectic point being indicated also by a change in the character of the crystals that separate out. From mixtures con- taining less than 7 molecular per cent. of urea, a crystallisation of needles takes place, whilst from mixtures containing 7-33 per cent., lustrous plates are produced. A t 33 per cent. or thereabouts, the freezing point curve shows a sum- mit, but a t this point o r just beyond it the curve is cut abruptly by
75'
70
85
60
55
50
45
40
35
30
illolccular percentage of urea. another branch, This passage from Phenoi- Urea. one branch of the freezing point FIG, 6,
3 1 2
Publ
ishe
d on
01
Janu
ary
1903
. Dow
nloa
ded
by U
nive
rsity
of
Mic
higa
n L
ibra
ry o
n 28
/10/
2014
13:
59:3
1.
View Article Online
824 PHILIP: FREEZING: POINT CURVES FOR SOME
curve to another is, moreover, indicated by a change in the nature of the crystallisation, for, instead of plates, a mass of minute crystals is produced when solidification begins.
The freezing points on the steep branch a t 62.8' and 7 4 ~ 5 ~ were very transient; there was no surfusion, and the temperature at which crystallisation began was determined as closely as possible by observa- tion; the reading could be made to within O*1-O*2°, providing that the rate of cooling was slow ; the value thus obtained was confirmed by a slight alteration in the rate at which the mixture cooled after the commencement of crystallisation. The second freezing points observed for the mixtures containing 35.5 and 39.5 molecular per cent. of urea were very steady and well-marked ; they represent the eutectic point at which the substances corresponding with the branches of the curve crystallise out together.
The summit at 33 molecular per cent, indicates the existence of a compound containing 1 molecule of urea to 2 molecules of phenol, and the plates which crgstallise from mixtures containing 7-33 per cent. of urea should consist of this compound, To test this, a mixture was prepared containing 12.2 molecular per cent. of urea; this was completely me1 ted and then allowed to crystallise partially. The separated crystals (plates) were rapidly filtered at the pump, the operation being carried out in a box kept at 40-50°, and then pressed out on porous tile previously heated to about 50'. The crystals were anaiysed a t once, and found to contain 10.5 per cent. of nitrogen, whence the molecular ratio of urea to phenol is 1 : 2.2.
The change in the nature of the crystallisation observed on passing the summit at 33 molecullzr per cent. was confirmed by analysis of the crystals separating from a mixture containing 39-2 molecular per cent. of urea. The filtering apparatus and the drying ti lo were in this case heated to about 70". The crystals were found to contain 46.6 per cent, of nitrogen, and therefore consisted of urea; hence the steep branch starting at 33 molecular per cent, would end a t the freezing point of urea.
The above-mentioned compound of urea and phenol bas been described by Eckenroth (Jahresber., 1886, 548) ; as stated by him, the crystals melt a t 61", lose phenol when left exposed to the air, and gradually change into a white powder.
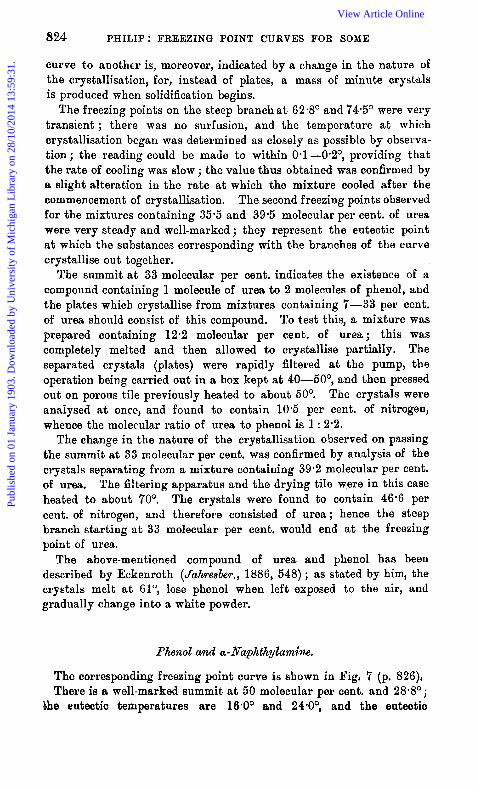
Phenol and a-Naphthytamine.
The corresponding freezing point curve is shown in Fig. 7 (p. 826), There is a well-marked summit a t 50 molecular per cent. and 28.8';
the eutectic temperatures are 16*0° and 24.0°, and the eutectic
Publ
ishe
d on
01
Janu
ary
1903
. Dow
nloa
ded
by U
nive
rsity
of
Mic
higa
n L
ibra
ry o
n 28
/10/
2014
13:
59:3
1.
View Article Online
BINARY MIXTURES OF ORGANIC SUBSTANCES. 825
Weight of phenol.
92.25 75248 58'92
8.49
7 *81
7 *54 6 '74 5 -97
14.41 13-13 4'21 5 *05 3-92 9.07 2-54 6.66 4 '26 1 - 3 2 0.0
Weigli t of Q naphthyl-
arnine.
0.00 9.55
20,61 3 .66
3.94
4.77 5 51 ti .75
20.18 20'55 8 -82
12'05
10'84 26 46
9.03 32'23
20'*i4 9 9
TABLE V.
Percentage of a-naph t 11 yl-
amine.
0.0 11'2 25'9 30.1
33.5
38.7 45.0 53 -1 58 -3 61.0 67.7 70.4 73 *4 74'5 78.0 82-9 88'3 93.8
100*0
MolecriLir percentage of a-naphthgl-
amiiic.
0 '0 7 . 6
18.7 22.1
24 '9
29.4 35 0 42 6 47.9 50.7 57 9 61.0 64.5 65'7 70.0 76.1 83.2 90 9
100.0
Fleezing point.
40.4" 34 2 21%
15'9 13'2
(20.8
24 -8 27'8 28 '6 28 '6 27.6 15.9
21.3
31 -0 36 *9 42.5 48.3
\ 5.5
mixtures contain respectively 2 3 5 and 68 molecular per cent. of a-naphthylamine.
I n this case also, the conclusions drawn from the freezing point curve as to the nature of the substances which crystallise from mixtures of different compositions were confirmed by ana lysk The compound of phenol and u-naphthylamine, the existence of which is proved by the freezing poiut curve and confirmed by analysis, has been previously prepared by Dyson (Trans,, 1883, 43, 469), and its melting point is given by him as 30.19 The compound is characterised by the extreme slowness with which it crystallises, and owing to this i t wds possible to realise portions of the first and third branches of the freezing point curve below the eutectic temperatures, Indeed, the intermediate mound could only be realised by adding a small crystal of the compound, which had been already obtained after a few weeks from a mixture containing 32.5 molecular per cent. of a-naphthylamine. The compound can also be obtained by cooling sufficiently mixtures containing the constituents in approximately molecular proportions. The importance of inoculating the mixture with these crystals will
Publ
ishe
d on
01
Janu
ary
1903
. Dow
nloa
ded
by U
nive
rsity
of
Mic
higa
n L
ibra
ry o
n 28
/10/
2014
13:
59:3
1.
View Article Online
826 PHILIP: FREEZING POINT CURVES FOR SOME
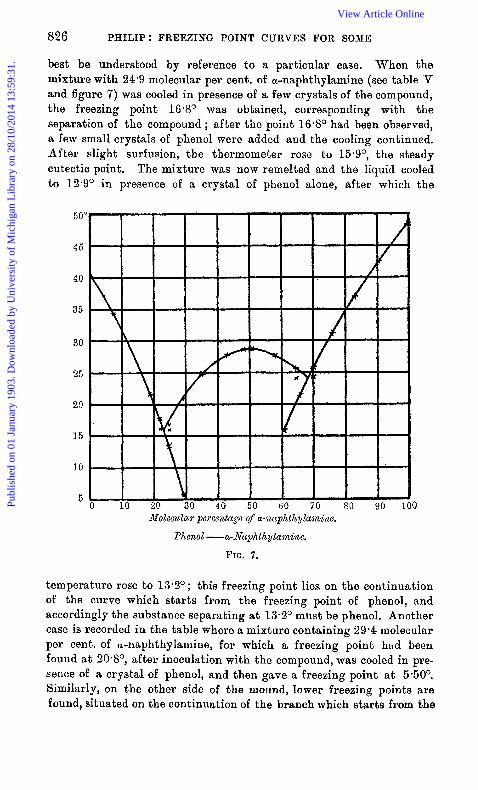
best be understood by reference to a particular case. When the mixture with 24-9 molecular per cent. of a-naphthylamine (see table V and figure 7) was cooled in presence of a few crystals of the compound, the freezing point 16.8' was obtained, corresponding with the separation of the compound; after the point 16.8' had been observed, a few small crystals of phenol were added and the cooling continued. After slight surfusion, the thermometer rose to 1 5 * 9 O , the steady eutectic point. The mixture was now remelted and the liquid cooled to 12.9' in presence of a crystal of phenol alone, after which the
50"
45
40
35
30
25
20
15
10
5 0
temperature rose to 13.2'; this freezing point lies on the continuation of the curve which starts from the freezing point of phenol, and accordingly the substance separating a t 13.2' must bo phenol. Another case is recorded in the table where a mixture containing 29.4 molecular per cent. of a-naphthyIamine, for which a freezing point had been found a t 20*8O, after inoculation with the compound, was cooled in pre- sence of a crystal of phenol, and then gave a freezing point at 5.50'. Similarly, on the other side of the mound, lower freezing points are found, situated on the continuation of the branch which starts from the
Publ
ishe
d on
01
Janu
ary
1903
. Dow
nloa
ded
by U
nive
rsity
of
Mic
higa
n L
ibra
ry o
n 28
/10/
2014
13:
59:3
1.
View Article Online
BINARY MIXTURES O F ORGANIC SUBSTANCES, 827
freezing point of a-naphthylamine. I t was hoped that the two branches starting from the freezing points of the constituents might be realised completely as far as their point of intersection, but i t was found tha t phenol or a-naphthylamine did not separate from mix- tures containing approximately molecular proportions of the con- stituents ; when the cooled mixture was inoculated with either substance, i t became almost completely solid in a few minutes, owing to separation of the compound.
The sluggishness of the phenol-a-naphthylamine compound is illas- trated also by the following experiment, Equal quantities of the liquid mixture containing 64.6 molecular per cent. of a-nnphthylamine were put in each of three watch-glasses, I, 11, and 111. To I, a little a-naphthylamine was added, to I1 a little of the molecular com- pound, while I11 was left untouched. Next morning, the contents of 111 were still liquid ; partial crystsllisstion had taken place both in I and 11, but the amount of crystzlline matter was obviously greater in I1 than in I, as might be expected from the freezing points recorded for this mixture. Crystals of a-naphthylamine and of the compound mere now-added to 111, and by the following morning its contents had shrunk up into a solid mass; this also might have been predicted from the freezing point curve, inasmuch as the eutectic point associated with the simultaneous crystallisation of the two sub- stances is 24", a temperature well above that of the room. It thus appears tha t when a liquid mixture is supersaturated, firstly and chiefly with regard to the compound, secondly with regard to a-naphthylamine, the second suparsaturation may be removed without disturbing the first (compare Dahms, Zoc. cit .) . On the other side of this eutectic point, it was possible to obtain and keep for a limited time liquid mixtures supersaturated firstly and chiefly with regard to a-naphthylamine, and secondly with regard to the compound, but spontaneous crystallisation of a-naphthylamine ultimately took place, whilst inoculation with crystals of the compound led to a separation of both substances,
It was not easy, owing to the slow crystallisation of the compound of phenol and a-naphthylamine, to obtain accurate determinations of the points situated on the mound. Even with very slow cool- ing after inoculation, there might be considerable surfusion, ap, for example, in the case of the mixture with 58 molecular per cent. of a-naphthylamine, The temperature at the time of inoculatlion was 28*35O, and 40 minutes later it had fallen to 2 7 . 2 O ; EL slow rise of temperature then took place, but another 20 minutes elapsed before the crystals were in complete equilibrium with the liquid, and the temperature reached i ts maximum a t 2 7 . 6 O . I n other cases, even greater surfusion could not be avoided, and this, obviously, led to
Publ
ishe
d on
01
Janu
ary
1903
. Dow
nloa
ded
by U
nive
rsity
of
Mic
higa
n L
ibra
ry o
n 28
/10/
2014
13:
59:3
1.
View Article Online
825 PHILIP: FREEZING POINT CURVES FOR SOhiE
error, all the more when the composition of the liquid differed coasider- ably from that of t h e substance crystallising out. I n some cases, therefore, t.he freezing point was taken t o be the temperature at which the quantity of crystalline matter was obviously increasing ; this point was occasionally a few tenths of a degree higher than the maximum temperature subsequently attained.
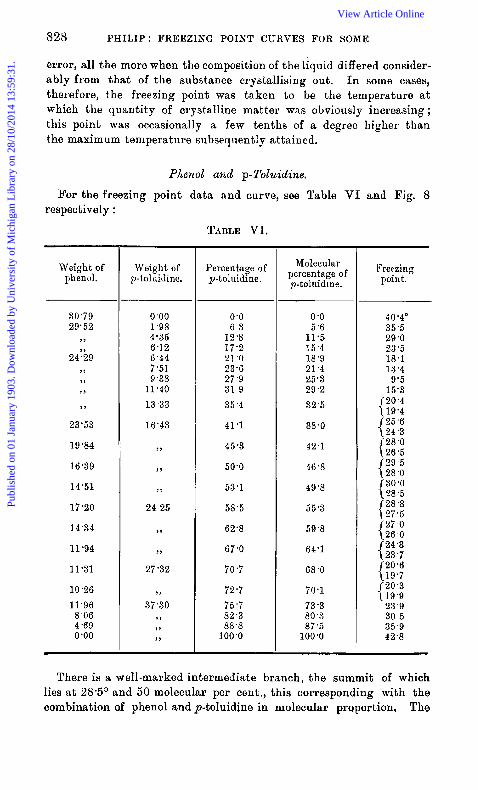
Phenol and p-Tohidine.
For the freezing point data and curve, see Table VI and Fig. 8 respectively :
TABLE VI.
Weight of phenol.
30.79 29.52
24'b9
¶ )
9 )
9 9
1 )
> )
23'53
19 '84
16-39
14'51
17-20
14.34
11.94
11-31
10.26 11'96
8'06 4.69 0-00
Weight of p-toluidine.
0 .oo 1.98 4'35 6.12 6'44 7 '51 9.38
11.40
13 33
16.43
))
9 )
2 )
24 25
9 9
9 )
27-32
Y )
37-30 9 )
2 )
1,
Percentage of p-toluidine.
0.0 6 3
12.8 17'2 21'0 23-6 27.9 32 9
35 '4
41-1
45-3
50.0
53.1
58.5
62-8
67.0
70 *7
72.7
75 -7 82 -3 88'8
100'0
Molecular percentage of p-toluidine.
0 .o 5.6
11'5 15.4 18'9 21'4 25-3 29.2 32.5
38.0
42-1
46.8
49'5
55.3
69.8
64'1
68 '0
70.1
73.3 80.3 87.5 100*0
Freezing point.
There is a well-marked intermediate branch, the summit of which lies at 28.5' and 50 molecular per cent,, th is corresponding with the combination of phenol aud p-toluidine in molecular praportion, The
Publ
ishe
d on
01
Janu
ary
1903
. Dow
nloa
ded
by U
nive
rsity
of
Mic
higa
n L
ibra
ry o
n 28
/10/
2014
13:
59:3
1.
View Article Online

BINARY MIXTURES OF ORGANIC SUBSTANCES. 829
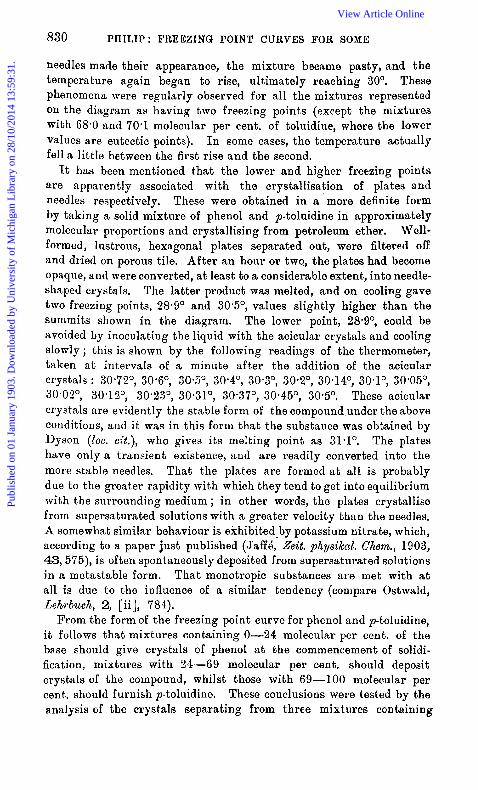
eutectic temperatures, where the intermediate branch or mound cuts the two ordinary branches, lie a t 8.0' and 19*9", and t h e eutectic mixtures contain 24 and 69 molecular per cent. of p-toluidine respective1 y.
The peculiar and interesting featnre of the intermediate branch is that it is enveloped by another curve, with a summit at 50 molecular per cent. and 30'. The diagram simply expresses the fact tha t the compound of phenol and p-toluidine exists in two modifications, one of which freezes 1.5' higher than the other. The evidence for the existence of this double ciirve will be best apprtciated by following
the
45'
40
35
30
25
20
15
20
5
Molecular percentccge of toluidinc.
Phenol -p- To I ibidinc.
FIG. 8.
cooling process for a mixture which was found to have
I
0
two freezing points, as shown in the table and figure. The mixture, for example, containing 49.8 molecuIar per cent. of toluidine was completely melted and then allowed to cool, when the thermometer readings at intervals of a minute were as follows : 29*5', 29-15', 28*8', 28*52', 28-24', 28*44', 2 8 * 5 O , 28*5', 28-56', 29-14', 29 4', 29-58', 29 67', and so on, gradually up to 30'. When this mixture began to crystallise, there was first a separation of glistening plates, and a corresponding slight rise of temperature, a s shown above, from 28.2' to 28.5'. The thermometer halted for a minute or t w o at this point, but presently
Publ
ishe
d on
01
Janu
ary
1903
. Dow
nloa
ded
by U
nive
rsity
of
Mic
higa
n L
ibra
ry o
n 28
/10/
2014
13:
59:3
1.
View Article Online
830 PHILIP: FREEZING POINT CURVES FOR SOME
needles made their appearance, the mixture became pasty, and the temperature again began to rise, ultimately reaching 30'. These phenomena were regularly observed for all the mixtures represented on the diagram as having two freezing points (except the mixtures with 68.0 and 70.1 molecular per cent. of toluidine, where the lower values are eutectic points). I n some cases, the temperature actually fell a IittIe between the first rise and the second,
It has been mentioned that the lower and higher freezing points are apparently associated with the crystallisation of plates and needles respectively. These were obtained in R more definite form by taking a solid mixture of phenol and p-toluidine in approximately molecular proportions and crystallising from petroleum ether. Well- formed, lustrous, hexagonal plates separated out, were filtered off and dried on porous tile. After an hour or tiv.vq, the plates had become opaque, and were converted, at least to a considerable extent, into needle- shaped crystals. The latter product was melted, and on cooling gave two freezing points, 2 8 ~ 9 ~ and 30*5O, values slightly higher than the summits shown i n the diagram. The lower point, 2 8 * 9 O , could be avoided by inoculating the liquid with the acicular crystals and cooling slowly; this is shown by the following readings of the thermometer, taken a t intervals of a minute after the addition of the acicular crystals : 303"7°, 30*6", 30*5', 30*4', 30*3O, 30*2O, 30°140, 30*1', 30.05', 30.02", 30.1 2', 30*233, 30*31', 30*37O, 30*45', 30.5'. These acicular crystals are evidently the stable form of the compound under the above conditions, and i t was in this form that the substance was obtained by Dyson (Zoc. c i t , ) , who gives i ts melting point as 31.1'. The plates have only a transient existence, aud are readily converted into the more stable needles. That the plates are formed at all is probably due to the greater rapidity with which they tend to get into equilibrium with the surrounding medium; in other words, the plates crystallise from supersaturated solutions with a greater velocity than the needles. A somewhat similar behaviour is exhibited-by potassium nitrate, which, according to a paper just published (JaffO, Zeit. physikal. Chem., 1903, 43,575), is often spontaneously deposited from supersaturated solutions in n metastable form. That monotropic substances are met with at all is due to the influence of a similar tendency (compare Ostmald, Lehrbuch, 2, [ii], 781).
From the form of the freezing point curve for phenol and p-toluidine, it follows that mixtures containing 0-24 molecular per cent. of the base should give crystals of phenol at the commencement of solidi- fication, mixtures with 34-69 molecular per cent. should deposit crystals of the compound, whilst those with 69-100 molecular per cent. should furnish p-toluidine. These conclusions were tested by the analysis of the crystals separating from three mixtures containing
Publ
ishe
d on
01
Janu
ary
1903
. Dow
nloa
ded
by U
nive
rsity
of
Mic
higa
n L
ibra
ry o
n 28
/10/
2014
13:
59:3
1.
View Article Online
BINARY MIXTURES OF ORGANIC SUBSTANCES. 831
respectively 32.8, 66.5, and 70.6 molecular per cent;. of p-toluidine. The first two mixtures, although differing widely in composition, are both comprised within the limits of the intermediate mound, and in accordance with the foregoing view the crystals separating from them contained respectively 6.5 and 6-9 per cent. of nitrogen (the molecular cornpbund should contain 6.96 per cent.). The crystals separating from the third mixture, which, although differing only slightly in composition from the second, was, however, separated from it by a eutectic point, were found to contain 11-9 per cent. of nitrogen (p-toluidine contains 13.1 per cent,). The crystals were separated from the mother liquor simply by filtration and draining on porous tile, recry stallisation not being permissible.
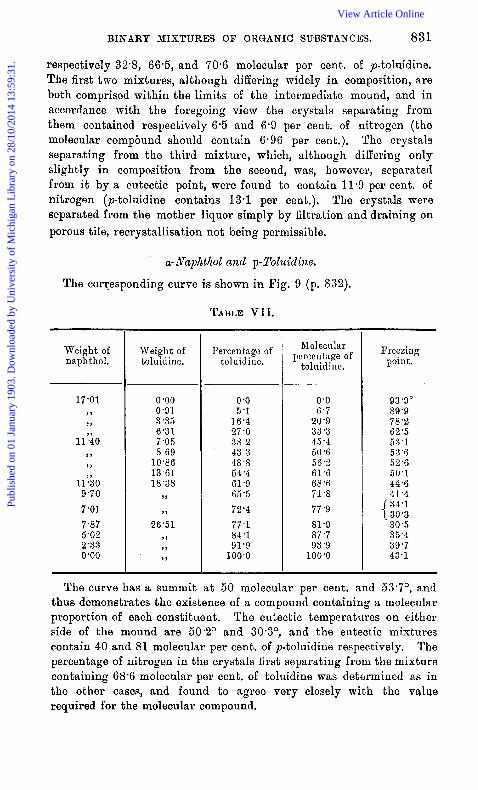
a- LVaphthol and p-Y'oluidine.
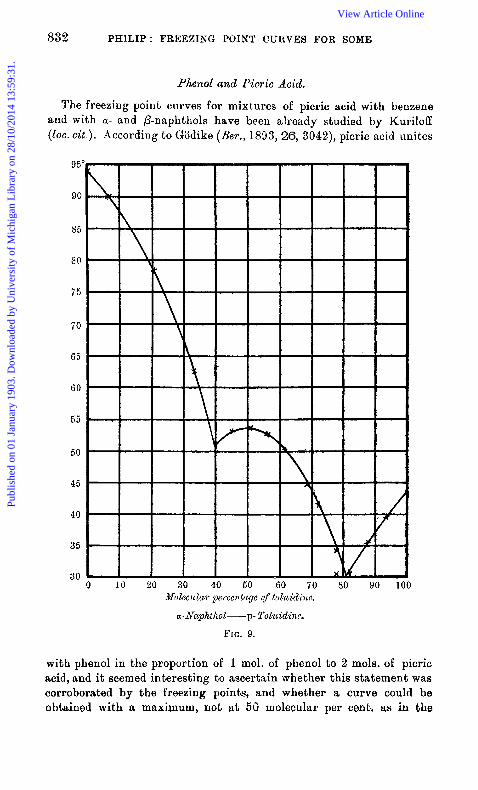
The corresponding curve is shown in Pig. 9 (p. S32).
TABLE VII.
Weight of naphthol.
17'01 9 9
9 )
11'*io
l l % O
9 )
9 )
9.70 7.01 7 -87 5.02 2.33 0 -00
Weight of toluidine.
0 '00 0 *91 3-35 6-31 7.05 8 .69
10.86 13 -61 18'38
9 )
) Y
26-51 9 9
9 7
9 )
Percen tagc of toluidinc.
0 '0 5 '1
16.4 27.0 38 .2 43 .3 48 .8 54.4 61 '9 65 -5 72.4 77 -1 84 *1 91'9
100-0
Molecular percentage of
toluidine.
0'0 6 .7
20.9 33'3 45'4 50% 5 6 2 61 -6 68.6 71 .8
77.9 81.9 87.7 93 '9
100.0
Freezing point.
93.9" 89 .9 78'2 62'5 53 '1 53'6 56.6 50.1 44 .6 41 .4
{El; 30 .5 35 '4 39.7 43.1
The curve has a summit a t 50 molecular per cent, and 53.7') and thus demonstrates the existence of a compound containing a moleciilar proportion of each constituent. The eutectic temperatures on either side of the mound are 50.2' and 30.3', and the eutectic mixtures contain 40 and 81 molecular per cent, of p-toluidine respectively. The percentage of nitrogen in the crystals first separating from the mixture containing 68.6 molecular per cent. of toluidine was determined as in the other cases, and found to agree very closely with the value required for the molecular compound.
Publ
ishe
d on
01
Janu
ary
1903
. Dow
nloa
ded
by U
nive
rsity
of
Mic
higa
n L
ibra
ry o
n 28
/10/
2014
13:
59:3
1.
View Article Online
832 PHILIP: FREEZING POINT CURVES FOR SOME
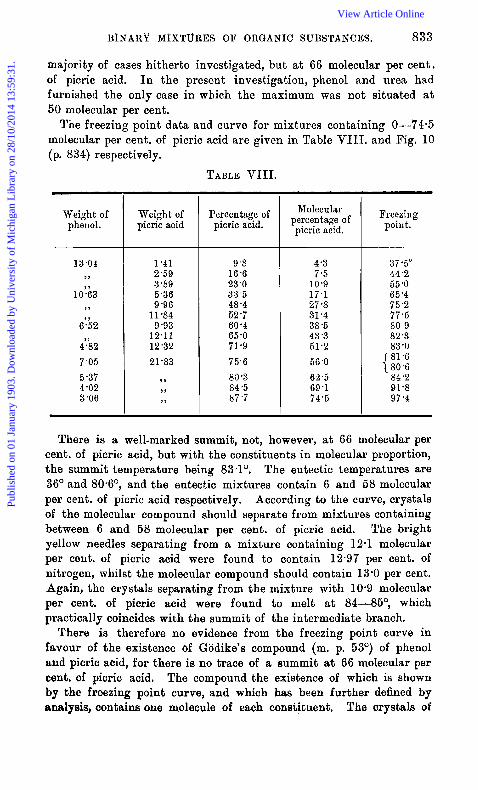
Phenol and Picric Acid.
The freezing point curves for mixtures of picric acid with benzene and with U- and ,&naphthols have been already studied by Kuriloff (Zoc. c i t . ) . According to Giidike ( B e y . , 1893, 26, 3042), picric acid unites
95"
90
85
80
75
70
65
60
55
50
45
40
35
30 0 10 20 30 40 50 60 TO SO 90 100
Alolecular percentage of toluidine.
a - Napht ho 1- p- To 1u id inc.
FIG. 9.
with phenol in the proportion of 1 mol. of phenol to 2 mols. of picric acid, and it seemed interesting to ascertain whether this statement was oorroborated by the freezing points, and whether a curve could be obtained with a maximum, not at 53 molecular per cent, as in the
Publ
ishe
d on
01
Janu
ary
1903
. Dow
nloa
ded
by U
nive
rsity
of
Mic
higa
n L
ibra
ry o
n 28
/10/
2014
13:
59:3
1.
View Article Online
BINARY MIXTdRES OF ORGANIC SUBSTANCES. 833
majority of cases hitherto investigated, but at 66 molecular per cent. of picric acid. I n the present investigation, phenol and urea had furnished the only case in which the maximum was not situated at 50 molecular per cent.
The freezing point data and curve for mixtures containing 0-74.5 molecular per cent. of picric acid are given in Table VIIT. and Fig. 10 (p. 834) respectively.
TABLE VIII.
Weight of phenol.
13.04
lO'h3
S'k2
4'*8 2 7 -05 5.37 4-G2 3.06
9 9
9 7
Weight of picric acid
1 *41 2.59 3 -89 5.36 9 -96
11 -84 9 -93
12-11 12.32 21-83
9'
Y 9
Y 7
Percentage of picric acid.
9 .8 16'6 23 .O 38 5
52 *7 60.4 65.0 71.9 75.6 80 -3 84.5 s7 *7
48 -4
Molecular percentage of picric acid.
4.3 7.5
10.9 17.1 27 -8 31.4 38 *5 43'3 51.2 56 .o 62.5 69 *1 74.5
Freezing poiii t.
37'5" 44'2 55.0 65 '4 75.2 77.5 so O9 82.3 83.0
{ K: 84'2 91.8 97'4
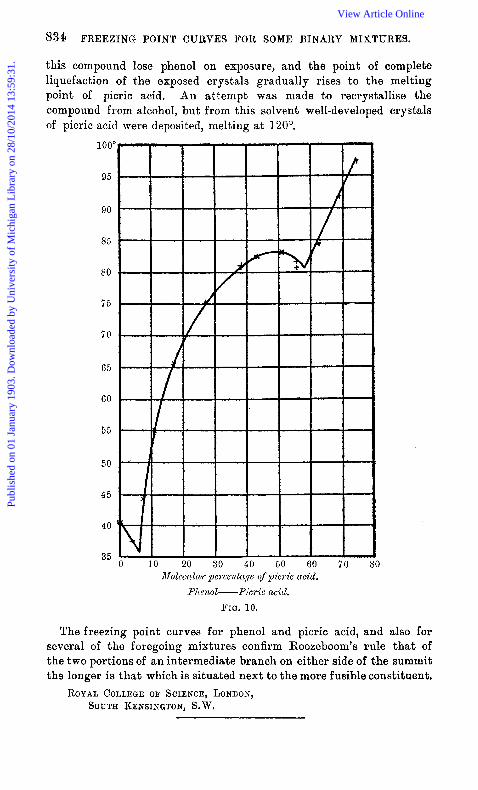
There is a well-marked summit, not, however, at 66 molecular per cent. of picric acid, but with the constituents in molecular proportion, the summit temperature being 83.1'. The eutectic temperatures are 36' and 80*6O, and the eutectic mixtures contain 6 and 58 mvlecular per cent. of picric acid respoctivelg. According to the curve, crystals of the molecular compound should separate from mixtures containing between 6 and 58 molecular per cent. of picric acid. The bright yellow needles separating from a mixture containing 12.1 molecular per cent. of picric acid were found to contain 12.97 per cent. of nitrogen, whilst the molecular compound should contain 13.0 per cent. Again, the crystals separating from the mixture with 10.9 molecular per cent. of picric acid were found to melt at 84-85', which practically coincides with the summit of the intermediate branch.
There is therefore no evidence from the freezing point curve in favour of the existence of Godike's compound (m. p. 53") of phenol and picric acid, for there is no trace of a summit a t 66 molecular per cent. of picric acid. The compound the existence of which is shown by the freezing point curve, and which has been further defined by analyeis, contains one molecule of each constituent. The crystals of
Publ
ishe
d on
01
Janu
ary
1903
. Dow
nloa
ded
by U
nive
rsity
of
Mic
higa
n L
ibra
ry o
n 28
/10/
2014
13:
59:3
1.
View Article Online
834 FREEZING POlNT CURVES FOR SOME BINARY MIXTURES.
this compound lose phenol on exposure, and the point of complete liquefaction of the exposed crystals gradually rises t o the melting point of picric acid. An at tempt was made to recrystallise the compound from alcohol, but f rom this solvent well-developed crystals of picric acid were deposited, melting at 120'.
100'
95
90
85
EO
I - - 13
i 0
65
60
55
50
4 5
40
35
dfooleculny pcrce?itnp of yicric acid. Phenol- Pic& acid.
FIG. 10.
The freezing point curves for phenol and picric acid, and also for several of the foregoing mixtures confirm Roozeboom's rule t h a t of the t w o portions of a n intermediate branch on either side of the summit th9 longer is t h a t which is situated next to the more fusible constituent.
ROYAL COLLEGE OF SCIENCE, LONDON, SOUTH KENSINGTON, S. W.
Publ
ishe
d on
01
Janu
ary
1903
. Dow
nloa
ded
by U
nive
rsity
of
Mic
higa
n L
ibra
ry o
n 28
/10/
2014
13:
59:3
1.
View Article Online