Embed Size (px)
Citation preview
lable at ScienceDirect
LWT - Food Science and Technology 55 (2014) 139e147
Contents lists avai
LWT - Food Science and Technology
journal homepage: www.elsevier .com/locate/ lwt
Soft cheese-like product development enriched with soy proteinconcentrates
Ana N. Rinaldoni a, Diana R. Palatnik a, Noemi Zaritzky b, Mercedes E. Campderrós a, *
a Instituto de Investigaciones en Tecnología Química (INTEQUI) e CCT-CONICET, Facultad de Química, Bioquímica y Farmacia, Universidad Nacional de SanLuis, Chacabuco 915, 5700 San Luis, Argentinab Centro de Investigación y Desarrollo en Criotecnología de Alimentos CIDCA (UNLP-CONICET La Plata), Facultad de Ingeniería, UNLP, La Plata, Bs As,Argentina
a r t i c l e i n f o
Article history:Received 13 March 2013Received in revised form2 September 2013Accepted 3 September 2013
Keywords:Soy proteinFunctional cheeseCheese-like products characterizationShelf-life
* Corresponding author. Tel.: þ54 266 4424689; faE-mail addresses: [email protected], mcampd@g
0023-6438/$ e see front matter � 2013 Elsevier Ltd.http://dx.doi.org/10.1016/j.lwt.2013.09.003
a b s t r a c t
The objective of this work was to develop spreadable cheese-like product from skimmed cow’s milk,supplemented with soybean proteins. The proteins were concentrated by ultrafiltration, and thenfreeze-dried. The cheese-like products were prepared using the acid coagulation method, withoutmaturation, obtaining smooth products with creamy texture. The samples were identified as low-fatcheese, being the fat content between 10 and 13 (g/100 g), with moisture in the range of 68.07e70.75 (g/100 g). Compared to a control cheese, the samples containing soy protein concentrate,showed an increase of 6.8e17 in proteins and 22e32 (g/100 g) in fats; also the yield increased. Theviscoelastic behavior of the samples was analyzed using oscillatory dynamic tests; in all the samples G0
was higher than G00 . Texture, surface color and microstructure of the cheese samples were determined.Microbial analysis showed that the incorporation of potassium sorbate increased more than twice theshelf-life of the products (up to 60 days) in comparison to the samples without preservative.Furthermore, the products were accepted by a sensory panel. Considering that both, proteins and fats,are of vegetable origin with high biological value and unsaturated fats, the developed cheese-likeproducts were considered as functional foods.
� 2013 Elsevier Ltd. All rights reserved.
1. Introduction
Protein foods are essential to ensure adequate nutrition. Thedevelopment of new sources of proteins and the optimization of theexisting ones are issues of great interest and study (Cheftel, Cuq, &Lorient, 1989). Moreover, the use of ingredients beneficial to healthhas been identified as a steadily growing trend in the food industry.In this way, functional foods refer to foods or food ingredients thatprovide specific physiological beneficial effects and/or reduce therisk of chronic disease beyond basic nutritional functions (Gomesda Cruz, Buriti, Souza, Faria, & Saad, 2009; Mazza, 1998).
Cheese is a food with high protein content, with a widespreadconsumption. Besides containing proteins of good quality, contributesto calcium binding and generally has fewer digestive problems thatotherdairyproduct.However, it hasahighcontentof saturated fats, animportant contribution of calories and in general, is an expensive
x: þ54 2652 426711.mail.com (M.E. Campderrós).
All rights reserved.
product, due to the low yield (Karaman & Akalin, 2013; Krbavci�c &Bari�c, 2004; Mistry, 2001).
Therefore, it is a challenge for the food industry the formula-tion of foods with ingredients that help to lower health risks, as inthe case of substituting animal fats by vegetable fats and oils,obtaining foodstuffs low in cholesterol and saturated fats. In thissense, the cheese seems to be a good matrix to incorporatevegetable proteins. Thus, cheese analogs, imitation cheese orprocessed cheese food, are gaining increasing acceptance withfood processors and consumers because many potential benefits(Bachmann, 2001; El-Neshawy, Farahat, & Wahbah, 1988; Far-ahmandfar, Mazaheri Tehrani, Razavi, & Habibi Najafi, 2010;Mounsey & O’Riordan, 2001).
Between vegetable proteins, soybean is a highly nutritious foodmaterial that contains well balanced amino acids and desirablefatty acids and it plays an important role as a protein source formany people around the word. Furthermore it must be consideredthat the cost of producing cheese analogs can be less than thatproducts obtained only from animal proteins. There are variousfood formulations that incorporate soy proteins for various
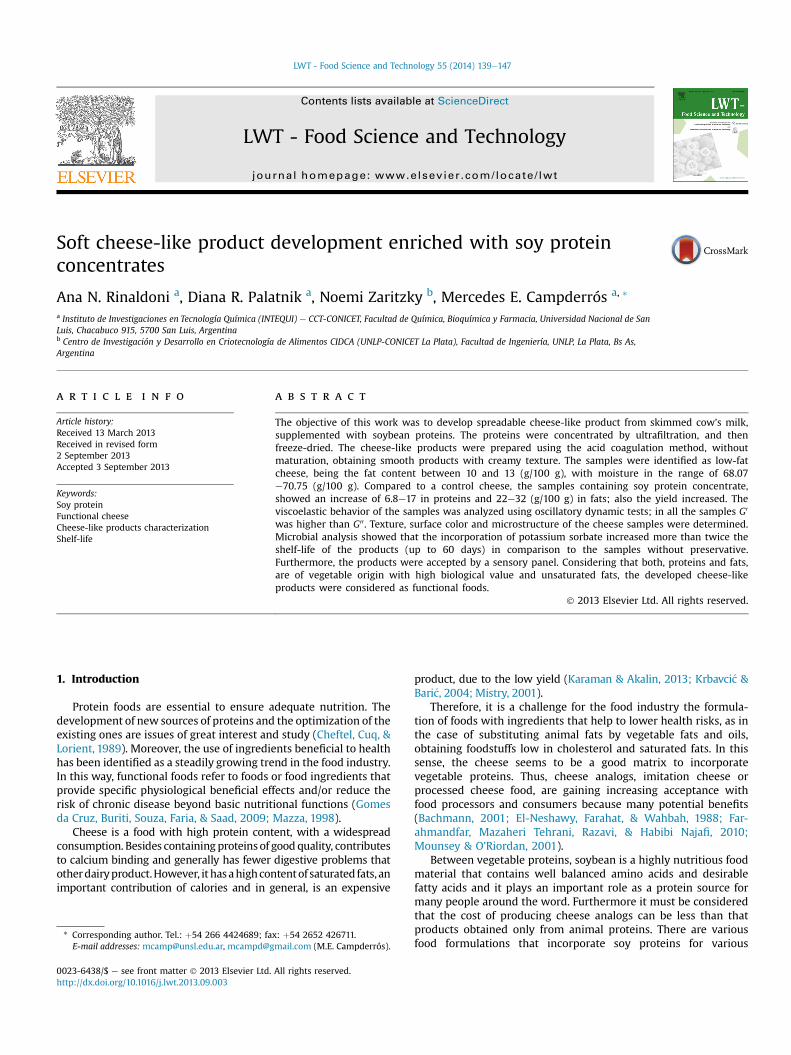
Pasteurized skim-milk
Citric acid CaCl2
Soy protein concentrate SPC
Acidification and flocculation pH = 5 ± 0.5
Removing the mass (draining)
Warming T = 85 ± 5 °C Homogenization
Mass weight
A.N. Rinaldoni et al. / LWT - Food Science and Technology 55 (2014) 139e147140
purposes, usually associated health benefits or employed soy tofortification milk products for ameliorates the problem of milkavailability (Canabady-Rochelle & Mellema, 2010; Che Man & Yee,1996; El-Neshawy et al., 1988; Farahmandfar et al., 2010; Kim,Park, & Rhee, 1992; Rani & Verma, 1995; Rinaldoni, Campderrós, &Pérez Padilla, 2012). Moreover there are a lot of dairy products thatshould be assessed in order to obtain novel products that can meetmarket needs, in terms of adequate protein content, nutritionalbenefits, production costs, higher availability and stability overtime. In this regard, the content of sorbic acid/sorbate as preser-vative in cheeses with high moisture has been studied(Brocklehurst & Lund, 1985).
The objectives of this study were to develop a cheese-likeproduct enriched with soy protein concentrate and to determinethe effect of the incorporation of vegetable proteins in the matrix ofa spread product with respect to physico-chemical and viscoelasticbehavior, texture, microstructure, sensory and preservation duringstorage.
The shelf life of the products was studied with and without theuse of sorbate as preservative and through pH, acidity, sensorial andmicrobiological assessments during storage.
Adding ingredients and additive: NaCl and potassium sorbate Mixing until creamy texture
PackingStorage - T = 4-8 ° C
Fig. 1. Flow diagram for manufacturing control cheese and cheese-like products withSPC.
2. Materials and methods
2.1. Raw materials
Partially skim-milk was provided by MILKAUT S.A (Argentina).The milk was pasteurized, homogenized and fortified with A and Dvitamins in the factory. Commercial soymilk (ADES, Argentina) wasused as source of soy protein. The soy milk was concentratedemploying membrane technology. A combination of microfiltrationwith a frontal filter polyethylene with a pore size of 5e10 mm (PallCorporation,USA)andultrafiltrationwith aPellicon cassettemodule(Millipore,USA) containingamodifiedpolysulfonemembraneswitha cut-off of 10 kDawas employed (Rinaldoni et al., 2012). Theprocesswas carried out in batch mode, by continuously removing thepermeate stream, at 25 � 2 �C and a transmembrane pressure of325 kPa. Temperature, recirculation rate, transmembrane pressure,pH and permeate flux rate were continuously recorded. The solidscontent was measured in the concentrate stream and the processwas stopped when the desired concentration was achieved. Thevolume concentration ratio (VCR) was 2.3, determined as reportedby Cheryan (1986) as the ratio between the initial feed volume andthe obtained concentrate volume. After each filtration the mem-brane was cleaned in-line according to instructions provided by themanufacturer. The membrane hydraulic permeability recuperationwasalways tested toverify that the cleaningprocedurewas correctlydone.
Then, the soy protein concentrates (SPC) were placed on stain-less steel trays and frozen in a freezer at �40 � 2 �C and freeze-dried using a lyophilizer (Rificor S.A., Argentina) at 1 bar of pres-sure for 48 h. The samples temperature was controlled by a tem-perature sensor. This procedure simplifies aseptic handling andenhances stability of dry powder, without excessive heating of theproduct (Fellows, 1994).
Table 1Chemical compositions and pH of raw materials (means � SD).
Material pH Protein (g/100 g) Fat (g/100 g
Cow Milk 6.88 � 0.02 3.5 � 0.08 2 � 0.18Soy Milk 7.02 � 0.05 3.2 � 0.05 1 � 0.12SPCa 8.82 � 0.03 43 � 0.10 17.5 � 0.2
a soy protein concentrate, freeze-dried by liophilization.
The composition of the raw materials is presented in Table 1.
2.2. Preparation of cheese-like product samples
Cheese-like product was prepared in batch according to themethod shown in Fig. 1. Each sample was made in duplicate in a 5 Lvat, and the volume of milk used each time was 2.5 L. One samplewas reserved as witness without the incorporation of soy proteinsconcentrate. Different amount of freeze-dried concentrate wereadded to the remaining samples.The powder addition was carriedout slowly, so that the protein aggregation stage is slower respect todenaturation, thus the partially unfolded protein chains can ori-ented more easily. This favors the formation of a homogeneous or-dered gel, with smooth consistency, strongly expanded, very elastic,transparent, and more stable to syneresis and bleeding (Cheftelet al., 1989). The amounts of soy protein concentrate incorporatedto milk were: 5, 10 and 15 g/L. The mixture was heated to 85 � 5 �Cand citric acid (40 g/100 mL) (Parafarm) were added until reach apH ¼ 5 � 0.5 (near the isoelectric point of both, milk and soy pro-teins) to produce acidification and proteins aggregation. Moreover,
) Sugar (g/L) Total solid (g/100 g) Ash (g/100 g)
50 � 0.3 10.3 � 0.10 0.7 � 0.0530 � 0.7 8.9 � 0.10 0.6 � 0.0810 � 0.9 97.78�0.15 7.1 � 0.10
A.N. Rinaldoni et al. / LWT - Food Science and Technology 55 (2014) 139e147 141
1 g of CaCl2 (BDH Chemicals Laboratory Reagents) was addedwhichcontributes to obtain a proper floc and the samples were allowed tostand at 65e75 �C, approximately 60 min. At this point, theappearance of white clouds on a yellow serum was observed. Thepreparation was poured onto a sieve covered with cheesecloth forthe drainage of whey, which was collected in a graduated cylinder.The curd was weighed and NaCl was added directly to the mass. Atthis stage, the sample was fractionated and a portion was set asidewithout addition of preservatives, while in the other fractions, po-tassium sorbatewas added as preservative (210� 20mg, dependingof sample weight, being always < 1000 mg/kg of product). Thesamples were then homogenized with a mixer until creamy. Next,the samples were transferred into sanitized plastic containers of100 g, weighed and stored in a frigorific chamber (Stesa, Argentina)with temperature and humidity controlled, until further analysis.
2.3. Physico-chemical analysis and yield evaluation
Raw materials, soy protein concentrate and cheese-like prod-ucts samples were analyzed in duplicate according to standardreplication AOAC (Association of Official Agricultural Chemists,1995) methods.
pH was measured using a digital pH-meter (Orion, USA) and adigital pH-meter (Testo 206-pH2) for viscoplastic substances.Titratable acidity was determined with 0.1 mol/L NaOH, expressedas lactic acid (AOAC 15004). The total protein contentwas calculatedby determination of total nitrogen by the Kjeldahl method using aDigestion Blocks and a semiautomatic Kjeldahl Distiller (Selecta,Spain), the conversion factor used to express the results was 6.38(AOAC 15017). The fat contentwasmeasured by the Rossee-Gottliebmethod (AOAC 15029). Total solids were determined by weightdifference, drying in an oven at 70� 1 �C during 24 h (AOAC 15016).For ash determination, samples were weighted into porcelain cru-cibles and incinerated in a muffle furnace (Indef, Argentina) with atemperature programmer to reach 520 �C (AOAC 945.46).
The determination of syneresis was carried out, after 24 h ofcold storage. The gels were stirred for 60 s on a platform andcentrifuged for 20 min at 5000 rpm in an ultracentrifuge (BeckmanUSA) at 4 �C (Aichinger et al., 2003). Syneresis, S (g/100 g) wascalculated as mass of serumm (serum) that had separated from thegel due to centrifugation, related to the total mass of gelm (gel) thatwas centrifuged:
S ¼ mðserumÞmðgelÞ � 100 (1)
The actual yield (Ya) reached in the cheese-like product pro-duction was calculated from the Equation (2):
Ya ¼ weight of productweight of milk
� 100 (2)
To eliminate differences associated with milk composition (fat,protein) or cheese moisture content, yield was also calculated asYafpam and Ymfpam using the formulas proposed by Guinee,O’Kennedy, and Kelly (2006).
Yafpam is the actual yield per 100 kg of cheese normalized toreference or control level of fat and protein and it was calculated asfollows:
Yafpam ¼ Ya x ðFrmþ PrmÞðFcmþ PcmÞ (3)
where Frm and Prm correspond to the percentages of fat and pro-tein in the reference or control cheese respectively; Fcm and Pcmare the actual fat and protein contents of the cheese-like products.
Ymafpam is the moisture adjusted cheese yield per 100 kg ofcheese milk adjusted to reference levels of fat and protein and itrepresents the ratio between the weight of cheese with a referencemoisture value (68.07 � 0.2%) and 100 kg of normalized cheesemilk. It was calculated as follows:
Ymafpam ¼ Yafpam x ð100�MAÞð100�MRÞ (4)
where MA and MR correspond to actual and reference moisture,respectively.
2.4. Determination of rheological parameters
The visco-elastic behavior of the samples was determined byoscillatory tests evaluating the elastic modulus G0 and the viscousmodulus G00 (Kealy, 2006). The tangent of phase shift or phase angle(tan d ¼ G00/G0) was also evaluated. All measurements were made induplicate at 20 �C in a Haake RS 800 oscillatory rheometer equip-ped with a temperature control sensor DC50 using parallel plates35mm (PP 35/S), with a gap between plates of 1.5 mm. The surfacesof both upper and lower plates were serrated to remove the pos-sibility of slip at the boundary.
First, stress sweep tests (0.01e1000 Pa) were performed todetermine the linear viscoelastic range at a constant frequency(1 Hz-6 28 rad s�1); these tests were carried out using the controlcheese samples and the cheese containing the highest concentra-tion of SPC added to select the maximum stress corresponding tothe linear viscoelastic range. The obtained value of 20 Pa wasmaintained in the frequency sweeps carried out in the range of 0.1e600 rad s�1 for all the tested samples.
In addition the apparent viscosity was measured with a rota-tional viscometer Haake (with a rotor 2) which has a shear rate of3750 s�1 at 15 � 0.5 �C.
2.5. Texture profile analysis
Instrumental texture profile analysis (TPA) of cheeses, controland with SPC, was performed on a TAXT2i Texture Analyzer (StableMicro Systems) using a load cell of 25 kg and a disc-shaped probe(45 mm of diameter). Testing was carried out after the samples hadbeen equilibrated to a standard temperature of 12 � 1 �C. Twoconsecutive compressions performed automatically at a test speedof 0.5 mm s�1 and compression ratio of 30%. The waiting timebetween one cycle and another was set at 5 s. From the force curveversus time, the following mechanical properties were determined(Kealy, 2006): hardness (N), adhesiveness (N), springiness, cohe-siveness and resilience.
2.6. Sensory analysis
The samples were tested at room temperature (22 � 2 �C), in auniformly illuminated room, by a 45-member panel selected from apool of students and staff members of our Department. One hourprior to the evaluations, top slice samples from randomly chosenpackages were transferred to closed plastic beakers. The sampleswere presented in a randomized order in plastic containers. Theaim was to compare the choice between more than two samplestherefore the method of ordering by preference was applied. Thesamples were coded with three-digit random numbers. Cookieswere provided for rinsing between samples, to cleanse the palate.The sensory attributes evaluated were color, flavor and spread-ability. Then statistical analysis was performed using the Friedmantest, which determines whether the sums of the total orders for
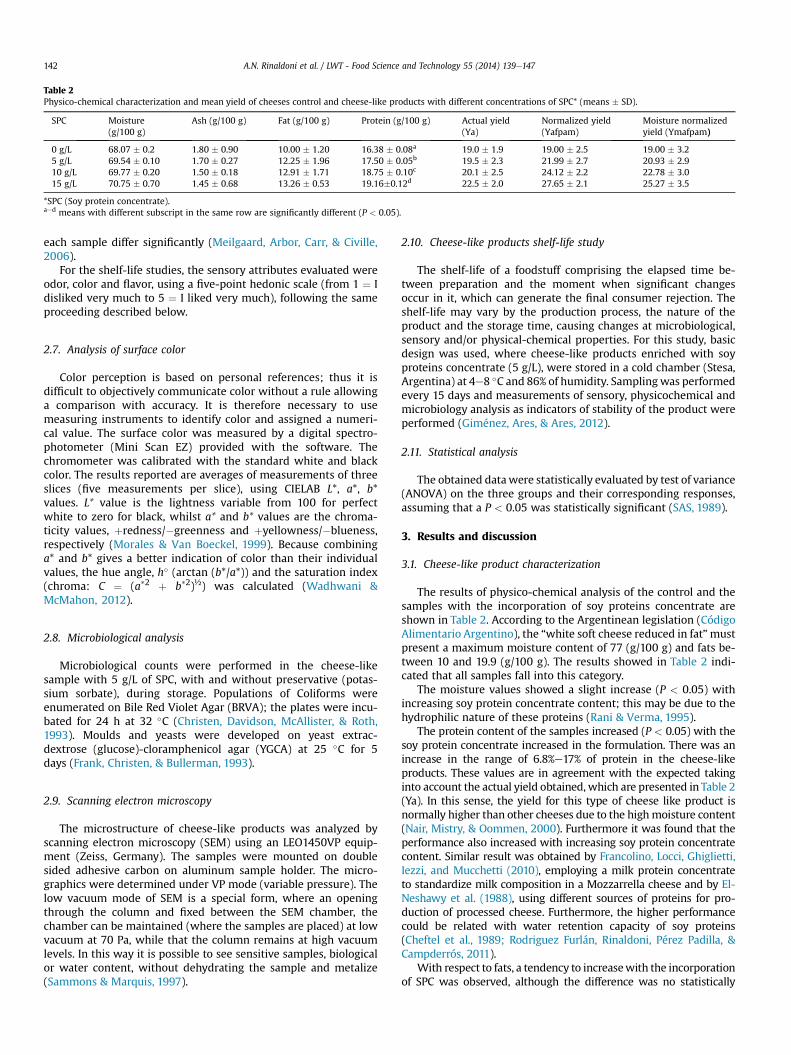
Table 2Physico-chemical characterization and mean yield of cheeses control and cheese-like products with different concentrations of SPC* (means � SD).
SPC Moisture(g/100 g)
Ash (g/100 g) Fat (g/100 g) Protein (g/100 g) Actual yield(Ya)
Normalized yield(Yafpam)
Moisture normalizedyield (Ymafpam)
0 g/L 68.07 � 0.2 1.80 � 0.90 10.00 � 1.20 16.38 � 0.08a 19.0 � 1.9 19.00 � 2.5 19.00 � 3.25 g/L 69.54 � 0.10 1.70 � 0.27 12.25 � 1.96 17.50 � 0.05b 19.5 � 2.3 21.99 � 2.7 20.93 � 2.910 g/L 69.77 � 0.20 1.50 � 0.18 12.91 � 1.71 18.75 � 0.10c 20.1 � 2.5 24.12 � 2.2 22.78 � 3.015 g/L 70.75 � 0.70 1.45 � 0.68 13.26 � 0.53 19.16�0.12d 22.5 � 2.0 27.65 � 2.1 25.27 � 3.5
*SPC (Soy protein concentrate).aed means with different subscript in the same row are significantly different (P < 0.05).
A.N. Rinaldoni et al. / LWT - Food Science and Technology 55 (2014) 139e147142
each sample differ significantly (Meilgaard, Arbor, Carr, & Civille,2006).
For the shelf-life studies, the sensory attributes evaluated wereodor, color and flavor, using a five-point hedonic scale (from 1 ¼ Idisliked very much to 5 ¼ I liked very much), following the sameproceeding described below.
2.7. Analysis of surface color
Color perception is based on personal references; thus it isdifficult to objectively communicate color without a rule allowinga comparison with accuracy. It is therefore necessary to usemeasuring instruments to identify color and assigned a numeri-cal value. The surface color was measured by a digital spectro-photometer (Mini Scan EZ) provided with the software. Thechromometer was calibrated with the standard white and blackcolor. The results reported are averages of measurements of threeslices (five measurements per slice), using CIELAB L*, a*, b*values. L* value is the lightness variable from 100 for perfectwhite to zero for black, whilst a* and b* values are the chroma-ticity values, þredness/�greenness and þyellowness/�blueness,respectively (Morales & Van Boeckel, 1999). Because combininga* and b* gives a better indication of color than their individualvalues, the hue angle, h� (arctan (b*/a*)) and the saturation index(chroma: C ¼ (a*2 þ b*2)½) was calculated (Wadhwani &McMahon, 2012).
2.8. Microbiological analysis
Microbiological counts were performed in the cheese-likesample with 5 g/L of SPC, with and without preservative (potas-sium sorbate), during storage. Populations of Coliforms wereenumerated on Bile Red Violet Agar (BRVA); the plates were incu-bated for 24 h at 32 �C (Christen, Davidson, McAllister, & Roth,1993). Moulds and yeasts were developed on yeast extrac-dextrose (glucose)-cloramphenicol agar (YGCA) at 25 �C for 5days (Frank, Christen, & Bullerman, 1993).
2.9. Scanning electron microscopy
The microstructure of cheese-like products was analyzed byscanning electron microscopy (SEM) using an LEO1450VP equip-ment (Zeiss, Germany). The samples were mounted on doublesided adhesive carbon on aluminum sample holder. The micro-graphics were determined under VP mode (variable pressure). Thelow vacuum mode of SEM is a special form, where an openingthrough the column and fixed between the SEM chamber, thechamber can be maintained (where the samples are placed) at lowvacuum at 70 Pa, while that the column remains at high vacuumlevels. In this way it is possible to see sensitive samples, biologicalor water content, without dehydrating the sample and metalize(Sammons & Marquis, 1997).
2.10. Cheese-like products shelf-life study
The shelf-life of a foodstuff comprising the elapsed time be-tween preparation and the moment when significant changesoccur in it, which can generate the final consumer rejection. Theshelf-life may vary by the production process, the nature of theproduct and the storage time, causing changes at microbiological,sensory and/or physical-chemical properties. For this study, basicdesign was used, where cheese-like products enriched with soyproteins concentrate (5 g/L), were stored in a cold chamber (Stesa,Argentina) at 4e8 �C and 86% of humidity. Samplingwas performedevery 15 days and measurements of sensory, physicochemical andmicrobiology analysis as indicators of stability of the product wereperformed (Giménez, Ares, & Ares, 2012).
2.11. Statistical analysis
The obtained datawere statistically evaluated by test of variance(ANOVA) on the three groups and their corresponding responses,assuming that a P < 0.05 was statistically significant (SAS, 1989).
3. Results and discussion
3.1. Cheese-like product characterization
The results of physico-chemical analysis of the control and thesamples with the incorporation of soy proteins concentrate areshown in Table 2. According to the Argentinean legislation (CódigoAlimentario Argentino), the “white soft cheese reduced in fat”mustpresent a maximum moisture content of 77 (g/100 g) and fats be-tween 10 and 19.9 (g/100 g). The results showed in Table 2 indi-cated that all samples fall into this category.
The moisture values showed a slight increase (P < 0.05) withincreasing soy protein concentrate content; this may be due to thehydrophilic nature of these proteins (Rani & Verma, 1995).
The protein content of the samples increased (P < 0.05) with thesoy protein concentrate increased in the formulation. There was anincrease in the range of 6.8%e17% of protein in the cheese-likeproducts. These values are in agreement with the expected takinginto account the actual yield obtained, which are presented in Table 2(Ya). In this sense, the yield for this type of cheese like product isnormally higher than other cheeses due to the highmoisture content(Nair, Mistry, & Oommen, 2000). Furthermore it was found that theperformance also increased with increasing soy protein concentratecontent. Similar result was obtained by Francolino, Locci, Ghiglietti,Iezzi, and Mucchetti (2010), employing a milk protein concentrateto standardize milk composition in a Mozzarrella cheese and by El-Neshawy et al. (1988), using different sources of proteins for pro-duction of processed cheese. Furthermore, the higher performancecould be related with water retention capacity of soy proteins(Cheftel et al., 1989; Rodriguez Furlán, Rinaldoni, Pérez Padilla, &Campderrós, 2011).
With respect to fats, a tendency to increasewith the incorporationof SPC was observed, although the difference was no statistically

Table 3Results of TPA of the samples.
SPC Hardness (N) Cohesiviness Springiness Adhesivness(N)
Resilience
0 g/L 18.83 � 1.05a 0.48 � 0.02a 0.92 � 0.10a �7.14 � 1.12a 0.10 � 0.01a
5 g/L 12.55 � 1,09b 0.52 � 0,06b,a 0.80 � 0.12a �5.02 � 1.30b 0.10 � 0.02a
10 g/L 8.48 � 1.22c 0.57 � 0.05b,c 0.91 � 0.09a �4.11 � 0.24b,c 0.09 � 0.01a
15 g/L 5.21 � 0.30d 0.63 � 0.04c 0.88 � 0.01a �2.40 � 0.18c 0.08 � 0.01a
aed means with different subscript in the same row are significantly different(P < 0.05).
A.N. Rinaldoni et al. / LWT - Food Science and Technology 55 (2014) 139e147 143
different. This result suggests that, fats incorporated inthepreparationare indeed retained in theflocmatrix. Here, it should be consider thatthemembrane treatment applied for soymilk concentration, allowedto concentrate proteins and fats by removing in the permeate streamthe soybeans anti-nutrient compounds (Ali, Ippersiel, Lamarche, &Mondor, 2010; Rinaldoni et al., 2012). These results demonstratedthat the cheese-like products obtained can be identified as functionalfoods, since both proteins and fats incorporated, are of vegetableorigin and present health benefits (Moon, Balasubramanian, & Rimal,2011). Indeed, the soybeans proteins have a high biological valuesimilar to those ofmeat, fish or eggs, and also are capable of loweringtriglyceride and cholesterol (total cholesterol, LDL-cholesterol andVLDL-cholesterol), (Bachmann, 2001; Genovese & Lajolo, 2002;Mattos et al., 2009). With respect to fats, soymilk basically containsessential polyunsaturated fatty acids, primarily linoleic, linolenic andarachidonic (Messina, Messina, & Setchel, 2002). Furthermore, theprotein content in the cheese-like products elaborated were higherthan the obtained by Che Man and Yee (1996) for a soybean spreadproduct but similar to the elaborated by Milesi, Candioti, and Hynes(2007) for a mini soft cheese milk, while with less fat content.
The ash content (Table 2) presented a slight decrease being notstatistically significant (P > 0.5). The values of pH and acidity werein average for the four samples 5.77 � 0.08 and 0.99 � 0.16respectively, showing no statistically significant difference.
3.2. Viscoelastic measurements
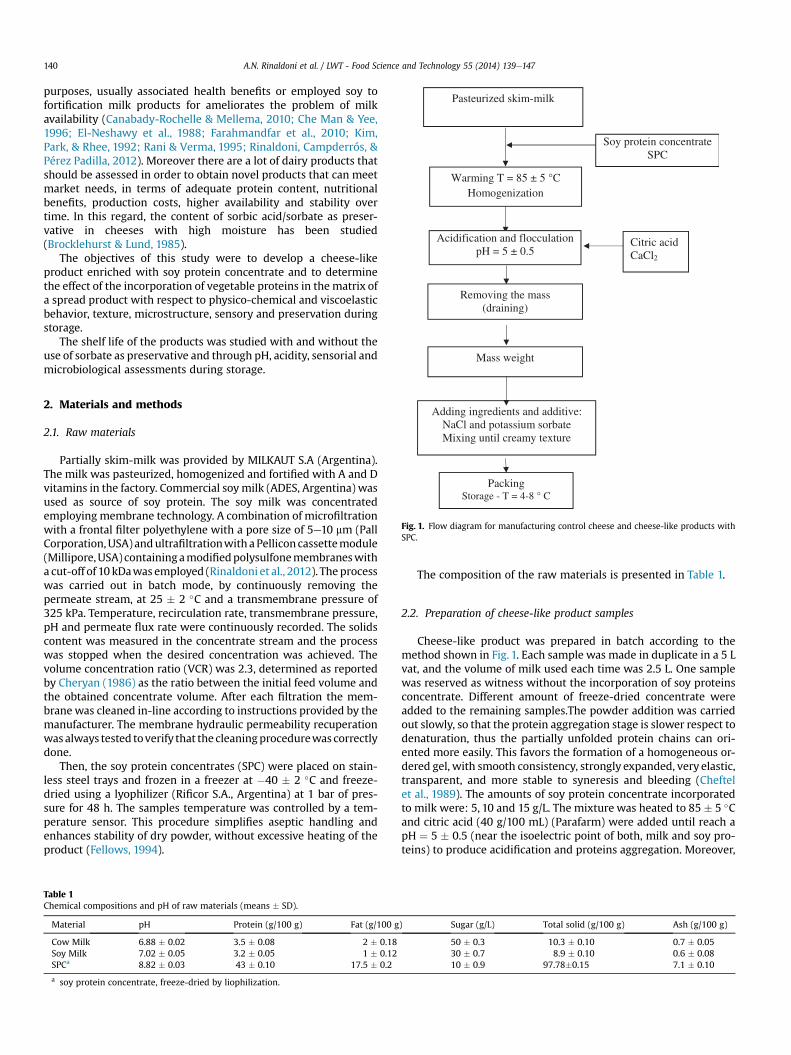
The data obtained through this type of dynamic (or oscillatory)measurements are the contributions to the internal structure of thesample from the elastic and viscous portions of flow, G0 and G00 (Pa),respectively. The measurements in the linear viscoelastic regioninvolve probing the structure of the sample in a non-destructivemanner (Kealy, 2006). The results are showed in Fig. 2. For allsamples tested was found that the value of G0 was above G00
(P < 0.01). This means that in the response of the samples, theelastic component predominated. Also, the significant differencebetween both moduli and the slight variation with the frequencyacross the whole range of frequencies studied, suggested a stronggel structure (González-Tomás, Bayarri, Taylor, & Costell, 2008).This result can be related with the low syneresis of the samples,even during storage (Table 5). The tan (d) values were: 0.27 for 0 g/LSPC, 0.26 for 5 g/L SPC, 0.26 for 10 g/L SPC and 0.27 for 15 g/L SPC.These values did not show significant differences (P < 0.01) andwere lower than 1.0, thus indicating that the elastic nature of thesamples matrix dominated over its viscous counterpart. Similar
Fig. 2. Viscoelastic moduli for the control cheese and cheese-like products, measuredat 12 � 1 �C. ( ) 0 g/L, (:) 5 g/L, (C) 10 g/L, (-) 15 g/L.
results were reported by Pereira, Franco, Gomes, and Malcata(2011) for cheeses manufactured from several milk sources.
The apparent viscosity values decreased significantly from130,000 � 5 mPas for the control cheese to 20,000 � 5 mPas (at15� 0.5 �C) for the higher amount of SPC added (15 g/L), this can beexplained considering the high water retention capacity of soyproteins (Cheftel et al.., 1989).
3.3. Texture
The data measured by the texture analyzer are presented inTable 3. The application of analysis of variance revealed no sig-nificant differences among the tested samples in the parametersspringiness and resilience. However, there were statistically sig-nificant differences (P < 0.05) for cohesiveness, adhesiveness andhardness being this last parameter the one that showed thelargest differences among the samples. Hardness of the samplesincreased with the decreasing concentration of SPC. This resultshould be related with the elastic modulus G0 (Fig. 2), since thehigher G0, greater is the energy required to deform it, suggestingthat harder is the material. Thus, the control cheese (SPC: 0 g/L)which had the higher hardness, was also the one with higher G0.Regarding the cohesiveness and adhesiveness, the major differ-ences were found between the control sample and samples withSPC. With respect to the elasticity (the ability of the samples hadto regain its original configuration after being removed off theforce responsible of the deformation), Table 3 shows that the foursamples studied have similar elasticity values. These resultscorrespond well with springiness values which do not presentstatically difference between the samples as for tan (d) values(P < 0.05).
3.4. Sensory assessment
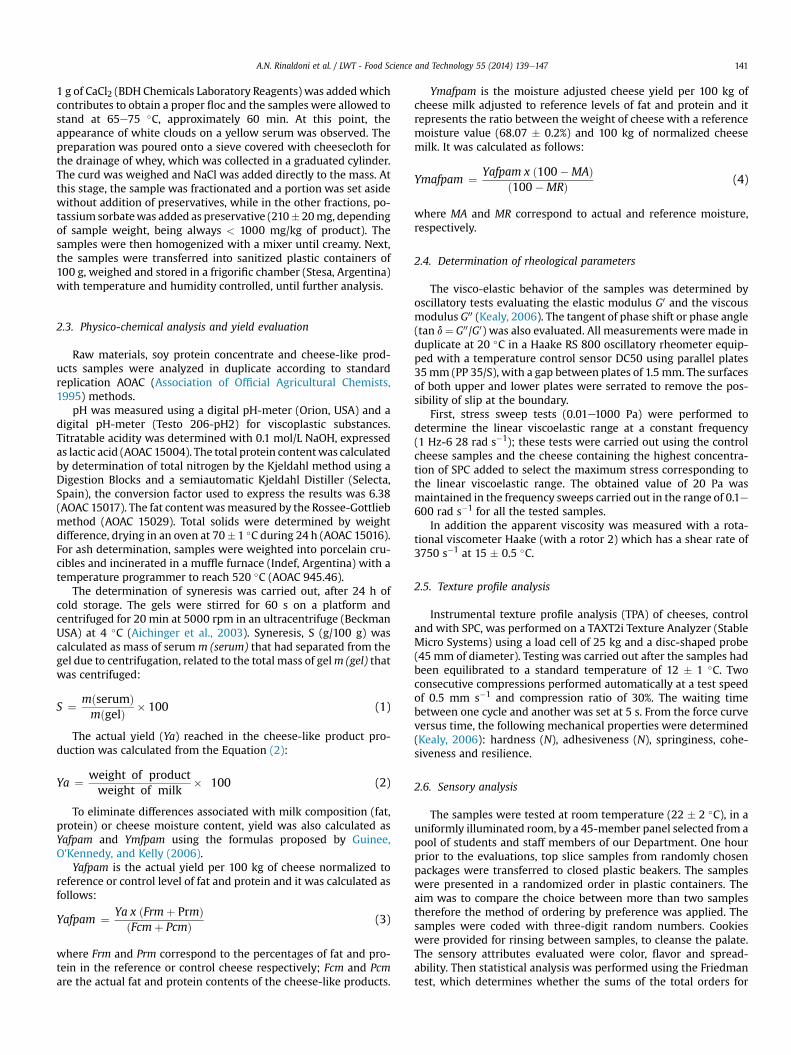
The assessment by untrained judges on samples enriched withsoy protein concentrate, considering the attributes of color, flavor,spreadability and overall acceptance, are shown in Fig. 3. Cheese-like products containing SPC and control products were almost
Fig. 3. Sensory analysis of cheese-like product. ( ) 5 g/L; ( ) 10 g/L; (-) 15 g/L.
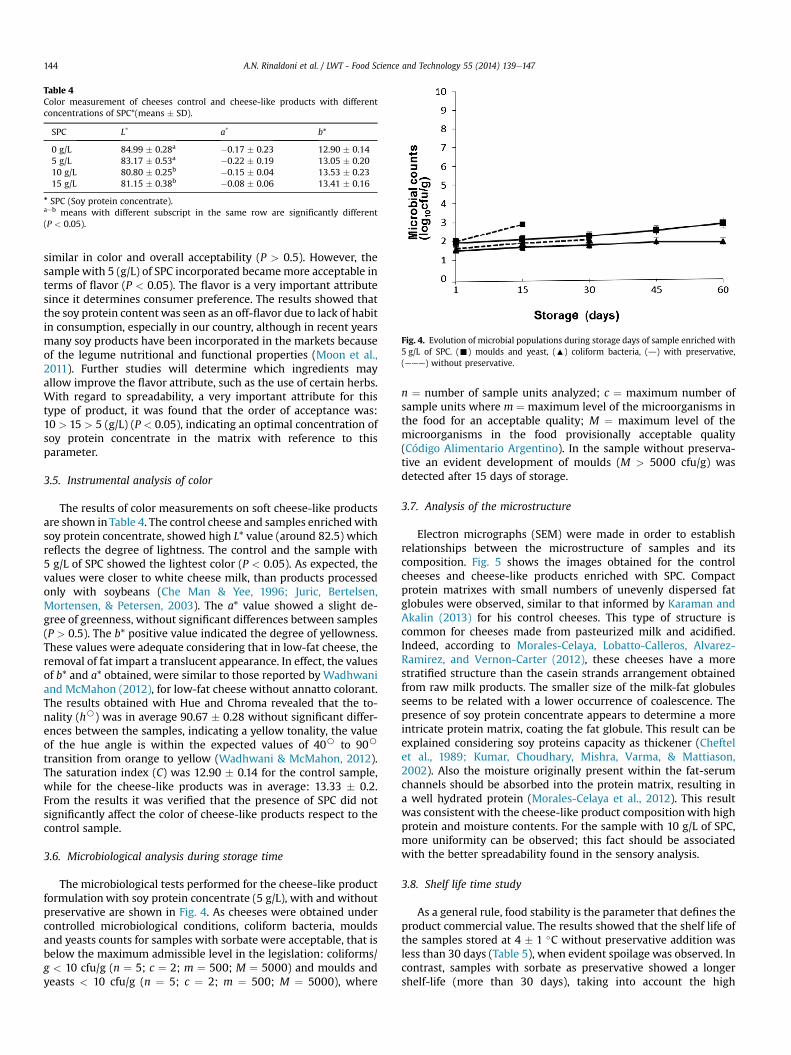
Table 4Color measurement of cheeses control and cheese-like products with differentconcentrations of SPC*(means � SD).
SPC L* a* b*
0 g/L 84.99 � 0.28a �0.17 � 0.23 12.90 � 0.145 g/L 83.17 � 0.53a �0.22 � 0.19 13.05 � 0.2010 g/L 80.80 � 0.25b �0.15 � 0.04 13.53 � 0.2315 g/L 81.15 � 0.38b �0.08 � 0.06 13.41 � 0.16
* SPC (Soy protein concentrate).aeb means with different subscript in the same row are significantly different(P < 0.05).
Fig. 4. Evolution of microbial populations during storage days of sample enriched with5 g/L of SPC. (-) moulds and yeast, (:) coliform bacteria, (d) with preservative,(———) without preservative.
A.N. Rinaldoni et al. / LWT - Food Science and Technology 55 (2014) 139e147144
similar in color and overall acceptability (P > 0.5). However, thesample with 5 (g/L) of SPC incorporated becamemore acceptable interms of flavor (P < 0.05). The flavor is a very important attributesince it determines consumer preference. The results showed thatthe soy protein content was seen as an off-flavor due to lack of habitin consumption, especially in our country, although in recent yearsmany soy products have been incorporated in the markets becauseof the legume nutritional and functional properties (Moon et al.,2011). Further studies will determine which ingredients mayallow improve the flavor attribute, such as the use of certain herbs.With regard to spreadability, a very important attribute for thistype of product, it was found that the order of acceptance was:10 > 15 > 5 (g/L) (P < 0.05), indicating an optimal concentration ofsoy protein concentrate in the matrix with reference to thisparameter.
3.5. Instrumental analysis of color
The results of color measurements on soft cheese-like productsare shown in Table 4. The control cheese and samples enrichedwithsoy protein concentrate, showed high L* value (around 82.5) whichreflects the degree of lightness. The control and the sample with5 g/L of SPC showed the lightest color (P < 0.05). As expected, thevalues were closer to white cheese milk, than products processedonly with soybeans (Che Man & Yee, 1996; Juric, Bertelsen,Mortensen, & Petersen, 2003). The a* value showed a slight de-gree of greenness, without significant differences between samples(P > 0.5). The b* positive value indicated the degree of yellowness.These values were adequate considering that in low-fat cheese, theremoval of fat impart a translucent appearance. In effect, the valuesof b* and a* obtained, were similar to those reported by Wadhwaniand McMahon (2012), for low-fat cheese without annatto colorant.The results obtained with Hue and Chroma revealed that the to-nality (hB) was in average 90.67 � 0.28 without significant differ-ences between the samples, indicating a yellow tonality, the valueof the hue angle is within the expected values of 40B to 90B
transition from orange to yellow (Wadhwani & McMahon, 2012).The saturation index (C) was 12.90 � 0.14 for the control sample,while for the cheese-like products was in average: 13.33 � 0.2.From the results it was verified that the presence of SPC did notsignificantly affect the color of cheese-like products respect to thecontrol sample.
3.6. Microbiological analysis during storage time
The microbiological tests performed for the cheese-like productformulation with soy protein concentrate (5 g/L), with and withoutpreservative are shown in Fig. 4. As cheeses were obtained undercontrolled microbiological conditions, coliform bacteria, mouldsand yeasts counts for samples with sorbate were acceptable, that isbelow the maximum admissible level in the legislation: coliforms/g < 10 cfu/g (n ¼ 5; c ¼ 2; m ¼ 500; M ¼ 5000) and moulds andyeasts < 10 cfu/g (n ¼ 5; c ¼ 2; m ¼ 500; M ¼ 5000), where
n ¼ number of sample units analyzed; c ¼ maximum number ofsample units where m ¼ maximum level of the microorganisms inthe food for an acceptable quality; M ¼ maximum level of themicroorganisms in the food provisionally acceptable quality(Código Alimentario Argentino). In the sample without preserva-tive an evident development of moulds (M > 5000 cfu/g) wasdetected after 15 days of storage.
3.7. Analysis of the microstructure
Electron micrographs (SEM) were made in order to establishrelationships between the microstructure of samples and itscomposition. Fig. 5 shows the images obtained for the controlcheeses and cheese-like products enriched with SPC. Compactprotein matrixes with small numbers of unevenly dispersed fatglobules were observed, similar to that informed by Karaman andAkalin (2013) for his control cheeses. This type of structure iscommon for cheeses made from pasteurized milk and acidified.Indeed, according to Morales-Celaya, Lobatto-Calleros, Alvarez-Ramirez, and Vernon-Carter (2012), these cheeses have a morestratified structure than the casein strands arrangement obtainedfrom raw milk products. The smaller size of the milk-fat globulesseems to be related with a lower occurrence of coalescence. Thepresence of soy protein concentrate appears to determine a moreintricate protein matrix, coating the fat globule. This result can beexplained considering soy proteins capacity as thickener (Cheftelet al., 1989; Kumar, Choudhary, Mishra, Varma, & Mattiason,2002). Also the moisture originally present within the fat-serumchannels should be absorbed into the protein matrix, resulting ina well hydrated protein (Morales-Celaya et al., 2012). This resultwas consistent with the cheese-like product compositionwith highprotein and moisture contents. For the sample with 10 g/L of SPC,more uniformity can be observed; this fact should be associatedwith the better spreadability found in the sensory analysis.
3.8. Shelf life time study
As a general rule, food stability is the parameter that defines theproduct commercial value. The results showed that the shelf life ofthe samples stored at 4 � 1 �C without preservative addition wasless than 30 days (Table 5), when evident spoilage was observed. Incontrast, samples with sorbate as preservative showed a longershelf-life (more than 30 days), taking into account the high

Fig. 5. SEM images of cheese control and cheese-like products. Magnification 200�.
A.N. Rinaldoni et al. / LWT - Food Science and Technology 55 (2014) 139e147 145
humidity content of these products. So, this additive acted as wasexpected, being an effective preservative against moulds andyeasts, with some effectiveness against bacteria in agreement withreports of Brocklehurst and Lund (1985). Besides, the preservativeactivity is directly linked to changes in pH, and it was found thatthis parameter showed slight changes during storage. In effect,minor variations in pH and acidity, may be related to amino acidsand free fatty acids being produced during proteolysis and lipolysis,respectively (Dermiki, Ntzimani, Badeka, Savvaidis, & Kontominas,2008). The fat content increased during the first 45 days and thendecreased (P < 0.05), indicating physical changes. In this sense, El-Neshawy et al. (1988) reported slight increase in fat content ofcheese from the different blends during storage.
The syneresis increased during storage (P< 0.05), however eventhe highest value obtained (11.3 � 0.5 g/100 g), was acceptable forthese products. The low syneresis values obtained could be related
Table 5Effects of incorporation of a preservative on physico-chemical and sensorial parameters
Storage (days) 1 15
Sample Withoutpreservative
With preservative Withoutpreservative
With preserva
pH 5.7 � 0.03 5.7 � 0.01 5.67 � 0.02 5.68 � 0.03
Acidity (g/100 g) 0.94 � 0.3 0.92 � 0.1 0.98 � 0.1 0.97 � 0.2Syneresis (g/100 g) 4.64 � 0.3 4.70 � 0.5 5.69 � 0.2 4.70 � 0.3Fat (g/100 g) 12.33 � 0.03 12.27 � 0.05 12.42 � 0.03 12.44 � 0.02Odor 4.02 � 0.23 4.01 � 0.18 4.02 � 0.19 4.00 � 0.12Flavor 3.01 � 0.52 3.00 � 0.29 3.00 � 0.37 3.73 � 0.21Color 3.12 � 0.39 3.20 � 1.26 3.42 � 1.42 3.30 � 0.90
a M > 5000 cfu/g.
to the cheese making process and the composition of the product.In effect, the brief thermal treatment, the pH of the products (z5.7)with minor changes during storage and the high protein content,make a firmer gel with low syneresis production (Fox & Cogan,2004). This result was consistent with the rheological character-ization and SEM images, which showed a compact structure.Furthermore, the reduced fat samples also favors the stability of gel(Mateo et al., 2009).
There were non-significant difference in terms of odor and colorduring the storage, this means that the chemical changes produced,cannot be perceived by the panelists. However it was found that theflavor softens during storage, resulting the products more agree-able, as can be seen in the flavor score increase with the storagetime (Table 5). Similar results were reported in processed cheesefood enrichedwith vegetable andwhey proteins (El-Neshawy et al.,1988).
of cheese-like products (SPC: 5 g/L) during storage (T ¼ 4 � 1 �C), (means � SD).
30 45 60
tive Withoutpreservative
With preservative With preservative With preservative
Developmentof moldsa
5.61 � 0.01 5.55 � 0.05 5.55 � 0.05
1.01 � 0.2 1.15 � 0.2 1.15 � 0.25.7 � 0.3 11.30 � 0.5 11.30 � 0.5
14.7 � 0.07 11.5 � 0.06 11.5 � 0.064.10 � 0.62 4.03 � 0.59 4.00 � 1.104.01 � 0.28 4.05 � 0.15 4.00 � 1.523.25 � 1.05 3.12 � 0.75 3.15 � 1.21
A.N. Rinaldoni et al. / LWT - Food Science and Technology 55 (2014) 139e147146
4. Conclusions
Spreadeable reduced fat cheese-like products were developedfrom partially skimmed cow’s milk with the addition of soy proteinconcentrate (SPC). It was established that cheese-like product for-mulationshadhigherprotein contentwith the increaseof SPCcontent(P < 0.05) confirming that part of the soy proteins remained into thecasein matrix, also the fat content increase to 22%, respect to controlcheese. However the products are classified as reduced in fat (CAA).
The values of normalized yields, that eliminated differencesassociated with milk composition (fat, protein) and cheese mois-ture, were significantly higher (P < 0.01) for cheese-like productswith SPC than for control ones, and this confirmed that the additionof soy protein concentrate improved the cheese yield. The rheo-logical characteristics of the samples revealed that G0 > G00 indi-cating that the elastic properties dominated over the viscous ones,in a typical solid like behavior. The texture analysis showed thehighest significant differences in the values of hardness; theincrement in the SPC content showed a decrease in hardness, inagreement with the results of the apparent viscosity. These resultsshould be associated with the higher moisture content, in samplescontaining soy proteins.
The SEM micrographs showed compact proteins matrixes withdispersed fat globules. The greater homogeneity of the sample withSPC 10 g/L, was correlated with a better spreadability (P < 0.05),found in the sensory analysis.
From measurements of microbial counts, pH, syneresis, fat andsensory evaluation, it was observed that the storage life of thecheese-like product without the addition of potassium sorbate inthe formulation, was less than 30 days. In contrast, the formulatedsamples containing the preservative (in amounts below the limitsestablished by legislation) exhibited a storage life higher than 60days.
The products were considered as functional, since the addedprotein source was of vegetable origin with high biological value,because of the high content of amino acids and essential fattyacids. Other physicochemical parameters such as pH, ash content,and especially, sensory attributes did not show significantly dif-ferences between the soy formulated samples and the controlones, indicating that the amount of added soy protein concentrateis sufficient to enrich the cheese matrix, without adverselyaffecting physicochemical properties, sensory quality or productstability.
Acknowledgments
Financial support provided by the SCyT, UNSL (Project 22Q/011)and fellowships of Eng. Palatnik Diana of the CONICET are gratefullyacknowledged. The assistance of Dr. Gabriel Lorenzo of the CIDCAInstitute, (University of La Plata-CONICET) in the rheological char-acterization and texture analysis of the samples is gratefullyacknowledged.
References*
AOAC (Association of Official Agricultural Chemists). (1995) (16th ed.).. Officialmethods of analysis (Vol. II) Arlington: AOAC International.
Aichinger, P. A., Servais, M. M., Dillmann, C., Rouveet, M. L., D`Amico, M., & Zink, N.(2003). Fermentation of a skim concentrate with Streptococcus thermophilus
* References indicate previous works showing that underlie the different topicscovered in this paper: e a clarifier review of cheese analogs; e food proteins,particularly soy proteins properties; e properties and behavior of a soybeanspreads; e soft cheese processing, development and characterization; e use ofmembrane technology for protein concentrates.
and chymosin: structure, viscoelasticity and syneresis of gels. Colloids andSurface B Biointerfaces, 31, 243e255.
Ali, F., Ippersiel, D., Lamarche, F., & Mondor, M. (2010). Characterization of low-phytate soy protein isolates produced by membrane technologies. InnovativeFood Science and Emerging Technologies, 11, 162e168.
*Bachmann, H. P. (2001). Cheese analogues: a review. International Dairy Journal, 11,505e515.
Brocklehurst, T. F., & Lund, B. M. (1985). Microbiological changes in cottage cheesevarieties during storage at þ7�C. Food Microbiology, 2, 207e233.
Canabady-Rochelle, L. S., & Mellema, M. (2010). Physical-chemical comparisonof cow’s milk proteins versus soy proteins in their calcium-binding ca-pacities. Colloids and Surfaces A: Physicochemical and Engineering Aspects,366, 110e112.
*Che Man, Y. B., & Yee, Y. N. (1996). Development and properties of soybean spreads.Journal of Food Processing and Preservation, 20, 347e358.
*Cheftel, J. C., Cuq, J. L., & Lorient, D. (1989). In Acribia (Ed.), Proteínas Alimentarias.Zaragoza, España.
Cheryan, M. (1986). Ultrafiltration handbook. USA: Technomic Publishing Co.Christen, G. L., Davidson, P. M., McAllister, J. S., & Roth, L. A. (1993). Coliform and
other indicator bacteria. In R. T. Marshal (Ed.), Standard methods for the exam-ination of dairy products (pp. 247e269). Washington, DC: American PublicHealth Association Inc.
Código Alimentario Argentino, Administración Nacional de Alimentos, Medi-camentos y Tecnología Médica Capítulo VIII (Alimentos Lácteos). http://www.anmat.gov.ar/alimentos/codigoa/CAPITULO_VIII.pdf.
Dermiki, M., Ntzimani, A., Badeka, A., Savvaidis, I. N., & Kontominas, M. G. (2008).Shelf-life extension and quality attributes of the whey cheese “Myzithra Kala-thaki” using modified atmosphere packaging. LWT e Food Science and Tech-nology, 41, 284e294.
El-Neshawy, A. A., Farahat, S. M., & Wahbah, H. A. (1988). Production of processedcheese food enriched with vegetable and whey proteins. Food Chemistry, 28,245e255.
Farahmandfar, R., Mazaheri Tehrani, M., Razavi, S. M. A., & Habibi Najafi, M. B.(2010). Effect of soy cheese and trisodium citrate on pizza cheese. InternationalJournal of Food Engineering, 6. http://dx.doi.org/10.2202/1556e3758.1777.Article 2.
Fellows, P. (1994). Zaragoza. España. In S. A. Acribia (Ed.), Tecnología del procesado dealimentos: Principios y Prácticas.
Fox, P. F., & Cogan, T. M. (2004). Factors that affect the quality of cheese. In P. F. Fox,P. L. H. Mc. Sweeney, T. M. Cogan, & T. P. Guinee (Eds.), Cheese: Chemistry, physicsand microbiology (pp. 595). London: Elsevier Academic Press.
Francolino, S., Locci, F., Ghiglietti, R., Iezzi, R., & Mucchetti, G. (2010). Use of milkprotein concentrate to standardize milk composition in Italian citric Mozzarellacheese making. LWT- Food Science and Technology, 43, 310e314.
Frank, J., Christen, G., & Bullerman, L. (1993). Tests for groups of microorganisms. InR. T. Marshal (Ed.), Standard methods for the examination of dairy products (pp.271e283). Washington, DC: American Public Health Association Inc.
Genovese, M., & Lajolo, F. (2002). Isoflavones in soy-based foods consumed in Brazil:levels, distribution, and estimated intake. Journal of Agricultural and FoodChemistry, 50, 5987e5993.
Giménez, A., Ares, F., & Ares, G. (2012). Sensory shelf-life estimation: a review ofcurrent methodological approaches. Food Research International, 49, 311e325.
Gomes da Cruz, A., Buriti, F. C. A., Souza, C. H. B., Faria, J. A. F., & Saad, S. M. I. (2009).Probiotic Cheese: health benefits, technological and stability aspects. Trends inFood Science &Technology, 20, 344e354.
González-Tomás, L., Bayarri, S., Taylor, A. J., & Costell, E. (2008). Rheology, flavourrelease and perception of low-fat dairy desserts. International Dairy Journal, 18,858e866.
Guinee, T. P., O’Kennedy, B. T., & Kelly, P. M. (2006). Effect of milk protein stan-dardization using different methods on the composition and yields of Cheddarcheese. Journal of Dairy Science, 89, 468e482.
Juric, M., Bertelsen, G., Mortensen, G., & Petersen, M. A. (2003). Light-induced colourand aroma changes in sliced, modified atmosphere packaged semi-hardcheeses. International Dairy Journal, 13, 239e249.
Karaman, A. D., & Akalin, A. S. (2013). Improving quality characteristics of reducedand low fat Turkish white cheeses using homogenized cream. LWT e FoodScience and Technology, 50, 503e510.
Kealy, T. (2006). Application of liquid and solid rheological technologies to thetextural characterization of semi-solid foods. Food Research International, 39,265e276.
Kim, S. Y., Park, P. S. W., & Rhee, K. C. (1992). Textural properties of cheese analogscontaining proteolytic enzyme- modified soy protein isolates. Journal of theAmerican Oil Chemists’ Society, 69, 755e759.
Krbavci�c, I. P., & Bari�c, I. C. (2004). Influence of deep fat frying on some nutritionalparameters of novel food based on mushrooms and fresh soft cheese. FoodChemistry, 84, 417e419.
Kumar, R., Choudhary, V., Mishra, S., Varma, I. K., & Mattiason, B. (2002). Adhesivesand plastics based on soy protein products. Industrial Crops and Products, 16,155e172.
Mateo, M. J., Everard, C. D., Fagan, C. C., O’Donnell, C. P., Castillo, M., Payne, F. A., et al.(2009). Effect of milk fat concentration and gel firmness on syneresis duringcurd stirring in cheese-making. International Dairy Journal, 19, 264e268.
Mattos, A. P., Ribeiro, T. C. M., Mendes, P. S. A., Valois, S. S., Mendes, C. M. C., &Ribeiro, , Jr.. (2009). Comparison of yogurt, soybean, casein, and amino acid-baseddiets in childrenwith persistent diarrhea. Nutrition Research, 29, 462e469.
A.N. Rinaldoni et al. / LWT - Food Science and Technology 55 (2014) 139e147 147
Mazza, G. (1998). In S. A. Acribia (Ed.), Alimentos funcionales. Aspectos bioquímicos yde procesado. Zaragoza España.
Meilgaard, M. C., Arbor, A., Carr, T., & Civille, G. V. (2006). Sensory evaluation tech-niques (4th ed.). New Jersey, USA: CRC Press.
*Messina, M., Messina, V., & Setchel, K..,D. R. (2002). In Amalevi (Ed.), Beneficios de lasoja para la salud. ASGA: Asociación Argentina de Grasas y Aceites. Mza,Argentina.
Milesi, M. M., Candioti, M., & Hynes, E. (2007). Mini soft cheese as a simple modelfor biochemical studies on cheese-making and ripening. LWT e Food Science andTechnology, 40, 1427e1433.
Mistry, V. V. (2001). Low fat cheese technology. International Dairy Journal,11, 413e422.Moon, W., Balasubramanian, S. K., & Rimal, A. (2011). Health claims and con-
sumers’ behavioral intentions: the case of soy-based food. Food Policy, 36,480e489.
Morales-Celaya, M. F., Lobatto-Calleros, C., Alvarez-Ramirez, J., & Vernon-Carter, E. J.(2012). Effect of milk pasteurization and acidification method on the chemicalcomposition and microestructure of a Mexican pasta filata cheese. LWT e FoodScience and Technology, 45, 132e141.
Morales, F. J., & Van Boeckel, M. A. J. S. (1999). A study on advanced Maillard re-action in heated casein/sugar solutions: colour formation. International DairyJournal, 8, 907e915.
Mounsey, J. S., & O’Riordan, E. D. (2001). Characteristic of imitation cheese con-taining native starches. Journal of Food Science, 66(4), 586e591.
Nair, M. G., Mistry, V. V., & Oommen, B. S. (2000). Yield and functionality of Cheddarcheese as influenced by homogenization of cream. International Dairy Journal,10, 647e657.
Pereira, C. I., Franco, M. I., Gomes, A. M. I., & Malcata, F. X. (2011). Microbiological,rheological and sensory characterization of Portuguese model cheeses manu-factured from several milk sources. LWT e Food Science and Technology, 44,2244e2252.
Rani, M., & Verma, N. S. (1995). Changes in organoleptic quality during ripening ofcheese made from cows and soya milk blends, using microbial rennet. FoodChemistry, 54(4), 369e375.
*Rinaldoni, A. N., Campderrós, M. E., & Pérez Padilla, A. (2012). Physico-chemicaland sensory properties of yogurt from ultrafiltreted soy milk concentrate addedwith inulin. LWT e Food Science and Technology, 45, 142e147.
Rodriguez Furlán, L. T., Rinaldoni, A. N., Pérez Padilla, A., & Campderrós, M. E. (2011).Assessment of functional properties of bovine plasma proteins compared withother protein concentrates, application in a Hamburger formulation. AmericanJournal of Food Technology, 6(9), 717e729.
Sammons, R., & Marquis, P. (1997). Application of the low vacuum scanning electronmicroscope to the study of biomaterials and mammalian cells. Biomaterials, 18,81e86.
SAS USER. (1989). GUIDE: Statistic version. Cary, NC, USA: SAS Inst. Inc.Wadhwani, R., & McMahon, D. J. (2012). Color of low-fat cheese influences flavor
perception and consumer liking. Journal of Dairy Science, 95, 2336e2346.


![[2009][02] Innovative Ship Designocw.snu.ac.kr/sites/default/files/NOTE/5630.pdf · (2.2) lwt l b d ∝⋅⋅ lwt c l b d = ⋅⋅ lwt, c. lwt. 는기준선으로부터구함. 따라서식](https://img.pdfslide.us/doc/110x75/5f14c77f54d1951d6c5d9203/200902-innovative-ship-22-lwt-l-b-d-aaa-lwt-c-l-b-d-aa-lwt-c.jpg)