Embed Size (px)
Citation preview
LUZHOU BIO-CHEM TECHNOLOGY LIMITED
Corporate Presentation
and 3QFY19 Results
13 November, 2019
A Mouth-Watering China Consumption Story
2
Business Overview
Financial Highlights
Growth Strategies
Contents

3
Business Overview
4
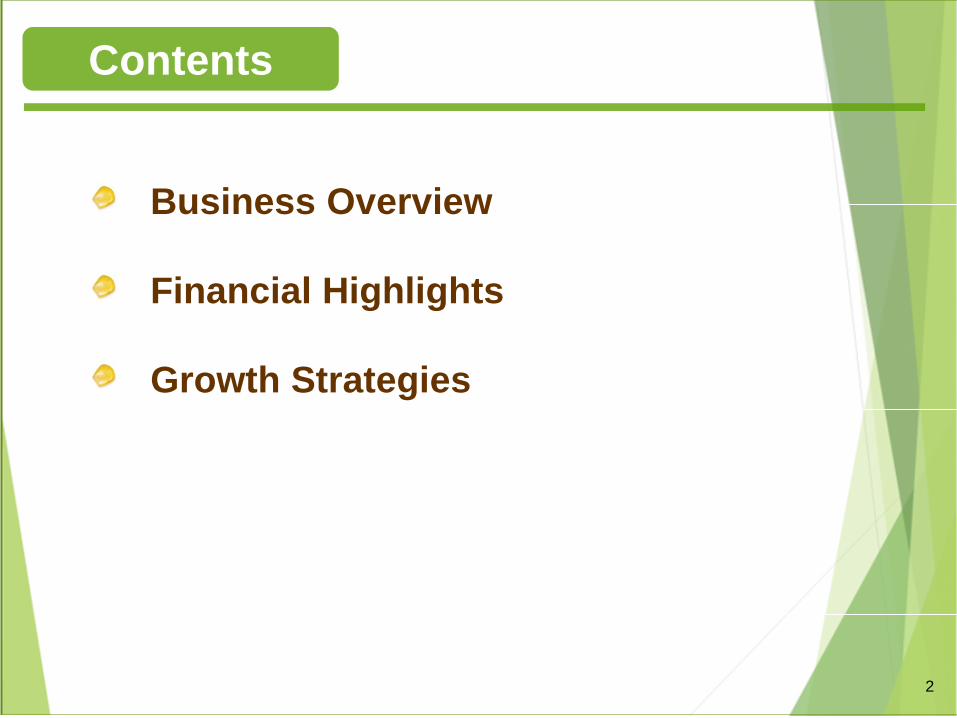
Operating Climate
China economy has been slowing down rather significantly, affected
by the weakening of the domestic economy and the external trade
tensions with the United States and overall global slowdown.
The Group continues to face with poor domestic demand of its
products, coupled with the increase in the average raw corn material
prices, the Group’s revenue and gross profit margin have been
affected.
The Group has resumed the production of its Liaoning plant since
early Nov 2019 because of recent favorable local market conditions.
Due to the uncertainty of the market, the Group is of the opinion that
it will continue to face with challenging conditions moving forward.
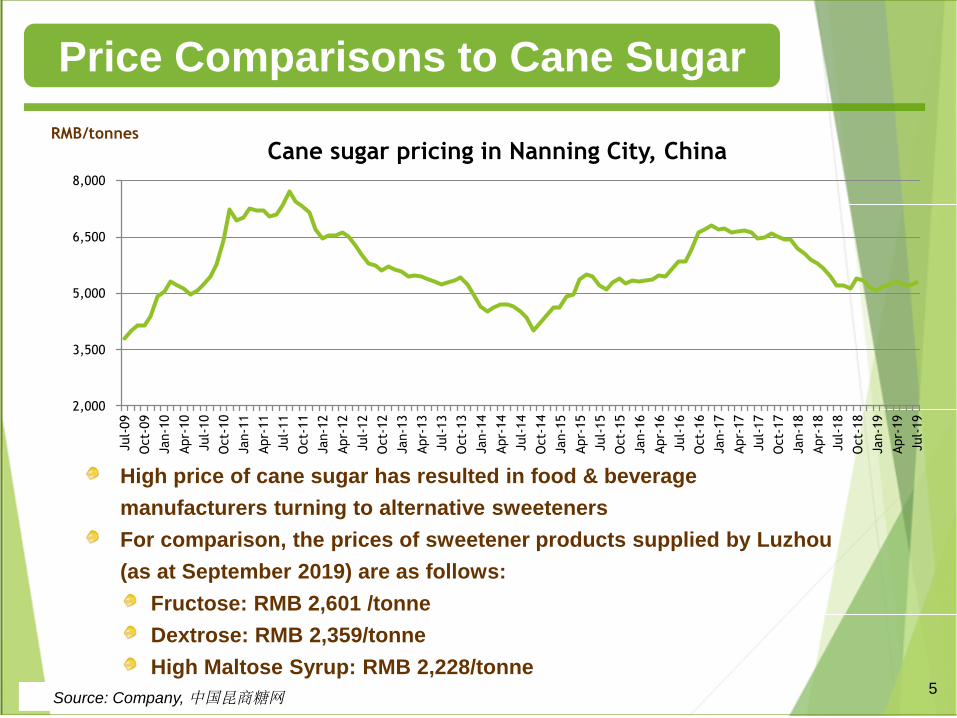
High price of cane sugar has resulted in food & beverage
manufacturers turning to alternative sweeteners
For comparison, the prices of sweetener products supplied by Luzhou
(as at September 2019) are as follows:
Fructose: RMB 2,601 /tonne
Dextrose: RMB 2,359/tonne
High Maltose Syrup: RMB 2,228/tonne 5
Price Comparisons to Cane Sugar
Source: Company, 中国昆商糖网
RMB/tonnes
2,000
3,500
5,000
6,500
8,000
Jul-
09
Oct
-09
Jan-1
0
Apr-
10
Jul-
10
Oct
-10
Jan-1
1
Apr-
11
Jul-
11
Oct
-11
Jan-1
2
Apr-
12
Jul-
12
Oct
-12
Jan-1
3
Apr-
13
Jul-
13
Oct
-13
Jan-1
4
Apr-
14
Jul-
14
Oct
-14
Jan-1
5
Apr-
15
Jul-
15
Oct
-15
Jan-1
6
Apr-
16
Jul-
16
Oct
-16
Jan-1
7
Apr-
17
Jul-
17
Oct
-17
Jan-1
8
Apr-
18
Jul-
18
Oct
-18
Jan-1
9
Apr-
19
Jul-
19
Cane sugar pricing in Nanning City, China

2,384
1,577 1,756
1,000
1,200
1,400
1,600
1,800
2,000
2,200
2,400
2,600
2,800
3,000
Oct-17
Nov-17
Dec-17
Jan-18
Feb-18
Mar-18
Apr-18
May-18
Jun-18
Jul-18
Aug-18
Sep-18
Oct-18
Nov-18
Dec-18
Jan-19
Feb-19
Mar-19
Apr-19
May-19
Jun-19
Jul-19
Aug-19
Sep-19
Corn Sweetener Corn Starch By-Products Corn
6
RMB/tonnes (excluding taxes)
Price Trends
Source: Company
7
Financial Highlights
8
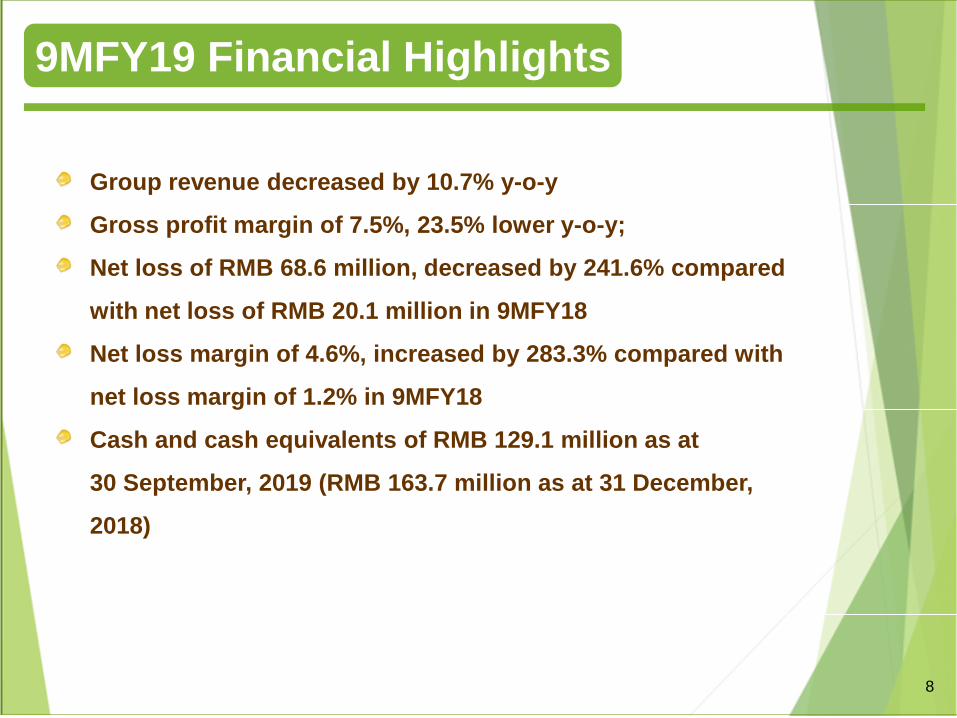
9MFY19 Financial Highlights
Group revenue decreased by 10.7% y-o-y
Gross profit margin of 7.5%, 23.5% lower y-o-y;
Net loss of RMB 68.6 million, decreased by 241.6% compared
with net loss of RMB 20.1 million in 9MFY18
Net loss margin of 4.6%, increased by 283.3% compared with
net loss margin of 1.2% in 9MFY18
Cash and cash equivalents of RMB 129.1 million as at
30 September, 2019 (RMB 163.7 million as at 31 December,
2018)
9
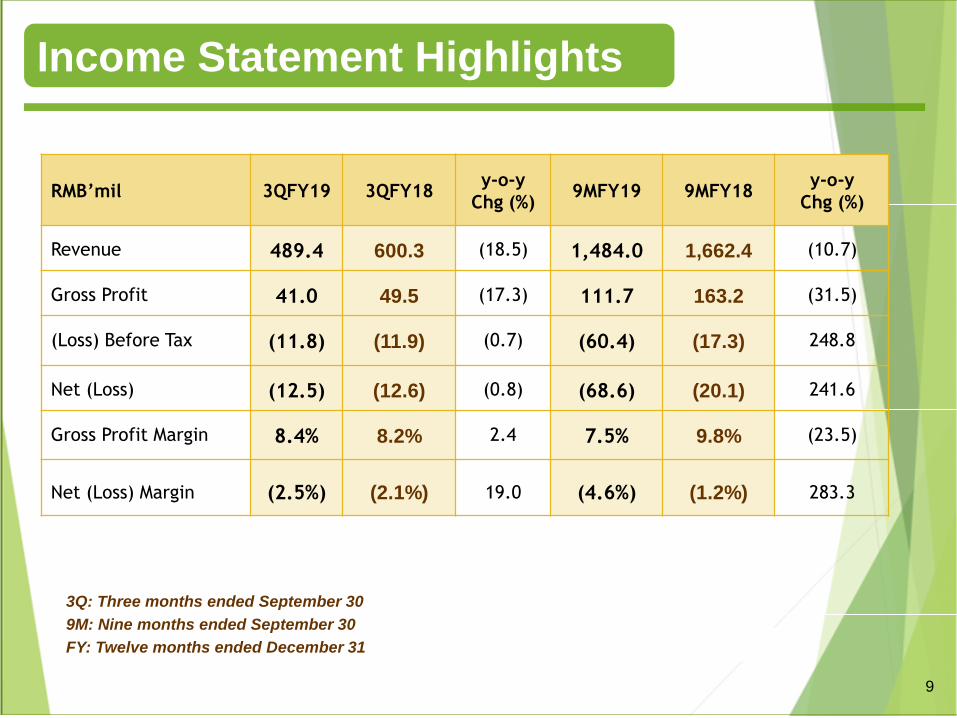
RMB’mil 3QFY19 3QFY18y-o-y
Chg (%)9MFY19 9MFY18
y-o-yChg (%)
Revenue 489.4 600.3 (18.5) 1,484.0 1,662.4 (10.7)
Gross Profit 41.0 49.5 (17.3) 111.7 163.2 (31.5)
(Loss) Before Tax (11.8) (11.9) (0.7) (60.4) (17.3) 248.8
Net (Loss) (12.5) (12.6) (0.8) (68.6) (20.1) 241.6
Gross Profit Margin 8.4% 8.2% 2.4 7.5% 9.8% (23.5)
Net (Loss) Margin (2.5%) (2.1%) 19.0 (4.6%) (1.2%) 283.3
Income Statement Highlights
3Q: Three months ended September 30
9M: Nine months ended September 30
FY: Twelve months ended December 31
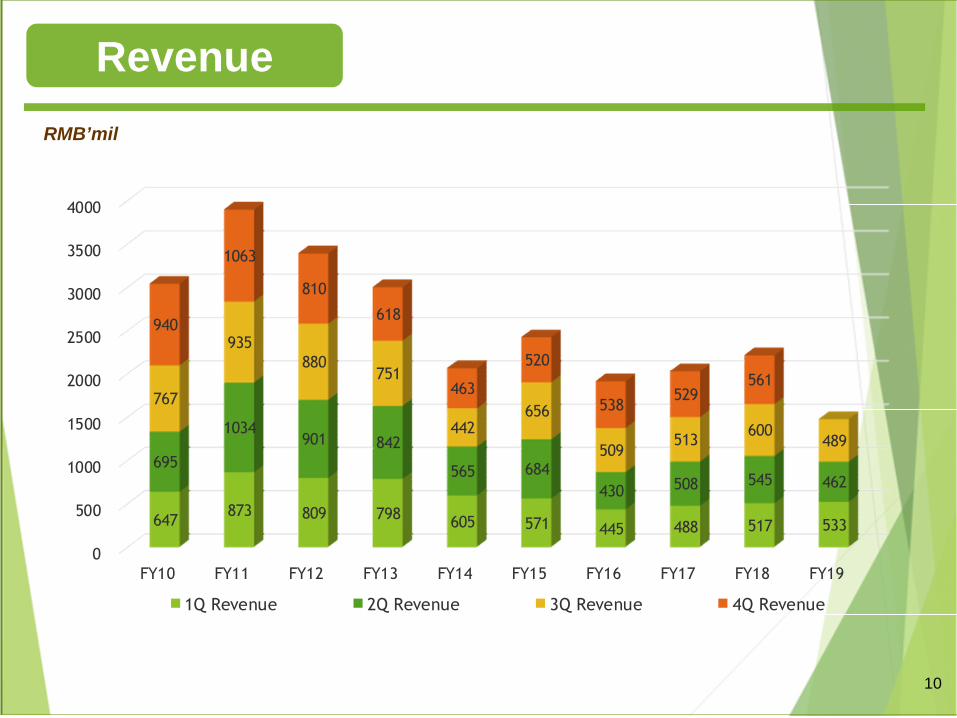
10
RMB’mil
Revenue
0
500
1000
1500
2000
2500
3000
3500
4000
FY10 FY11 FY12 FY13 FY14 FY15 FY16 FY17 FY18 FY19
647 873 809 798
605 571 445 488 517 533
695
1034 901 842
565 684
430 508 545 462
767
935 880
751
442 656
509 513
600 489
940
1063
810
618
463
520
538 529
561
1Q Revenue 2Q Revenue 3Q Revenue 4Q Revenue
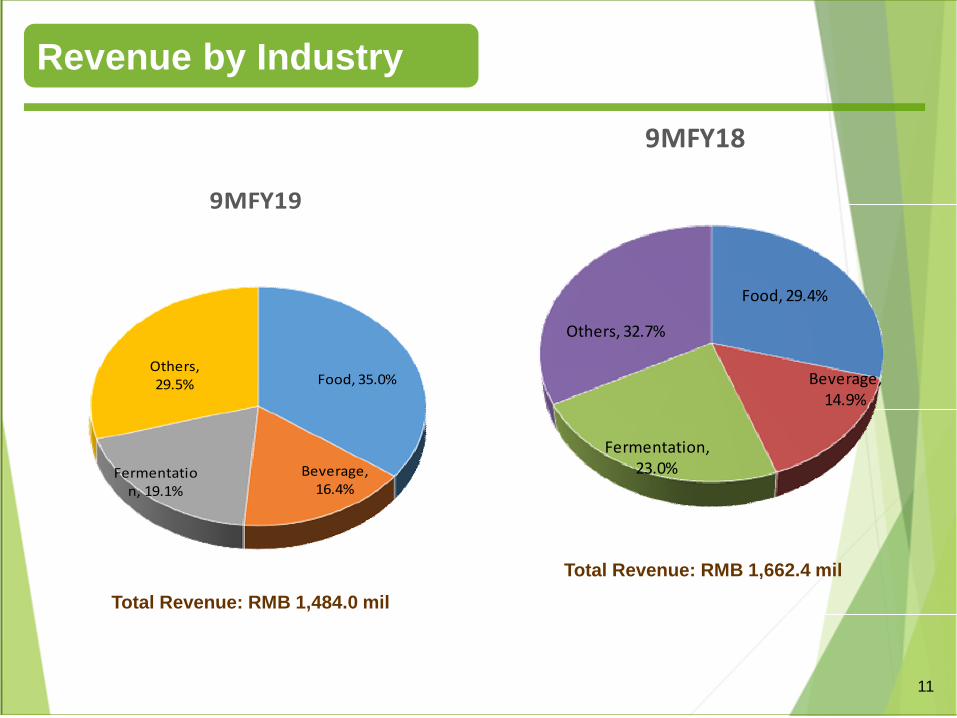
11
Revenue by Industry
Total Revenue: RMB 1,662.4 mil
Food, 35.0%
Beverage, 16.4%
Fermentation, 19.1%
Others, 29.5%
9MFY19
Total Revenue: RMB 1,484.0 mil
Food, 29.4%
Beverage, 14.9%
Fermentation, 23.0%
Others, 32.7%
9MFY18
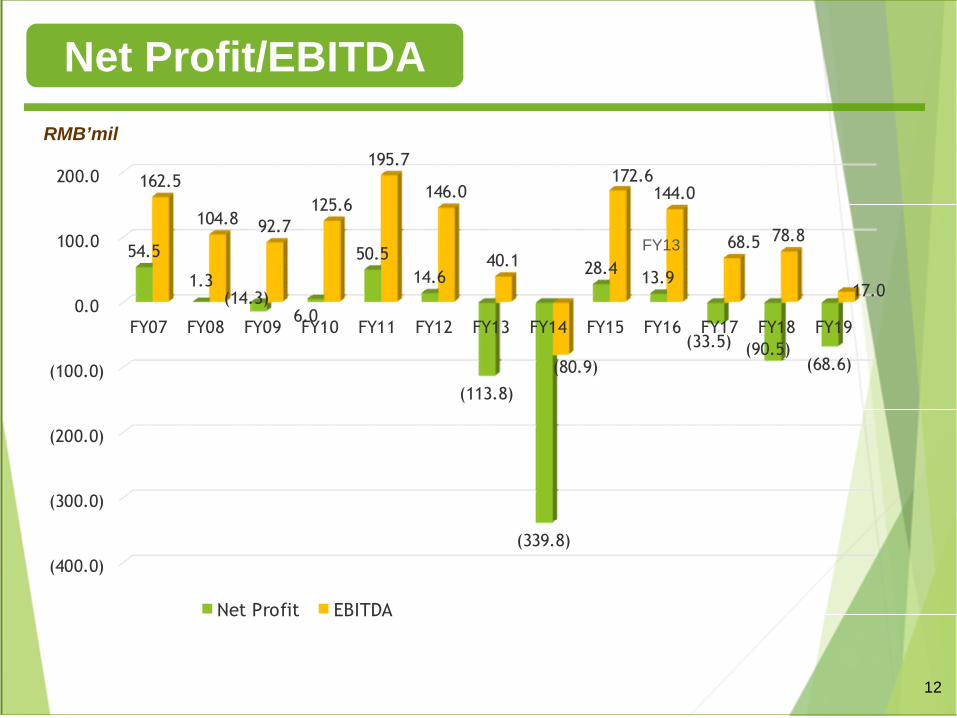
12
RMB’mil
Net Profit/EBITDA
(400.0)
(300.0)
(200.0)
(100.0)
0.0
100.0
200.0
FY07 FY08 FY09 FY10 FY11 FY12 FY13 FY14 FY15 FY16 FY17 FY18 FY19
54.5
1.3 (14.3)
6.0
50.5
14.6
(113.8)
(339.8)
28.4 13.9
(33.5) (90.5)(68.6)
162.5
104.8 92.7 125.6
195.7
146.0
40.1
(80.9)
172.6 144.0
68.5 78.8
17.0
Net Profit EBITDA
FY13
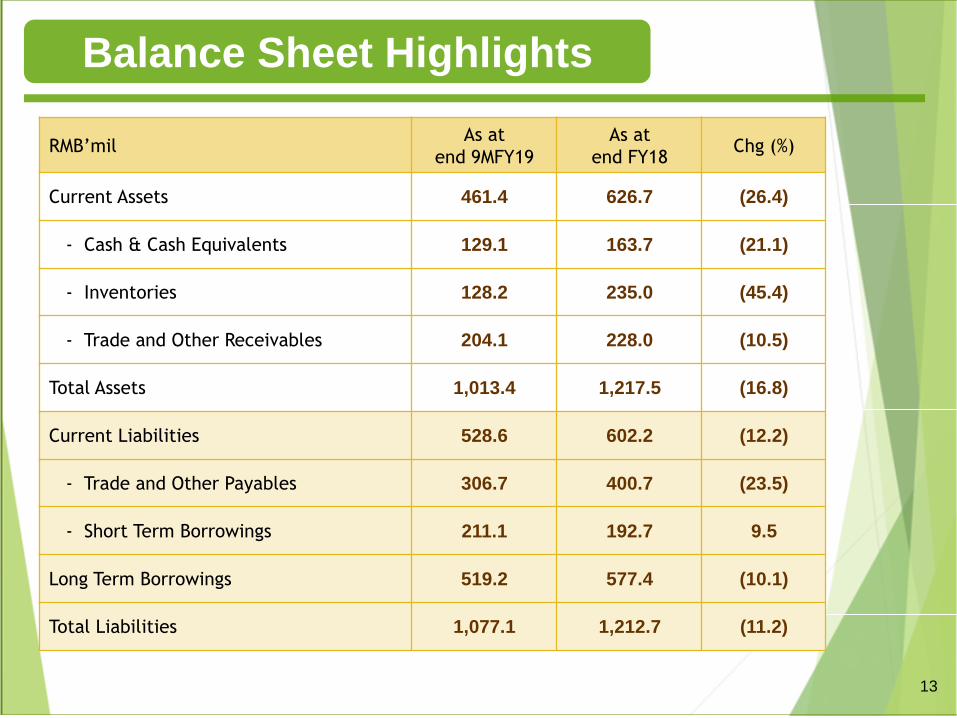
13
RMB’milAs at
end 9MFY19As at
end FY18Chg (%)
Current Assets 461.4 626.7 (26.4)
- Cash & Cash Equivalents 129.1 163.7 (21.1)
- Inventories 128.2 235.0 (45.4)
- Trade and Other Receivables 204.1 228.0 (10.5)
Total Assets 1,013.4 1,217.5 (16.8)
Current Liabilities 528.6 602.2 (12.2)
- Trade and Other Payables 306.7 400.7 (23.5)
- Short Term Borrowings 211.1 192.7 9.5
Long Term Borrowings 519.2 577.4 (10.1)
Total Liabilities 1,077.1 1,212.7 (11.2)
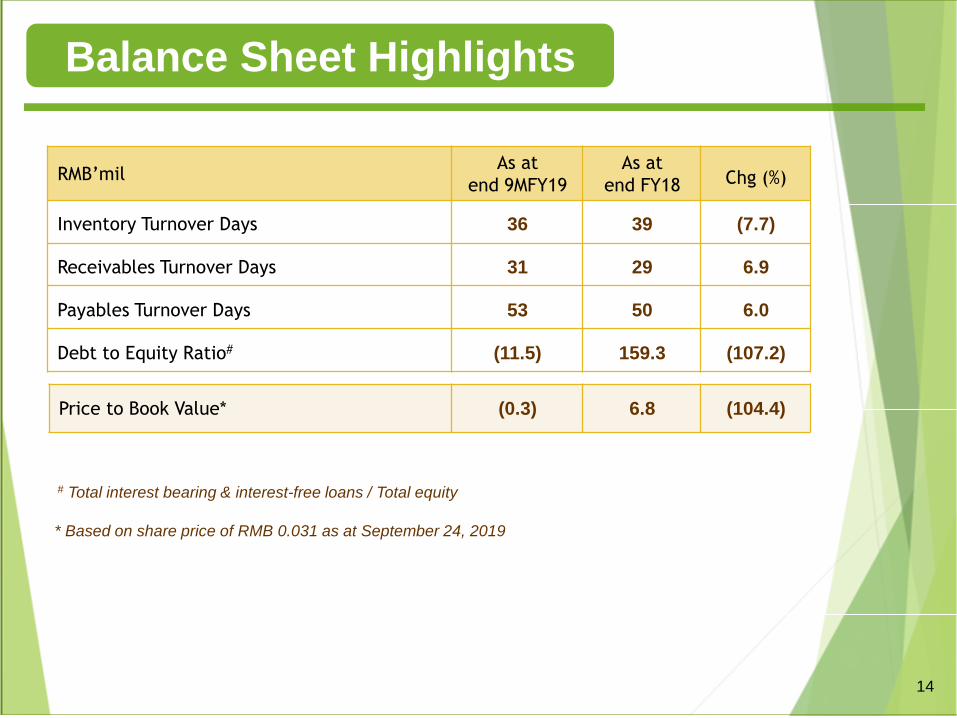
Balance Sheet Highlights
14
RMB’milAs at
end 9MFY19As at
end FY18 Chg (%)
Inventory Turnover Days 36 39 (7.7)
Receivables Turnover Days 31 29 6.9
Payables Turnover Days 53 50 6.0
Debt to Equity Ratio# (11.5) 159.3 (107.2)
Balance Sheet Highlights
Price to Book Value* (0.3) 6.8 (104.4)
# Total interest bearing & interest-free loans / Total equity
* Based on share price of RMB 0.031 as at September 24, 2019
15
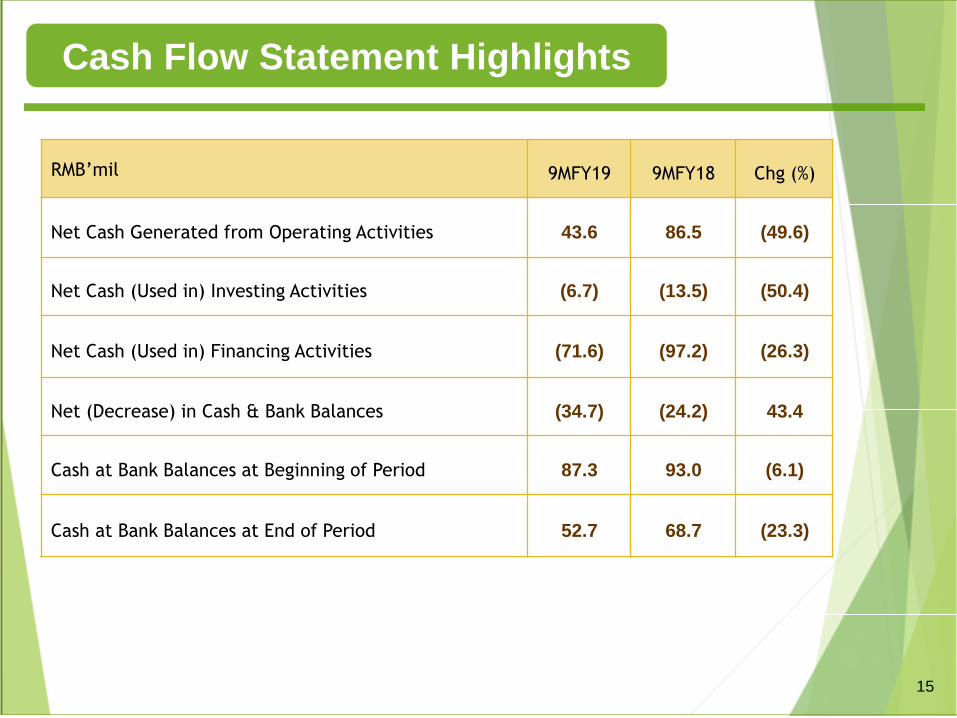
RMB’mil 9MFY19 9MFY18 Chg (%)
Net Cash Generated from Operating Activities 43.6 86.5 (49.6)
Net Cash (Used in) Investing Activities (6.7) (13.5) (50.4)
Net Cash (Used in) Financing Activities (71.6) (97.2) (26.3)
Net (Decrease) in Cash & Bank Balances (34.7) (24.2) 43.4
Cash at Bank Balances at Beginning of Period 87.3 93.0 (6.1)
Cash at Bank Balances at End of Period 52.7 68.7 (23.3)
Cash Flow Statement Highlights
16
Growth Strategies

17
Focusing on products where the Group has pricing advantages as a
high volume producer (e.g. Sorbitol), and high margin products such
as fructose, high maltose syrup, maltitol, etc.
Continue with cost savings effort with the suspension of unprofitable
products.
Resume production when the local market condition is favorable so as
to ride on the uptrend in consumption demand and capture the market
shares to improve the Group’s revenue and profit margin.
Defer capital investment where necessary to conserve cash due to the
uncertainty of the global and domestic markets.
Growth Strategies
Safe Harbour Statement
This presentation may contain forward looking statements that involve risks and uncertainties. Actual future performance, outcomes and results may differ materially from those expressed in forward looking statements as a result of a number of risks, uncertainties and assumptions. Representative examples of these factors include (without limitation) general industry and economic conditions, interest rate trends, cost of capital and capital availability, competition from other companies, shifts in customer demands, customers and partners, changes in operating expenses, including employee wages, benefits and training, governmental and public policy changes and the continued availability of financing in the amounts and the terms necessary to support future business. You are cautioned not to place undue reliance on this presentation and the information contain therein, which are based on current view of management on future events.
Without prejudice to or derogating from the generality of the foregoing, no representation or assurance is given by Luzhou Bio-chem Technology Limited that this presentation contains all information that an investor may require. To the extent permitted by applicable law, by Luzhou Bio-chem Technology Limited or its related persons (and their respective directors, associates, connected persons and/or employees) shall not be liable in any manner whatsoever for any consequences (including but not limited to any direct, indirect or consequential losses, loss of profits and damages) arising from the reliance or use of the information contain in this presentation.
Investors are advised to make their own independent evaluation from this presentation, consider their own individual investment objectives, financial situation and particular needs and consult their own professional and financial advisers as the legal, business, financial, tax and other aspects as investors may regard as relevant.
For more information, please visit
www.luzhou.sg
LUZHOU BIO-CHEM TECHNOLOGY LIMITED
THANK YOU


![1 Welcome to CHEM BIO 3OA3! Bio-organic Chemistry [OLD CHEM 3FF3] Sept. 11, 2009](https://img.pdfslide.us/doc/110x75/551acf9b55034656628b606e/1-welcome-to-chem-bio-3oa3-bio-organic-chemistry-old-chem-3ff3-sept-11-2009.jpg)


![Welcome to CHEM BIO 3OA3! Bio-organic Chemistry [OLD CHEM 3FF3]](https://img.pdfslide.us/doc/110x75/56812fe3550346895d955b3d/welcome-to-chem-bio-3oa3-bio-organic-chemistry-old-chem-3ff3.jpg)