Embed Size (px)
DESCRIPTION
eto
Citation preview

A Finite Element Model for TBC Damage Detection and Lifetime Prediction
A. Luz, D. Balint, K. Nikbin
Department of Mechanical Engineering, Imperial College London, South Kensington Campus, London SW7 2AZ, United Kingdom
Abstract: Thermal Barrier Coatings (TBC) have been used for almost three decades for heat insulation in high-temperature components to increase efficiency. Reliable diagnostic techniques that are practical to implement are needed to identify the location and severity of degradation in TBCs to protect against premature TBC failure. Luminescence spectroscopy has been utilized in detecting early damage, as it exhibits monotonic changes in the spectral characteristics with damage. Nevertheless there is still no agreement on what are the best spectral parameters that indicate damage. A new Finite Element model is presented, which is used to make realistic predictions of TBC lifetime, from as-manufactured to critically damaged. The aim of the modelling is to accurately incorporate all observed behaviour for a specific coating while retaining computational feasibility. To simulate damage accumulation and delamination the finite element model has been used to run several thermal cycles during which nucleation, propagation and coalescence of cracks is incorporated. A variety of cracking scenarios have been studied. The stress field of the oxide layer determined by the finite element model is subsequently converted into luminescence spectrum. Each stress level is represented by a Gaussian-Lorentzian shape function and by adding all the different stresses within the probed volume, the whole spectrum is obtained. The predicted luminescence spectrum for several cracks is used to identify characteristic spectral features that can be employed to predict TBC lifetime.
Keywords: Thermal Barrier Coating, Life Prediction, Oxidation, Residual Stress, and Luminescence Spectroscopy.
1. Introduction
Progress in aero-engines and land-based gas turbines is continuously linked with a rise of the operating temperature. In the next generation of advanced engines, further increases in thrust-to-weight ratio will require even higher gas temperatures. This means that the surface temperatures of the components will increase. Thermal barrier coatings (TBCs) have become a critical technology
2008 Abaqus Users’ Conference 1
for improving the efficiency and performance of advanced gas turbines, as they are used to insulate hot-section metallic components in gas turbine engines (Padture, 2002).
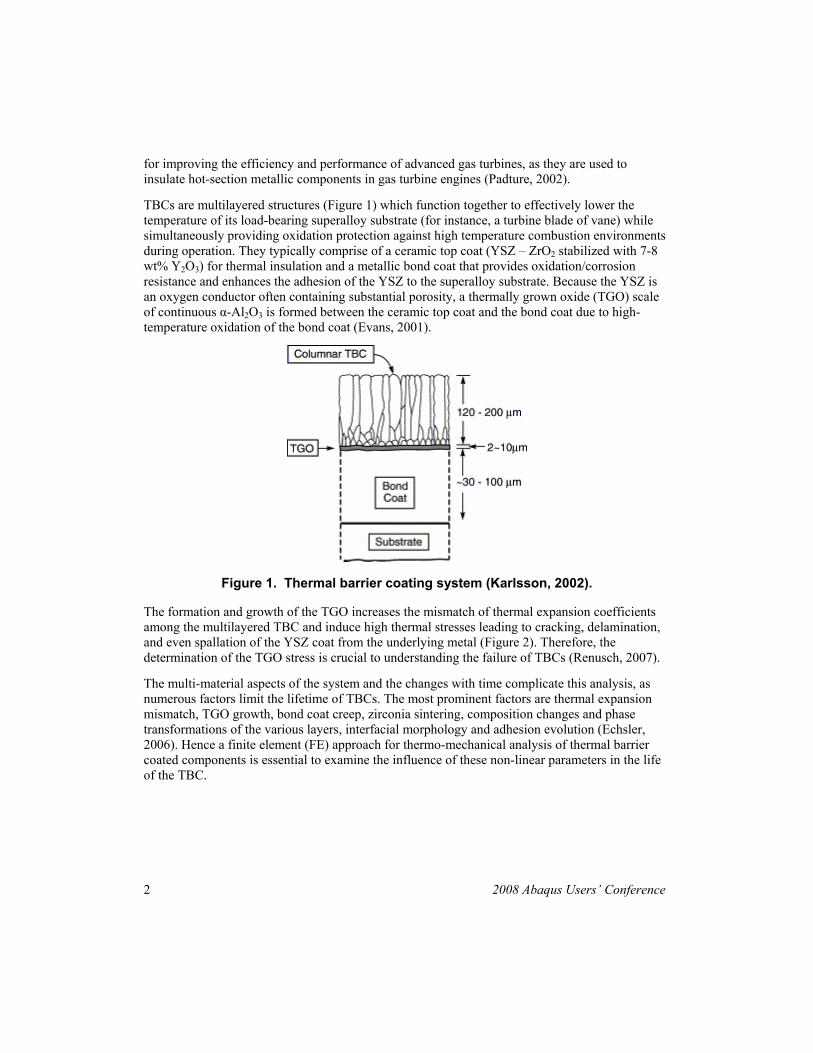
TBCs are multilayered structures (Figure 1) which function together to effectively lower the temperature of its load-bearing superalloy substrate (for instance, a turbine blade of vane) while simultaneously providing oxidation protection against high temperature combustion environments during operation. They typically comprise of a ceramic top coat (YSZ – ZrO2 stabilized with 7-8 wt% Y2O3) for thermal insulation and a metallic bond coat that provides oxidation/corrosion resistance and enhances the adhesion of the YSZ to the superalloy substrate. Because the YSZ is an oxygen conductor often containing substantial porosity, a thermally grown oxide (TGO) scale of continuous α-Al2O3 is formed between the ceramic top coat and the bond coat due to high-temperature oxidation of the bond coat (Evans, 2001).
Figure 1. Thermal barrier coating system (Karlsson, 2002).
The formation and growth of the TGO increases the mismatch of thermal expansion coefficients among the multilayered TBC and induce high thermal stresses leading to cracking, delamination, and even spallation of the YSZ coat from the underlying metal (Figure 2). Therefore, the determination of the TGO stress is crucial to understanding the failure of TBCs (Renusch, 2007).
The multi-material aspects of the system and the changes with time complicate this analysis, as numerous factors limit the lifetime of TBCs. The most prominent factors are thermal expansion mismatch, TGO growth, bond coat creep, zirconia sintering, composition changes and phase transformations of the various layers, interfacial morphology and adhesion evolution (Echsler, 2006). Hence a finite element (FE) approach for thermo-mechanical analysis of thermal barrier coated components is essential to examine the influence of these non-linear parameters in the life of the TBC.
2 2008 Abaqus Users’ Conference
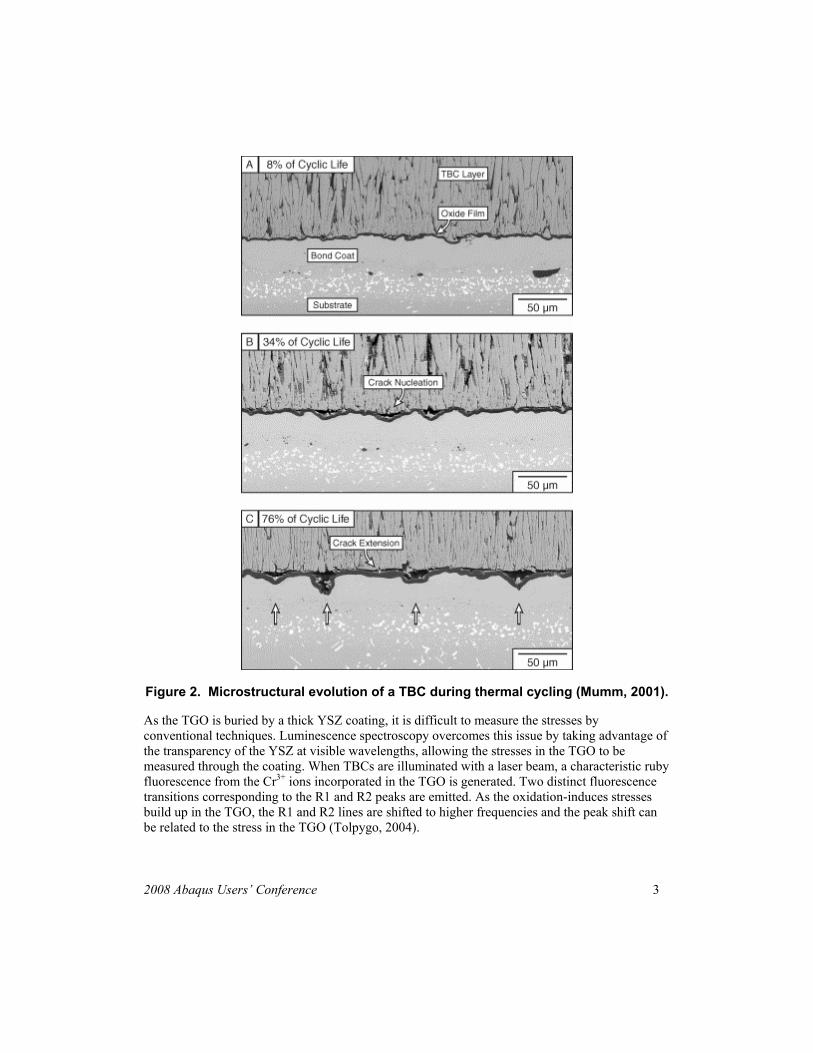
Figure 2. Microstructural evolution of a TBC during thermal cycling (Mumm, 2001).
As the TGO is buried by a thick YSZ coating, it is difficult to measure the stresses by conventional techniques. Luminescence spectroscopy overcomes this issue by taking advantage of the transparency of the YSZ at visible wavelengths, allowing the stresses in the TGO to be measured through the coating. When TBCs are illuminated with a laser beam, a characteristic ruby fluorescence from the Cr3+ ions incorporated in the TGO is generated. Two distinct fluorescence transitions corresponding to the R1 and R2 peaks are emitted. As the oxidation-induces stresses build up in the TGO, the R1 and R2 lines are shifted to higher frequencies and the peak shift can be related to the stress in the TGO (Tolpygo, 2004).
2008 Abaqus Users’ Conference 3

This technique has attracted much interest since it offers a potential non-destructive method for monitoring the stresses in engine components and assessing their residual stresses. However, the potential of using stress evolution to predict lifetime is not straightforward because the stress changes can have a variety of causes. Other spectral parameters (such as peak height, peak width and peak separation) should provide extra information, but presently there is no agreement on how the progress of these features correlates with damage (Selcuk, 2002).
The primary objective of the present paper is to determine the evolution of luminescence spectrum from as-manufactured to critically damaged TBCs using the finite element method. This approach will help to provide a reliable lifetime prediction tool for these systems.
2. Finite element model
The oxidation-induced stresses that control the TBC degradation and eventual failure are calculated using the Abaqus finite element analysis code. The two-dimensional model depicted in Figure 3 consists of a 1.5mm thick substrate (CMSX-4), 0.1mm thick BC (PtNiAl), 0.0005mm thick TGO (Al2O3) and a 0.2mm thick TBC (8% Y2O3-ZrO2). The TBC/BC interface initial roughness is modeled by a sinusoidal geometry with an amplitude of 0.5 μm and a wavelength of 20μm. The boundary conditions used are symmetry (on the left) and periodicity (on the right). This means that on the left the nodes are not allowed to move in the horizontal direction, while on the right the nodes are allowed to move, but the movement is constrained such that all these nodes must have the same displacement.
Figure 3. Finite element model used as a sample structure.
The finite element mesh is also shown in Figure 3. It consists of first order generalized plain strain elements, for which strain in the third direction is uniform but not necessarily zero. The meshing is
4 2008 Abaqus Users’ Conference

coarse for the substrate, bond coat and top coat regions and very fine in the TGO layer, since the TBC lifetime is primarily influenced by the stresses developed in the TGO.
The structure is initially stress-free at 1150 °C. Each thermal cycle consists of three parts: (1) cooling to 25 °C in 10 min, (2) reheat to 1150 °C in 10 min and (3) high temperature exposure at 1150 °C for 60 min. This sequence is repeated for N cycles.
The material properties are summarized in Table 1 and are based on typical properties for the constituents. For simplicity, isotropic material response is assumed for all layers, except the YSZ top coat, which is modeled as a transversely isotropic solid.
Table 1. Material properties used for the finite element simulations. Substrate Bond coat TGO YSZ top coat
Young’s modulus (GPa) 180 110
386 (25 oC) 348 (550 oC) 312 (1150 oC)
Evertical 215 (25 oC) 150 (800 oC)
Ehorizontal / / Evertical 0.2
Poisson ratio 0.27 0.27 0.26 0.32 Coefficient of thermal expansion (ppm oC-1)
14.0 T<600 oC: 14.5 T>700 oC: 16.5
8.0 (25 oC) 8.5 (550 oC) 9.0 (1150 oC)
11.0 (25 oC) 12.6 (800 oC)
Yield stress (MPa)
Elastic
1000 (25 oC) 500 (300 oC) 300 (600 oC) 120 (800 oC) 70 (900 oC) 40 (1000 oC) 20 (1150 oC)
T<900 oC: 10000 T>1000 oC: 300
Elastic
Creep prefactor: A
1.0x10⁻¹⁵ (400 oC)
2.3x10⁻¹³ (650 oC)
1.0x10⁻¹³ (900 oC)
5.7x10⁻¹⁶ (1150 oC)
1.0x10⁻¹⁵ (25 oC)
2.1x10⁻¹² (500 oC)
2.9x10⁻¹⁰ (700 oC)
1.7x10⁻⁹ (800 oC) 7.4x10⁻⁹ (900 oC)
2.6x10⁻⁸ (1000 oC) 9.6x10⁻⁸ (1150 oC)
Creep exponent: n (s-1)
1.0 (400 oC) 3.7 (650 oC)
4.7 (900 oC) 7.0 (1150 oC)
1.0 (25 oC)
1.0 (500 oC)
1.0 (700 oC)
2.0 (800 oC) 2.0 (900 oC)
3.0 (1000 oC) 3.0 (1150 oC)
As described above, a key feature in the failure of TBCs is the formation and growth of the TGO. Thus, it is critical to model this behavior in a satisfactory manner, while maintaining a tractable numerical scheme. At growth temperature, that is at maximum temperature, the TGO creep is modeled by perfectly plastic behavior, as there is no creep data available in literature. The yield strength is assumed to be the plateau stress for long term relaxation (creep) and serves to accumulate inelastic strain during each cycle. This stress is commonly referred as “growth stress” for thermally grown oxides. Thus, in the model, the TGO only undergoes elastic deformations, except at the growth temperature where the TGO is linear-elastic and perfectly-plastic with yield
2008 Abaqus Users’ Conference 5

strength. Numerically this is done by letting the flow stress to be 10 GPa for T<900 oC and 300 MPa for T>1000 oC and allowing linear variation in between.
During the high temperature stage of the thermal cycle, the growth of the TGO is imposed as a stress-free strain with thickening and lengthening components. The accumulation of lengthening growth strain is the key parameter driving the system. The TGO thickening is consistent with parabolic growth kinetics, where the TGO growth constant is selected to be 0.5 μm√h. The lengthening component is assumed to be 10% of the thickening growth strain.
Platinum-aluminide bond coats (PtNiAl) undergo a martensitic phase transformation in the vicinity of 600–700 °C accompanied by 0.7% linear expansion during heat-up. The volume change accompanying the phase transformation is modeled using an effective thermal expansion coefficient of 86x10-6 °C-1 for the bond coat between 600 and 700 °C on the heat-up, and between 550 and 450 °C on the cool-down, giving 0.7% linear strain change relative to the substrate occurring over a span of 100 °C.
To study the evolution of luminescence spectrum emitted from the TGO with TBC cycling, a Fortran subroutine was developed to convert the stresses calculated by the FE model into spectrum.
The R1 and R2 lines exhibit Lorentzian line shape that progressively evolves to a mixed Gaussian–Lorentzian shape. This is due to the fact that the stresses experienced by the TGO change the shape of the R1 and R2 lines. Typical spectra taken from a strain-free sapphire reference and the TGO layer are illustrated in Figure 4. Using the piezo-spectroscopic coefficients measured by (He, 1995) the frequency shift can be related to stress for either line.
Figure 4. Luminescence spectra from an unstrained sapphire crystal and from the TGO formed under a 3-μm TBC.
6 2008 Abaqus Users’ Conference

The laser spot size is typically 5 μm. The Fortran subroutine is used to center the virtual laser spot at the point where one wants to simulate the luminescence spectrum. The stress at each integration point within the probed volume is converted into a Lorentzian line, where the peak parameters – peak shift, peak width and peak height – are stress dependent. The Lorentzian curves of all the integration points inside the laser spot are added and the total luminescence spectrum is obtained.
In this investigation, the finite element model was used to determine the evolution of the TBC system along 10 thermal cycles, during which several cracking scenarios were simulated. The numerical results were then employed to predict the luminescence spectra taken from the TGO of thermally cycled TBC.
3. Results and discussion
Figure 5 shows the contour plots of the in-plane stress component (σ11) when the TBC was cooled down to 25 °C after 10 thermal cycles.
Figure 5. Contour plots of the stress along the horizontal direction for (a) the undamaged TBC system; (b) close to the crack tip; (c) delamination at the TBC/TGO interface; and (d) delamination at the BC/TGO interface (in MPa).
2008 Abaqus Users’ Conference 7

It can be seen in Figure 5a that the intrinsic thermal mismatch between the layers causes large compressive stresses in the TGO at ambient temperature of more than 3 GPa. When a crack is introduced after 5 thermal cycles between the TGO and the ceramic top coat (Figure 5b and c), the stresses on the oxide layer relax considerably. This is due to the yielding and high temperature creep in the bond coat, which accommodate the TGO deformation and relaxation. On the other hand, if the crack is introduced on the bond coat/TGO interface (Figure 5d) the stresses in the TGO remain relatively large. This is explained by the fact that the ceramic top coat has a much higher creep resistance when compared to the bond coat and therefore it does not allow stress relaxation to occur in the TGO.
The numerical results were then converted into spectra in order to analyze how luminescence spectra changes with delamination. Figure 6 shows that there is a significant shift of the R1-R2 peaks when damage occurs, which is explained by the stress relaxation of the TGO. Moreover, peak broadening is also observed. The TGO exhibits different stress levels with damage, as certain bits along the layer tend to relax more than others. This causes an overlap of low and high stress peaks, which justifies the broadening.
Figure 6. Luminescence spectra at different positions along the oxide layer.
8 2008 Abaqus Users’ Conference

It can also be seen in Figure 6 that depending on the position of the laser beam, the stress levels within the probed volume can be so dissimilar that instead of one R1 and one R2 peaks, one may find two R1 and two R2 peaks. The broadening of the R1-R2 peaks due to damage is what causes the shape of the curves to progressively evolve from Lorentzian to mixed Gaussian–Lorentzian.
The differences in the luminescence spectra taken close and away from the crack tip were also investigated and can be observed in Figure 7.
Figure 7. Luminescence spectra taken close and away from the crack tip.
Close to the crack tip, there is less stress relaxation of the TGO layer. Hence, the luminescence peaks shift less from the undamaged position and exhibit a small amount of broadening. This result means that it is difficult for the luminescence technique to detect cracks smaller than the laser spot size, as the stress relaxation is limited and therefore the spectrum keeps relatively unchanged.
Finally the luminescence spectra for failure at the TBC/TGO interface and BC/TGO interface were compared. Figure 8 shows that when the TGO remains attached to the ceramic top coat, the luminescence spectrum is practically identical to the undamaged case, while when the TGO is fixed to the bond coat, significant peak shifting and broadening is detected. This is in accordance to what is observed in Figure 5, where little stress relaxation happens when the crack is introduced between the bond coat and the TGO.
2008 Abaqus Users’ Conference 9

Figure 8. Luminescence spectra for the cases of delamination at the TBC/TGO and BC/TGO interface.
4. Conclusion
Numerical simulations utilizing the finite element method are conducted to investigate how the luminescence spectra changes with TBC damage. The results show that the R1-R2 peaks shift and broaden considerable with damage. This means that peak shift, peak width and peak link (the intensity at which the R1 and R2 curves connect) should be used as spectral parameters characteristic of damage within the area covered by the analysis spot.
However, two important limitations were identified. The first is that it is difficult to detect early damage and the second is that damage between the bond coat and the TGO is also hard to identify. Both limitations are down to reduced stress relaxation, which causes a diminutive change in the luminescence peaks.
Although luminescence spectroscopy has proven a successful method to detect damage on the TBC system in a non-destructive way, its shortcomings mean that a combination with other optical techniques is preferred for an accurate prediction of the TBC remaining life.
10 2008 Abaqus Users’ Conference

5. Future Work
The computational results are currently being experimentally validated. The evolution of the material properties of the TBC system during thermal cycling will be measured, so that long term effects can be investigated. Furthermore, the differences in the peak parameters of the luminescence spectrum between a monocrystal and a polycrystal will be assessed using the device depicted in Figure 9 to load a ruby and a polycrystalline alumina under a Raman microscope.
Figure 9. Loading device developed to perform compression and shear tests on a ruby and a polycrystalline alumina under a Raman microscope.
6. Acknowledgements
This work was supported by Fundação para a Ciência e Tecnologia (FCT) under the Grant No. SFRH/ BD/ 25049 /2005 and by Japan Society for the Promotion of Science (JSPS) under Grant No. PE 07610. The authors are grateful to Mr. Telmo Santos (Technical University of Lisbon) for his assistance in the development of the loading device and to Prof. Yutaka Kagawa (The University of Tokyo) for his guidance in preparing the TBC specimens.
7. References
1. Echsler, H., V. Shemet, M. Schütze, L. Singheiser, and W.J. Quadakkers, “Cracking In and Around the Thermally Grown Oxide in Thermal Barrier Coatings: A Comparison of Isothermal and Cyclic oxidation,” Journal of Materials Science, vol. 41, pp. 1047-1058, 2006.
2008 Abaqus Users’ Conference 11

2. Evans, A. G., D. R. Mumm, J. W. Hutchinson, G. H. Meier, and F. S. Pettit, “Mechanisms Controlling the Durability of Thermal Barrier Coatings,” Progress in Materials Science, vol. 46, pp. 505-553, 2001.
3. He, J., and D.R. Clarke, “Determination of the Piezospectroscopic Coefficients for Chromium-Doped Sapphire,” Journal of the American Ceramic Society, vol. 78, pp. 1347–1353, 1995.
4. Karlsson, A. M., J. W. Hutchinson, and A. G. Evans, “A Fundamental Model of Cyclic Instabilities in Thermal Barrier Systems,” Journal of the Mechanics and Physics of Solids, vol. 50, pp. 1565-1589, 2002.
5. Mumm, D.R., A.G. Evans, and I. Spitsberg, “Characterization of a Cyclic Displacement Instability for a Thermally Grown Oxide in a Thermal Barrier System,” Acta Materialia, vol. 49, pp. 2329–2340, 2001.
6. Padture, N. P., M. Gell, and E. H. Jordan, “Thermal Barrier Coatings for Gas-Turbine Engine Applications,” Science, vol. 296, pp. 280-284, 2002.
7. Renusch, D., and M. Schütze, “Measuring and Modeling the TBC Damage Kinetics by Using Acoustic Emission Analysis,” Surface and Coatings Technology, vol. 202, pp. 740-744, 2007.
8. Selcuk, A., and A. Atkinson, “Analysis of the Cr3+ Luminescence Spectra from Thermally Grown Oxide in Thermal Barrier Coatings,” Materials Science and Engineering A, vol. 335, pp. 147-156, 2002.
9. Tolpygo, V.K., D.R. Clarke, and K.S. Murphy, “Evaluation of Interface Degradation during Cyclic Oxidation of EB-PVD Thermal Barrier Coatings and Correlation with TGO Luminescence”, Surface and Coatings Technology, vols. 188-189, pp. 62-70, 2004.
12 2008 Abaqus Users’ Conference