Embed Size (px)
Citation preview
I N S T I T U T F Ü R D E M O S K O P I E A L L E N S B A C H
Luxembourg Business Compass 17th Survey Wave
May 2018

TABLE OF CONTENTS
Page
INTRODUCTION ....................................................................................................... 1 FINDINGS Luxembourg business leaders remain optimistic about the economic outlook ................................................................................................... 3 The effects of the Rifkin study on the Luxembourg economy so far tend to be assessed as slight; many business leaders are not well informed about the study ......................................................................... 5 In the view of business leaders, Luxembourg's competitiveness has continued to improve, but the lack of qualified staff is becoming increasingly problematic ..........................................................................13 A majority of companies assess their current business situation as good and they continue to anticipate a positive trend in the near future. In comparison to last year, however, their expectations are more subdued ...........27 The majority of companies are planning to expand their budgets for digitalization, introducing new products and services, IT, and for recruiting new staff and training................................................................................35 APPENDIX
Survey data

- 1 -
INTRODUCTION
In April 2009, top decision-makers at the largest companies in Luxembourg, as defined by the number of employees, were interviewed for the first time within the framework of the Luxembourg Business Compass. Using this instrument, the aim was to establish an economic indicator—for the first time ever—that could be employed to ascertain Luxembourg business leaders' expectations regarding the future economic trend in Luxembourg at regular intervals. The survey focuses particularly on how business leaders expect the Luxembourg economy will develop in the next 12 months, along with their expectations and plans for their own companies' future development. These core questions are supplemented by varying questions pertaining to business or politics.
In April/May 2018, the survey for the Luxembourg Business Compass was conducted for the seventeenth time. As with the prior survey waves, the INSTITUT FÜR DEMOSKOPIE ALLENSBACH was commissioned by KPMG S.A.R.L. to design the survey methodologically, develop the questionnaire in cooperation with the client, confidentially process the anonymous data collected and compile a report on the findings. After being notified about the survey in writing or by telephone, a total of 49 top decision-makers were interviewed using an online questionnaire in English in the time from April 16 – May 14, 2018. As in all of the previous survey waves, it was also possible to draw a top-notch sample for the present survey: in 14 percent of the cases, the interview was completed by the company owner him- or herself, while about three quarters of the respondents belong to the executive board of their companies (74 percent), and the remaining 12 percent hold other executive positions.
The companies were selected based on the STATEC directory, "Les principaux employeurs au Luxembourg d’après l'effectif classés par branche d’activité économique de la NACE Rév.2, Situation au 1er janvier 2017 (édition juin 2017)." In drawing the sample, companies were selected from the different business sectors in line with these sectors' share of the gross domestic product in Luxembourg. Within
- 2 -
the different economic sectors, the largest companies—as determined by the number of employees—were included in the investigation.
The present report summarizes the most important findings of the study and presents them in graphic form. The report is supplemented by a basic volume of tables showing the responses to all questions in tabular form.
Allensbach on Lake Constance, INSTITUT FÜR DEMOSKOPIE ALLENSBACH June 6, 2018

- 3 -
FINDINGS
Luxembourg business leaders remain optimistic about the economic outlook
In the view of Luxembourg business leaders, the country's economy will continue to grow substantially in the coming year. Their expectations for the economic development remain at practically the same high level that was measured last year. On an 11-step scale ranging from '-5' ("economy will contract very strongly") to '+5' ("economy will grow very strongly"), respondents currently choose an average value of +2.2 to describe how they expect the Luxembourg economy will develop over the next 12 months (Figure 1).
Figure 1
© IfD-Allensbach
'Grow very strongly'
'Stagnate'
'Contract very strongly'
On a scale of +5 to -5, average step chosen by respondents to indicatehow they expect the Luxembourg economy will develop in view of thenext 12 months
-1.4
April2009
April2010
April2013
April2014
April2011
Source: Luxembourg Business Compass by KPMG and Luxemburger WortBase: Total respondents
±
+
+
+
+
+
-5
-4
-3
-2
-1
0
1
2
3
4
5
+0.5
+1.5
April2012
+0.1
-0.3
+0.8 +1.1
April2015
+1.6
June2016
May2017
May2018
+2.3 +2.2
Short-Term Expectations for the Luxembourg Economy:Business Leaders Remain Optimistic

- 4 -
In this regard, business leaders' expectations for the next 12 months are very homogeneous, with 70 percent of all respondents choosing steps +2 and +3 on the scale, along with 8 percent who expect even stronger economic growth. Only 16 percent anticipate a somewhat lower level of growth and a small share of 6 percent believe the economy will stagnate. None of the business leaders interviewed expect that the economy will contract over the next 12 months (Figure 2).
Figure 2
© IfD-Allensbach
Index of Expectations for the Luxembourg Economy in View of the Next 12 Months
'Grow very strongly'
'Stagnate'
'Contract very strongly'
On a scale of +5 to -5, step chosen by respondents to indicate how they expect the Luxembourg economy will develop –
x = less than 0.5 percent
±0
Source: Luxembourg Business Compass by KPMG and Luxemburger Wort (May 2018)Base: Total respondents
+1
+2
+3
+4
+5
-1-2-3-4-5
16
39
31
6
6
xx
xx
x
2 %
- 5 -
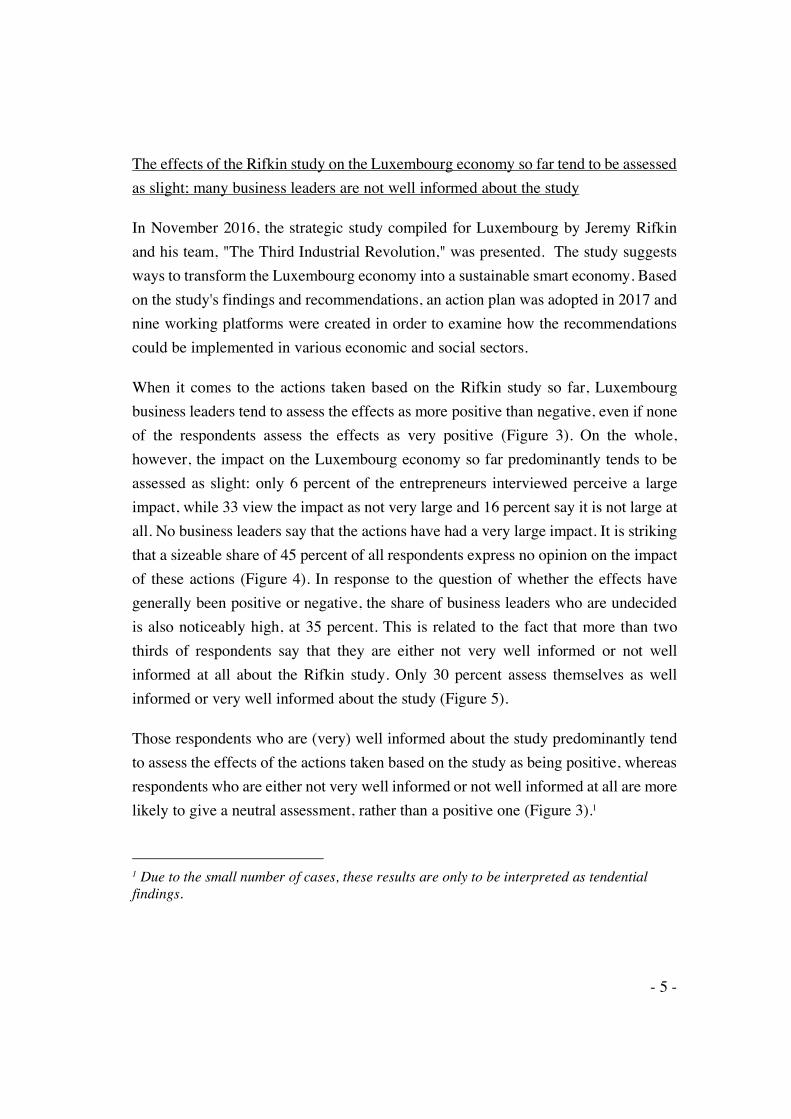
The effects of the Rifkin study on the Luxembourg economy so far tend to be assessed as slight; many business leaders are not well informed about the study
In November 2016, the strategic study compiled for Luxembourg by Jeremy Rifkin and his team, "The Third Industrial Revolution," was presented. The study suggests ways to transform the Luxembourg economy into a sustainable smart economy. Based on the study's findings and recommendations, an action plan was adopted in 2017 and nine working platforms were created in order to examine how the recommendations could be implemented in various economic and social sectors.
When it comes to the actions taken based on the Rifkin study so far, Luxembourg business leaders tend to assess the effects as more positive than negative, even if none of the respondents assess the effects as very positive (Figure 3). On the whole, however, the impact on the Luxembourg economy so far predominantly tends to be assessed as slight: only 6 percent of the entrepreneurs interviewed perceive a large impact, while 33 view the impact as not very large and 16 percent say it is not large at all. No business leaders say that the actions have had a very large impact. It is striking that a sizeable share of 45 percent of all respondents express no opinion on the impact of these actions (Figure 4). In response to the question of whether the effects have generally been positive or negative, the share of business leaders who are undecided is also noticeably high, at 35 percent. This is related to the fact that more than two thirds of respondents say that they are either not very well informed or not well informed at all about the Rifkin study. Only 30 percent assess themselves as well informed or very well informed about the study (Figure 5).
Those respondents who are (very) well informed about the study predominantly tend to assess the effects of the actions taken based on the study as being positive, whereas respondents who are either not very well informed or not well informed at all are more likely to give a neutral assessment, rather than a positive one (Figure 3).1
1 Due to the small number of cases, these results are only to be interpreted as tendential findings.

- 6 -
Figure 3
Effect of the Rifkin Study So Far: Generally More Positive Than NegativeQuestion: "On the whole, how do you assess the effect of the actions taken based on the Rifkin study
in Luxembourg so far?"
30
33
35
2
x
(60)
(27)
(13)
x (x)* (x)
(18)
(33)
x
No response
x = less than 0.5 percent
© IfD-AllensbachSource: Luxembourg Business Compass by KPMG and Luxemburger Wort (May 2018)Base: Total respondents
The effect of the actions taken based on the Rifkin study in Luxembourg is assessed as –
Don't know, difficult to say
Very positive
Positive
Neither positive nor negative
Negative Very negative
(x)(x)
(x)(x)
(x)
(46)
(3)
* = small number of cases (n = 15 / n = 33), so the results are only to be interpreted as tendential findings
Totalrespondents
Regarding the Rifkin study, respondents who feel –
(very) well informed not very/not at allwell informed

- 7 -
Figure 4
Business Leaders Generally Do Not Feel that the Rifkin StudyHas Had a Large Impact on the Luxembourg Economy So FarQuestion: "How much impact have the actions taken based on the Rifkin study had on the Luxembourg
economy so far?"
x = less than 0.5 percent
© IfD-AllensbachSource: Luxembourg Business Compass by KPMG and Luxemburger Wort (May 2018)Base: Total respondents
Business leaders who assessthe impact of the actions taken based on the Rifkin study on the Luxembourg economy as – 6
33 %
16
45
x
Don't know, difficult to say
Very largeLarge
Not large at all
Totalrespondents
Not very large

- 8 -
Figure 5
Regarding the Rifkin study,respondents whofeel they are –
Source: Luxembourg Business Compass by KPMG and Luxemburger Wort (May 2018)Base: Total respondents
Question: "In 2016, Jeremy Rifkin's strategic study for Luxembourg, 'The Third Industrial Revolution', was presented. It suggests various measures to be taken in order to transform the Luxembourg economy. Overall, how well informed are you about the Rifkin study?"
8 %
4325
222No response
Very well informedWell informed
Not very well informed
Not well informed at all
Most Business Leaders Are Not Well Informedabout the Rifkin Study

- 9 -
The goals of most of the nine working platforms that were created in order to implement the Rifkin study in various economic and social sectors are more frequently perceived as unclear by respondents, rather than as clear. This is especially true with respect to the working platform on "Employment and Social Issues," yet also applies to the "Luxembourg Sustainable Development Finance Platform," along with the platforms focusing on "Health," "Energy" and "Industry." Only the goals of the "Mobility" working platform are perceived considerably more frequently as clear than as unclear by Luxembourg business leaders. When it comes to this question too, however, large shares of respondents are undecided—a finding that must be viewed in light of the fact that a large share of business leaders are not well informed about the Rifkin study. This is also why the goals of none of the nine platforms are assessed as "clear" by an absolute majority of respondents (Figure 6).
Figure 6
Only Minorities Have the Impression That the Goals of the WorkingPlatforms Created to Implement the Rifkin Study Are ClearQuestion: "In 2017, the proposed measures were transformed into an action plan and associated
working platforms were created. Would you say that the goals being pursued by the various platforms are clear or unclear?"
Not depicted: Don't know, no response
© IfD-AllensbachSource: Luxembourg Business Compass by KPMG and Luxemburger Wort (May 2018)Base: Total respondents
The goals of the working platforms –
are clearare unclear
Mobilité (Mobility)
Economie circulaire (Circular economy)
Luxembourg Sustainable Development Finance Platform
Santé (Health)
Energiezukunft Lëtzebuerg (Energy)
Groupe de Haut Niveau TIR Industrie (Industry)
Conseil National pour la Construction Durable (Sustainable construction)Travail, Emploi et Questions Sociales (Employment and Social issues)
Intensification durable de l'agriculture (Sustainable agriculture)
29
28
27
18
35
23
16
20
23
43 %
33
22
21
18
16
16
16
10

- 10 -
One key question raised by the debate in connection with the Rifkin study is what role the government should play in managing economic growth in Luxembourg: to what extent should the government focus on promoting qualitative growth, that is, growth in the sense of the Rifkin study? There is no consensus among business leaders in this regard: 43 percent state that the government should promote all forms of economic growth, without discriminating against any specific business sectors or business models, whereas 18 percent are of the opinion that the government should interfere as little as possible in the economy. In contrast, 37 percent say that the government should only promote "qualitative growth," while an equally large share of 37 percent even say that the government should try to limit economic activities that are incompatible with qualitative growth criteria. Only 2 percent of respondents, however, agree with the idea that the government should aim to limit economic growth in general (Figure 7).
Figure 7
Question: "What role should the government play in promoting growth? Please select all of the
statements that you agree with."
43
37
37
18
2
2
2
promote all forms of economic development, with no discrimination against any specific industries or business activities
%
© IfD-AllensbachSource: Luxembourg Business Compass by KPMG and Luxemburger Wort (May 2017)Base: Total respondents
impose limitations on economic activities that are incompatible with qualitative growth criteria
only promote qualitative growth
interfere as little as possible in the economy
introduce measures to limit growth in general
None of the above
No response
The government should –
No Agreement on What Kind of Growth theGovernment Should Try to Promote

- 11 -
The widespread calls for qualitative growth are, however, to be interpreted with caution, since there is obviously no widely shared understanding among Luxembourg business leaders about what qualitative growth actually means. Thus, in response to a completely open question, 29 percent of the respondents associate "qualitative growth" with the concept of "sustainability," or provide other related explanations. An additional 10 percent refer in their responses to the need to ensure that growth is socially compatible, that economic growth is beneficial for all segments of society. In contrast, 27 percent explain the term solely in connection with economic criteria, stating, for example, that qualitative growth means higher productivity or an increase in the number of operationally active companies in the country. An additional 10 percent associate qualitative growth with better education and vocational training for workers. And just under one third of all respondents either cannot or choose not to provide any explanation of the meaning of qualitative growth in response to the open-ended question (Figure 8). In comparison to respondents on average, a greater share of business leaders who think the government should only promote qualitative growth or should even impose limits on economic activities that are incompatible with qualitative growth criteria refer to "sustainability" when asked to explain the meaning of "qualitative growth." Yet even in this group, about one in seven respondents refers to purely economic criteria and over a third provides no response at all.2
2 Special analysis

- 12 -
Figure 8
29
27
10
8
4
14
31
Sustainable growth, preserving resources
Socially compatible growth
Better education and vocational training for workers
Negative comments, warnings
Other responses
No response
© IfD-AllensbachSource: Luxembourg Business Compass by KPMG and Luxemburger Wort (May 2017)Base: Total respondents
Economic improvements, such as higher productivity,more operationally active companies in the country
No Clear or Consistent Understanding of "Qualitative Growth" among Business LeadersQuestion: "In the run-up to the parliamentary elections this autumn, there is a growing debate on the
issue of 'qualitative growth' in Luxembourg. What does 'qualitative growth' mean to you?" (Open-ended question, multiple responses possible)
Respondents who understand "qualitative growth" in the sense of –
%

- 13 -
In the view of business leaders, Luxembourg's competitiveness has continued to improve, but the lack of qualified staff is becoming increasingly problematic
When it comes to Luxembourg's competitiveness as a business location, the assess-ments given by Luxembourg business leaders are currently more positive than they have ever been since this indicator was first ascertained within the framework of the Luxembourg Business Compass. Three quarters of top decision-makers now assess the country's competitiveness as either "good" (66 percent) or "very good" (10 percent). Only 22 percent rate the country's competitiveness as "average," while no respondents say it is "rather poor" or "very poor" (Figure 9).
Figure 9
Luxembourg's Competitiveness Is Assessed More Positively Than It Has Ever Been Since 2011Question: "
Very good
Good
Average
Rather poor
Very poor
How do you assess the competitiveness of Luxembourg as a business location?"
May2018
May2017
June2016
April2015
April2014
April2013
April2012
April2011
Luxembourg's competitiveness as a business location
8 %
50
37
5x
3
37
44
12
1x
1
35
38
24
2x
x
38
52
10
xx
3
No response
xx
3
55
35
7xx
3
59
35
3
xx
7
68
223
x = less than 0.5 percent
© IfD-AllensbachSource: Luxembourg Business Compass by KPMG and Luxemburger WortBase: Total respondents
2x
10
66
22
x

- 14 -
At the same time, however, when it comes to how the various factors that contribute to Luxembourg's competitiveness as a business location have developed over the past two years, Luxembourg business leaders tend to perceive very uneven trends. Thus, assessments of how these areas have developed are clearly negative on balance with respect to the availability of a skilled, high quality workforce, the development of labor costs, the administrative burdens placed on companies, the regulatory environ-ment, tax environment and the infrastructure.
In contrast, top decision-makers perceive a clearly positive trend on balance in connection with the innovative power of the Luxembourg economy, the creation of a business environment that facilitates the digitalization of companies' work processes, along with the promotion of Luxembourg as a business location. The entrepreneurs interviewed also tend to give a more positive than negative assessment with respect to the development of the socially stable environment in Luxembourg and the stable and coherent political environment (Figure 10)
Figure 10
x = less than 0.5 percent
Question: "
Availability of a skilled, high quality workforce
The administrative burdens placed on companies
The regulatory environment
The tax environment
The transportation system, infrastructure
Cost management by Luxembourg companies
Access to political decision-makers
The socially stable environment in Luxembourg
The stable and coherent political environment
Promotion of Luxembourg as a business location
Availability of work permitsCreation of a business environment that facilitates thedigitalization of companies' work processes
Government policies that adequately considerbusiness interests
The Luxembourg economy's innovative power when it comes to in-troducing new products and services and developing new markets
Thinking of Luxembourg's competitiveness as a business location: which of these areas have improved over the past two years, in which areas has the situation gotten worse,and in which ones has the situation basically stayed the same?"
63
55
53
49
47
43
20
18
14
8
8
8
4
x
x
%
ImprovedStayed the sameGotten worseNo
response
6
2
18
23
18
18
53
53
35
37
45
41
33
39
28
57
64
70
74
72
39
92
61
45
14
29
© IfD-AllensbachSource: Luxembourg Business Compass by KPMG and Luxemburger Wort (May 2018)Base: Total respondents
x
x
x
x
x
x
x
x
x
xx
xx
4
2
The cost of labor, how competitive wages are inLuxembourg
2
2
16
18
No Uniform Trend When It Comes to the Developmentof the Various Location Factors

- 15 -
In comparison to previous years, respondents' assessments of the development of various location factors vary greatly. On the one hand, some areas are assessed remarkably positively when compared to the findings obtained in prior survey waves. This is in line with respondents' highly positive assessments of Luxembourg's overall competitiveness as a business location in the current survey wave (see Figure 9 above). Thus, the share of business leaders who perceive a positive trend with respect to the Luxembourg economy's innovative power has grown even more in comparison to prior years (Figure 11).
Figure 11
© IfD-AllensbachSource: Luxembourg Business Compass by KPMG and Luxemburger WortBase: Total respondents
April 2012
April 2013
April 2014
April 2015
June 2016
May 2017
May 2018
3
ImprovedGotten worse %
Over the past two years the situation has –
Not shown: "Stayed the same" and "No response"
x 53
Regarding the Luxembourg Economy's Innovative Power, anIncreasing Share of Business Leaders Perceive an Improvement
The Luxembourgeconomy's innovativepower when it comesto introducing newproducts and servicesand developingnew markets
24
19
17
24
41
46
20
24
8
10
2
2
x = less than 0.5 percent

- 16 -
At the same time, the development of the socially stable environment and the political system in Luxembourg are assessed positively on balance for the first time (Figures 12 and 13).
Figure 12
© IfD-AllensbachSource: Luxembourg Business Compass by KPMG and Luxemburger WortBase: Total respondents
April 2012
April 2013
April 2014
April 2015
June 2016
May 2017
May 2018
3
ImprovedGotten worse %
20
17
35
30
29
10 10
5
4
1
2
5
Not shown: "Stayed the same" and "No response"
Over the past two yearsthe situation has –
188
The socially stableenvironment inLuxembourg
For the First Time, Views on the Development of the Socially Stable Environment in Luxembourg Are Positive on Balance

- 17 -
Figure 13
© IfD-AllensbachSource: Luxembourg Business Compass by KPMG and Luxemburger WortBase: Total respondents
April 2012
April 2013
April 2014
April 2015
June 2016
May 2017
May 2018
ImprovedGotten worse %
Not shown: "Stayed the same" and "No response"
Over the past two yearsthe situation has –
8 18
3
The Political System Is Perceived as Stable and Coherent
The stable andcoherent politicalenvironment
20
26
19
13
17
5
8
6
9
5
8

- 18 -
In contrast, the development of the tax environment is again assessed considerably more negatively than it was in the past two years (Figure 14). Moreover, a majority of business leaders generally have the impression that the situation regarding the administrative burdens placed on companies has gotten worse over the past two years (Figure 15).
Figure 14
© IfD-AllensbachSource: Luxembourg Business Compass by KPMG and Luxemburger WortBase: Total respondents
April 2012
April 2013
April 2014
April 2015
June 2016
May 2017
May 2018
3
ImprovedGotten worse %
69
60
32
62
38
19 22
11
2
x
2
3
Over the past two years the situation has –
Not shown: "Stayed the same" and "No response" x = less than 0.5 percent
The tax environment
The Development of the Tax Environment Is Viewed Negatively Again
47 14

- 19 -
Figure 15
Administrative Burdens Are Increasing
© IfD-AllensbachSource: Luxembourg Business Compass by KPMG and Luxemburger WortBase: Total respondents
April 2013
April 2014
April 2015
June 2016
May 2017
May 2018
3
ImprovedGotten worse %
34
44
52
55
41
53 6
x
7
3
1
3
Over the past two years the situation has –
Not shown: "Stayed the same" and "No response" x = less than 0.5 percent
The administrativeburdens placed on companies

- 20 -
One particularly striking finding obtained in the current survey wave is business leaders' more negative assessment of the trend with respect to labor costs and the labor market: the development of labor costs over the past two years is currently again assessed negatively by more than half of all respondents (Figure 16). When it comes to the availability of a skilled, high quality workforce, almost two thirds of respondents perceive a negative trend, a share that far exceeds the levels ascertained in any prior survey waves (Figure 17).
Figure 16
A Large Share of Business Leaders Again Perceive a Negative Trend with Respect to Labor Costs ...
© IfD-AllensbachSource: Luxembourg Business Compass by KPMG and Luxemburger WortBase: Total respondents
October 2011
April 2013
April 2014
April 2015
June 2016
May 2018
3
ImprovedGotten worse %
74
48
29
75
67
x
2
x
3
2
x
Over the past two years the situation has –
55
x = less than 0.5 percent
The cost of labor,how competitvewages are inLuxembourg
Not shown: "Stayed the same" and "No response"

- 21 -
Figure 17
... and the Availability of a Skilled Workforce
© IfD-AllensbachSource: Luxembourg Business Compass by KPMG and Luxemburger WortBase: Total respondents
April 2012
April 2013
April 2014
April 2015
June 2016
May 2017
May 2018
3
ImprovedGotten worse %
45
34
33
24
Over the past two years the situation has –
36
Availability of a skilled, highquality workforce
Not shown: "Stayed the same" and "No response" x = less than 0.5 percent
44
63
2
x
2
3
8
8
12

- 22 -
Accordingly, the share of business leaders who report that their companies have major difficulties finding qualified staff is even greater than it was in prior years: only 16 percent of major Luxembourg companies currently say that finding qualified staff is somewhat easy; none of them state that it is very easy. In contrast, 41 percent report that finding qualified staff is somewhat difficult, and the same share of companies even say it is very difficult (Figure 18).
Figure 18
Question: "How easy or difficult is it for your company to find qualified staff at the moment?"
At the moment, finding qualified staff is –
May2018
May2017
June2016
April2015
April2014
Very easySomewhat easy
Somewhat difficult
Very difficult
Company has not tried to find any new staff recently/noresponse
15 %
52
29
3
1
x = less than 0.5 percent
14
58
25
2
1
2
11
52
33
2
5
14
57
24
x
2
16
41
41
x
© IfD-AllensbachSource: Luxembourg Business Compass by KPMG and Luxemburger WortBase: Total respondents
Finding Qualified Staff Is Becoming More Difficult

- 23 -
About three quarters of major Luxembourg companies primarily find qualified staff in other EU countries. The share of companies that mainly find qualified staff in Luxembourg is currently 16 percent, which is somewhat lower than the levels ascertained in previous years (Figure 19).
Figure 19
Qualified Staff Is Generally Found in Other EU Countries
Question: "
Qualified staff is mainly found –
When you are currently looking for qualified staff, where do you mainly find these newstaff members?"
in the EU
in non-EUcountriesNo response/don't know/company has not tried to findany new staff recently
in Luxembourg
May2018
May2017
June2016
April2015
April2014
10 %
80
28
23
73
x4
28
70
2x
x = less than 0.5 percent
© IfD-AllensbachSource: Luxembourg Business Compass by KPMG and Luxemburger WortBase: Total respondents
24
71
5x
16
78
42

- 24 -
The lack of qualified staff is also by far the most frequently cited factor that top decision-makers believe could impede growth at their own companies over the next 6 months. The leaders of 59 percent of the largest Luxembourg companies expect that the lack of qualified staff will significantly hamper their company's growth over the next 6 months. Trailing far behind are other limiting factors such as legislative and regulatory pressures (41 percent), competition from foreign markets (35 percent, Figure 20).
In comparison to prior years, the lack of qualified staff has again become a considerably more significant barrier to growth at Luxembourg companies (Figure 21). In light of this development, staff turnover is also becoming increasingly problematic for Luxembourg companies. The share of business leaders who view this factor as an important barrier to growth at their own companies is now at 22 percent, which is higher than it has ever been in any prior survey waves (Figure 22).
Figure 20
Most Important Barriers to Growth
Question: "Thinking again of the next 6 months: Which of the following represent the mostimportant barriers to growth at your Luxembourg company?"
59413525222018141212
862x8
%
© IfD-AllensbachSource: Luxembourg Business Compass by KPMG and Luxemburger Wort (May 2018)Base: Total respondents
Lack of qualified staff
Legislative and regulatory pressures
Competition from foreign markets
Pressure for salary increases
Staff turnover
Competitors with disruptive technologies/business models
Lack of qualified management
Lack of demand
Behavior of labor unions
Late payments from customers
Bank charges and interest rates
Oil/energy prices
Limited access to new capital, capital constraints
Limited access to new loans from banks
Other
x = less than 0.5 percent

- 25 -
Figure 21
The Lack of Qualified Staff Is Becoming More Problematic for Luxembourg Companies
Most important barriers to growth
April 2009
April 2010
April 2015
June 2016
May 2017
May 2018
22
40
25
41
41
59
%
Source: Luxembourg Business Compass by KPMG and Luxemburger WortBase: Total respondents
Lack of qualified staff

- 26 -
Figure 22
Staff Turnover Is Becoming a Problem for LuxembourgCompanies
Most important barriers to growth
April 2009
April 2010
April 2015
June 2016
May 2017
May 2018
5
6
10
10
12
22
%
© IfD-AllensbachSource: Luxembourg Business Compass by KPMG and Luxemburger WortBase: Total respondents
Staff turnover
- 27 -
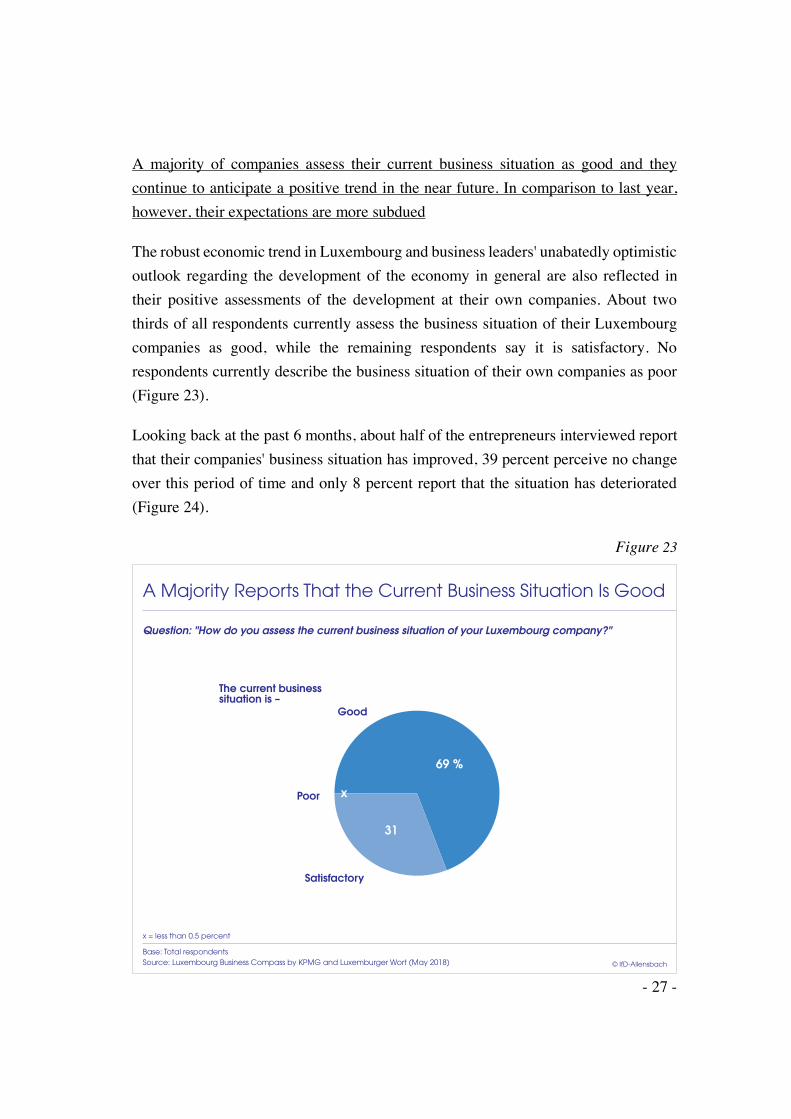
A majority of companies assess their current business situation as good and they continue to anticipate a positive trend in the near future. In comparison to last year, however, their expectations are more subdued
The robust economic trend in Luxembourg and business leaders' unabatedly optimistic outlook regarding the development of the economy in general are also reflected in their positive assessments of the development at their own companies. About two thirds of all respondents currently assess the business situation of their Luxembourg companies as good, while the remaining respondents say it is satisfactory. No respondents currently describe the business situation of their own companies as poor (Figure 23).
Looking back at the past 6 months, about half of the entrepreneurs interviewed report that their companies' business situation has improved, 39 percent perceive no change over this period of time and only 8 percent report that the situation has deteriorated (Figure 24).
Figure 23
A Majority Reports That the Current Business Situation Is Good
How do you assess the current business situation of your Luxembourg company?"Question: "
© IfD-AllensbachSource: Luxembourg Business Compass by KPMG and Luxemburger Wort (May 2018)Base: Total respondents
The current business situation is –
Good
Poor
Satisfactory
x = less than 0.5 percent
69 %
31
x

- 28 -
Figure 24
At the Majority of Luxembourg Companies, the BusinessSituation Has Improved over the Past Six MonthsQuestion: "How has the business situation of your Luxembourg company developed over the past
six months?"
Over the past six monthsthe business situation has –
© IfD-AllensbachSource: Luxembourg Business Compass by KPMG and Luxemburger Wort (May 2018)Base: Total respondents
Improved
Stayed the same
Deteriorated
53 %
39
8

- 29 -
When it comes to the next 6 months, a majority of decision-makers expect that the situation will improve (further): 61 percent expect that the business situation of their Luxembourg companies will improve over this period of time, about one third of business leaders anticipate no change, while only 8 percent expect that the situation will deteriorate (Figure 25).
Figure 25
A Majority Expects the Business Situation Will Improve over the Next Six MonthsQuestion: "How do you expect the business situation of your Luxembourg company to develop
over the next six months?"
Over the next six monthsthe business situation is expected to –
© IfD-AllensbachSource: Luxembourg Business Compass by KPMG and Luxemburger Wort (May 2018)Base: Total respondents
Improve
Stay the same
Deteriorate
61 %
31
8

- 30 -
These assessments are also confirmed by the results of a more differentiated question focusing on the development of key indicators at respondents' own companies. Thus, turnover is expected to increase by an average of 3.6 percent over the next 6 months, while profitability is expected to increase by 2.6 percent. Although these values are clearly lower than the values ascertained last year—thus indicating that entrepreneurs' expectations for the future are currently somewhat more subdued than they were a year ago—they are nevertheless still markedly positive when compared with the findings obtained over the long term (Figure 26).
Figure 26
Expectations for Entrepreneurs' Own Companies: Turnover and Profitability Are Still Expected to Grow, but NotAs Strongly As Last Year
Business volume/turnover
Profitability
Average changes anticipated,in percent
How do you expect the following areas or indicators will develop at your Luxembourg company over the next 6 months?"
Question: "
-8-7-6-5-4-3-2
-1012345
6
May2018
May2017
June2016
April2015
April2014
April2013
April2012
April2011
April2010
April2009
-4.3
-6.5
+2.2
+0.9
+5.5
+4.5 +2.0+1.1
+1.0
-0.8
+2.9
+2.4
+4.5
+1.9
+
+
+
+
+
+
± +1.2
+2.8
© IfD-AllensbachSource: Luxembourg Business Compass by KPMG and Luxemburger WortBase: Total respondents
+4.3
+5.2
+2.6
+3.6
%

- 31 -
The number of employees is also expected to increase over the next 6 months: specifically, by an average of +1.5 percent. This increase could further exacerbate the situation regarding the market for skilled workers, which is already perceived as problematic.
The investment volume at Luxembourg companies is also expected to increase appreciably—specifically, by an average of +3.9 percent—even though the expected increase is much smaller than the corresponding value ascertained a year ago (Figure 27).
Figure 27
+
+
+
+
+
+
±
Expectations for Entrepreneurs' Own Companies: Investments and the Number of Employees Will Increase Less Strongly Than Last Year
Number of employees
Investments
Average changes anticipated, in percent
How do you expect the following areas or indicators will develop at your Luxembourgcompany over the next 6 months?"
-2.6
-3.3
%
-0.5
+1.3
+2.7
+5.7
+0.8
+1.3
Question: "
+2.6
+0.1
+2.8
+0.2
+4.8
+1.8
-7
-6
-5
-4
-3
-2
-1
0
1
2
3
4
5
6
May2018
May2017
June2016
April2015
April2014
April2013
April2012
April2011
April2010
April2009
+5.3
+2.3
+6.3
+2.7
© IfD-AllensbachSource: Luxembourg Business Compass by KPMG and Luxemburger WortBase: Total respondents
+1.5
+3.9

- 32 -
A more differentiated analysis shows that 88 percent of major Luxembourg companies anticipate growing turnover, and about two thirds expect an increase in both investments and the number of employees. An increase in profitability is expected by 57 percent. In each case, only small minorities foresee a downward trend with respect to these indicators (Figure 28).
Figure 28
x = less than 0.5 percent
Question: "
Increase:
No change
+20% or more+10% to less than +20%+5% to less than +10%less than +5%
How do you expect the following areas or indicators will develop at your Luxembourgcompany over the next 6 months?"
Profitability Business volume/turnover
Investments Number ofemployees
57
33 2 29 19
22
2231
Decrease:less than -5%-5% to less than -10%-10% to less than -20%-20% or more
10
On average
No response
+2.6
100
622x
%88
28
2355
10
+3.6
100
2422
%63
64
3122
8
+3.9
100
4x22
%67
2x
1847
14
x x x x
+1.5
100
8xx6
%
Source: Luxembourg Business Compass by KPMG and Luxemburger Wort (May 2018)Base: Total respondents
© IfD-Allensbach
The Vast Majority of Luxembourg Entrepreneurs Expect Increases in Business Volume

- 33 -
As a rule, major Luxembourg companies have no problems accessing the financial means needed to realize their investment plans: 29 percent of business leaders say it is very easy to access the financial means required and an additional 59 percent say it is somewhat easy. Only 10 percent of respondents say accessing such financial means is somewhat difficult, while no respondents say it is very difficult. Accordingly, only few companies cite bank charges and interest rates, along with limited access to bank loans or new capital, as factors that impede growth at their Luxembourg companies.3
In comparison to last year, there has been practically no change regarding the ease with which major Luxembourg companies can access the financial means they need (Figure 29).
Figure 29
3 See Figure 20, p. 24.
Accessing Financial Means: Currently Not Very Problematic
How easy or difficult is it for your company to access the financial means it needs?"Question: "
© IfD-AllensbachSource: Luxembourg Business Compass by KPMG and Luxemburger WortBase: Total respondents
x
For my company, accessing the financial means itneeds is –
Very easy
Somewhat easy
Somewhat difficult
No response
x = less than 0.5 percent
Very difficult
May2018
May2017
29 %
2
12
57
x
29
2
10
59

- 34 -
One reason for this could also be that 88 percent of the companies surveyed report that they are (also) planning to finance their investments with their company's own funds, whereas 29 percent will (also) resort to traditional bank financing and 12 percent will make use of state aid programs (Figure 30). If multiple responses are excluded from the calculation, we find that the majority of Luxembourg companies are able to finance their planned investments wholly by means of their own funds (59 percent).4
Figure 30
4 Special analysis
Investments Will Primarily Be Financed withCompanies' Own Funds
How will your company finance its planned investments? Please check all applicable items."(Multiple responses possible)
Question: "
© IfD-AllensbachSource: Luxembourg Business Compass by KPMG and Luxemburger Wort Base: Total respondents
Company's own funds
Traditional bank financing
State aid programs
Other types of financing
No investments planned
Planned investments will befinanced with – May 2017 May 2018
88
29
12
2
4
88
20
14
5
3
%

- 35 -
The majority of companies are planning to expand their budgets for digitalization, introducing new products and services, IT, and for recruiting new staff and training
The largest Luxembourg companies are generally planning to increase rather than reduce their budgets for all areas of operations over the next six months. Particularly large shares anticipate increases in connection with expenditures for digitalization and networking of work processes (76 percent), for introducing new products or services (71 percent), for information technology (69 percent), as well as for recruiting new staff (59 percent) and for training (57 percent). Business leaders are least likely to be planning to increase their budgets for advertising and business acquisitions (Figure 31).
Figure 31
Planned Investments: Areas Where LuxembourgCompanies Will Increase or Decrease ExpendituresQuestion: "
Digitalization and networking of work processes
Introduction of new products or services
Information technology
Recruiting new staff
Training
Marketing and sales
Salaries (excluding legally binding indexation)
Research and development
Promotion
E-commerce
Expanding facilities
Geographic expansion
Business acquisitions
Advertising
In which of the following areas will your Luxembourg company increase or, respectively, reduce its expenditures in the next 6 months?"
Increase No change DecreaseNo response
76 %
71
69
59
57
47
41
37
35
33
29
27
18
12
22
29
29
33
39
51
55
63
63
67
65
71
80
86
© IfD-AllensbachSource: Luxembourg Business Compass by KPMG and Luxemburger Wort (May 2018)Base: Total respondents
x = less than 0.5 percent
2
x
x
x
x
x
x
x
x
x
x
x
x
x
x
2
2
2
2
2
22
2
8
6x
22

- 36 -
In comparison with the planned increases measured in previous years, a remarkably high share of companies are planning to increase expenditures for recruiting new staff and for salaries. The increasing budgets in these areas are the logical result of two factors combined: i.e. the lack of qualified staff and plans to increase the number of employees at Luxembourg companies.
The share of companies that intend to increase their budgets for recruiting new staff over the next 6 months is currently at 59 percent, which is larger than it has ever been in any of the prior spring survey waves of the Luxembourg Business Compass (Figure 32). At the same time, 41 percent of Luxembourg companies anticipate increasing expenditures for salaries and wages, even when increases due to legally binding indexation are excluded. The value measured thus remains at the same high level that was ascertained last year (Figure 33).
Figure 32
© IfD-AllensbachSource: Luxembourg Business Compass by KPMG and Luxemburger WortBase: Total respondents
Changes in Companies' Planned Expenditures: The Share ofCompanies Planning to Increase Their Budgets for Recruiting New Staff Is Growing Strongly Again
April 2013
April 2014
April 2015
June 2016
May 2017
May 2018
5
24
14
23
37
4413
56
12
8
46
59
Recruiting new staff
IncreaseDecrease %

- 37 -
Figure 33
Changes in Companies' Planned Expenditures:Plans to Increase Budgets for Salaries Remain at a High Level
© IfD-AllensbachSource: Luxembourg Business Compass by KPMG and Luxemburger WortBase: Total respondents
April 2013
April 2014
April 2015
June 2016
May 2017
May 2018
3
IncreaseDecrease %
5
2
2
12
7
9
21
18
16
41
41
Salaries (excluding legallybinding indexation)

- 38 -
In contrast, the share of companies that are planning to increase their advertising budgets over the next 6 months has declined significantly in comparison to prior years, falling to the lowest level on balance since 2013 (Figure 34).
Figure 34
Changes in Companies' Planned Expenditures:Hardly Any Growth in Advertising Budgets
© IfD-AllensbachSource: Luxembourg Business Compass by KPMG and Luxemburger WortBase: Total respondents
April 2009
April 2010
April 2011
April 2012
April 2013
April 2014
April 2015
June 2016
May 2017
May 2018
IncreaseDecrease %
39 12
Advertising
18
12
32
23
24
25
19
30
24
10
12
20
16
6
22
7
2
3

- 39 -
Roughly three quarters of the companies interviewed anticipate increasing budgets for digitalization and networking of work processes in the near future.5 A total of 82 percent of major Luxembourg companies are investing in the area of digitization.
A clear majority of companies (63 percent) are also investing in the area of data protection. When it comes to more specific technical developments, the shares measured are smaller: about one third of respondents say their companies are investing in the area of "big data," while about one quarter are investing in artificial intelligence. And only a small share of companies are investing in high performance computing (6 percent, Figure 35).
Figure 35
5 See Figure 31.
A Majority of Companies Invest in Digitization and Data Protection
Companies are investing in –
Digitization
Data protection
Big data
Artificial intelligence
High performance computing (HPC)
None of the above
No response
82
63
35
27
6
8
2
%
Source: Luxembourg Business Compass by KPMG and Luxemburger Wort (May 2018)Base: Total respondents
Question: "Overall, which of the following technology developments does your company invest in?"(Multiple responses possible)

- 40 -
At the companies interviewed, innovation generally tends to be driven internally, rather than by means of external support: a combined total of 84 percent say innovation is driven internally in the form of decentralized innovation efforts within the company (53 percent) or research & development teams and departments (49 percent). In contrast, a total of 43 percent of companies (also) rely on external support,6 particularly on external consultants (31 percent) as well as collaboration with external institutions such as universities (18 percent). Only a small share of companies drive innovation by means of acquisitions, for example, by buying start-ups (Figure 36).
Figure 36
6 Special analyses
Innovation Is Primarily Driven Internally
Means by which companies drive innovation –
R&D team, R&D department
External consultants
Other
53
49
31
18
6
6
%
Source: Luxembourg Business Compass by KPMG and Luxemburger Wort (May 2018)Base: Total respondents
Decentralized innovation efforts within the company
Collaboration with external institutions, such as universities
Buying expertise through acquisitions (for example, of start-ups)
Question: "How do you generally drive innovation at your Luxembourg company? Please check all applicable items."(Multiple responses possible)

- 41 -
A P P E N D I X
Survey data

Overall respons-ibility for methods:
Planning and draw-ing the sample:
Group of personsinterviewed(universe):
Sampling method:
Number ofrespondents:
Type of interviews:
Fieldwork dates:
IfD ArchivesSurvey No.:
Institut für Demoskopie Allensbach
KPMG Luxemburg
Top decision-makers at the largest companies in Luxembourg, as defined by thenumber of employees
Top-down approach stratified according to business sectorsThe sample was drawn based on the directory(*) of the Luxembourg statistics bureau(Statec), which lists companies with 90 employees or more in Luxembourg.For each business sector, the number of companies included in the survey wasroughly commensurate with the sector's share of the gross domestic product (GDP)of Luxembourg, whereby the companies were selected in descending orderaccording to the number of employees.
In the companies selected to participate, every effort was made to persuade arepresentative of the upper management (owner, CEO, CFO, COO, etc.) tocomplete the online survey.
49
Online survey completed after prior notification in writing or by telephone
April 16 – May 14, 2018
7281
(*) Les principaux employeurs au Luxembourg d’après l'effectifclassés par branche d’activité économique de la NACE Rév.2Situation au 1er janvier 2017 (édition juin 2017)
SURVEY DATA