Embed Size (px)
Citation preview
Department of economics
Bachelor thesis
2013
Efficient trade procedures?- An analytical research study of efficient trade procedures.
By: Martin Lasses
Supervisor:
Maria Persson

AbstractStudies regarding trade facilitation exist in a bundle. They regard the impact of trade
facilitation on trade flows for the most part, but to this day no research has earlier been done
with the goal being to find the underlying variables behind efficient trade procedures. Why do
some countries have very efficient trade procedures while others suffer from much more
cumbersome trade procedures?
The difference with this research in regard to earlier research is that this one will look at what
variables are of importance if a country wants to improve their trade procedures while the
earlier research is focusing around the volume of extra trade that will be the result of
improving trade procedures.
The question is answered with the help of a regression to which several independent variables,
such as democracy and strength of legal rights etc., have been tested against the dependent
variable, days to import which is the empirical measure used to catch the effectiveness of
trade procedures. The results derived from the research demonstrated some significant results
that implied that the variables have an association with efficient trade procedures.
Keywords: Trade facilitation, efficient trade, trade procedures.
2
Table of Contents
(1) Introduction……………………………………….………5
(2) Trade Facilitation………………………………….……...7
2.1 Definition of trade facilitation……………………………..7
2.2 Implications of inefficient trade procedures…………........8
2.3 Summary of discussion……………………………............9
(3) Data on the Efficiency of Trade Procedures……...........10
3.1 The Doing Business project……………...………………10
3.2 Trading across borders…………………...………………11
3.2.1 The Scenario company……………………...……………..11
3.2.2 The Scenario Cargo……………………………..………...12
3.2.3 Time…………………………………………….......…..12
3.2.4 Documentation…………………………………………...13
3.2.5 Costs…………………………………………………....13
3.3 Data problems and question marks………………………13
3.4 Trading across borders, the dependent variable…….……14
3.4.1 The regional spread………………………………………14
3.5 Summary of discussion…………………………………..16
(4) Previous Research………………….……………………17
(5) Model Specification……….…………………………….19
5.1 Independent variables……...…………………………….20
5.1.1 Variable presentation and predictions……………………...20
5.2 Country classification…………………...……………….23
5.2.1 Country predictions………………………………………23
3
5.3 The Model………………………………………………..24
5.4 Limitations with the regression…………………………..24
5.5 Summary of discussion…………………………………..25
(6) Baseline Regression………………..……………………27
6.1 Results and analysis……………………………………...27
6.2 Baseline regression conclusions…………………………30
6.3 Robustness checks……………………………………….33
6.4 Country regression………………………………………33
6.4.1 Country regression results………………………………..34
6.5 Summary of discussion………………………………….35
(7) Summary and conclusions……...……………………….36
References…………………………………………………....39
Appendix……………………………………………………..42
Appendix A……………………………………………………42
Appendix B……………………………………………………43
Appendix C……………………………………………………46
Appendix D……………………………………………………47
Appendix E……………………………………………………49
4
(1) Introduction
Trade facilitation refers to reform focusing at reducing the time and costs it takes to get goods
in and out of countries by improving the so called trade procedures. With better trade
procedures countries gain competitiveness and are able to import faster, resulting in larger
trade volumes (Hoekman & Kostecki 2009). The World Bank views the work with trade
facilitation and competitiveness as one of the most important trade related matters, which is
evidenced by the organization having 80 projects under implementation, representing a value
of 4.6 billion dollars (World Bank 2012). In other words, trade facilitation represents a major
issue in international economics.
While a lot of research has demonstrated that trade facilitation, i.e. increased efficiency in
trade procedures, has the potential to both expand trade volumes and increase the range of
traded goods, to date, no research whatsoever has studied why some countries have very
efficient trade procedures while others experience much more cumbersome trade procedures.
For instance, complying with all import procedures in Singapore takes a mere 4 days, while
complying with the same import procedures in Chad take 101 days (Doing Business 2013a).
The difference between best and worst importer are notably vast. How come the difference is
so large?
This essay will focus on these differences, and try to answer why some countries have much
more efficient trade procedures than others. Since there is no previous research on this topic,
this study should be seen primarily as an explorative one.
To investigate the variation in the effectiveness of trade procedures across countries, an
econometric regression is being used to explore statistically significant variables. Variables
being tested are for example: democracy rating, strength of legal rights and GDP. These
variables are all being tested against the dependent variable Days to Import; the empirical
measure of the effectiveness of trade procedures.
Since there is no previous research concerned with the reasons behind the significant
differences between countries regarding trade procedures; much of the theory and the
econometric model have been built up without having anything to lean against or look upon.
In that sense, this essay is a contribution to the literature that so far, mostly has concerned the
effects on trade volumes.
5
The essay is organized in the following fashion:
Firstly trade facilitation is explained followed by the chapter data on the efficiency of trade
procedures. A brief walkthrough of previous research is followed up by the model
specification chapter. After the model has been explained the baseline regression will take
over. The regression is followed up by summary and conclusions. In the back of the essay
references and appendixes are found.
6
(2) Trade Facilitation
This chapter will clarify the meaning of trade facilitation. It will give a more thorough
understanding of what it is that governments would need to adjust or reform in order to
shorten unnecessary time delays to trade. Furthermore, examples of what lack of efficient
trade procedures mean in terms of trade disadvantages will be explored. Lastly, an example
demonstrating what is to be gained for countries aiming for trade facilitation will be
presented.
2.1 Definition of trade facilitation
Trade facilitation aims to simplify, standardize and harmonize trade procedures. How to lower
the transaction costs for firms and governments when trading, thereby make it easier, cheaper
and more rapid to trade. The definition to trade procedures is “the activities, practices and
formalities involved in collecting, presenting, communicating and processing data required
for the movement of goods in international trade” (Grainger 2008 , Hoekman & Kostecki
2009). Inefficient trade procedures decrease the pace of trade and therefore trade facilitation
concerns with fastening the trade procedure.
However, in order to fully understand the meaning of trade facilitation and what companies
and governments can do to improve trade procedures, we need more than just the definition of
the words to understand what it is.
Simplifying - The process of removing all unnecessary elements and duplications of trade
processes and procedures is what simplifying means.
Standardizing - Standardizing concerns finding common ground, agreeing on working
formats and documentation so that one or a few formats and only a few amount of documents
are used in most parts of the world.
Harmonizing - Harmonizing concerns the work of finding national formalities that will
correlate with international conventions and standards (Butterly 2003)
Trade procedures - Trade procedures are the work of customs. When discussing customs
work one mean the use of information technology, risk management techniques, bureaucracy
and the extent of corruption and lack of modernization, what documents are required etc.
7
Required documents are for example certificate of origin, carrier declaration and conformity
with product standards (Persson 2011).
Defining trade facilitation is not an easy task. The problem with defining trade facilitation
regards the question of what to include and what not to include. Does it concern only customs,
harbors and borders or shall corruption and in-land infrastructure also be taken into account?
This thesis will use the definition and explanation as acknowledged by B.M Hoekman & M.M
Kostecki, as well as by the WTO presented above.
2.2 Implications of inefficient trade procedures
All the above mentioned procedures can be notably different between countries and they may
differ in cost and time to fulfill. Since trade procedures differ between countries a company
need, in order to set up trade, acquire all the relevant information about what type of
documentation that is needed, how the infra-structure is working etc. There are costs of
acquiring this information as well as delay in time. Even though these costs can be regarded
as a sunk cost, the acquiring of all relevant information such as documents etc., the firm still
needs to invest time and money to fill the required documents each time a good is to be sent
across the border. More complicated rules demand more documents to be filled meaning more
time and more money spent (Persson 2012a). Companies trading with time sensitive goods
may suffer even more from these time delays, such as a ship filled with fruits may be spoiled
if it has to stay in harbor for too long. A company trading in high-end technique products
might see their products lose market value while standing in port. There are several things,
some reasons more trivial than others, which may cause time delaying problems. For example
a rubber stamp not pressed hard enough or a signed document being signed with the “wrong”
colored ink (Hoekman & Kostecki 2009).
A country improving its trade procedures may generate an opening up for new markets for
both domestic and international companies. Due to lowered costs to trade, generated by more
efficient trade procedures, it is easier for companies to break-even making it possible to enter
new markets. With more companies entering the market, competition increases, thus lowering
market prices, and even further, markets can be created. New products for new markets can
also be a result of more efficient trading procedures (Bourdet & Persson 2012).
As written above, much could be gained from working with trade facilitation. A numeric
example done by Bourdet and Persson demonstrates that, if within the EU, all countries would
8

make improvements and thereby find themselves at the level of best performing countries,
being five days to import, the aggregated exports from outside countries would increase by
about 20% on average (Bourdet & Persson 2012).
2.3 Summary of discussion
To summarize the discussion in this section, trade facilitation is about simplifying,
harmonizing and standardizing trade procedures. When trade procedures are inefficient it
creates costs for trading firms. One way to think about these costs is that inefficient
procedures give rise to delays, and these delays will cause physical or monetary depreciation
of the traded goods. In other words, it would benefit countries to engage in reform aiming at
improving trade procedures – i.e. trade facilitation. This in turn raises the question: Why do
some countries have so much better trade procedures than others? This is what this thesis aims
to investigate.
9
(3) Data on the efficiency of trade procedures.
The main focus of this paper is to explore the differences between countries regarding
efficiency in trade procedures; what are the reasons to why some countries have better and
more efficient trade procedures than others? This will be done through a regression analysis
with data collected from a project named Doing Business, started by the World Bank in 2002.
Doing Business is based on a thorough survey of the business climate in a vast range of
countries across the world. The thesis will particularly focus on one part of this survey,
namely the section covering trading across borders. The trading across borders data set
measures the time and costs it takes to export or import a standardized cargo of goods by sea
(Doing Business 2013b).
3.1 The Doing Business project
The Doing Business project intends to rank countries according to their “ease of doing
business”. The purpose of its existence is to measure the efficiency and strength of laws,
regulations and institutions throughout a company’s whole life-cycle in different countries.
The data is gathered on a yearly basis making it easy to compare countries over time. The
goal for the project is to encourage countries to strive for more efficient regulations and
promote trade (Doing Business 2013c).
The data is collected by handing out large surveys to experts in the different areas covered by
Doing Business. The experts asked are mainly lawyers, legal professionals and notaries due to
their expertise in legal and regulatory arrangements as well as in areas of business. The
trading across borders questionnaires, being the main focus of this paper, are answered by
freight forwarders, accountants, architects, engineers and other professionals that are dealing
with trade related matters (doing business 2013d). To make sure that the data collected from
the surveys are comparable between countries a standardized and simple business case is
used.
The survey provides data within the following topics:
Regulations for starting a business
Dealing with construction permits
Getting electricity
Registering property
Getting credit
10
Protecting investors
Paying taxes
Enforcing contracts
Trading across borders
The organization is very clear in pointing out that it is not about the countries that have the
least but who has the smartest and most streamlined regulations, “In essence, Doing Business
is about smart business regulations, not necessarily fewer regulations” (Doing Business
2013e) (Doing Business 2013f).
3.2 Trading across bordersThe section from Doing Business, being of main importance to this thesis, is the part
regarding trading across border. In this part of the survey, data is collected using a
standardized scenario; a fictional firm with all the necessary actions that are needed to be
fulfilled in order to ship one container over sea. Everything from documents to transfers and
packing are included in the survey. (Doing Business 2013g.)
3.2.1 The scenario company
An imaginary small to medium sized company (at least 60 employees) that operates in
the largest business city of the country.
Further the company being looked at is, for the most parts, a limited liability company.
The use of a limited liability company is because it is the most common company
form in most places of the world. The company does not operate in any area that has
special import or export privileges.
The firms are to have full knowledge and follow all the laws and regulations in the
situated country.
(Doing Business 2013g)
11
3.2.2 The scenario cargo
The cargo being shipped in the scenario is this:
It is a fully loaded 20 foot container carrying a product that is not hazardous or includes any
military equipment it does not require refrigeration or any other special environment and is
one of the economies leading export or import products. The source of transportation is by
boat. The company importing or exporting is one previously defined. (Doing Business 2013g)
3.2.3 Time
The Doing business survey estimates how many days and at what costs a company can get the
cargo imported or exported but not taking tariffs into account. They estimate the time it would
take and at what cost it is possible to fulfill all the necessary documents and procedures but do
not include the time for the sea transport.
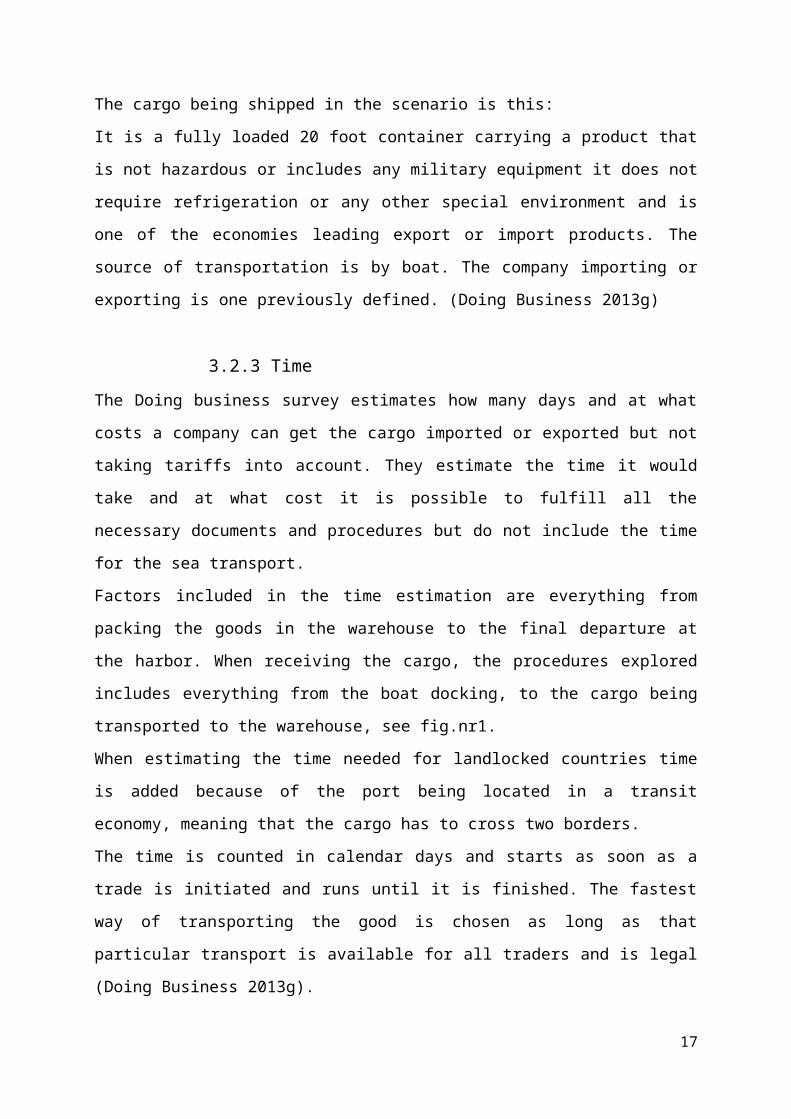
Factors included in the time estimation are everything from packing the goods in the
warehouse to the final departure at the harbor. When receiving the cargo, the procedures
explored includes everything from the boat docking, to the cargo being transported to the
warehouse, see fig.nr1.
When estimating the time needed for landlocked countries time is added because of the port
being located in a transit economy, meaning that the cargo has to cross two borders.
The time is counted in calendar days and starts as soon as a trade is initiated and runs until it
is finished. The fastest way of transporting the good is chosen as long as that particular
transport is available for all traders and is legal (Doing Business 2013g).
.
Fig. nr 1 (Doing Business 2013g)
12
3.2.4 Documentation
All trade requires a set of documents being signed and presented. Both import and export
documentation is taken into account in the Doing Business scenario. Every new shipment
requires a new contract, signed and agreed upon from both parties. Clearance from all parties
concerned, customs, port officials, ministries and other control agencies need also to be in
order. Payment is done by a letter of credit meaning that all relevant bank documents are
taken into account as well. Some documents are not taken into account; the sort of documents
that are renewed on annual basis (Doing Business 2013g).
3.2.5 Costs
Costs that are included in the scenario are (Doing Business 2013g):
The rental of a container,
Costs for documents
Administrative fees
Port related charges and inland transportation.
Costs that are not included are:
Customs tariffs
Duties
Other costs related to sea transports
3.3 Data problems and question marks
The data provided by Doing Business can be considered to be the most comprehensive. It
covers 185 economies and several observations but is not flawless. Some apparent issues are
the standardization of the survey and all assumptions made regarding the standardization. For
example, not all trade is situated in the largest cities of the analyzed countries. Large countries
such as China, Russia and the USA may have big differences in trade procedures within
different regions of the country. Another example concerns the fact that the data does not
present any differences between products or between large and small firms (Doing Business
2013h). Further, the data is country specific, meaning that if, for example, Sweden sends the
same cargo to Denmark or to Chad the data does not take into account the differences in trade
procedures between the two receiving countries even though, sending the same cargo to Chad
most likely requires more time and money than sending it to Denmark. Another problem with
13
the data is that it is scarce in time series variation. The data is mainly based on cross-sectional
variation between countries. Concerns with lack of time series variation is based upon the
difficulties with controlling the data for unobserved heterogeneity (Persson 2012b).
3.4 Trading across borders the dependent variableThe aim is to analyze how different independent variables and regional whereabouts alter the
number of days it takes to comply with import procedures. The independent variables are
therefor to be tested against how many days it takes to import the cargo. To get a better
overlook table nr 1 and nr 2 will present the economical and regional spread in number of
days it takes to comply with import procedures while table nr 3 presents further classifications
of interest.
3.4.1 Economical and regional spread
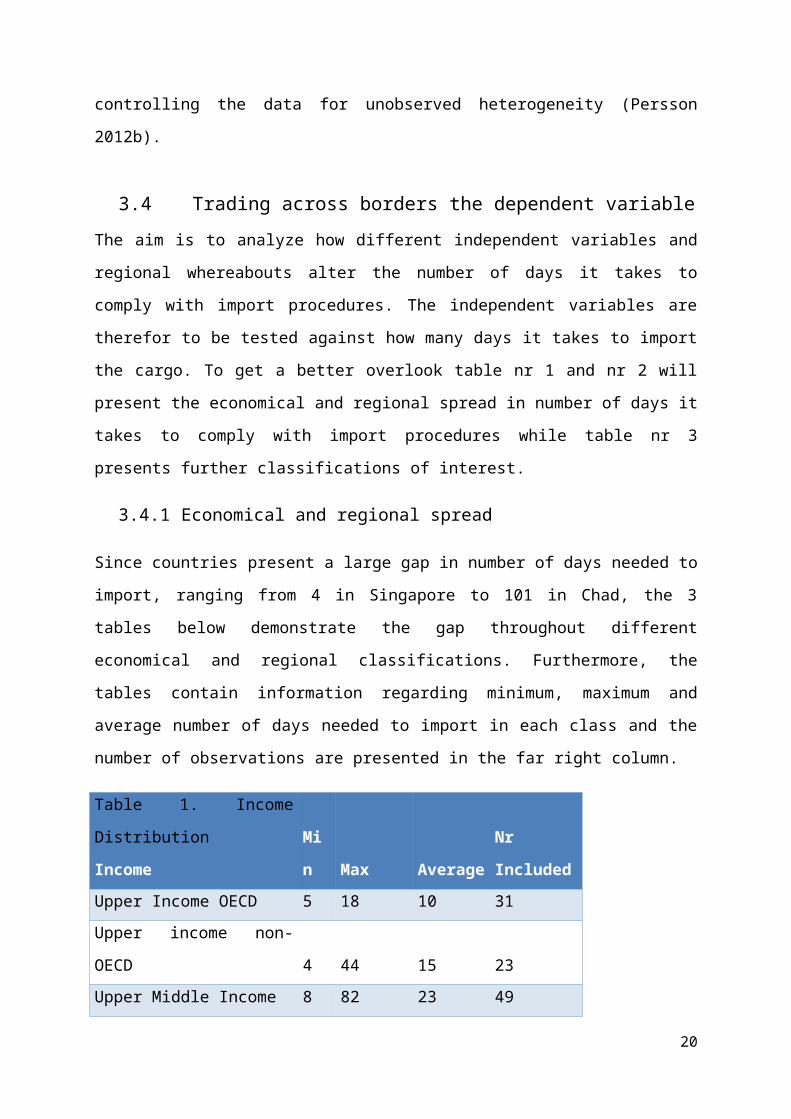
Since countries present a large gap in number of days needed to import, ranging from 4 in
Singapore to 101 in Chad, the 3 tables below demonstrate the gap throughout different
economical and regional classifications. Furthermore, the tables contain information regarding
minimum, maximum and average number of days needed to import in each class and the
number of observations are presented in the far right column.
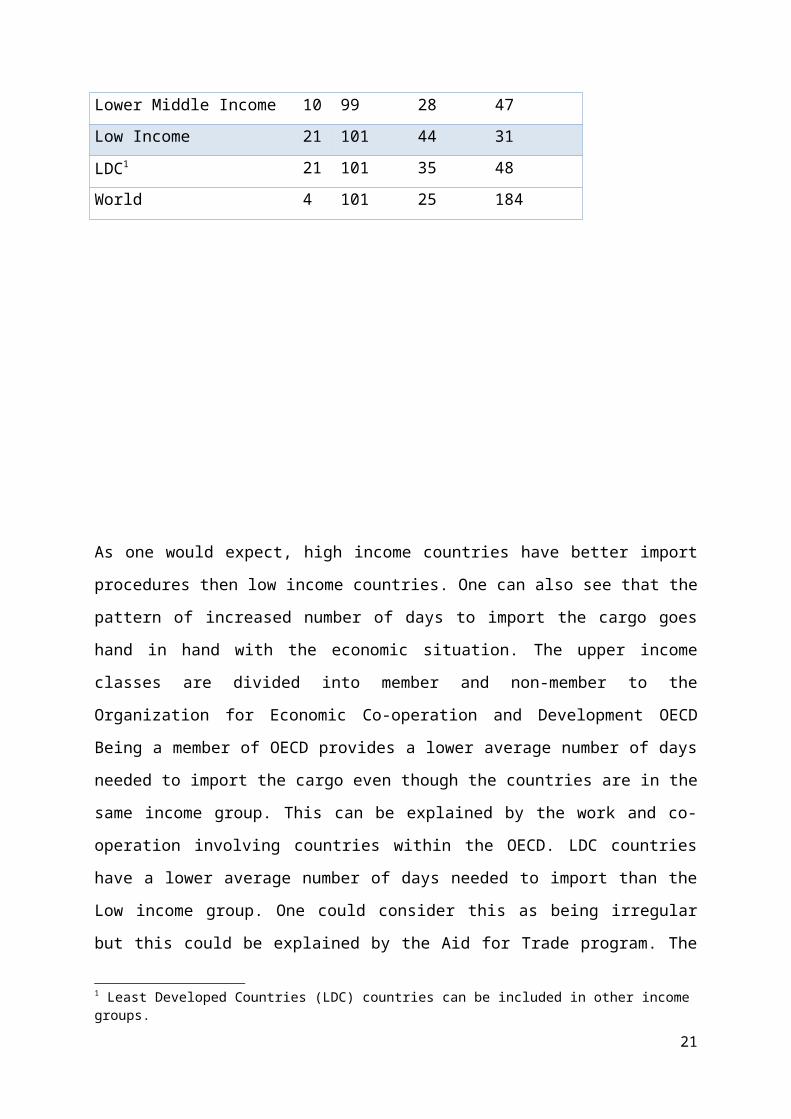
Table 1. Income Distribution
Income Min Max Average
Nr
Included
Upper Income OECD 5 18 10 31
Upper income non-OECD 4 44 15 23
Upper Middle Income 8 82 23 49
Lower Middle Income 10 99 28 47
Low Income 21 101 44 31
LDC1 21 101 35 48
World 4 101 25 184
1 Least Developed Countries (LDC) countries can be included in other income groups.
14
As one would expect, high income countries have better import procedures then low income
countries. One can also see that the pattern of increased number of days to import the cargo
goes hand in hand with the economic situation. The upper income classes are divided into
member and non-member to the Organization for Economic Co-operation and Development
OECD Being a member of OECD provides a lower average number of days needed to import
the cargo even though the countries are in the same income group. This can be explained by
the work and co-operation involving countries within the OECD. LDC countries have a lower
average number of days needed to import than the Low income group. One could consider
this as being irregular but this could be explained by the Aid for Trade program. The Aid for
Trade program assists countries by giving donations in order for them to work on their trade
procedures (WTO 2013).
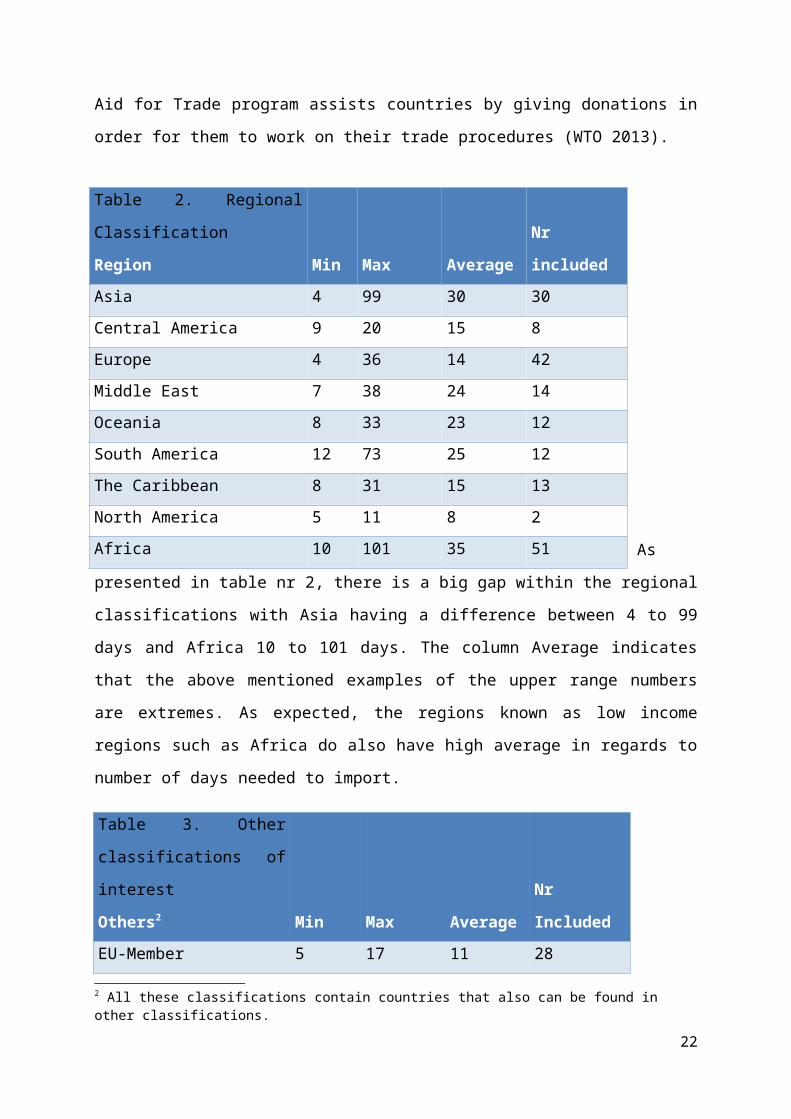
As presented in table nr 2, there is a big gap within the regional classifications with Asia
having a difference between 4 to 99 days and Africa 10 to 101 days. The column Average
indicates that the above mentioned examples of the upper range numbers are extremes. As
expected, the regions known as low income regions such as Africa do also have high average
in regards to number of days needed to import.
15
Table 2. Regional Classification
Region Min Max Average Nr included
Asia 4 99 30 30
Central America 9 20 15 8
Europe 4 36 14 42
Middle East 7 38 24 14
Oceania 8 33 23 12
South America 12 73 25 12
The Caribbean 8 31 15 13
North America 5 11 8 2
Africa 10 101 35 51
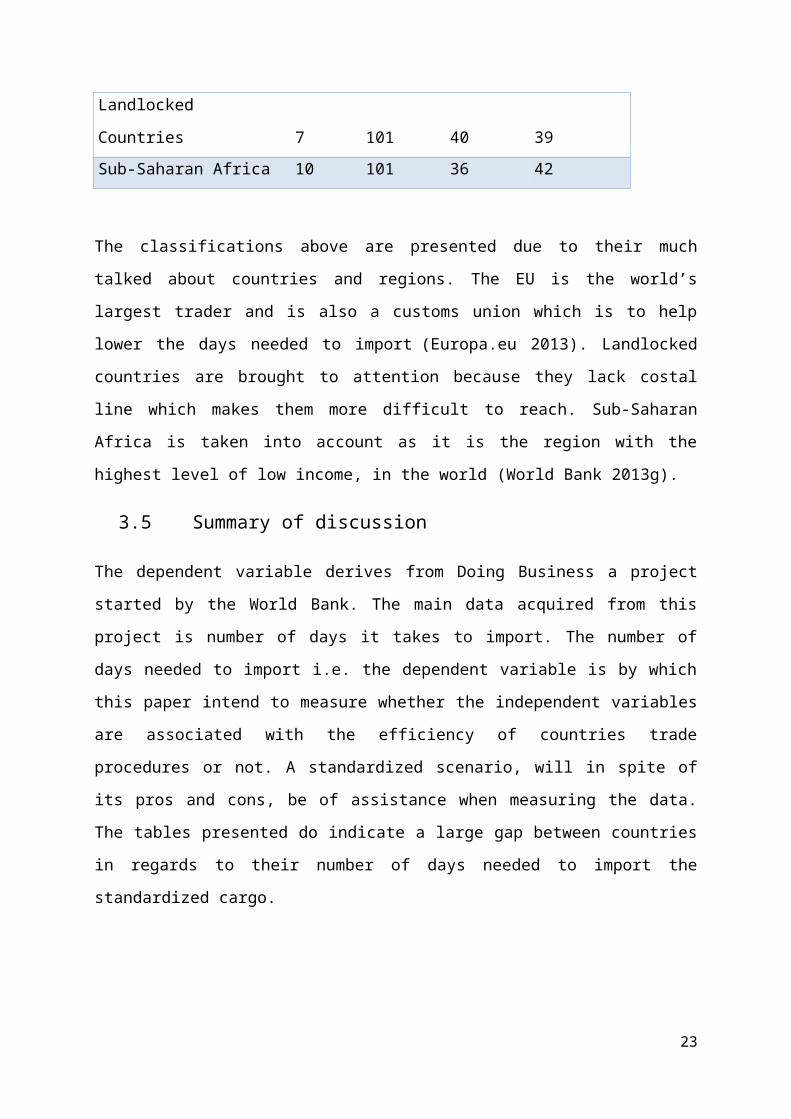
Table 3. Other classifications
of interest
Others2 Min Max Average Nr Included
EU-Member 5 17 11 28
Landlocked Countries 7 101 40 39
Sub-Saharan Africa 10 101 36 42
The classifications above are presented due to their much talked about countries and regions.
The EU is the world’s largest trader and is also a customs union which is to help lower the
days needed to import (Europa.eu 2013). Landlocked countries are brought to attention
because they lack costal line which makes them more difficult to reach. Sub-Saharan Africa is
taken into account as it is the region with the highest level of low income, in the world (World
Bank 2013g).
3.5 Summary of discussion
The dependent variable derives from Doing Business a project started by the World Bank.
The main data acquired from this project is number of days it takes to import. The number of
days needed to import i.e. the dependent variable is by which this paper intend to measure
whether the independent variables are associated with the efficiency of countries trade
procedures or not. A standardized scenario, will in spite of its pros and cons, be of assistance
when measuring the data. The tables presented do indicate a large gap between countries in
regards to their number of days needed to import the standardized cargo.
2 All these classifications contain countries that also can be found in other classifications.
16
(4) Previous research
In regards to trade facilitation, much research can be found. Research on trade facilitation is
most often done with a gravity model and this model has been used for many years, many
years during which the researchers have switched the focus from trade preferences to trade
facilitation.
In early regression the researchers looked more upon trade preferences. Sapir (1981) did an
early such regression where he tested the impact of the EU’s Generalized Scheme of
Preferences (GSP) in which he finds a significant positive effect on trade creation. Oguledo
and MacPhee (1994) and Nilsson (2002) also used and developed the gravity model, when
they tested the GSP effects on trade creation in the Mediterranean and Lomé3 countries. These
three papers all made important contributions to demonstrating the positive effects of
preferences. These papers tested the impact of trade preferences but did not make it possible
to check for unobserved heterogeneity between countries.
The gravity model continues to be developed and used but more often in regards of the impact
of trade facilitation instead of trade preferences;
Wilson et al. (2003) analyzed the relationship of trade facilitation and trade flows in the Asia
Pacific region. They demonstrated results that implied that aiming for improved trade
procedures has a positive and significant effect on trade flows. Wilson et al (2005, 2006)
continues the work with the effects of trade facilitation on trade flows during the forthcoming
years and demonstrates significant results and positive trade flows in there analyses.
More research with the topic being effects of trade facilitation on trade flows, using the
gravity model;
Djankov et al. (2010) estimated the effect on trade flows by using the number of days needed
to export a standardized cargo (derived from Doing Business). They found that each
additional day the cargo is being delayed, prior to shipment, reduces trade by 1%. Bourdet
and Persson (2012) further pointed out that the EU does not have harmonized practice when it
comes to trade procedures. This affects countries outside the EU exporting to an EU-member
country in the way that they face different trade barriers depending on which country they are
exporting to. Furthermore Bourdet and Persson (2012) simulates an example that
demonstrates that the aggregated exports from non-EU countries to EU countries would 3 http://ec.europa.eu/europeaid/where/acp/overview/lome-convention/index_en.htm
17
increase by 20% if the EU countries all made reforms, to reach the level of the most efficient
trading country within the Union.
Even further research in the topic has been done by Sadikov (2007), Lee and Park (2007) and
Iwanow and Kirkpatrick (2007). There are more papers than this regarding the effects of trade
facilitation on trade flows.
Analyzing previous data and research in order to find papers that examine the reasons behind
why countries have efficient or inefficient trade procedures, little has been found. The
examples of previous research, as discussed above, all explore the topic of trade facilitation in
regards to the effect on trade flows; how much trade would increase or decrease if reforms
should be done or left undone. No article found explains what the underlying important
variables are for why some countries have efficient or inefficient trade procedures.
This paper aims to examine and explore the variables in order to find out why some countries
perform better in regards to trade procedures while other countries struggle.
18
(5) Model Specification.
To measure if the independent variables have a significant impact on trade procedures an
econometric model has been built up. A multiple-linear regression with the Ordinary Least
Squares (OLS) method will be used with the aim to check if the independent variables
demonstrate a significant result, thus having association with the dependent variable. Due to
the fact that there is no previous research similar to the one of this paper there is no
underlying theoretical model to follow. The chosen dependent variables are viewed from the
importing side. The reason, why import-, was chosen over export procedures is that import
procedures is thought to be better at catching the poor and other not so well off countries
problems better. Countries with income in the lower regions in some cases do not have
anything or very little to export; no industry production and the agricultural output may be
direly needed on the domestic market. These countries even though they do not export still
need to import to cover for food shortages and other essentials in order to keep the country
afloat. Import procedures still catch the upper income countries efficiency since they can
afford to import products and improve their import procedures.
The regression has been tested with both logged and unlogged variables. After thorough
testing it was concluded that the regression with the best functional form has the dependent
variable, days to import, and the independent variable GDP logged. As there is no underlying
model or previous research to establish the regression upon the results in this paper will be
interpreted as if the independent variables have an association with the dependent variable. In
other words, it cannot be concluded that a significant coefficient for one of the independent
variables demonstrates that there is a causal effect on number of days needed to import.
The model will be gradually built up by adding one independent variable at a time to see if
they generate a significant result. The null hypothesis is that the variable has no association
with the number of days needed to import and if there are reasons to reject the null hypothesis
it means that the variable(s) has an association with number of days needed to import.
H0: No significant association with trade procedures.
H1: A significant positive or negative association trade procedures.
19
5.1 Independent variables
By using a multiple linear regression model with the OLS method this paper aims to find if
the independent variables demonstrate a significant result, being associated with efficient or
inefficient trade procedures. Most of the independent variables have been gathered from the
World Banks data section. The World Bank has collected data on several hundreds of
indicators of world development (World Bank 2013a). Some of the data has been collected
from the “Integrated Network for Societal Conflict Research” (INSCR) (INSCR 2013a). The
INSCR has provided data that has coded the level of democracy, countries experience for the
moment4. The regional and economical classification is also assembled from the World Banks
data section, but this time from their “By country” part of the data (World Bank 2013b).
5.1.1 Variable presentation and predictions5
GDP
GDP/Capita
Democracy score (scale 0-10, 1 is weak 10 is strong)
Net Official Development Aid per capita (Net ODA).
Strength of legal rights (Economic matters) (scale 1-10, 1 is weak 10 is strong).
Number of internet user per 100 people.
Income from agriculture as a percentage of GDP
Percentage of people living under the poverty line, i.e. less than $1.25 a day.
Habitants living in urban areas, percentage from total population.
The independent variables have been chosen with the prediction that they will demonstrate a
significant association with trade procedures. If they demonstrate significant results it would
mean that the variable in question is associated with an increase or decrease in the number of
days needed to import. The variables will be presented with a prediction on how they will
affect trade procedures, positively or negatively. A positively signed variable is not preferable
in regards to trade procedures as this indicates that the variable is associated with more days
needed to import the cargo. A negatively signed variable is preferable since this indicates that
the variable is associated with fewer days needed to import the cargo. The independent
variables have been tested to see if they demonstrate signs of too high correlation, however no
evidence of that has been found. The correlation report is to be found in appendix C.
4 More information about the coding is found in appendix B.5 Definitions and data sources are found in appendix B.
20
GDP is of focus with the motivation that large economies are more likely to have good
trade facilitation and it may be argued to be one of the more important variables.
Countries with high level of GDP but not necessarily a high level of GDP/Capita may
have an economy of scale. Large economies are more likely to be able to take the sunk
cost of implementing a new, for example, data system while a smaller economy may
not afford such an implementation. A high level of GDP is likely to have a negative
association with the number of days needed.
A high level of GDP/Capita may indicate that countries have sufficient recourses to be
able to improve trade procedures. It is likely that a high level GDP/Capita is linked
with efficient trade procedures i.e. associated with fewer days needed to import.
Democracy is an important variable for this regression. The prediction to this variable
is that a high score is to lead to fewer days to import goods. A stable democracy
indicates a better company climate. Firms operating in countries with a fragile political
situation and where sudden change in laws might arise may be less inclined in
investing money to lobby for better trade procedures. Taking the hit of a large sunk
cost or spending millions on lobbying for more efficient and better trade procedures
that might not still lead to an improved situation, is too big of a risk for most firms to
take.
Net ODA is a variable indicating how much aid a country obtains per capita. A
country that obtains a lot of aid indicates economic trouble or the fact that it suffers
from large inequalities. This does not always mean that a high number of net
ODA/capita will always have a positive association with the dependent variable. The
reason for this is that net ODA is sometimes given under the expression “Aid for
Trade” (WTO 2013). This implies that countries may get ODA in order to improve
their trade procedures. Net ODA/capita may have both positive and negative
association with the number of days needed to import.
Strength of legal rights when it comes to economic matters is a way of measuring the
security for borrowers and lenders; that the security formed by laws and obligations in
regards to bankruptcies and collateral matters are followed. A high score in this
variable is linked with better security for borrowers and lenders. More security
involving borrowing and lending money should make for a healthier corporate climate
resulting in more firms operating on the market. Many companies on the same market
could result in co-operations. Co-operations to ensure that the domestic market stays
competitive on the international market by lobbying for better trade procedures. A
21
high score in strength in legal rights is likely to be negatively associated with number
of days needed to import.
Number of internet users per 100 people, is a way of looking at the technical advances
a country has undertaken. The access to internet is to make it easier to get hold of
information and simplify the coordination of trade. If a document can be delivered via
internet instead of by a physical paper delivered to an office, importing procedures are
to be handled more rapidly. More internet users per 100 people are to be linked with
better trade procedures i.e. have a negative association with the number of days
needed to import.
The number in percent of total GDP that is made up from agriculture. Many
agricultural products, like grains for example, can be stored for longer periods of time
without being spoiled. The possibility to store grains for longer periods of time
without them being spoiled can be a reason to low political demands to reform the
situation; this since nothing or little is going to waste anyways. High percentage of
GDP made up from agriculture is likely to have a positive association with trade
procedures thus being associated with more days to import the cargo.
Having lots of people living under US$1.25 a day is a variable indicating that
countries have less money to reform or improve their trade procedures. This is often
the least well countries in the world and trade procedures are not the top priority of
their agenda. Having lots of people living on US$1.25 a day is most likely to have a
positive association with trade procedures which means that it is associated with more
number of days needed to import.
A larger percentage of people living in urban areas out of the total population may
indicate that there is a shorter distance between producers to transporter to harbor. It
could also be seen as a way of technical improvements. When countries become
industrialized they tend to also get larger populations living in urban areas (BBC
2013). More people living in urban areas ought to be linked with a negative result on
trade procedures i.e. having a negative association with the number of days needed to
import.
5.2 Country classifications
22
A selection of country regressions will also be executed in this paper. The country
classifications are a way of examine if some parts of the world are especially efficient or
inefficient at dealing with import procedures. The reason to why these regions are bad or good
trade performers is correlated with the above discussed indicators. For example a Least
Developed Country (LDC) is more likely to have few internet users. Doing a regression with
country classifications is a way of testing all variables at the same time but not knowing
which variable that has an impact on trade procedures. In all country classifications a
reference group is needed and in all regressions the reference group will be linked to Europe.
This because Europe is a part of the world with generally low average number of days needed
to import. The different classifications are presented above in tables 1, 2 and 3. The results
from these tests are presented in appendix D.
5.2.1 Country predictions
Country regressions may be argued to be easier to predict and more valid in their results since
they include all countries, and it therefor will be a large number of observations. An
additional reason would be that a larger number of variables will be included, measurable or
not. This is to generate several significant results. A general prediction is that African
countries will have positive signs in front of their b-value meaning that they would need more
days to import goods in comparison to the European countries they are referenced to. The
same is predicted with Middle East, South American and Asian countries.
It is harder to guess what sign the b-value will indicate in regards to the prediction for
Oceania, North America and the Caribbean. North America may be argued to be near Europe
in its results however due to fewer countries the variance in the number of days needed to
import is to be lower. They should all have a negative b-value indicating that they need fewer
days to import goods.
Regions or country groups of particular interest will have a regression as well. These regions
or country groups are as following:
LDC
Sub-Saharan Africa
Landlocked countries
EU-members.
23
This regression will use EU-members as a reference group. Sub-Saharan Africa is
included because of being the least well off region in the world, as well as the only region
of the above mentioned, where poverty headcount is still increasing (World Bank 2013c).
Prediction regarding these three groups is that the b-value will be positive suggesting that
these countries will be associated with more days needed to import.
5.3 The Model
Equation 16:
ln(Days to import) = β1 + β2ln(GDP) + β3GDP/Capita + β4Democ + β5Strength of legal rights
+ β6%urban population + β7Agriculture%/GDP + β8%of people living on >US$1.25 a day +
β9Net ODA/capita + β10Internet users/100 people + ε
Having included all independent variables the model looks like equation 1. The above model
is what will be utilized in this paper. The results will be shown in a step by step fashion,
adding one variable at a time. If one or more of the variable(s) demonstrates a significant
result we can conclude that the null hypothesis can be rejected and the variable(s) in question
are associated with a change in how many days it takes for countries to import. The β1 is the
intercept of the regression followed by the variables β-values which shows how big impact
the different variables have on the dependent variable. The ε is the error term.
5.4 Limitations with the regression
There are a few limitations in regards to the usage of a multiple-linear regression. Firstly, the
data being used in this paper is far from all variables that have an impact on trade procedures.
Interesting variables that one could have included in this research could for example have
been Research and Development percentage out of total GDP; however the data in regards to
this variable was far from complete, which resulted in too few observations. Furthermore the
limited access of data is a further major reason behind the exclusion of interesting variables in
this paper. Variables had to be excluded due to the fact that they were not measurable or very
hard to measure. Difficult variables to measure could be for example, cultural aspects that
6 From this point the logged variables i.e. Days to Import and GDP, will in text be referred to as just Days to Import and GDP without the ln. In equations and tables their correct form will be used; with ln.
24
may still however be considered to be an important factor in regards to efficient or inefficient
trade procedures.
When having to exclude data that may be important to trade procedures due to the lack of
observations another problem may occur. The regression could now be argued to suffer from
omitted-variable bias, meaning that the model created does not contain the necessary
variables. What happens is that the regression tries to compensate for the missing variables
which may result in an over/under estimation on the effect off the variables included.
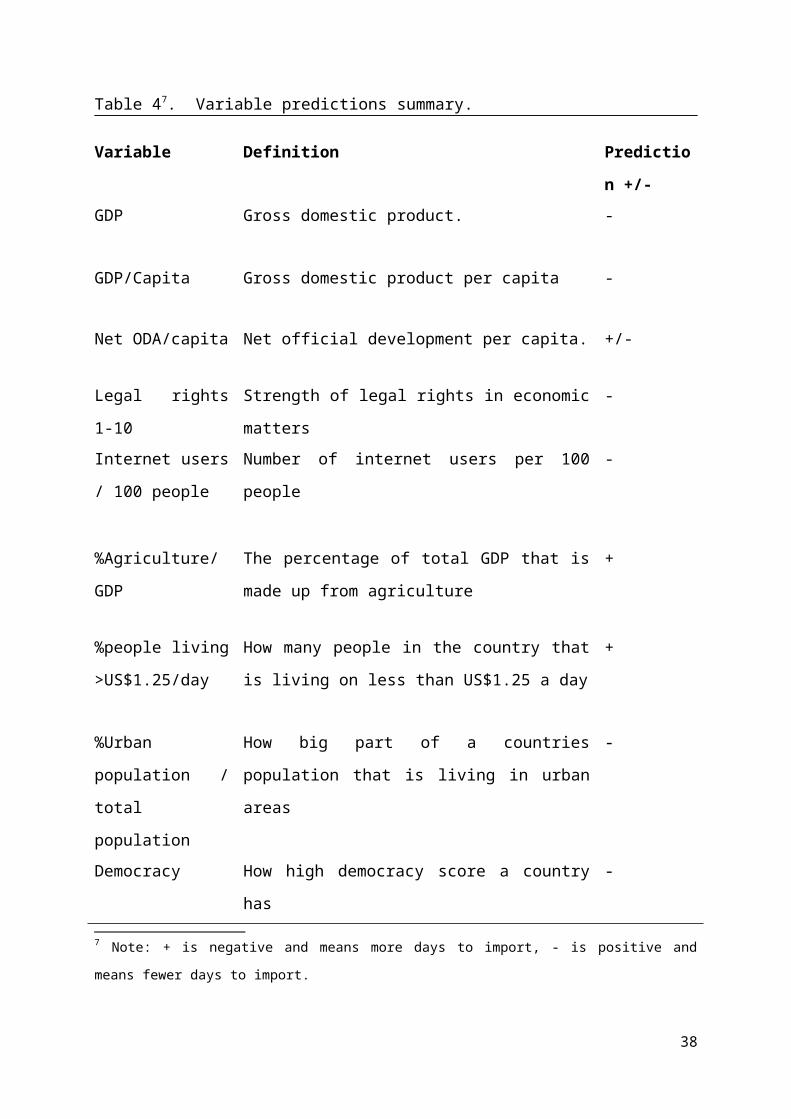
5.5 Summary of discussion
By using a multiple linear regression model with the OLS method this paper aims to analyze
if the independent variables demonstrate a significant result. If they do they are associated
with trade procedures in one way or the other i.e. they predict if a country needs more or less
days to import. Some of the variables have been logged because this seems to have generated
the best functioning form for the model that is presented in equation 1. Predictions on how the
independent variables most likely will behave have been made and are to be found in table 4
below. A problem with the regression can be argued to be the lack of variables due to either
insufficient data or immeasurable data. The exclusion of variables may lead to the regression
suffering from omitted-variable bias. Regional testing will be executed; regions and the test
results are found in table 1, 2 and 3 and in appendix D.
25
Table 47. Variable predictions summary.
Variable Definition Prediction
+/-
GDP
GDP/Capita
Gross domestic product.
Gross domestic product per capita
-
-
Net ODA/capita Net official development per capita. +/-
Legal rights 1-10 Strength of legal rights in economic matters -
Internet users / 100
people
Number of internet users per 100 people -
%Agriculture/GDP The percentage of total GDP that is made up from
agriculture
+
%people living
>US$1.25/day
How many people in the country that is living on less
than US$1.25 a day
+
%Urban population /
total population
How big part of a countries population that is living
in urban areas
-
Democracy How high democracy score a country has -
(6) Baseline regression7 Note: + is negative and means more days to import, - is positive and means fewer days to import.
26
The regression will be built up gradually adding one independent variable at a time to in the
end include all 9 independent variables. The complete regression results can be found in table
5. Two robustness checks are located in appendix E.
Like mentioned earlier the results will be derived as if the independent variable is associated
with a change in the number of days needed to import. Since the regression has been built up
with some variables logged and some not it is difficult to interpret the numeric value of the
independent variables b-value. What is important is the sign in front of the b-value, negative
or positive along with a significant result.
6.1 Results and analysis
The regression demonstrates several significant results with the best results derived from
column 8. The results will be analyzed one column at a time in order to see what happens with
the already added variables when adding a new one. All results can be found in table 5 below.
Starting at column number 2 we can conclude that the significance falls for GDP and it stays
above significance throughout the regression. The recently added GDP/Capita demonstrates a
significant result at a 1% level meaning that the variable has an association with trade
procedures. This impact is associated with countries needing fewer days to import since the b-
value for this variable displayed a negative result (-2,19E-5).
Adding democracy to the regression (column 3) do not change the result from column 2
meaning that GDP stays being not significant and GDP/Capita stays significant at a 1% level,
the newly added democracy variable enters the regression at a 1% significant level with a
negative b-value (-0,043). With these three variables added to the regression we can conclude
that two of them are demonstrating a significant result with a negative association with trade
procedures suggesting that they are both associated with fewer days needed to import.
In column number 4 the added variable is strength of legal rights. The variable is added and
displays a result significant at a 10% level with a b-value that is negative (-0,034). Strength of
legal also demonstrates a significant result that is associated with trade procedures. Strength
of legal rights is associated with fewer days needed to import. Democracy and GDP/Capita
stays significant at a 1%level while GDP is still not significant.
Column 5 adds the variable percentage of urban population to the regression. While the newly
added variable starts of significant at a 1% level and having a negative b-value (-0,009),
27
suggesting that it is associated with fewer days needed to import, we can notice that this
variable has an impact on the significance of the variable strength of legal rights. Strength of
legal rights was in column 4 significant at a 10% level but when adding percentage of urban
population the strength of legal rights becomes significant at a 1% level. The 6th column adds
percentage of agriculture to the regression. Adding percentage of agriculture has an impact on
the significance on both percentage of urban population and the strength of legal rights
variables. They both fall from 1% significance to a 5% significance level meanwhile
Democracy stays significant at the 1% level. The most recent added variable, percentage of
agriculture out of total GDP is demonstrates a significant result at a 5% level and shows a
positive b-value (0,010). Percentage of agriculture out of total GDP appears to be associated
with more days needed to import.
Jumping to column 8 we see that 2 new variables has been added, percentage of people living
on US$1.25 or less per day and net ODA/Capita. No one of these two added variables
demonstrates a significant result thus being associated with trade procedures. With these 2
variables added the significance level has fallen from the 5% level to the 10% level for the
variables Strength of legal rights and percentage of urban population. GDP/Capita and
democracy stay significant at the 1% level and GDP is far away from demonstrating a
significant result.
So far the regression contains 8 out of the 9 variables and the results follow the predictions
made earlier. GDP/Capita, democracy, strength of legal rights and percentage of urban
population all demonstrates significant results demonstrating an association with trade
procedures, they all are associated with fewer days needed to import, while percentage of
agriculture out of total GDP has a positive b-value which like predicted means that it is
associated with more days needed to import.
Finally Internet users per 100 people are added to the regression (column 9) and enter at a 1%
significance level and display a negative b-value (-0,011). Countries with many people being
able to access the internet seem to have efficient trade procedures. With internet users added
the rest of the earlier significant results are overthrown completely. The only variable that
stays significant is the democracy variable.
The GDP variable is only significant when being the only added variable (column 1). As soon
as the model is built out with more variables the GDP significance falls. This result was not
expected. The expected fall out of the GDP variable was that it is likely to show a negative b-
28
value thus being associated with fewer days needed to import. The discussion regarding GDP
concerned economies of scale. Large economies like China, Japan or the USA could have
economies of scale regarding the implementation of reforms concerning trade procedures. The
sunk cost of implementing a new more efficient data system or improve harbor facilities is not
associated with a high GDP in this regression.
GDP/Capita demonstrates a significant result at a 1% level through most of the regression
with negative b-values which suggests that, like predicted, countries that has more recourses
are associated with fewer days to import. With sufficient recourses a country is able to use
more money to improve trade procedures, for example expanding the infrastructure.
The Democracy variable is showing significant results in every stage of the regression and
continuously on a 1% level. As predicted with the Democracy variable it has a b-value that is
negative. Countries with higher score in democracy are associated with fewer days to import.
The impact on trade procedures that derives from having a good democracy may be due to the
political stability that democracy often leads to. When running a company in countries with
bad functioning or non-existing democracies there are or might be uncertainties with the
political situation. If a company cannot be sure that they can stay in the country for a long
period of time without interruptions due to war or a sudden change in laws etc. they are not
inclined to work for reforms. Calling for reforms and when they are implemented be kicked
out of the country or shut down is a cost most companies cannot take.
Strength of legal rights demonstrates significant results more or less throughout regression
(not column 9). Countries with higher rating regarding strength in the legal system seem to be
associated with countries that need fewer days to import goods. The significance regarding
strength of legal rights suggests that a high rating improves trade procedures. The association
between strength of legal rights and fewer days needed to import may be due to the fact that if
companies trust the legal system they might be more proactive in making reforms to enhance
trade procedures even more. In the case with strength of legal rights there are reasons to
believe that there might be another underlying variable that predicts both strength of legal
rights and days to import and as a result a high score in strength of legal rights may be equal
to fewer days needed to import even thou strength of legal rights have not had an effect on
how many days a country needs to import.
The variable, percentage of people living in urban areas out of total population, was predicted
to have a negative b-value which has also been demonstrated to be true. The significance level
29
on this variable has declined during the regression from being significant at a 1% level when
being the newly added (column 5) variable to only be significant at a 5% level after adding
percentage of agriculture (column 6) and with the latest two variables added (column 7 and 8)
only be significant at a 10% level. This could be interpreted as an indication that percentage
of urban population might not stay significant if we had more variables to include in the
regression. In this regression thou a high percentage of people living in urban areas are a
significant factor concerning efficient trade procedures. The predictions suggested that
percentage of urban population could be an important factor regarding efficient trade
procedures due to the fact of everything being close by. If there are efficient facilities in an
urban area, close to the harbor, transporter, and producers etc. it is easier to set up a new
business there instead of in a rural area where the facilities are not as efficient and the
distances are greater.
Percentage of agriculture out of total GDP demonstrates a significant result at the 5% level
and has a positive b-value. The prediction regarding the agricultural variable said that a high
value is likely to be associated with more days needed to import i.e. inefficient trade
procedures. The predicted positive b-value was discussed regarding the storage potential of
grains. A farmer can store a seasons harvest in order to wait for prices to rise (Masterson
2012). This gives the companies and people working in the agricultural sector time to plan
imports thus making it easier to deal with the time differences needed to import between
countries. This could lead to fewer demands and less political will to change the already
working situation.
6.2 Baseline regression conclusion
To summarize the baseline regression it can be concluded that significant results were found
suggesting that concerned variables have an association with trade procedures. By excluding
the last column (9) the variables that entered the regression at a significant level stayed
significant throughout, with the one exception being GDP which was only significant when
being the sole independent variable. Some variables could not stay as significant as they
started out during the adding of variables to the regression, these are strength of legal rights
and percentage of urban population. Both these two variables dropped from 1% to 10%
significance during the regression, this could be an indicator that they might not stay
significant if more variables were to be added to the regression.
30
Variables Info. 1 2 3 4 5 6 7 8 9ln_GDP b-value -0,059** 0,017 -0,018 -0,034 -0,003 -0,004 -0,006 -0,015 -0,011
Sig. 0,025 0,454 0,490 0,108 0,891 0,854 0,802 0,588 0,674GDP/Capita b-value -2,19E-5*** -1,80E-5*** -1,36E-5*** 0,000***8 -1,03E-5*** -1,02E-5*** -1,03E-5*** -2,83E-6
Sig. 0,000 0,000 0,000 0,000 0,000 0,000 0,000 0,426Democracy b-value -0,043*** -0,059*** -0,050*** -0,039*** -0,040*** -0,040*** -0,034***
Sig. 0,003 0,000 0,000 0,003 0,003 0,003 0,010Strength of legal rights b-value -0,034* -0,048*** -0,037** -0,037** -0,036* -0,017
Sig. 0,055 0,007 0,044 0,045 0,052 0,375%Urban population/Total poulation b-value -0,009*** -0,006** -0,005* -0,005* -0,002
Sig. 0,000 0,035 0,053 0,053 0,514%Agriculture/Total GDP b-value 0,010** 0,010** 0,010** 0,005
Sig. 0,016 0,020 0,021 0,268%of people living on >US$1,25/day b-value 0,002 0,002 0,000
Sig. 0,479 0,527 0,927Net ODA/capita b-value 0,000 0,000
Sig. 0,535 0,366Internet users/100 people b-value -0,011***
Sig. 0,001N. 187 187 164 160 159 133 133 133 132Adj. R-sq 0,022 0,315 0,382 0,486 0,531 0,531 0,530 0,527 0,562R-sq 0,027 0,323 0,393 0,499 0,546 0,553 0,554 0,556 0,592***means statistically significant at a 1% level** means statistically significant at a 5% level* means statistically significant at a 10% level
8 (-0,000009384)
31
Table 5 Baseline regression
6.3 Robustness checks
In appendix E robustness checks can be found in tables 10 and 11. The robustness checks are
executed in the same fashion as the baseline regression by adding one variable at a time the
difference being that the dependent variable is now firstly number of documents to import and
secondly at what cost is the standardized cargo being imported.
The first robustness check (table 10) with number of documents required to import as a
dependent variable shows results almost the same as with the baseline regression, days to
import as dependent. Looking at column 8 we see that GDP/Capita, Democracy, Strength of
legal rights and percentage of urban population is showing significant values. The results also
have a b-value with the predicted results. The main difference is that Net ODA/capita
demonstrates a significant result and with a negative sign in front of the b-value. This result
suggests that Net ODA/Capita could lead to more efficient trade procedures. In the
predictions section this variable was said to be able to display results either way because of
the Aid for trade program. The negative b-value could be evidence that Aid for Trade is
working, that the ODA the country receives actually helps to improve trade procedures.
The second robustness check (table 11) the dependent variable is cost to import. This
robustness check differs quite far from the baseline regression. Only GDP/Capita and Internet
users per 100 people are significant. Internet users are significant but the b-value is positive,
meaning that more internet users per 100 people are not good for trade procedures when using
the cost to import as measure. GDP/Capita demonstrates a negative b-value like predictions.
As the two robustness regressions have different dependent variables that measure the trade
procedures association with how many days it takes to import it is not unexpected to see that
the results are not fully coherent to the baseline regression. However a pattern can be seen
between the robustness checks and the baseline regression, especially when documents to
import are the dependent variable, which strengthens the baseline regression.
6.4 Country regression
In these regressions countries have been divided into groups of different regional and
economical classifications, the regressions is done by computing dummy variables to be able
to include or exclude certain countries or regions in the regression. The dependent variable is
still days to import but with this regression we will examine if there are certain country
32
groups or regions that have especially efficient or inefficient trade procedures. A country
regression adds more variables to explain the difference in efficiency concerning trade
procedures thus giving a better prediction. The problem with a country regression is that one
cannot see which of the variables that have a significant impact on trade procedures. The
country regressions are located in Appendix D.
Three country based regression will be executed:
First a regression with the world’s official regions. With Europe being the region left
out as a reference group.
Then a regression with developing regions as listed by the World Bank. Europe and
Central Asia will be used as reference group.
The last one is other classifications of interests.
6.4.1 Country regression results
The first country regression, table 7 is performed with Official Regions having Europe as
reference group. One could suspect that the African continent should show significant results
with a positive sign in front of the b-value. Indeed they do, at a significance level of 1% they
have a positive sign in front of the b-value (1,142). Interpretation is that African countries
when compared to European countries have less efficient trade procedures. The same goes for
Asia (0,632), the Middle East (0,860) and South America (0,990). They all have significant
results with a positive b-value thus being associated with more days needed to import when
compared against Europe. North America is the only region that shows a significant result
with a negative b-value. This region has better trade procedures than Europe. Only the Central
American and Oceania countries are not demonstrating significant results when compared
against Europe.
It could be argued that even though it is not possible to see which variable that is having the
largest impact on the outcome for each of the regions, African countries in general have a low
GDP/capita. This is in line with what the earlier regression demonstrated; countries with a low
GDP/capita are in need of more days to import i.e. have inefficient trade procedures. The
same development can be seen in regards to Democracy and strength of legal rights. Many of
the countries in the areas with result that indicate that more days to import goods are needed
have unstable democracies or non-existing democracies. It could therefore be argued that a
low democracy rating is followed by a low rating regarding strength of legal right.
33
The second country regression (table 8) is based on developing regions as they are listed by
the World Bank. This time Europe and Central Asia is excluded as a reference group. All
developing regions demonstrate significant, at a 1% level, and positive b-value results.
Compared to the developing region Europe and Central Asia the other developing regions
have more inefficient trade procedures. The same arguments used in the first country
regression to explain the cause behind European countries more efficient trade procedures can
be argued to be applied to the second one as well.
The final country based regression (table 9) is executed with dummies over countries of
particular interest. LDC, landlocked and the Sub Saharan African countries are included.
Excluded from the group to be used as a reference group are the EU-member countries.
Against EU members the other groups display significant results and they all have a positive
b-value in line with predictions they have less efficient trade procedures than the EU-
members. In the case of landlocked countries the time needed to import is greater since they
have to bring the cargo from a transit port i.e. the cargo has to cross two borders before
reaching destination. The sub Saharan regions contains some of the poorest countries in the
world. This is why the positive b-value is not a surprise. Some countries in this region are also
landlocked countries and LDC: s, which mean that they are not just having financial problems
they also have to import via transit ports. When these transit ports are situated in countries
also suffering from bad economy and an unstable political situation the inefficient trade
procedures becomes burdensome.
6.5 Summary of discussion
All in all 6 regressions has been executed; most important being the baseline regression.
Several variables proved to be of significance regarding trade procedures as they were
associated with either more or less days needed for countries to import. GDP/Capita and
democracy are the two variables that best seem to predict if countries have efficient trade
procedures or not since they stayed significant almost through the entire regression. Strength
of legal rights, percentage of urban population and percentage of agriculture also displayed
significant results that followed the predictions. The country regressions displayed results
according to predictions. European countries in some constellation were used as reference
group in the country based regressions.
34
(7) Summary and conclusions
This paper aims to explore the underlying reasons behind the difference in efficiency
regarding trade procedures between countries. It is to explore if there are variables
systematically associated with efficient or inefficient trade procedures. The efficiency of trade
procedures is measured by looking at how many days it takes countries to import a
standardized cargo.
The baseline regression presented several variables that seem to be significant factors
concerning trade procedures. Especially GDP/Capita and democracy but also strength of legal
rights, percentage of urban population and percentage of agricultural output out of total GDP
proved to be significant. These variables all have an impact on trade procedures and being
associated with either more or less days needed to import. In the country regressions we used
European countries, in some constellation, as reference group, these regressions gave many
significant results with many positive b-values. The African continent and the South Asian
developing region for example both demonstrated positive b-values at a 1% level, suggesting
that these countries have inefficient trade procedures when compared against Europe.
GDP do not demonstrate significant results which might suggest that economies of scale do
not apply in regard to countries ability to be able to take the sunk cost of implementing a
reform in terms of enhancing their trade procedures. GDP/Capita demonstrated significant
results, probably due to the fact that countries with more resources are able to improve their
trade procedures. Efficient trade procedures are often related with countries that scores high
on the democracy rating. A stable political landscape appears to be an important factor
concerning efficient trade procedures. Having a big urban population is also associated with
needing fewer days to import which could be due to the closeness to transporter, production
facilities and harbor etc. Percentage of agriculture out of total GDP also had a significant
influence on import procedures. Countries with a higher percentage of agricultural output
were associated with more days to import goods. This may be due to the storage potential that
many agricultural products have.
Can policymakers learn from these results and improve trade procedures?
The variables in the baseline regression that demonstrated significant results are not the kind
of variables that are easy to improve. They are often the foundation concerning not just
efficient trade procedures but also the stability and progress a country has achieved during
35
many years. GDP/Capita or percentage of urban population cannot be raised by a political
mandate there is something beyond these variables that determines whether or not a country is
going to be able to improve trade procedures. In order to improve on these variables i.e.
improve trade procedures a more underlying reform must be undertaken. A reform that most
likely concerns all the significant variables from the bottom up must be implemented.
This paper is the first study of its kind and is to be seen as a contribution to the existing
literature that mainly is treating research in regards to the increase or decrease of trade flows
after simulating reforms affecting trade procedures. This paper distinguish itself from earlier
research as it aims to explore which variable(s) that is associated with efficient or inefficient
trade procedures and not taking trade flows in regard. Since this is the first essay of its kind
there is room for improvements: improvements could be to add more independent variables to
the regression thus getting a more explanatory regression. Mentioned earlier is that research
and development was a data set that had to be excluded due to the data being incomplete, a
completion of this data set and other data that suffers from the same problem would contribute
to the regression. If the possibility to add more variables to the regression was open the
potential problem regarding omitted-variable bias might be reduced which also contributes to
a more accurate regression.
The independent variables used in the baseline regression could be examined, if it is possible
to track the underlying reasons behind a countries, for example, large urban population there
might be easier to implement reforms to increase the in-migration to urban areas thus in the
long run improve trade procedures.
The empirical measure, days to import, used in this thesis might not be the best way of
measuring trade procedures, doing business alone has 5 more variables that could have been
used as a measure; the possibility to test which dependent variable that most accurate
measures trade procedures is an option that cannot be neglected.
The results derived in this thesis are to be regarded with some carefulness since the
standardized scenario used as the dependent variable is not to be regarded as real life. The
standardization is the best way of making the variable comparable but not perfect at getting
accurate results. That along with the thesis being the first of its kind with no underlying model
to proceed from has rendered the results to only be interpreted as if the variables are
associated with efficient trade procedures or not and not as if they have a causal connection to
trade procedures. With that said these results shall not be regarded as meaningless, the
36
variables demonstrated significant results inclining an association with efficient or inefficient
trade procedures, but as a start of a new approach when looking at trade procedures. A new
approach that today has its limitations but is open for improvements.
37
References
BBC (2013) “Urbanization in the MEDCs” Available at:
http://www.bbc.co.uk/schools/gcsebitesize/geography/urban_environments/
urbanisation_medcs_rev1.shtml
Bourdet, Y & Persson, M (2012). “Completing the European Union Customs Union: The
Effects of Trade Procedure Harmonization”. pp. 310-311. JCMS 2012 Volume 50. Number 2
Butterly, T (2003). “Trade Facilitation, The challenges for Growth and the Development”, pp.
43-44.United Nations Economic Commission for Europe. Available at:
http://www.unece.org/fileadmin/DAM/cefact/publica/ece_trade_299.pdf
Djankov, S., C. Freund and C.S. Pham (2010). “Trading on Time.” Review of Economics and
Statistics number 92 volume 1: 166–173.
Doing Business (2013). “Measuring Business Regulations”. Main site:
http://www.doingbusiness.org/
(2013a)http://www.doingbusiness.org/data/exploretopics/trading-across-borders
(2013b)http://www.doingbusiness.org/methodology/trading-across-borders
(2013c)http://www.doingbusiness.org/~/media/GIAWB/Doing%20Business/Documents/
Miscellaneous/What-is-Doing-Business.pdf
(2013d)http://www.doingbusiness.org/~/media/GIAWB/Doing%20Business/Documents/
Annual-Reports/English/DB13-Chapters/About-Doing-Business.pdf pp.23.
(2013e)http://www.doingbusiness.org/~/media/GIAWB/Doing%20Business/Documents/
Annual-Reports/English/DB13-Chapters/About-Doing-Business.pdf pp.16
(2013f)http://www.doingbusiness.org/~/media/GIAWB/Doing%20Business/Documents/
Miscellaneous/What-is-Doing-Business.pdf
(2013g) http://www.doingbusiness.org/methodology/trading-across-borders
(2013h) http://www.doingbusiness.org/methodology/methodology-note
Europa.eu (2013) available at: http://europa.eu/pol/comm/index_en.htm
38
Grainger, A (2008). “Customs and Trade Facilitation: From Concepts to Implementation” pp.
20. World Customs Journal vol 2, nr 1. Available at:
http://www.worldcustomsjournal.org/media/wcj/-2008/1/customs_and_trade_facilitation_fro
m_concepts_to_implementation.pdf
Hoekman, B.M & Kostecki, M.M (2009). ”The Political economy of the world trading
system”, third edition, pp. 604-605.
INSCR (2013a). Center for systematic peace. Available at: http://www.systemicpeace.org/
INSCR (2013b). “Polity IV project: Dataset Users’ Manual”. Available at:
http://www.systemicpeace.org/inscr/p4manualv2012.pdf pp.15.
Iwanow, T. and C. Kirkpatrick (2007). “Trade Facilitation, Regulatory Quality and Export
Performance.” Journal of International Development number19 volume 6: pp.735–753.
Lee, H. and I. Park (2007). “In Search of Optimised Regional Trade Agreements and
Applications to East Asia.” World Economy number 30 volume5: pp.783–806.
Masterson, K (2012) “Storing grain can aid farmers in commodity pricing”. Available at:
http://www.npr.org/2012/02/06/146453132/corn-storage-helps-farmers-in-commodities-
market
Nilsson, L. (2002). Trading Relations: “Is the Roadmap from Lomé to Cotonou Correct?”
Applied Economics number 34 volume4: 439–452.
Oguledo, V.I. and C.R. MacPhee (1994). “Gravity Models: A Reformulation and an
Application to Discriminatory Trade Arrangements”. Applied Economics number 26 volume
2: 107–120.
Persson, M. (2011). “Reaping the benefits of Deeper Euro-Med Integration through Trade
Facilitation” pp. 6
Persson, M (2012a) “Trade Facilitation and the Extensive Margin” pp. 4, 6-7. The journal of
international trade & economic development: an international and comparative review.
Sadikov, A. (2007). “Border and Behind-the-Border Trade Barriers and Country Exports.”
IMF Working Paper No. 07/292, Washington D.C.: International Monetary Fund.
39
Sapir, A. (1981). “Trade Benefits under the EEC Generalized System of Preferences.”
European Economic Review volume 15 number 3: pp.339–355.
Wilson, J.S., C.L. Mann and T. Otsuki (2003). “Trade Facilitation and Economic
Development: A New Approach to Quantifying the Impact.” World Bank Economic Review
volume 17 number3: pp 367–389.
Wilson, J.S., C.L. Mann and T. Otsuki (2005). “Assessing the Benefits of Trade Facilitation:
A Global Perspective.” World Economy volume 28 number6: pp.841–71.
Wilson, J.S., X. Luo and H.G. Broadman (2006). “Entering the Union: European Accession
and Trade Facilitation Priorities.” World Bank Policy Research Working Paper No. 3832,
Washington D.C.: World Bank
World Bank (2012) “Trade Facilitation”. Available at:
http://web.worldbank.org/WBSITE/EXTERNAL/TOPICS/TRADE/0,,contentMDK:2055036
9~menuPK:261317~pagePK:148956~piPK:216618~theSitePK:239071,00.html
World Bank (2013a): World Development Indicators online. Available at:
http://data.worldbank.org/indicator
World Bank (2013b): World Development Indicators online. Available at:
http://data.worldbank.org/country
World Bank (2013c): “Remarkable Declines in Poverty, but Major Challenges Remain”, Press
release, available at:
http://www.worldbank.org/en/news/press-release/2013/04/17/remarkable-declines-in-global-
poverty-but-major-challenges-remain
(WTO) World Trade Organisation (2013): ”Aid For Trade”. Available at:
http://www.wto.org/english/tratop_e/devel_e/a4t_e/aid4trade_e.htm
40
Appendixes
Appendix A
Regional-, Economical- and other classifications of interest.
All classifications are from the World Bank. It is their definitions of which countries that are
included in each and every one of the classifications, except for the Official Region (OR) data
set which are to be found from any map over the world.
The classifications used in the regression that comes from the World Bank are the following
(World Bank 2013b);
Developing Regions:
East Asia & Pacific
Europe & Central Asia
Latin America & The Caribbean
Middle East & North Africa
South Asia
Sub-Saharan Africa
Other classifications of interests:
EU-members
Least Developed Countries (LDC)
Landlocked Countries
41
Appendix B
Dependent variables.
The dependent variables are:
Days to Import (used in the baseline regression)
Documents to import (used in the robustness check)
Cost to import (used in the robustness check)
All available here: http://www.doingbusiness.org/data/exploretopics/trading-across-borders
Independent Variables.
The chosen indicators come from two different organizations. Most of the indicators come
from the World Banks data section and their indicators. The World Bank collects data from
214 countries and includes 330 indicators and has been doing so since 1960 (World Bank
2013a). The indicators that are being used from The World Bank’s data sight are:
Total GDP (current US$)
Gross Domestic Product (current US$)
- The sum of all gross value added by all resident producers in the economy plus
ant product taxes and minus all subsidies not included in the value of the
products. Data are in current US$. Dollar figures are converted from domestic
currencies using single year official exchange rates.
Net ODA/capita
Net official development aid per capita.
- How much financing, from multilateral institutions and from official agencies
included in the Development assistance committee (DAC)9 and from non DAC
countries, a recipient country gets. The donated money is to promote economic
development and welfare in a developing country. It is the DAC that lists the
countries eligible for ODA’s.
9 The DAC is the main donor countries in the world working together in defining and monitoring global standards in key areas of development. Members are: Australia, Austria, Belgium, Canada, Denmark, European Union, Finland, France, Germany, Greece, Ireland, Italy, Japan, Korea, Luxembourg, The Netherlands, New Zeeland, Norway, Portugal, Spain, Sweden, Switzerland, United Kingdom, United States, Czech Republic and Iceland.
42
Strength of legal rights. (Economic matters) Scaled 1-10.
- This is an index that measures the degree at which collateral and bankruptcy laws
protect the rights of borrowers and lenders and therefore facilitate lending. A
higher score means the laws are being followed better and vice versa.
Internet Users (per 100 people)
The number of internet users per 100 people.
- Internet users are defined as people with access to the worldwide network.
Agriculture, value added (%GDP)
The percentage of total GDP that is made up from Agriculture.
- Agriculture corresponds to ISIC divisions 1-5 and includes; fishing, forestry,
hunting, cultivation of crops and livestock production. Value added is derived by
adding all outputs and subtracting all intermediate inputs. The origin of the value
added is determined by the International Standard Industrial Classification
(ISIC), revision 310.
Poverty headcount ratio at $1,25 a day (PPP)(%of population)
The percentage of people that lives on less than $1,25 a day.
- Population that is living on less than $1,25 per day t 2005 international prices.
Urban population % of total.
The amount out of the total population that lives in urban areas.
- Urban population refers to people living in urban areas as they are defined by
national statistical offices. It is calculated using World Bank population estimates
and urban ratios from the United Nations World Urbanizations Prospects.
10 The 3 revision can be found here: http://unstats.un.org/unsd/cr/registry/regcst.asp?Cl=2&Lg=1
43
This variable is not coming from the World Bank indicator section. This variable comes from
INSCR.
Polity IV.
Democracy score from 0-10
- How high democracy score a country has on a scale 0-10, coded by Integrated
Network for Social Conflict Studies (INSCR). Countries gets points according to
4 different factors(INSCR 2012b):
Authority Coding Scale Weight
- Competitiveness of Executive Recruitment (XRCOMP):
(3) Election +2
(2) Transitional +1
- Openness of Executive Recruitment (XROPEN):
Only if XRCOMP is Election (3) or Transitional (2)
(3) Dual/election +1
(4) Election +1
- Constraint on Chief Executive (XCONST):
(7) Executive parity or subordination +4
(6) Intermediate category +3
(5) Substantial limitations +2
(4) Intermediate category +1
- Competitiveness of Political Participation (PARCOMP):
(5) Competitive +3
(4) Transitional +2
(3) Factional +1
44
Appendix C Table.6, Correlation-matrix.
Agriculture %/GDP
Democ Polity IV ln_GDP
%living on >$1.25US/day
%of urban population
Net ODA/cap
Internet users/100ppl GDP/Capita
Agriculture %/GDP
P.C 1 -,278*** -,405*** ,220*** -,569*** ,123 -,679*** -,491***
Sig. ,001 ,000 ,006 ,000 ,124 ,000 ,000
N 157 138 152 157 157 157 153 152
Democracy P.C -,278*** 1 ,278*** ,004 ,255*** -,035 ,446*** ,261***
Sig. ,001 ,000 ,958 ,001 ,644 ,000 ,001
N 138 177 164 177 175 177 170 164
ln_GDP P.C -,405*** ,278*** 1 ,010 ,477*** -,478*** ,468*** ,364***
Sig. ,000 ,000 ,895 ,000 ,000 ,000 ,000
N 152 164 187 187 186 187 182 187
%living on >$1.25US/day
P.C ,220*** ,004 ,010 1 -,211*** -,041 -,217*** -,142*
Sig. ,006 ,958 ,895 ,002 ,554 ,002 ,053
N 157 177 187 213 209 213 196 187
%of urban population
P.C -,569*** ,255*** ,477*** -,211*** 1 -,111 ,643*** ,601***
Sig. ,000 ,001 ,000 ,002 ,110 ,000 ,000
45
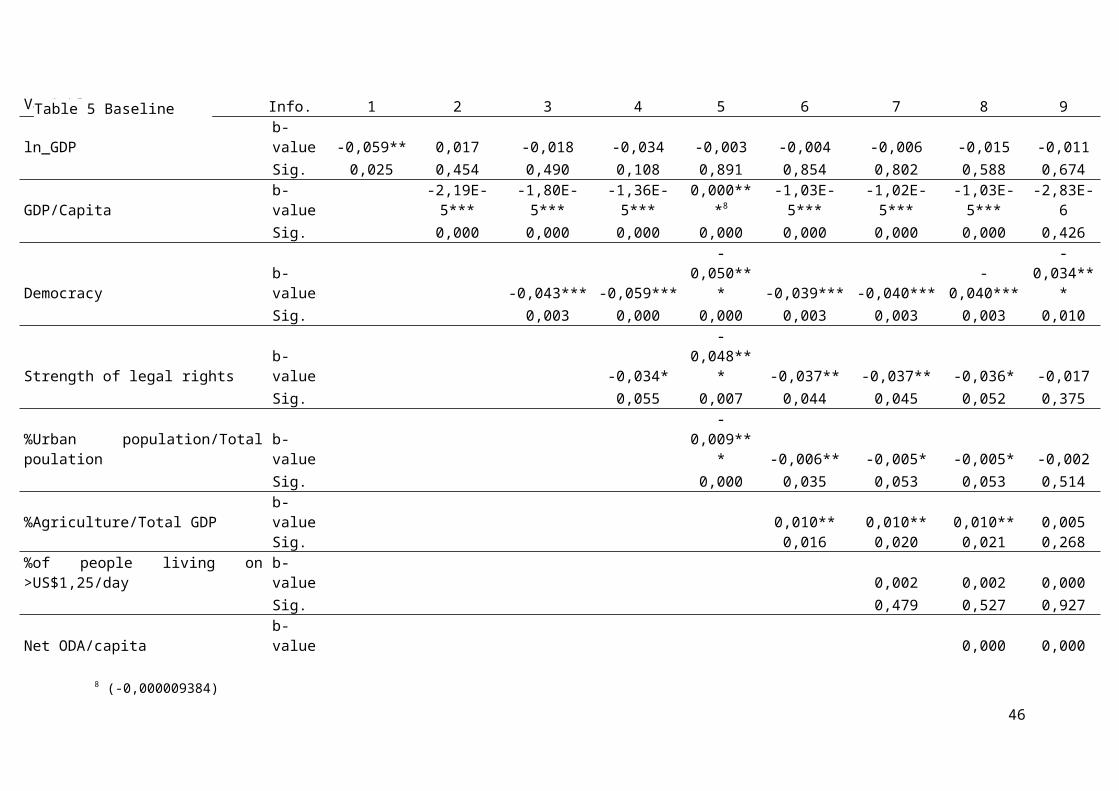
N 157 175 186 209 210 210 196 186
Net ODA/cap P.C ,123 -,035 -,478*** -,041 -,111 1 -,139* -,146**
Sig. ,124 ,644 ,000 ,554 ,110 ,053 ,046
N 157 177 187 213 210 214 196 187
Internet users/100ppl
P.C -,679*** ,446*** ,468*** -,217*** ,643*** -,139* 1 ,741***
Sig. ,000 ,000 ,000 ,002 ,000 ,053 ,000
N 153 170 182 196 196 196 196 182
GDP/Capita P.C -,491*** ,261*** ,364*** -,142* ,601*** -,146** ,741*** 1
Sig. ,000 ,001 ,000 ,053 ,000 ,046 ,000
N 152 164 187 187 186 187 182 187
46
47
*** means statistically significant at a 1% level. **means statistically significant at a 5% level. *means statistically significant at a 10% level.
Appendix D
These regressions are showing the final results, not with the step by step adding variables
used in earlier regressions. The information found in the tables is the same as previous
Table 7, Reference group Europe.
Table 8, Reference group Europe & Central Asia
48
*** Significant at a 1% level. ** Significant at a 5% level. * Significant at a 10% level.
Official Region B-value Sig.
Africa 1,142*** 0,000
Asia 0,632*** 0,009
Central America 0,537 0,189
Middle East 0,860*** 0,009
Northern America -1,113*** 0,047
Oceania -0,081 0,785
South America 0,990*** 0,005
The Caribbean 0,476* 0,089
N. 214 Adj. R-sq. 0 ,214
Developing Region B-value Sig.
East Asia & The Pacific 0,652*** 0,009
Latin America & The caribbean 0,813*** 0,000
Middle East & North Africa 0,982*** 0,002
Sub-saharan Africa 1,397*** 0,000
South Asia 1,385*** 0,001
N.214 Adj. R-sq ,212
Table 9, Reference group EU-members.
Country groups of interest B-value Sig.
Landlocked 0,479** 0,012
Sub-Saharan Africa 0,521** 0,019
LDC 0,722*** 0,001
N. 214 Adj. R-sq ,180
*** Significant at a 1% level. ** Significant at a 5% level. * Significant at a 10% level.
49
*** Significant at a 1% level. ** Significant at a 5% level. * Significant at a 10% level.
Appendix E
Table 10, Robustness Check, dependent variable ln(documents to import)
Variables Info. 1 2 3 4 5 6 7 8 9ln_GDP b-value -0,019 0,022 0,002 -0,014 0,001 0,001 0,001 -0,022 -0,022
Sig. 0,194 0,118 0,893 0,233 0,930 0,923 0,937 0,147 0,148GDP/Capita b-value -1,18E-05*** -9,96E-06*** -6,22E-06*** 0,000*** -5,84E-06*** -5,84E-06*** -6,04E-06*** -4,30E-06**
Sig. 0,000 0,000 0,000 0,002 0,000 0,000 0,000 0,032Democracy b-value -0,014* -0,026*** -0,022*** -0,014* -0,014* -0,012* -0,010
Sig. 0,099 0,000 0,001 0,063 0,063 0,092 0,160Strength of legal rights b-value -0,018* -0,025** -0,028*** -0,028*** -0,026** -0,020*
Sig. 0,069 0,012 0,006 0,007 0,011 0,051%Urban population/Total poulation b-value -0,004*** -0,003** -0,003** -0,003** -0,002
Sig. 0,002 0,022 0,027 0,022 0,122%Agriculture/Total GDP b-value 0,004 0,004 0,004 0,003
Sig. 0,111 0,118 0,126 0,212%of people living on >US$1,25/day b-value 0,000 0,000 -0,001
Sig. 0,861 0,889 0,653Net ODA/capita b-value -0,001*** -0,001***
Sig. 0,005 0,003Internet users/100 people b-value -0,003
Sig. 0,179N. 187 187 164 160 159 133 133 133 132Adj. R-sq 0,004 0,266 0,302 0,386 0,421 0,478 0,474 0,502 0,511R-sq 0,009 0,274 0,315 0,401 0,439 0,501 0,502 0,533 0,545
*** Significant at a 1% level. ** Significant at a 5% level. * Significant at a 10% level.
50
Table 11, Robustness check, dependent variable ln(Cost to Import)
Variables Info. 1 2 3 4 5 6 7 8 9ln_GDP b-value 0,066 0,035 0,069 0,102 0,049 0,140 0,154 0,143 0,116
Sig. 0,431 0,699 0,527 0,385 0,702 0,330 0,286 0,404 0,487GDP/Capita b-value 9,040E-6 8,083E-6 1,152E-6 -5,470E-6 5,564E-6 5,080E-6 4,984E-6 -3,933E-5*
Sig. 0,341 0,417 0,929 0,703 0,746 0,768 0,773 0,073Democracy b-value -0,003 -0,017 -0,029 -0,084 -0,078 -0,077 -0,108
Sig. 0,960 0,797 0,679 0,289 0,329 0,337 0,169Strength of legal rights b-value 0,045 0,072 0,058 0,058 0,059 -0,051
Sig. 0,651 0,482 0,603 0,601 0,596 0,655%Urban population/Total poulation b-value 0,014 -0,003 -0,006 -0,006 -0,025
Sig. 0,308 0,840 0,699 0,700 0,137%Agriculture/Total GDP b-value -0,037 -0,035 -0,035 -0,002
Sig. 0,150 0,180 0,181 0,942%of people living on >US$1,25/day b-value -0,019 -0,020 -0,010
Sig. 0,314 0,312 0,591Net ODA/capita b-value -0,000 0,000
Sig. 0,902 0,933Internet users/100 people b-value 0,067***
Sig. ,002N. 187 187 164 160 159 133 133 133 132Adj. R-sq -0,002 -0,003 -0,008 -0,016 -0,016 0,015 0,015 0,007 0,073R-sq 0,003 0,008 0,011 0,011 0,016 0,060 0,067 0,067 0,136
*** Significant at a 1% level. ** Significant at a 5% level. * Significant at a 10% level.
51
52