Embed Size (px)
Citation preview

LUO’S QES RESEARCH Quantitative Research
Economics Portfolio Strategy
MULTI-DIMENSIONAL ALPHA
April 24, 2017
This report is limited solely for the use of clients of Wolfe Research. Please refer to the DISCLOSURE SECTION located at the end of this report for Analyst Certifications and Other Disclosures. For important disclosures, please go to www.WolfeResearch.com/Disclosures or write to us at Wolfe Research, 420 Lexington Ave., Suite 648, New York, NY 10170. WolfeResearch.com Page 1 of 38 Luo’s QES
CROWDSOURCING EARNINGS AND REVENUE ESTIMATES More Accurate and Timelier Estimates Lead to Better Investment Strategies
Alternative Big Data on Earnings and Revenue Estimate. Traditionally, investors rely primarily on the sell-side consensus for earnings and revenue forecasts. In this research, we study an alternative data sourcebased on the concept of crowdsourcing. Estimize is an online platform that allows individuals with differentbackgrounds to contribute their financial forecast. We find Estimize estimates to be not only more accurateand timelier than the sell-side, but also highly complementary to traditional factors.
Estimize FES Model. Diving into detailed Estimize estimates, we find that accuracy can be further improvedalong three dimensions: the freshness of the estimates, analyst experience (proxied by the number ofprevious estimates), and analyst skill (weighted by past performance or accuracy of each analyst). We thenintroduce a smart Estimize consensus called FES (Freshness, Experience, and Skill).
Smart Strategies around Earnings Announcement. We explore three different type of trading strategiesaround earnings releases using the Estimize data. The pre-earnings announcement strategy buys (andsells/shorts) stocks based on earnings revisions in the week before the earnings reporting date. PEAD (PostEarning Announcement Drift) strategy attempts to capture the drift alpha immediately after the earningsannouncement, based on earnings surprise. Lastly, we propose a low risk long-only strategy by avoidingearnings risk and earnings uncertainty.
Enhanced Value Strategies. Many fundamental and quantitative strategies explicitly or implicitly rely onearnings and revenue estimates. For long-term value investors, we show how Estimize data and our FESmodel can be used to boost performance. In the end, we also overlay our enhanced value strategy with a lowrisk tilt (by avoiding earnings uncertainty) to further improve return and reduce risk.
Source: gettyimages.com
Sheng Wang [email protected]
Yin Luo, CFA, CPA [email protected]
Javed Jussa [email protected]
Gaurav Rohal, CFA [email protected]
QES Desk Phone: 1.646.582.9230 [email protected]
WolfeResearch.com Page 2 of 38 Luo’s QES April 24, 2017
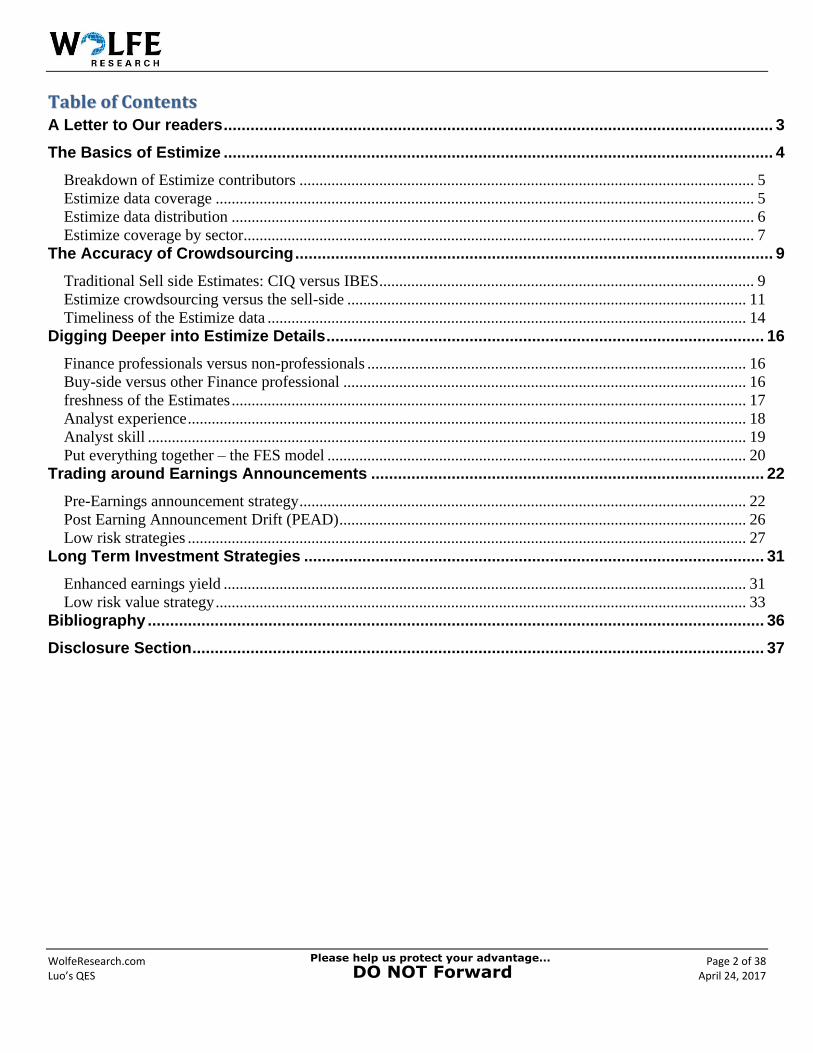
TTaabbllee ooff CCoonntteennttss A Letter to Our readers ........................................................................................................................... 3
The Basics of Estimize ........................................................................................................................... 4
Breakdown of Estimize contributors .................................................................................................................. 5
Estimize data coverage ....................................................................................................................................... 5
Estimize data distribution ................................................................................................................................... 6
Estimize coverage by sector ................................................................................................................................ 7
The Accuracy of Crowdsourcing ........................................................................................................... 9
Traditional Sell side Estimates: CIQ versus IBES .............................................................................................. 9
Estimize crowdsourcing versus the sell-side .................................................................................................... 11
Timeliness of the Estimize data ........................................................................................................................ 14
Digging Deeper into Estimize Details .................................................................................................. 16
Finance professionals versus non-professionals ............................................................................................... 16
Buy-side versus other Finance professional ..................................................................................................... 16
freshness of the Estimates ................................................................................................................................. 17
Analyst experience ............................................................................................................................................ 18
Analyst skill ...................................................................................................................................................... 19
Put everything together – the FES model ......................................................................................................... 20
Trading around Earnings Announcements ........................................................................................ 22
Pre-Earnings announcement strategy ................................................................................................................ 22
Post Earning Announcement Drift (PEAD) ...................................................................................................... 26
Low risk strategies ............................................................................................................................................ 27
Long Term Investment Strategies ....................................................................................................... 31
Enhanced earnings yield ................................................................................................................................... 31
Low risk value strategy ..................................................................................................................................... 33
Bibliography .......................................................................................................................................... 36
Disclosure Section ................................................................................................................................ 37
WolfeResearch.com Page 3 of 38 Luo’s QES April 24, 2017
A LETTER TO OUR READERS
Introducing Crowdsourcing Big Data Earnings/Revenue Estimates
As argued in our previous research (see Luo, et al [2017a, 2017b, and 2017c], we believe that the future of active investing rests on the ability to incorporate alternative Big Data, using sophisticated machine learning techniques. In this paper, we demonstrate alternative data using Estimize.
Earnings and revenue estimates are arguably the most important drivers of stock returns and risks. Traditionally, investors collect estimates from the sell-side brokerage firms. Data vendors such as S&P Capital IQ (CIQ), Institutional Brokers’ Estimate System (IBES), and Bloomberg Finance LLC provide both aggregated consensus and detailed estimates. Many fundamental (e.g., discounted cash flow models) and quantitative factors (e.g., earnings yield, earnings growth, earnings revision, ROE) explicitly or implicitly rely on predictions of future earnings and revenue. Gaining an edge with even slightly better earnings estimates can lead to tremendous alpha in the long run.
In this research, we study an alternative analyst estimate database called Estimize. The firm started the business by collecting buy-side earnings estimate data. In recent years, Estimize has significantly expanded the coverage. Now, not only finance professionals, but even students and professors may participate. The beauty of crowdsourcing is “the more the merrier”.
We find that Estimize earnings estimates to be more accurate and timelier than traditional sell-side consensus, especially for large-cap household names and as we move closer to the actual earnings announcement date. Estimize data is highly complementary to traditional data sources, factors, and investment strategies.
Furthermore, as expected, not every analyst and estimate is created equally. The fresher the submission, the more accurate the prediction tends to be. We also find analyst experience (proxied by the number of past estimates provided by an analyst) and skill (measured by the estimation errors of each analyst) to be predictive of future performance. We introduce our Estimize FES (Freshness, Experience, and Skill) model by weighting each earnings estimate differently.
Lastly, we use a suite of examples to show how our Estimize FES model can be used in an event-driven context by trading both pre-earnings releases and to capture PEAD (post earnings announcement drift). For long-term value investors, we also demonstrate how our enhanced low risk value strategies can deliver superior alpha with low volatility.
Regards,
Yin, Javed, Sheng, Gaurav, Kartik, and Luo’s QES team
WolfeResearch.com Page 4 of 38 Luo’s QES April 24, 2017
THE BASICS OF ESTIMIZE
Both fundamental analysis (e.g., discounted cash flow analysis) and quantitative models (e.g., earnings yield, earnings revision) critically depend on an accurate estimate firms’ future earnings and revenue. Traditionally, investors collect estimates from the sell-side brokerage firms. Data vendors such as S&P Capital IQ (CIQ), Institutional Brokers’ Estimate System (IBES), and Bloomberg Finance LLC provide both aggregated consensus and detailed estimates at the daily, weekly or monthly frequency. They usually offer live updates as well as historical dataset.
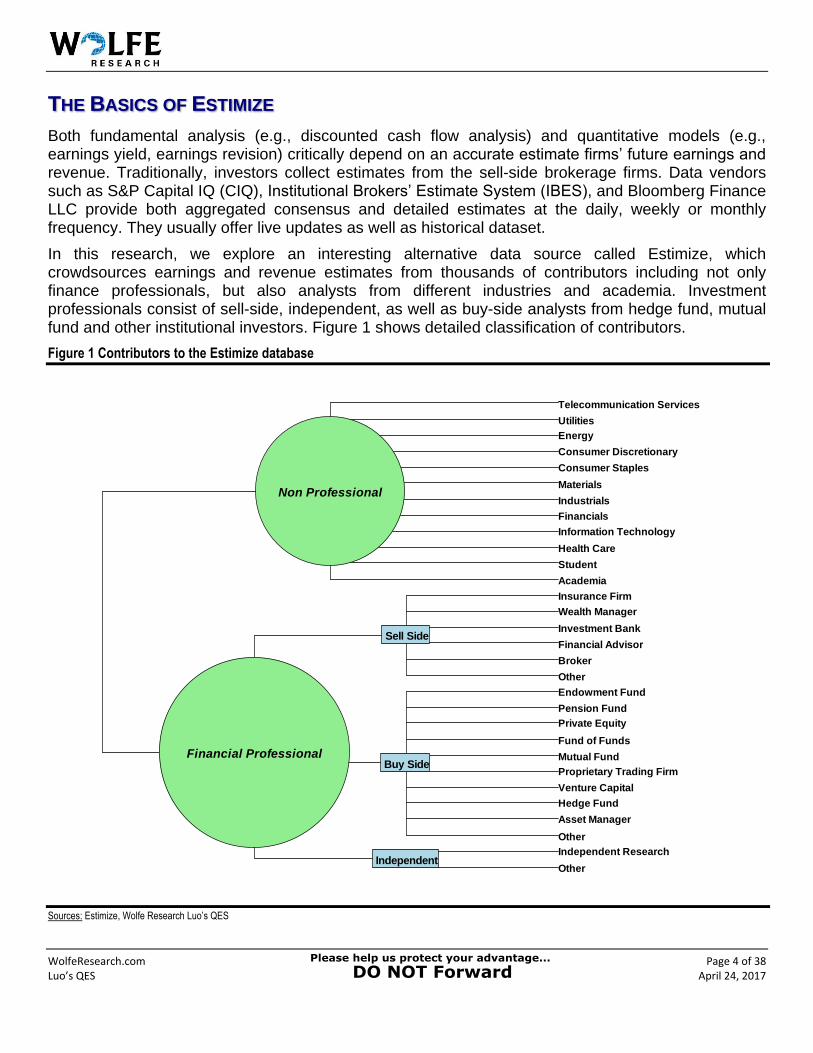
In this research, we explore an interesting alternative data source called Estimize, which crowdsources earnings and revenue estimates from thousands of contributors including not only finance professionals, but also analysts from different industries and academia. Investment professionals consist of sell-side, independent, as well as buy-side analysts from hedge fund, mutual fund and other institutional investors. Figure 1 shows detailed classification of contributors.
Figure 1 Contributors to the Estimize database
Sources: Estimize, Wolfe Research Luo’s QES
Other
Independent Research
Other
Asset Manager
Hedge Fund
Venture Capital
Proprietary Trading Firm
Mutual Fund
Fund of Funds
Private Equity
Pension Fund
Endowment Fund
Other
Broker
Financial Advisor
Investment Bank
Wealth Manager
Insurance Firm
Academia
Student
Health Care
Information Technology
Financials
Industrials
Materials
Consumer Staples
Consumer Discretionary
Energy
Utilities
Telecommunication Services
Non Professional
Financial ProfessionalBuy Side
Sell Side
Independent
WolfeResearch.com Page 5 of 38 Luo’s QES April 24, 2017
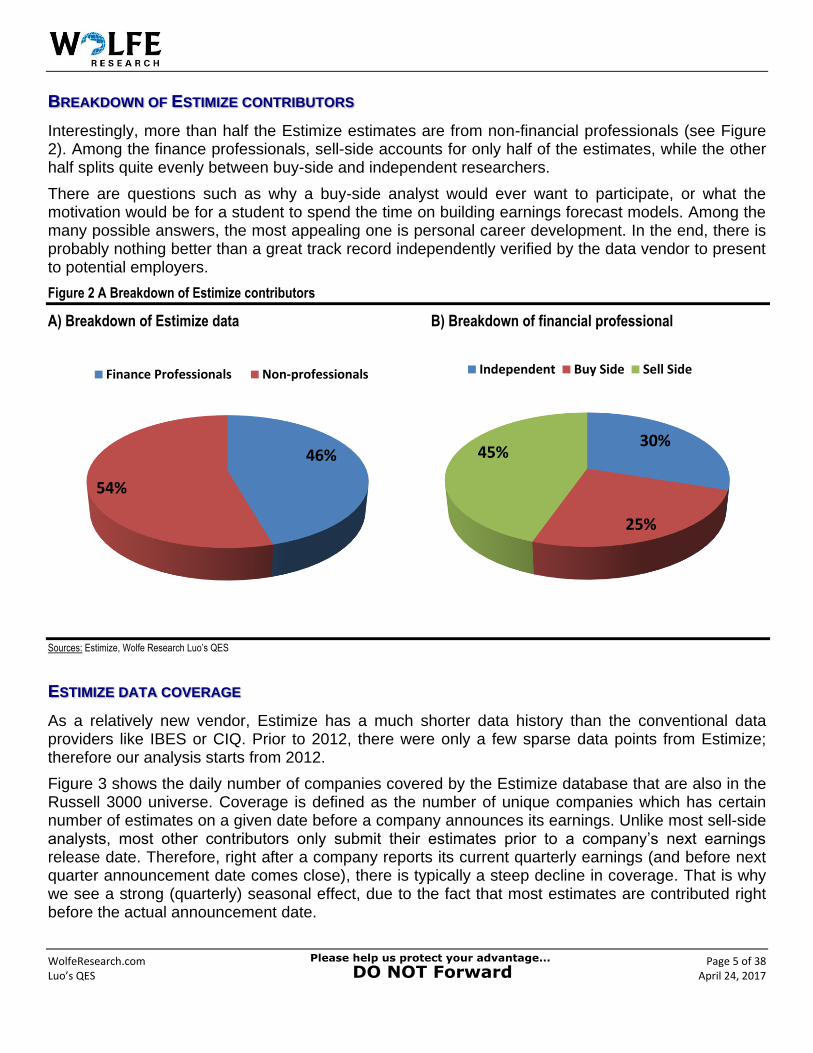
BREAKDOWN OF ESTIMIZE CONTRIBUTORS
Interestingly, more than half the Estimize estimates are from non-financial professionals (see Figure 2). Among the finance professionals, sell-side accounts for only half of the estimates, while the other half splits quite evenly between buy-side and independent researchers.
There are questions such as why a buy-side analyst would ever want to participate, or what the motivation would be for a student to spend the time on building earnings forecast models. Among the many possible answers, the most appealing one is personal career development. In the end, there is probably nothing better than a great track record independently verified by the data vendor to present to potential employers.
Figure 2 A Breakdown of Estimize contributors
A) Breakdown of Estimize data B) Breakdown of financial professional
Sources: Estimize, Wolfe Research Luo’s QES
ESTIMIZE DATA COVERAGE
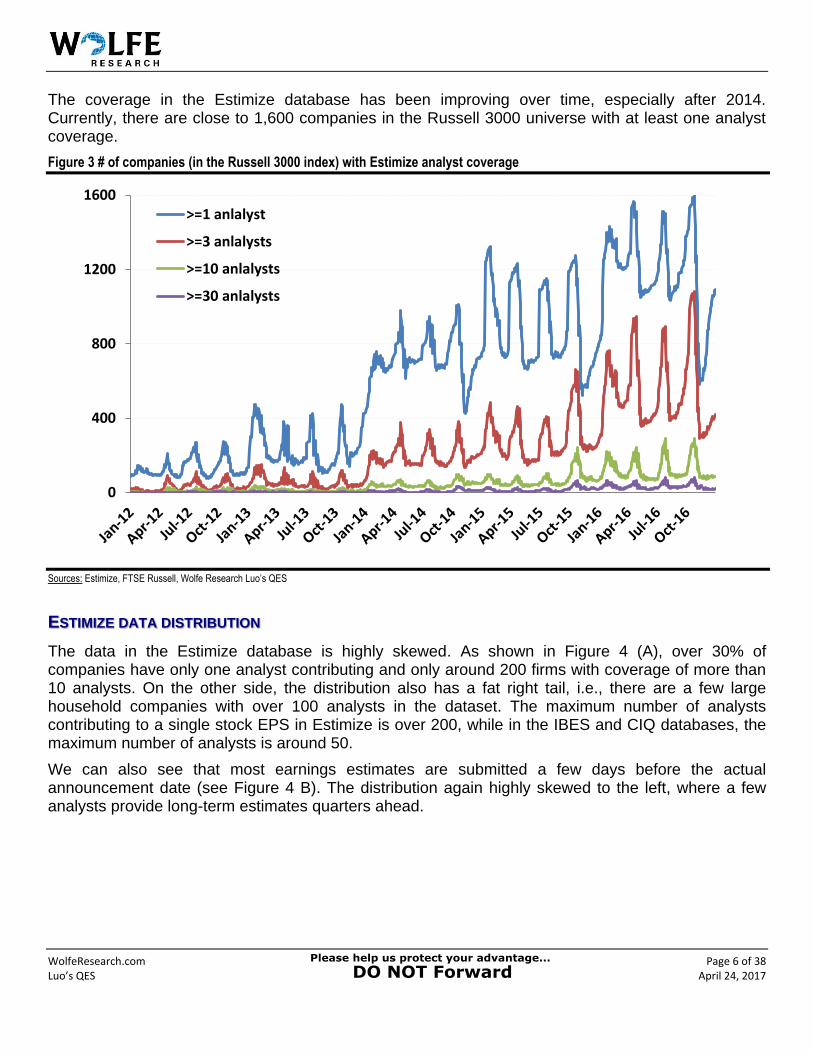
As a relatively new vendor, Estimize has a much shorter data history than the conventional data providers like IBES or CIQ. Prior to 2012, there were only a few sparse data points from Estimize; therefore our analysis starts from 2012.
Figure 3 shows the daily number of companies covered by the Estimize database that are also in the Russell 3000 universe. Coverage is defined as the number of unique companies which has certain number of estimates on a given date before a company announces its earnings. Unlike most sell-side analysts, most other contributors only submit their estimates prior to a company’s next earnings release date. Therefore, right after a company reports its current quarterly earnings (and before next quarter announcement date comes close), there is typically a steep decline in coverage. That is why we see a strong (quarterly) seasonal effect, due to the fact that most estimates are contributed right before the actual announcement date.
46%
54%
Finance Professionals Non-professionals
30%
25%
45%
Independent Buy Side Sell Side
WolfeResearch.com Page 6 of 38 Luo’s QES April 24, 2017
The coverage in the Estimize database has been improving over time, especially after 2014. Currently, there are close to 1,600 companies in the Russell 3000 universe with at least one analyst coverage.
Figure 3 # of companies (in the Russell 3000 index) with Estimize analyst coverage
Sources: Estimize, FTSE Russell, Wolfe Research Luo’s QES
ESTIMIZE DATA DISTRIBUTION
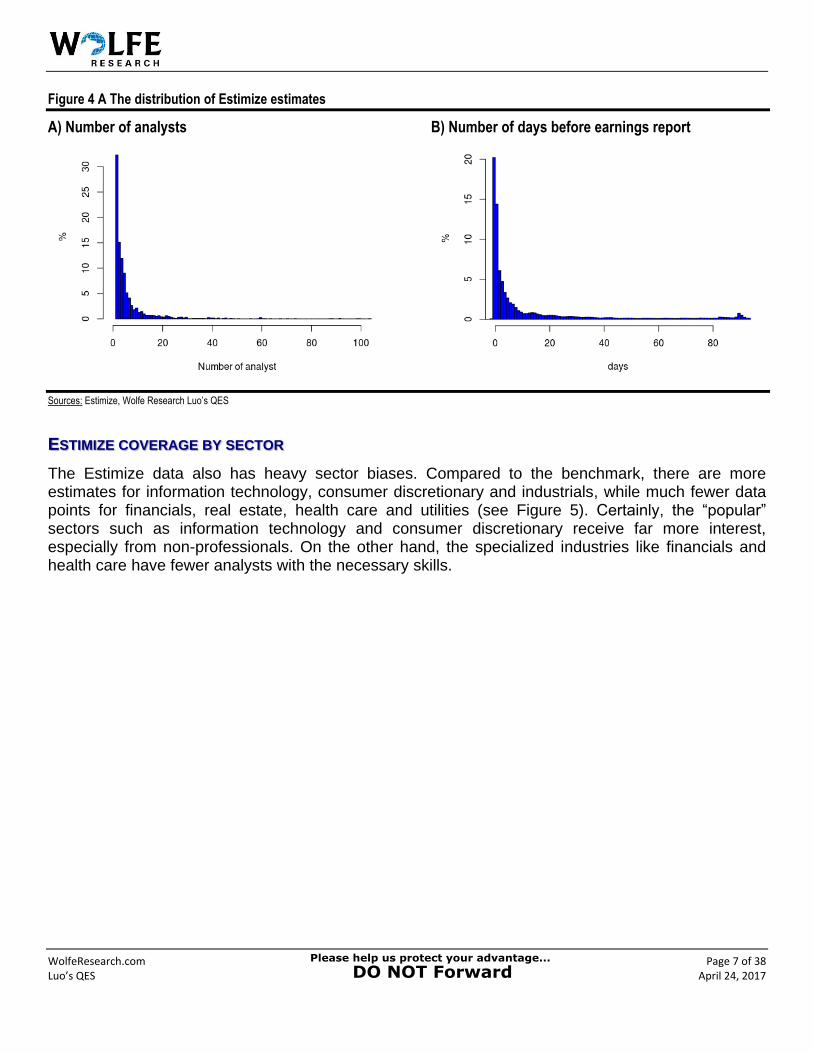
The data in the Estimize database is highly skewed. As shown in Figure 4 (A), over 30% of companies have only one analyst contributing and only around 200 firms with coverage of more than 10 analysts. On the other side, the distribution also has a fat right tail, i.e., there are a few large household companies with over 100 analysts in the dataset. The maximum number of analysts contributing to a single stock EPS in Estimize is over 200, while in the IBES and CIQ databases, the maximum number of analysts is around 50.
We can also see that most earnings estimates are submitted a few days before the actual announcement date (see Figure 4 B). The distribution again highly skewed to the left, where a few analysts provide long-term estimates quarters ahead.
0
400
800
1200
1600>=1 anlalyst
>=3 anlalysts
>=10 anlalysts
>=30 anlalysts
WolfeResearch.com Page 7 of 38 Luo’s QES April 24, 2017
Figure 4 A The distribution of Estimize estimates
A) Number of analysts B) Number of days before earnings report
Sources: Estimize, Wolfe Research Luo’s QES
ESTIMIZE COVERAGE BY SECTOR
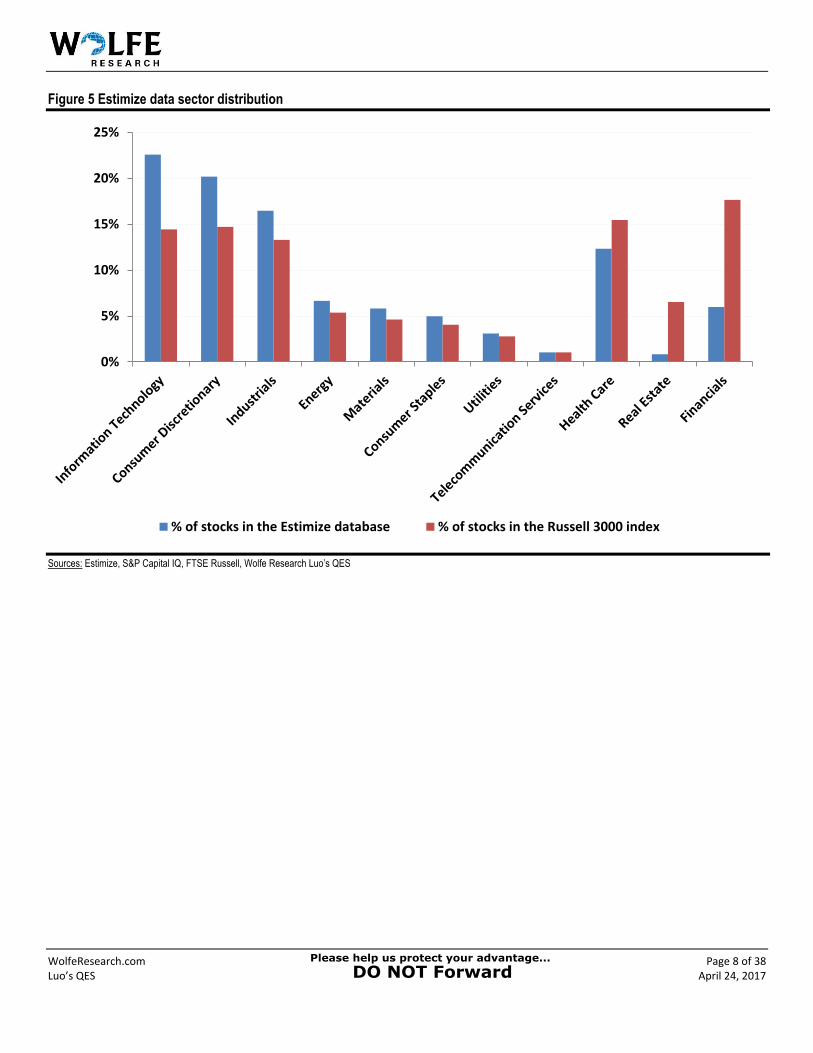
The Estimize data also has heavy sector biases. Compared to the benchmark, there are more estimates for information technology, consumer discretionary and industrials, while much fewer data points for financials, real estate, health care and utilities (see Figure 5). Certainly, the “popular” sectors such as information technology and consumer discretionary receive far more interest, especially from non-professionals. On the other hand, the specialized industries like financials and health care have fewer analysts with the necessary skills.
WolfeResearch.com Page 8 of 38 Luo’s QES April 24, 2017
Figure 5 Estimize data sector distribution
Sources: Estimize, S&P Capital IQ, FTSE Russell, Wolfe Research Luo’s QES
0%
5%
10%
15%
20%
25%
% of stocks in the Estimize database % of stocks in the Russell 3000 index
WolfeResearch.com Page 9 of 38 Luo’s QES April 24, 2017
THE ACCURACY OF CROWDSOURCING
The first question that we try to address is whether Estimize estimates are more accurate than traditional sell-side consensus. The answer is not necessarily straightforward and you might be surprised.
TRADITIONAL SELL SIDE ESTIMATES: CIQ VERSUS IBES
Before we dive into the Estimize data, let’s take a closer look at the two major conventional sell-side consensus data providers: IBES and CIQ.
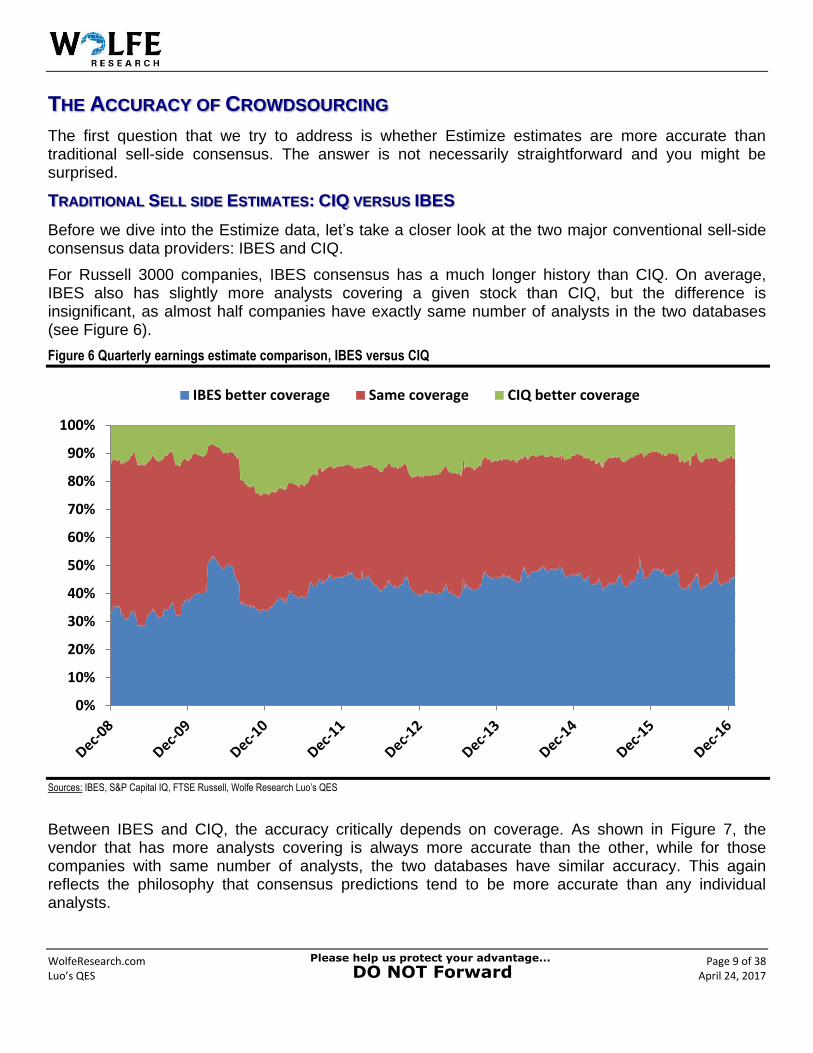
For Russell 3000 companies, IBES consensus has a much longer history than CIQ. On average, IBES also has slightly more analysts covering a given stock than CIQ, but the difference is insignificant, as almost half companies have exactly same number of analysts in the two databases (see Figure 6).
Figure 6 Quarterly earnings estimate comparison, IBES versus CIQ
Sources: IBES, S&P Capital IQ, FTSE Russell, Wolfe Research Luo’s QES
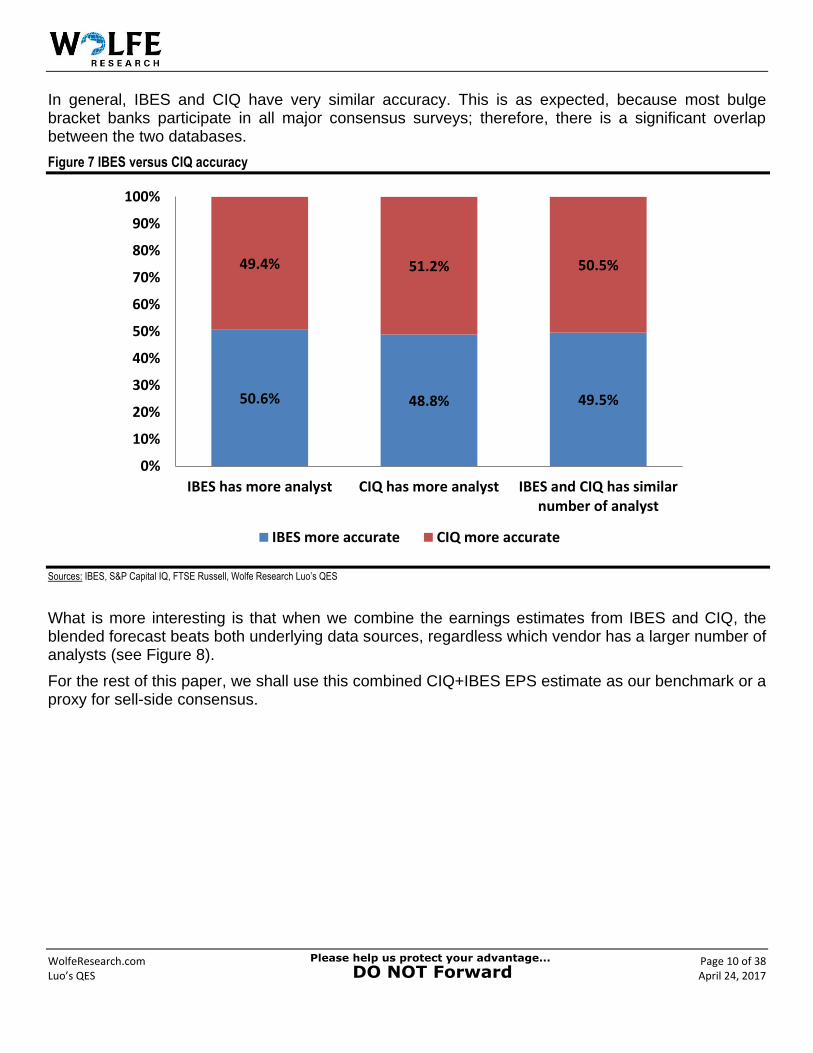
Between IBES and CIQ, the accuracy critically depends on coverage. As shown in Figure 7, the vendor that has more analysts covering is always more accurate than the other, while for those companies with same number of analysts, the two databases have similar accuracy. This again reflects the philosophy that consensus predictions tend to be more accurate than any individual analysts.
0%
10%
20%
30%
40%
50%
60%
70%
80%
90%
100%
IBES better coverage Same coverage CIQ better coverage
WolfeResearch.com Page 10 of 38 Luo’s QES April 24, 2017
In general, IBES and CIQ have very similar accuracy. This is as expected, because most bulge bracket banks participate in all major consensus surveys; therefore, there is a significant overlap between the two databases.
Figure 7 IBES versus CIQ accuracy
Sources: IBES, S&P Capital IQ, FTSE Russell, Wolfe Research Luo’s QES
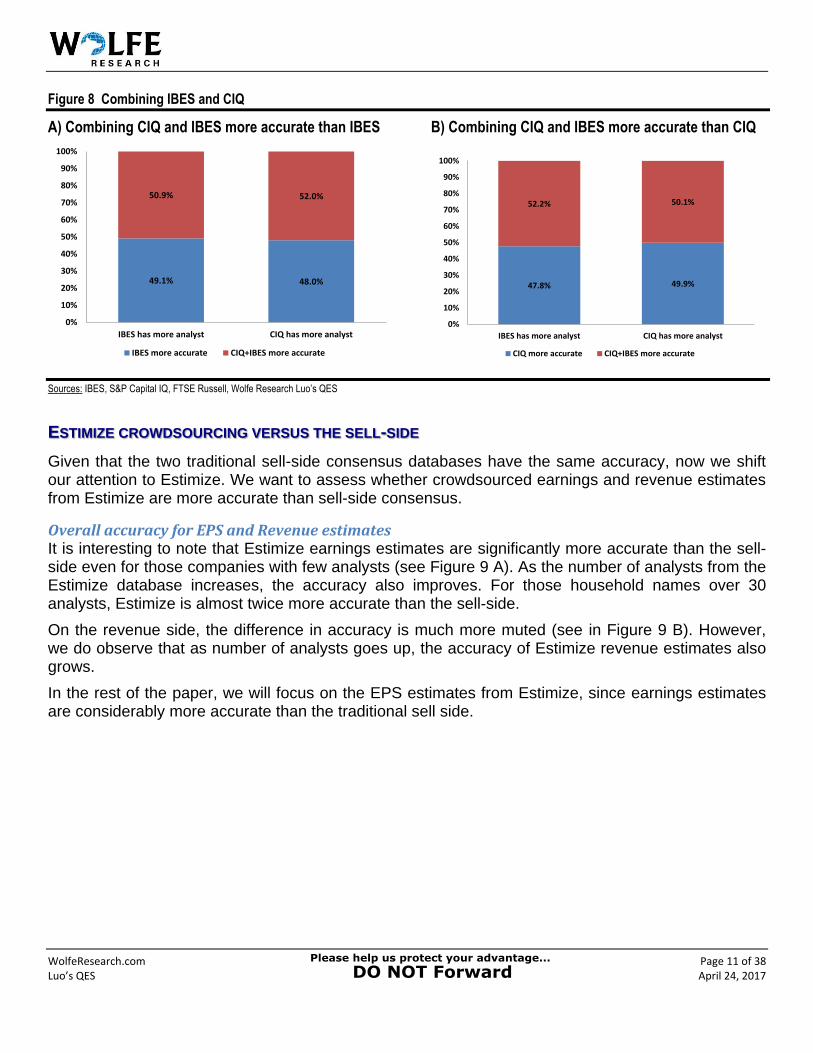
What is more interesting is that when we combine the earnings estimates from IBES and CIQ, the blended forecast beats both underlying data sources, regardless which vendor has a larger number of analysts (see Figure 8).
For the rest of this paper, we shall use this combined CIQ+IBES EPS estimate as our benchmark or a proxy for sell-side consensus.
50.6% 48.8% 49.5%
49.4% 51.2% 50.5%
0%
10%
20%
30%
40%
50%
60%
70%
80%
90%
100%
IBES has more analyst CIQ has more analyst IBES and CIQ has similarnumber of analyst
IBES more accurate CIQ more accurate
WolfeResearch.com Page 11 of 38 Luo’s QES April 24, 2017
Figure 8 Combining IBES and CIQ
A) Combining CIQ and IBES more accurate than IBES B) Combining CIQ and IBES more accurate than CIQ
Sources: IBES, S&P Capital IQ, FTSE Russell, Wolfe Research Luo’s QES
ESTIMIZE CROWDSOURCING VERSUS THE SELL-SIDE
Given that the two traditional sell-side consensus databases have the same accuracy, now we shift our attention to Estimize. We want to assess whether crowdsourced earnings and revenue estimates from Estimize are more accurate than sell-side consensus.
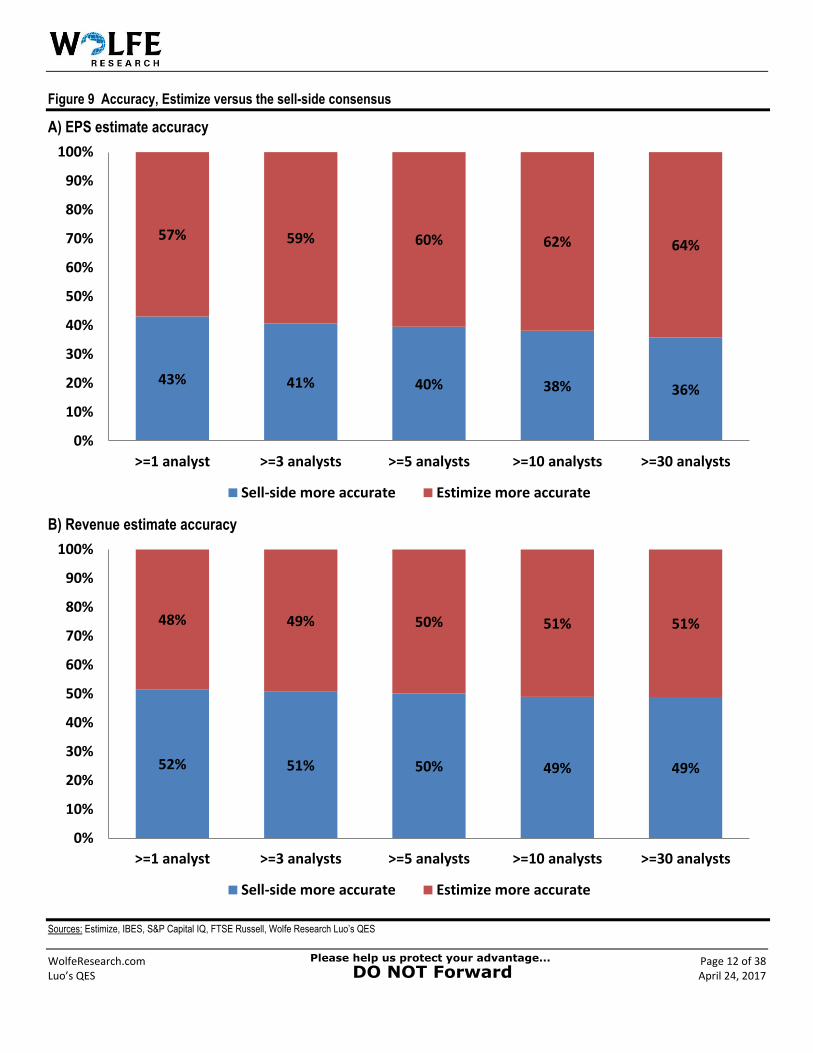
Overall accuracy for EPS and Revenue estimates It is interesting to note that Estimize earnings estimates are significantly more accurate than the sell-side even for those companies with few analysts (see Figure 9 A). As the number of analysts from the Estimize database increases, the accuracy also improves. For those household names over 30 analysts, Estimize is almost twice more accurate than the sell-side.
On the revenue side, the difference in accuracy is much more muted (see in Figure 9 B). However, we do observe that as number of analysts goes up, the accuracy of Estimize revenue estimates also grows.
In the rest of the paper, we will focus on the EPS estimates from Estimize, since earnings estimates are considerably more accurate than the traditional sell side.
49.1% 48.0%
50.9% 52.0%
0%
10%
20%
30%
40%
50%
60%
70%
80%
90%
100%
IBES has more analyst CIQ has more analyst
IBES more accurate CIQ+IBES more accurate
47.8% 49.9%
52.2% 50.1%
0%
10%
20%
30%
40%
50%
60%
70%
80%
90%
100%
IBES has more analyst CIQ has more analyst
CIQ more accurate CIQ+IBES more accurate
WolfeResearch.com Page 12 of 38 Luo’s QES April 24, 2017
Figure 9 Accuracy, Estimize versus the sell-side consensus
A) EPS estimate accuracy
B) Revenue estimate accuracy
Sources: Estimize, IBES, S&P Capital IQ, FTSE Russell, Wolfe Research Luo’s QES
43% 41% 40% 38% 36%
57% 59% 60% 62% 64%
0%
10%
20%
30%
40%
50%
60%
70%
80%
90%
100%
>=1 analyst >=3 analysts >=5 analysts >=10 analysts >=30 analysts
Sell-side more accurate Estimize more accurate
52% 51% 50% 49% 49%
48% 49% 50% 51% 51%
0%
10%
20%
30%
40%
50%
60%
70%
80%
90%
100%
>=1 analyst >=3 analysts >=5 analysts >=10 analysts >=30 analysts
Sell-side more accurate Estimize more accurate
WolfeResearch.com Page 13 of 38 Luo’s QES April 24, 2017
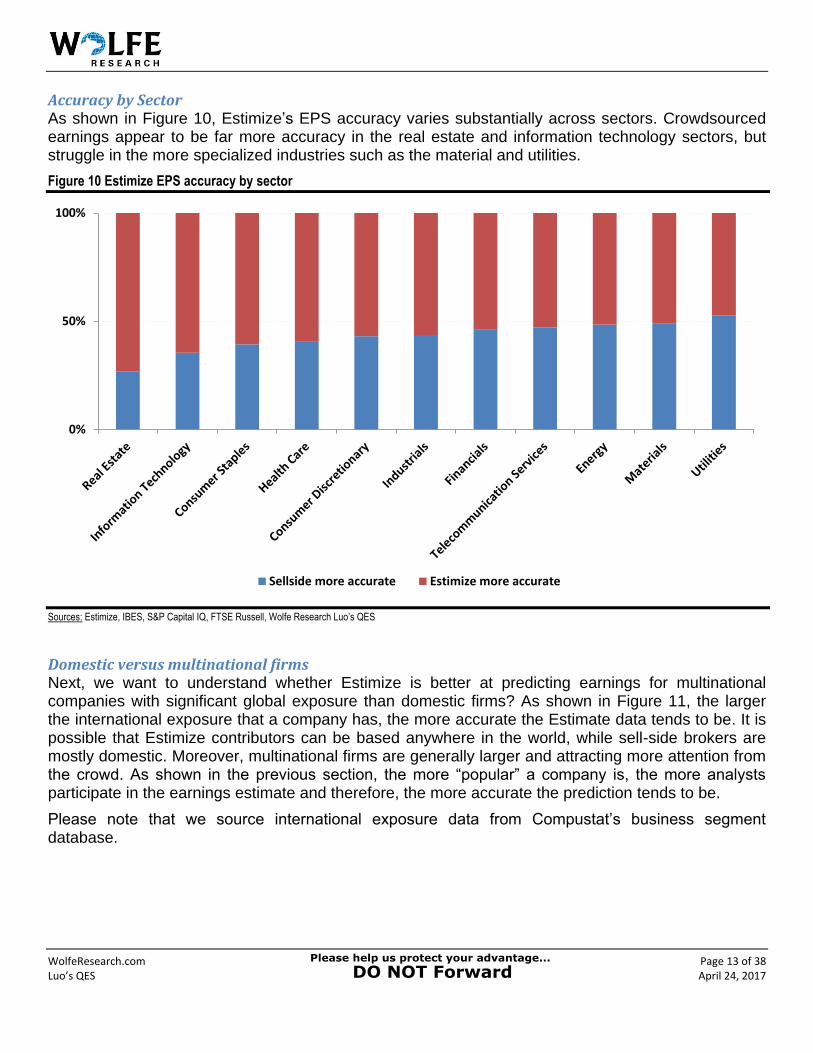
Accuracy by Sector As shown in Figure 10, Estimize’s EPS accuracy varies substantially across sectors. Crowdsourced earnings appear to be far more accuracy in the real estate and information technology sectors, but struggle in the more specialized industries such as the material and utilities.
Figure 10 Estimize EPS accuracy by sector
Sources: Estimize, IBES, S&P Capital IQ, FTSE Russell, Wolfe Research Luo’s QES
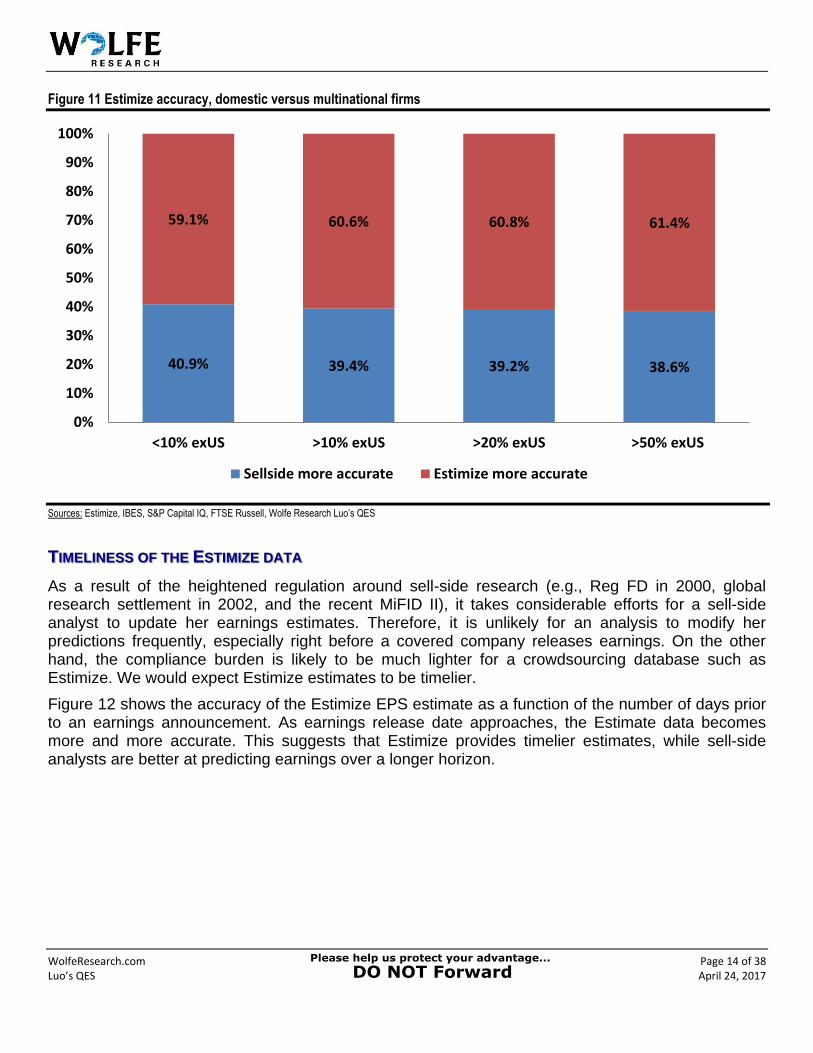
Domestic versus multinational firms Next, we want to understand whether Estimize is better at predicting earnings for multinational companies with significant global exposure than domestic firms? As shown in Figure 11, the larger the international exposure that a company has, the more accurate the Estimate data tends to be. It is possible that Estimize contributors can be based anywhere in the world, while sell-side brokers are mostly domestic. Moreover, multinational firms are generally larger and attracting more attention from the crowd. As shown in the previous section, the more “popular” a company is, the more analysts participate in the earnings estimate and therefore, the more accurate the prediction tends to be.
Please note that we source international exposure data from Compustat’s business segment database.
0%
50%
100%
Sellside more accurate Estimize more accurate
WolfeResearch.com Page 14 of 38 Luo’s QES April 24, 2017
Figure 11 Estimize accuracy, domestic versus multinational firms
Sources: Estimize, IBES, S&P Capital IQ, FTSE Russell, Wolfe Research Luo’s QES
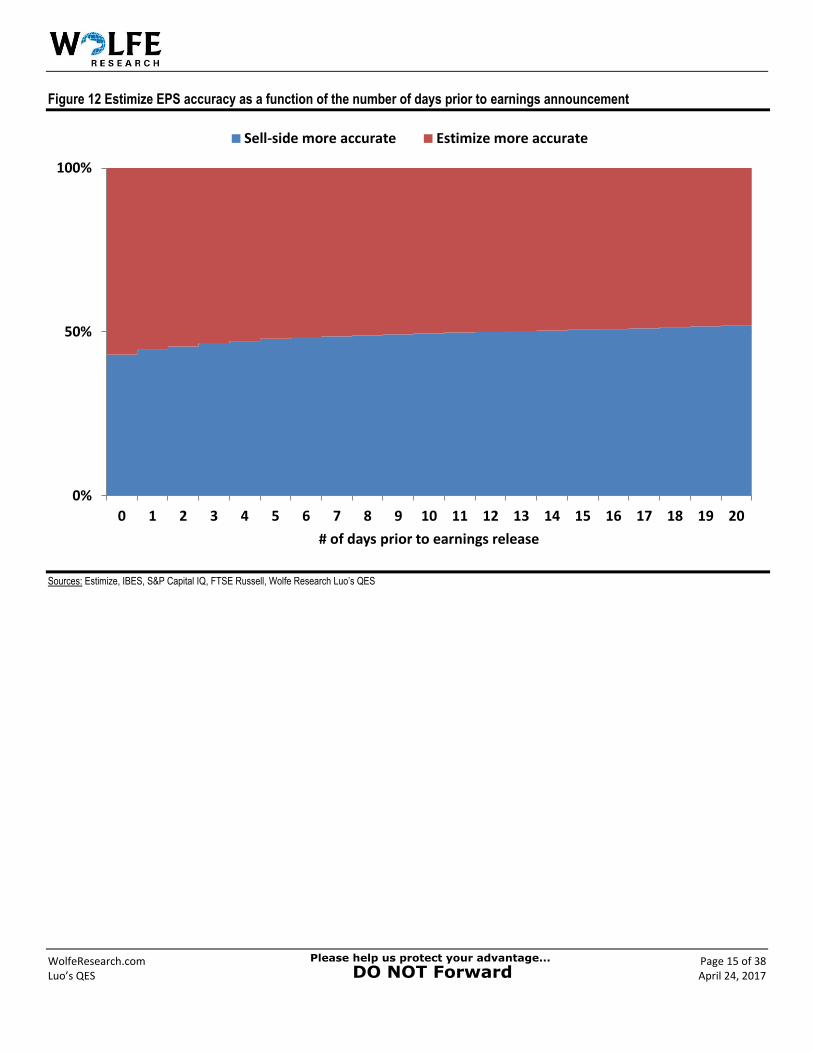
TIMELINESS OF THE ESTIMIZE DATA
As a result of the heightened regulation around sell-side research (e.g., Reg FD in 2000, global research settlement in 2002, and the recent MiFID II), it takes considerable efforts for a sell-side analyst to update her earnings estimates. Therefore, it is unlikely for an analysis to modify her predictions frequently, especially right before a covered company releases earnings. On the other hand, the compliance burden is likely to be much lighter for a crowdsourcing database such as Estimize. We would expect Estimize estimates to be timelier.
Figure 12 shows the accuracy of the Estimize EPS estimate as a function of the number of days prior to an earnings announcement. As earnings release date approaches, the Estimate data becomes more and more accurate. This suggests that Estimize provides timelier estimates, while sell-side analysts are better at predicting earnings over a longer horizon.
40.9% 39.4% 39.2% 38.6%
59.1% 60.6% 60.8% 61.4%
0%
10%
20%
30%
40%
50%
60%
70%
80%
90%
100%
<10% exUS >10% exUS >20% exUS >50% exUS
Sellside more accurate Estimize more accurate
WolfeResearch.com Page 15 of 38 Luo’s QES April 24, 2017
Figure 12 Estimize EPS accuracy as a function of the number of days prior to earnings announcement
Sources: Estimize, IBES, S&P Capital IQ, FTSE Russell, Wolfe Research Luo’s QES
0%
50%
100%
0 1 2 3 4 5 6 7 8 9 10 11 12 13 14 15 16 17 18 19 20
# of days prior to earnings release
Sell-side more accurate Estimize more accurate
WolfeResearch.com Page 16 of 38 Luo’s QES April 24, 2017
DIGGING DEEPER INTO ESTIMIZE DETAILS
From Estimize detailed analyst-level database, we are able to extract useful information from the metadata of individual analysts as well as certain characteristics of their estimates. In this section, we take a close look at Estimize details. We search for common features leading to more accurate estimates, and smartly weight top performing analysts to achieve a higher accuracy.
FINANCE PROFESSIONALS VERSUS NON-PROFESSIONALS
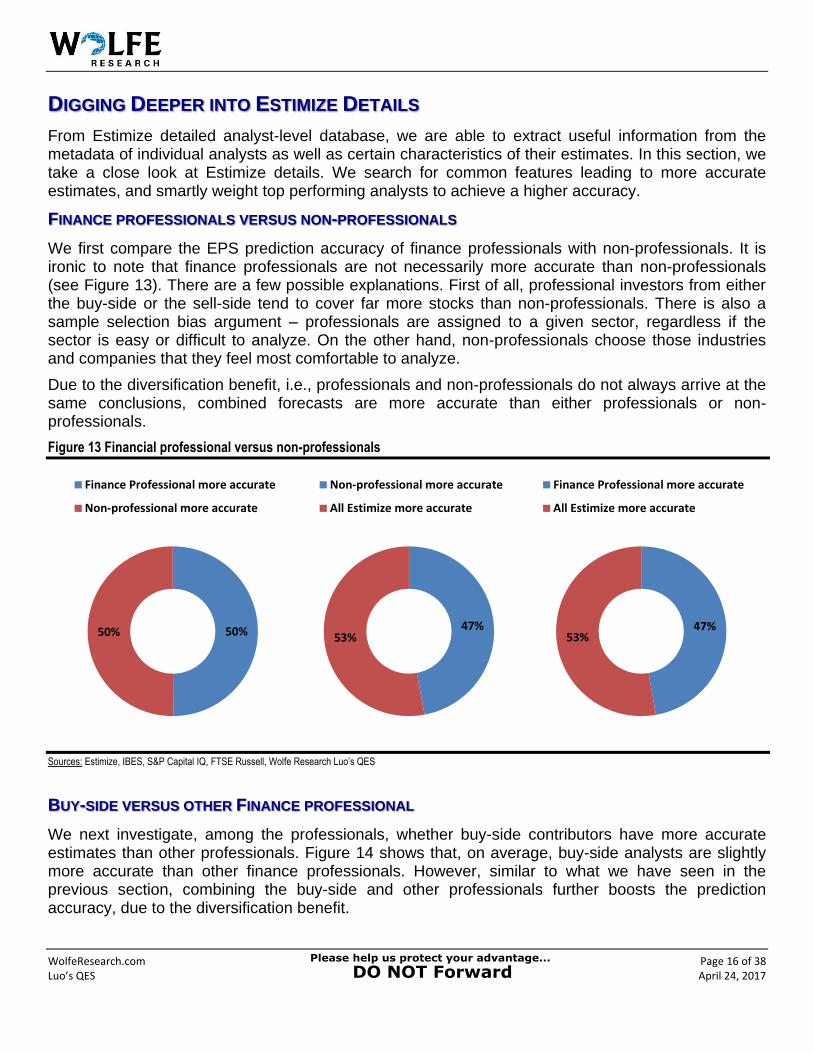
We first compare the EPS prediction accuracy of finance professionals with non-professionals. It is ironic to note that finance professionals are not necessarily more accurate than non-professionals (see Figure 13). There are a few possible explanations. First of all, professional investors from either the buy-side or the sell-side tend to cover far more stocks than non-professionals. There is also a sample selection bias argument – professionals are assigned to a given sector, regardless if the sector is easy or difficult to analyze. On the other hand, non-professionals choose those industries and companies that they feel most comfortable to analyze.
Due to the diversification benefit, i.e., professionals and non-professionals do not always arrive at the same conclusions, combined forecasts are more accurate than either professionals or non-professionals.
Figure 13 Financial professional versus non-professionals
Sources: Estimize, IBES, S&P Capital IQ, FTSE Russell, Wolfe Research Luo’s QES
BUY-SIDE VERSUS OTHER FINANCE PROFESSIONAL
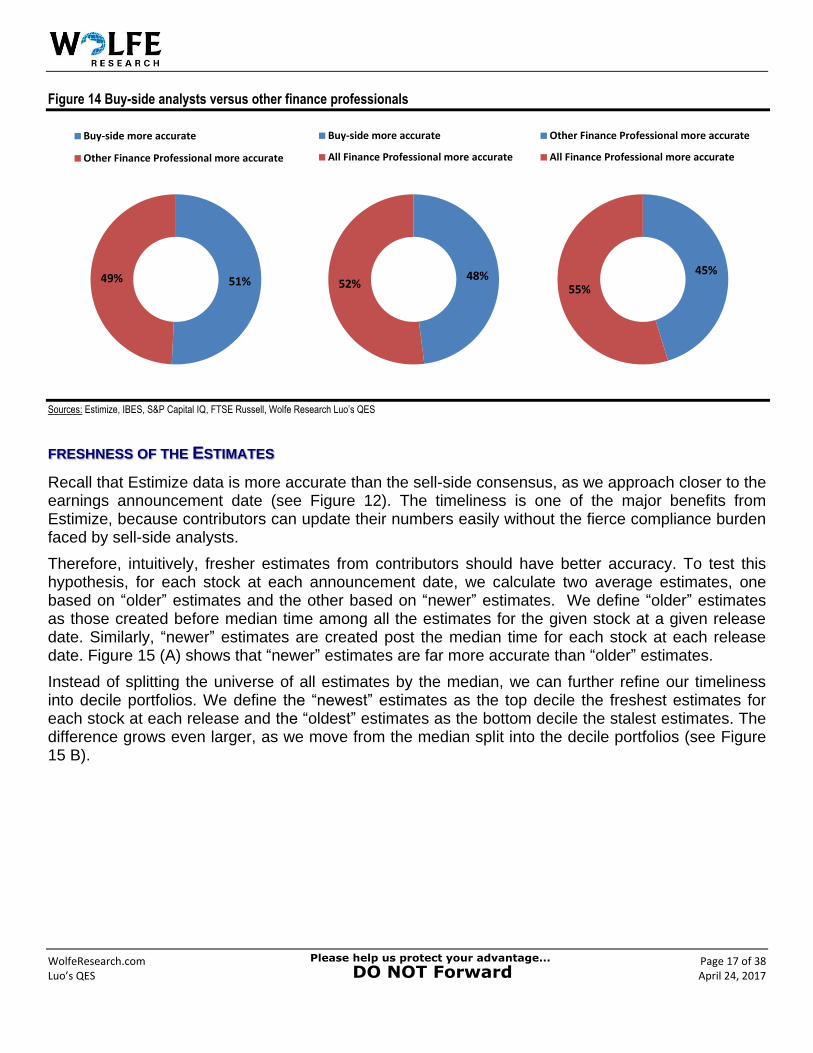
We next investigate, among the professionals, whether buy-side contributors have more accurate estimates than other professionals. Figure 14 shows that, on average, buy-side analysts are slightly more accurate than other finance professionals. However, similar to what we have seen in the previous section, combining the buy-side and other professionals further boosts the prediction accuracy, due to the diversification benefit.
50%50%
Finance Professional more accurate
Non-professional more accurate
47%53%
Non-professional more accurate
All Estimize more accurate
47%53%
Finance Professional more accurate
All Estimize more accurate
WolfeResearch.com Page 17 of 38 Luo’s QES April 24, 2017
Figure 14 Buy-side analysts versus other finance professionals
Sources: Estimize, IBES, S&P Capital IQ, FTSE Russell, Wolfe Research Luo’s QES
FRESHNESS OF THE ESTIMATES
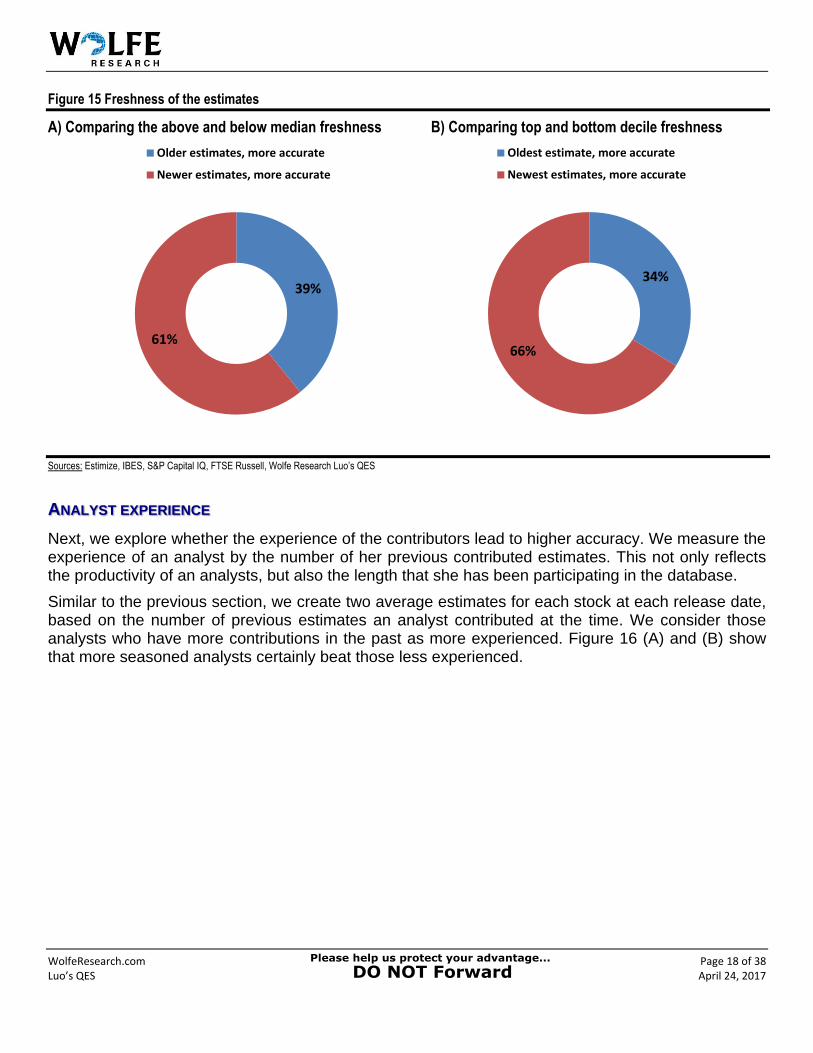
Recall that Estimize data is more accurate than the sell-side consensus, as we approach closer to the earnings announcement date (see Figure 12). The timeliness is one of the major benefits from Estimize, because contributors can update their numbers easily without the fierce compliance burden faced by sell-side analysts.
Therefore, intuitively, fresher estimates from contributors should have better accuracy. To test this hypothesis, for each stock at each announcement date, we calculate two average estimates, one based on “older” estimates and the other based on “newer” estimates. We define “older” estimates as those created before median time among all the estimates for the given stock at a given release date. Similarly, “newer” estimates are created post the median time for each stock at each release date. Figure 15 (A) shows that “newer” estimates are far more accurate than “older” estimates.
Instead of splitting the universe of all estimates by the median, we can further refine our timeliness into decile portfolios. We define the “newest” estimates as the top decile the freshest estimates for each stock at each release and the “oldest” estimates as the bottom decile the stalest estimates. The difference grows even larger, as we move from the median split into the decile portfolios (see Figure 15 B).
51%49%
Buy-side more accurate
Other Finance Professional more accurate
48%52%
Buy-side more accurate
All Finance Professional more accurate
45%
55%
Other Finance Professional more accurate
All Finance Professional more accurate
WolfeResearch.com Page 18 of 38 Luo’s QES April 24, 2017
Figure 15 Freshness of the estimates
A) Comparing the above and below median freshness B) Comparing top and bottom decile freshness
Sources: Estimize, IBES, S&P Capital IQ, FTSE Russell, Wolfe Research Luo’s QES
ANALYST EXPERIENCE
Next, we explore whether the experience of the contributors lead to higher accuracy. We measure the experience of an analyst by the number of her previous contributed estimates. This not only reflects the productivity of an analysts, but also the length that she has been participating in the database.
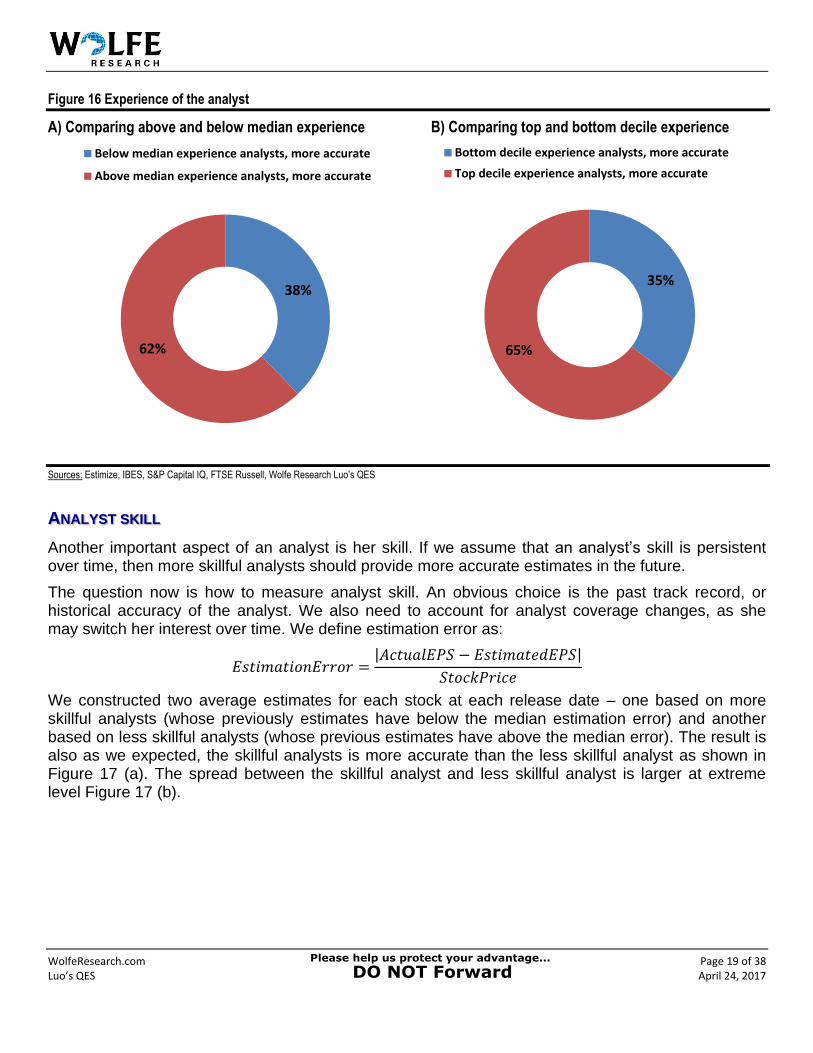
Similar to the previous section, we create two average estimates for each stock at each release date, based on the number of previous estimates an analyst contributed at the time. We consider those analysts who have more contributions in the past as more experienced. Figure 16 (A) and (B) show that more seasoned analysts certainly beat those less experienced.
39%
61%
Older estimates, more accurate
Newer estimates, more accurate
34%
66%
Oldest estimate, more accurate
Newest estimates, more accurate
WolfeResearch.com Page 19 of 38 Luo’s QES April 24, 2017
Figure 16 Experience of the analyst
A) Comparing above and below median experience B) Comparing top and bottom decile experience
Sources: Estimize, IBES, S&P Capital IQ, FTSE Russell, Wolfe Research Luo’s QES
ANALYST SKILL
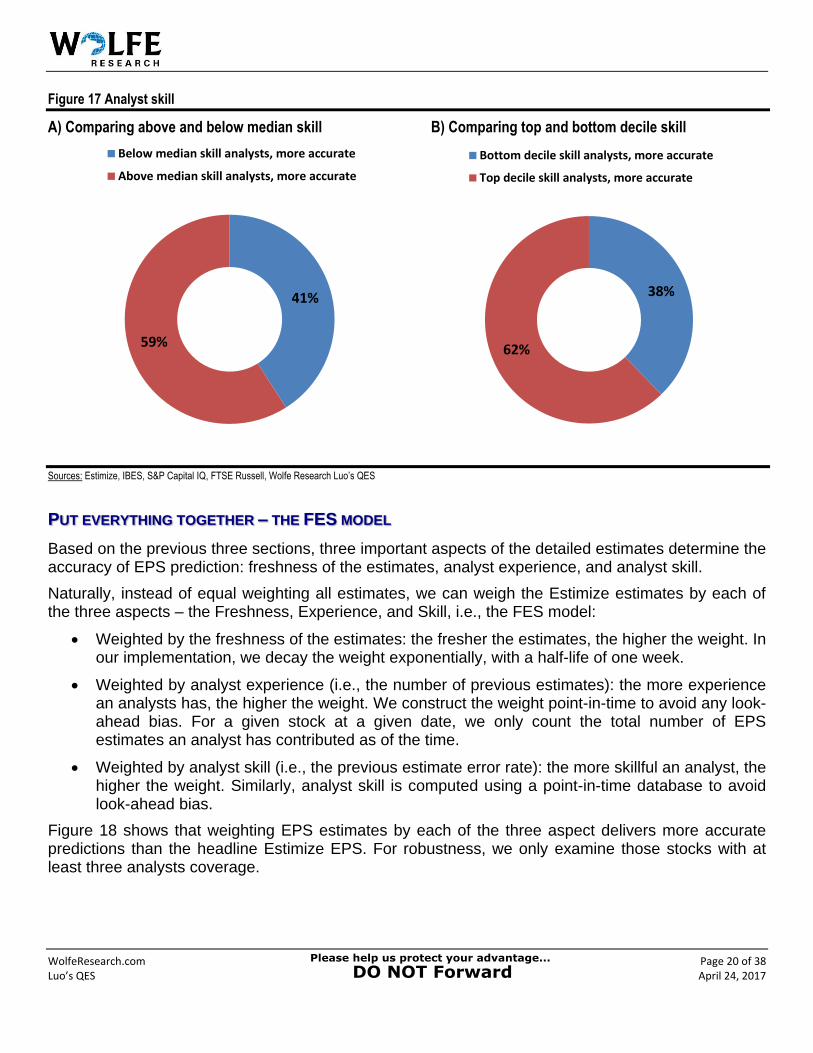
Another important aspect of an analyst is her skill. If we assume that an analyst’s skill is persistent over time, then more skillful analysts should provide more accurate estimates in the future.
The question now is how to measure analyst skill. An obvious choice is the past track record, or historical accuracy of the analyst. We also need to account for analyst coverage changes, as she may switch her interest over time. We define estimation error as:
𝐸𝑠𝑡𝑖𝑚𝑎𝑡𝑖𝑜𝑛𝐸𝑟𝑟𝑜𝑟 =|𝐴𝑐𝑡𝑢𝑎𝑙𝐸𝑃𝑆 − 𝐸𝑠𝑡𝑖𝑚𝑎𝑡𝑒𝑑𝐸𝑃𝑆|
𝑆𝑡𝑜𝑐𝑘𝑃𝑟𝑖𝑐𝑒
We constructed two average estimates for each stock at each release date – one based on more skillful analysts (whose previously estimates have below the median estimation error) and another based on less skillful analysts (whose previous estimates have above the median error). The result is also as we expected, the skillful analysts is more accurate than the less skillful analyst as shown in Figure 17 (a). The spread between the skillful analyst and less skillful analyst is larger at extreme level Figure 17 (b).
38%
62%
Below median experience analysts, more accurate
Above median experience analysts, more accurate
35%
65%
Bottom decile experience analysts, more accurate
Top decile experience analysts, more accurate
WolfeResearch.com Page 20 of 38 Luo’s QES April 24, 2017
Figure 17 Analyst skill
A) Comparing above and below median skill B) Comparing top and bottom decile skill
Sources: Estimize, IBES, S&P Capital IQ, FTSE Russell, Wolfe Research Luo’s QES
PUT EVERYTHING TOGETHER – THE FES MODEL
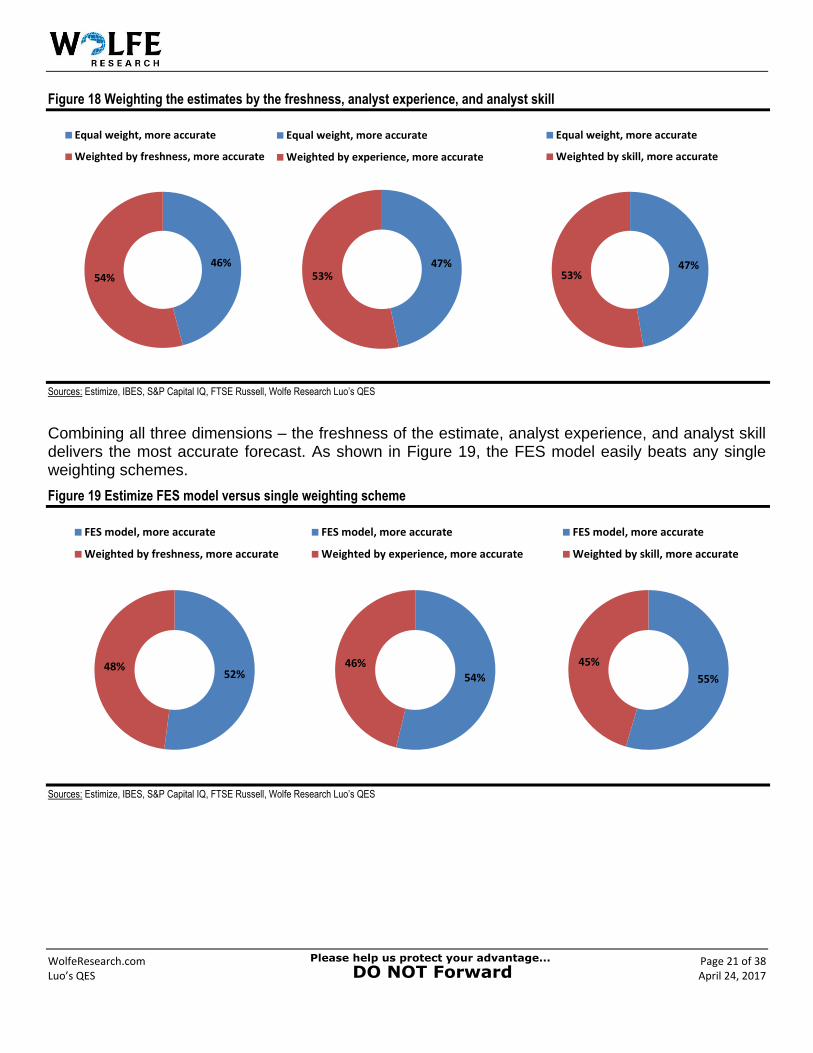
Based on the previous three sections, three important aspects of the detailed estimates determine the accuracy of EPS prediction: freshness of the estimates, analyst experience, and analyst skill.
Naturally, instead of equal weighting all estimates, we can weigh the Estimize estimates by each of the three aspects – the Freshness, Experience, and Skill, i.e., the FES model:
Weighted by the freshness of the estimates: the fresher the estimates, the higher the weight. Inour implementation, we decay the weight exponentially, with a half-life of one week.
Weighted by analyst experience (i.e., the number of previous estimates): the more experiencean analysts has, the higher the weight. We construct the weight point-in-time to avoid any look-ahead bias. For a given stock at a given date, we only count the total number of EPSestimates an analyst has contributed as of the time.
Weighted by analyst skill (i.e., the previous estimate error rate): the more skillful an analyst, thehigher the weight. Similarly, analyst skill is computed using a point-in-time database to avoidlook-ahead bias.
Figure 18 shows that weighting EPS estimates by each of the three aspect delivers more accurate predictions than the headline Estimize EPS. For robustness, we only examine those stocks with at least three analysts coverage.
41%
59%
Below median skill analysts, more accurate
Above median skill analysts, more accurate
38%
62%
Bottom decile skill analysts, more accurate
Top decile skill analysts, more accurate
WolfeResearch.com Page 21 of 38 Luo’s QES April 24, 2017
Figure 18 Weighting the estimates by the freshness, analyst experience, and analyst skill
Sources: Estimize, IBES, S&P Capital IQ, FTSE Russell, Wolfe Research Luo’s QES
Combining all three dimensions – the freshness of the estimate, analyst experience, and analyst skill delivers the most accurate forecast. As shown in Figure 19, the FES model easily beats any single weighting schemes.
Figure 19 Estimize FES model versus single weighting scheme
Sources: Estimize, IBES, S&P Capital IQ, FTSE Russell, Wolfe Research Luo’s QES
46%
54%
Equal weight, more accurate
Weighted by freshness, more accurate
47%53%
Equal weight, more accurate
Weighted by experience, more accurate
47%53%
Equal weight, more accurate
Weighted by skill, more accurate
52%48%
FES model, more accurate
Weighted by freshness, more accurate
54%46%
FES model, more accurate
Weighted by experience, more accurate
55%
45%
FES model, more accurate
Weighted by skill, more accurate
WolfeResearch.com Page 22 of 38 Luo’s QES April 24, 2017
TRADING AROUND EARNINGS ANNOUNCEMENTS
The earnings announcement is among the most significant market moving corporate events. Since the crowdsourced Estimize EPS tend to be more accurate and complement traditional sell-side consensus, we can potentially make better investment decisions around earnings announcements.
PRE-EARNINGS ANNOUNCEMENT STRATEGY
As a benchmark, we combine the quarterly EPS estimates from IBES and CIQ as the sell-side consensus. This data is updated at a daily frequency. At the same time, we also construct a daily Estimize aggregated EPS estimate, based on all the data submitted before market close. We use the FES model described in the previous section to represent Estimize estimates.
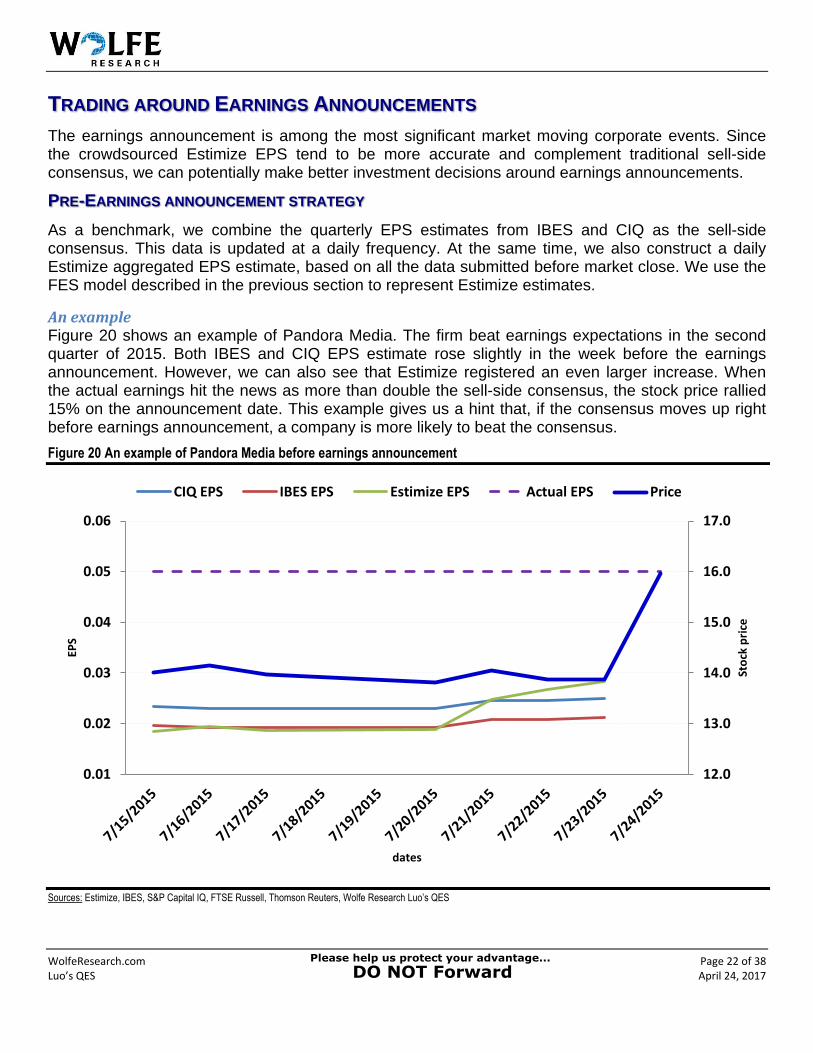
An example Figure 20 shows an example of Pandora Media. The firm beat earnings expectations in the second quarter of 2015. Both IBES and CIQ EPS estimate rose slightly in the week before the earnings announcement. However, we can also see that Estimize registered an even larger increase. When the actual earnings hit the news as more than double the sell-side consensus, the stock price rallied 15% on the announcement date. This example gives us a hint that, if the consensus moves up right before earnings announcement, a company is more likely to beat the consensus.
Figure 20 An example of Pandora Media before earnings announcement
Sources: Estimize, IBES, S&P Capital IQ, FTSE Russell, Thomson Reuters, Wolfe Research Luo’s QES
12.0
13.0
14.0
15.0
16.0
17.0
0.01
0.02
0.03
0.04
0.05
0.06
Sto
ck p
rice
EPS
dates
CIQ EPS IBES EPS Estimize EPS Actual EPS Price
WolfeResearch.com Page 23 of 38 Luo’s QES April 24, 2017
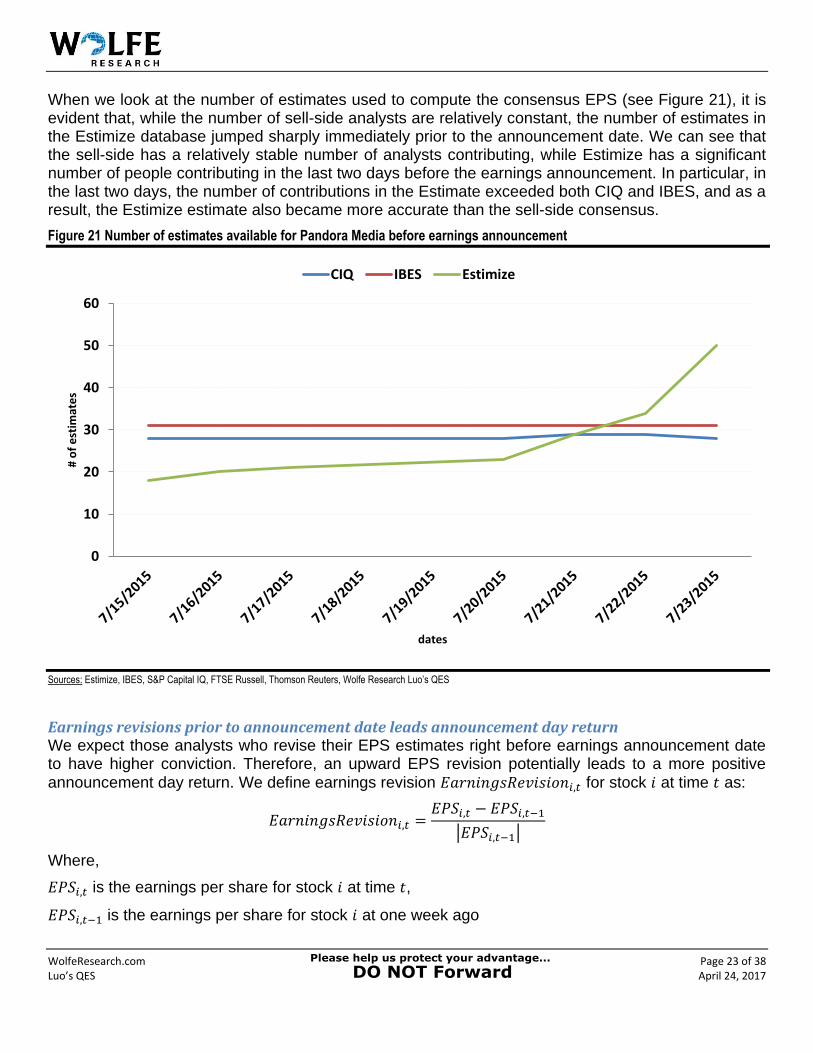
When we look at the number of estimates used to compute the consensus EPS (see Figure 21), it is evident that, while the number of sell-side analysts are relatively constant, the number of estimates in the Estimize database jumped sharply immediately prior to the announcement date. We can see that the sell-side has a relatively stable number of analysts contributing, while Estimize has a significant number of people contributing in the last two days before the earnings announcement. In particular, in the last two days, the number of contributions in the Estimate exceeded both CIQ and IBES, and as a result, the Estimize estimate also became more accurate than the sell-side consensus.
Figure 21 Number of estimates available for Pandora Media before earnings announcement
Sources: Estimize, IBES, S&P Capital IQ, FTSE Russell, Thomson Reuters, Wolfe Research Luo’s QES
Earnings revisions prior to announcement date leads announcement day return We expect those analysts who revise their EPS estimates right before earnings announcement date to have higher conviction. Therefore, an upward EPS revision potentially leads to a more positive announcement day return. We define earnings revision 𝐸𝑎𝑟𝑛𝑖𝑛𝑔𝑠𝑅𝑒𝑣𝑖𝑠𝑖𝑜𝑛𝑖,𝑡 for stock 𝑖 at time 𝑡 as:
𝐸𝑎𝑟𝑛𝑖𝑛𝑔𝑠𝑅𝑒𝑣𝑖𝑠𝑖𝑜𝑛𝑖,𝑡 =𝐸𝑃𝑆𝑖,𝑡 − 𝐸𝑃𝑆𝑖,𝑡−1
|𝐸𝑃𝑆𝑖,𝑡−1|
Where,
𝐸𝑃𝑆𝑖,𝑡 is the earnings per share for stock 𝑖 at time 𝑡,
𝐸𝑃𝑆𝑖,𝑡−1 is the earnings per share for stock 𝑖 at one week ago
0
10
20
30
40
50
60
# o
f e
stim
ate
s
dates
CIQ IBES Estimize
WolfeResearch.com Page 24 of 38 Luo’s QES April 24, 2017
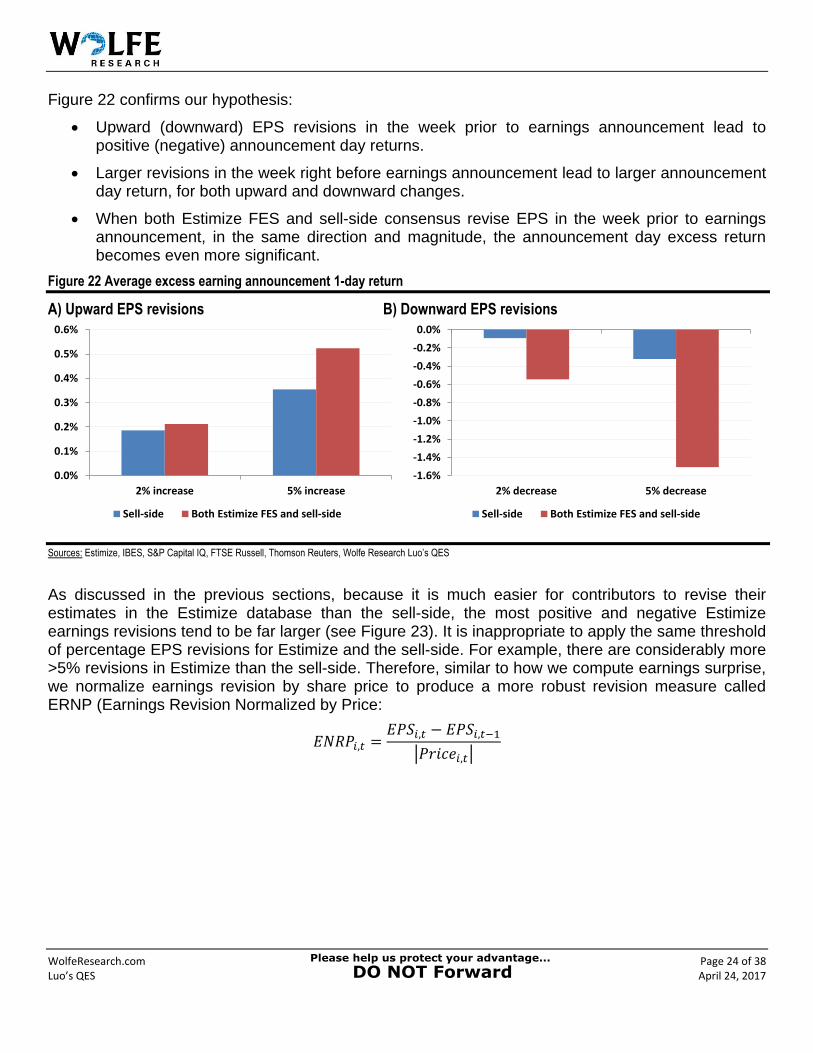
Figure 22 confirms our hypothesis:
Upward (downward) EPS revisions in the week prior to earnings announcement lead topositive (negative) announcement day returns.
Larger revisions in the week right before earnings announcement lead to larger announcementday return, for both upward and downward changes.
When both Estimize FES and sell-side consensus revise EPS in the week prior to earningsannouncement, in the same direction and magnitude, the announcement day excess returnbecomes even more significant.
Figure 22 Average excess earning announcement 1-day return
A) Upward EPS revisions B) Downward EPS revisions
Sources: Estimize, IBES, S&P Capital IQ, FTSE Russell, Thomson Reuters, Wolfe Research Luo’s QES
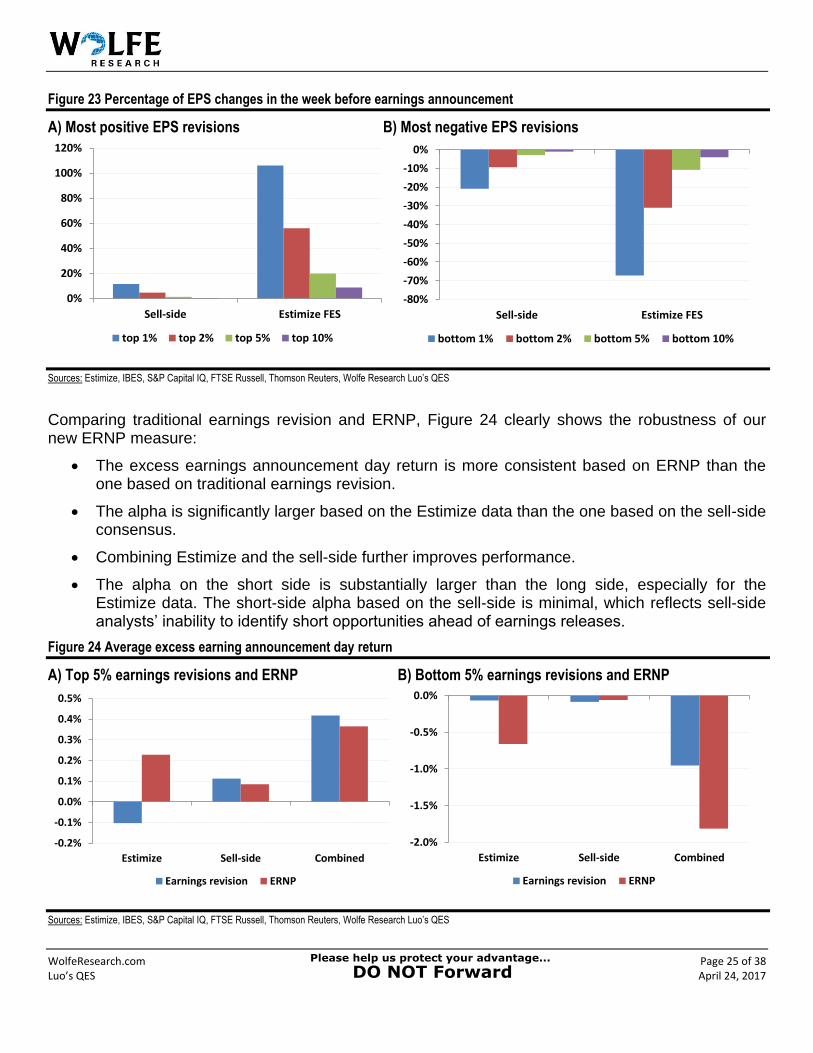
As discussed in the previous sections, because it is much easier for contributors to revise their estimates in the Estimize database than the sell-side, the most positive and negative Estimize earnings revisions tend to be far larger (see Figure 23). It is inappropriate to apply the same threshold of percentage EPS revisions for Estimize and the sell-side. For example, there are considerably more >5% revisions in Estimize than the sell-side. Therefore, similar to how we compute earnings surprise,we normalize earnings revision by share price to produce a more robust revision measure calledERNP (Earnings Revision Normalized by Price:
𝐸𝑁𝑅𝑃𝑖,𝑡 =𝐸𝑃𝑆𝑖,𝑡 − 𝐸𝑃𝑆𝑖,𝑡−1
|𝑃𝑟𝑖𝑐𝑒𝑖,𝑡|
0.0%
0.1%
0.2%
0.3%
0.4%
0.5%
0.6%
2% increase 5% increase
Sell-side Both Estimize FES and sell-side
-1.6%
-1.4%
-1.2%
-1.0%
-0.8%
-0.6%
-0.4%
-0.2%
0.0%
2% decrease 5% decrease
Sell-side Both Estimize FES and sell-side
WolfeResearch.com Page 25 of 38 Luo’s QES April 24, 2017
Figure 23 Percentage of EPS changes in the week before earnings announcement
A) Most positive EPS revisions B) Most negative EPS revisions
Sources: Estimize, IBES, S&P Capital IQ, FTSE Russell, Thomson Reuters, Wolfe Research Luo’s QES
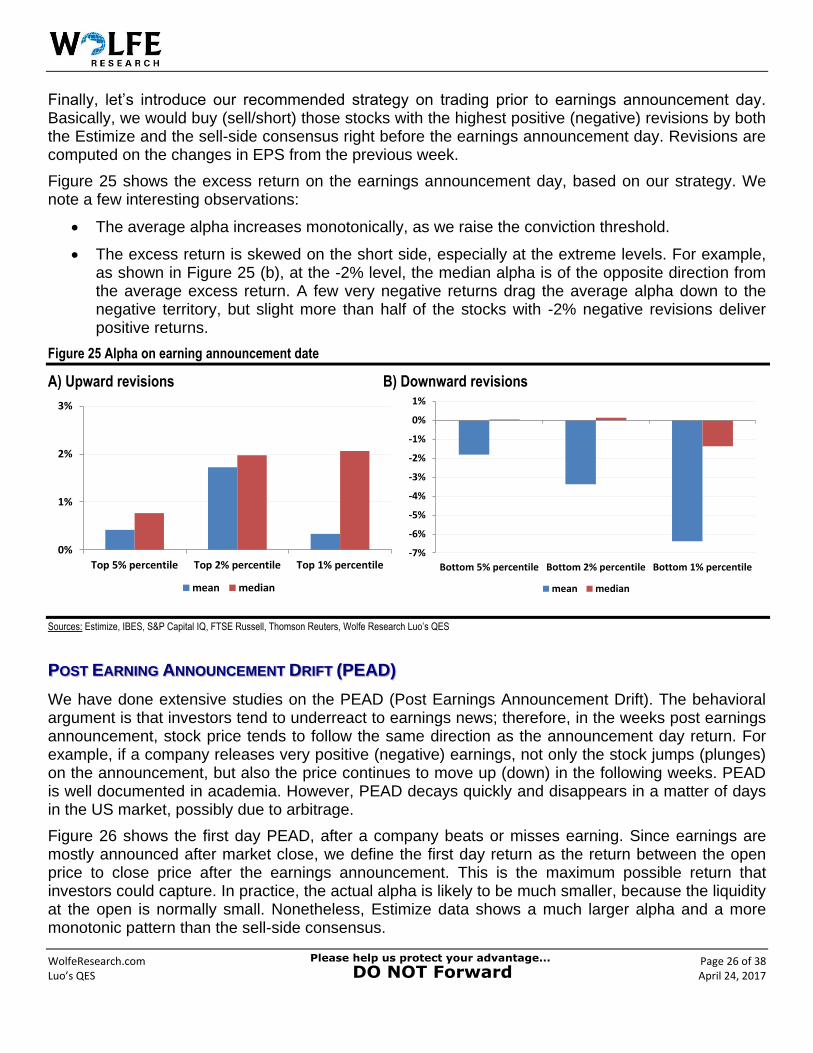
Comparing traditional earnings revision and ERNP, Figure 24 clearly shows the robustness of our new ERNP measure:
The excess earnings announcement day return is more consistent based on ERNP than theone based on traditional earnings revision.
The alpha is significantly larger based on the Estimize data than the one based on the sell-sideconsensus.
Combining Estimize and the sell-side further improves performance.
The alpha on the short side is substantially larger than the long side, especially for theEstimize data. The short-side alpha based on the sell-side is minimal, which reflects sell-sideanalysts’ inability to identify short opportunities ahead of earnings releases.
Figure 24 Average excess earning announcement day return
A) Top 5% earnings revisions and ERNP B) Bottom 5% earnings revisions and ERNP
Sources: Estimize, IBES, S&P Capital IQ, FTSE Russell, Thomson Reuters, Wolfe Research Luo’s QES
0%
20%
40%
60%
80%
100%
120%
Sell-side Estimize FES
top 1% top 2% top 5% top 10%
-80%
-70%
-60%
-50%
-40%
-30%
-20%
-10%
0%
Sell-side Estimize FES
bottom 1% bottom 2% bottom 5% bottom 10%
-0.2%
-0.1%
0.0%
0.1%
0.2%
0.3%
0.4%
0.5%
Estimize Sell-side Combined
Earnings revision ERNP
-2.0%
-1.5%
-1.0%
-0.5%
0.0%
Estimize Sell-side Combined
Earnings revision ERNP
WolfeResearch.com Page 26 of 38 Luo’s QES April 24, 2017
Finally, let’s introduce our recommended strategy on trading prior to earnings announcement day. Basically, we would buy (sell/short) those stocks with the highest positive (negative) revisions by both the Estimize and the sell-side consensus right before the earnings announcement day. Revisions are computed on the changes in EPS from the previous week.
Figure 25 shows the excess return on the earnings announcement day, based on our strategy. We note a few interesting observations:
The average alpha increases monotonically, as we raise the conviction threshold.
The excess return is skewed on the short side, especially at the extreme levels. For example,as shown in Figure 25 (b), at the -2% level, the median alpha is of the opposite direction fromthe average excess return. A few very negative returns drag the average alpha down to thenegative territory, but slight more than half of the stocks with -2% negative revisions deliverpositive returns.
Figure 25 Alpha on earning announcement date
A) Upward revisions B) Downward revisions
Sources: Estimize, IBES, S&P Capital IQ, FTSE Russell, Thomson Reuters, Wolfe Research Luo’s QES
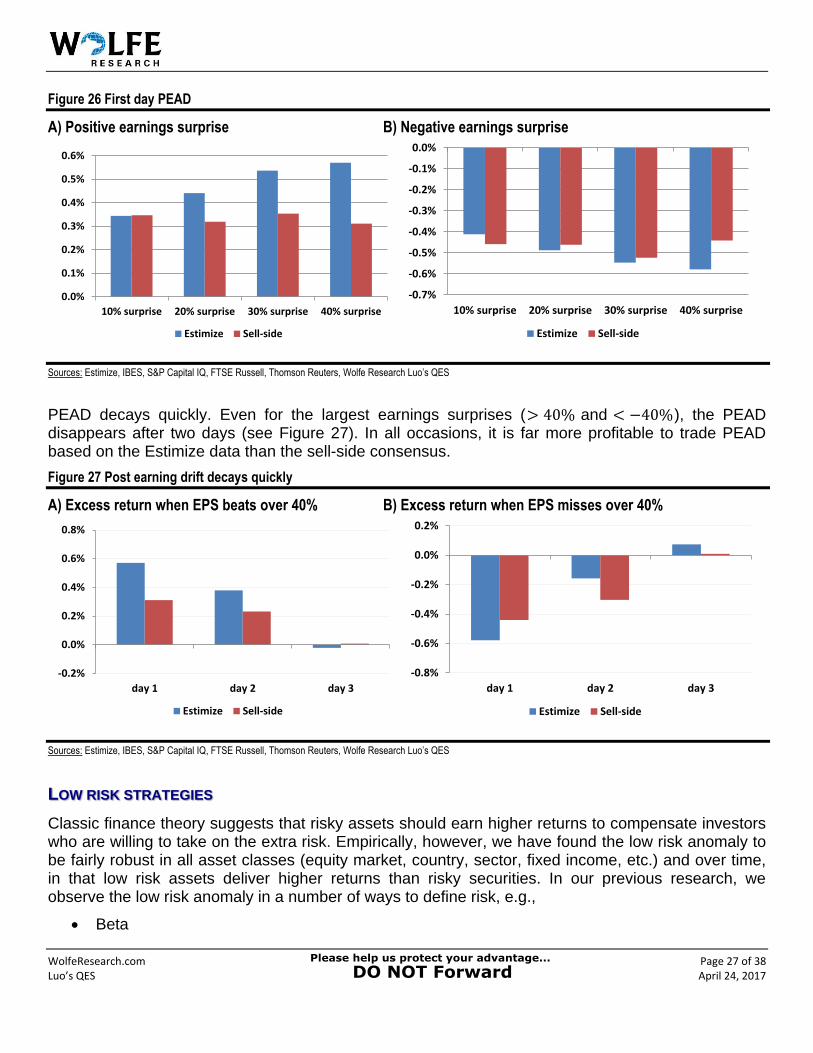
POST EARNING ANNOUNCEMENT DRIFT (PEAD)
We have done extensive studies on the PEAD (Post Earnings Announcement Drift). The behavioral argument is that investors tend to underreact to earnings news; therefore, in the weeks post earnings announcement, stock price tends to follow the same direction as the announcement day return. For example, if a company releases very positive (negative) earnings, not only the stock jumps (plunges) on the announcement, but also the price continues to move up (down) in the following weeks. PEAD is well documented in academia. However, PEAD decays quickly and disappears in a matter of days in the US market, possibly due to arbitrage.
Figure 26 shows the first day PEAD, after a company beats or misses earning. Since earnings are mostly announced after market close, we define the first day return as the return between the open price to close price after the earnings announcement. This is the maximum possible return that investors could capture. In practice, the actual alpha is likely to be much smaller, because the liquidity at the open is normally small. Nonetheless, Estimize data shows a much larger alpha and a more monotonic pattern than the sell-side consensus.
0%
1%
2%
3%
Top 5% percentile Top 2% percentile Top 1% percentile
mean median
-7%
-6%
-5%
-4%
-3%
-2%
-1%
0%
1%
Bottom 5% percentile Bottom 2% percentile Bottom 1% percentile
mean median
WolfeResearch.com Page 27 of 38 Luo’s QES April 24, 2017
Figure 26 First day PEAD
A) Positive earnings surprise B) Negative earnings surprise
Sources: Estimize, IBES, S&P Capital IQ, FTSE Russell, Thomson Reuters, Wolfe Research Luo’s QES
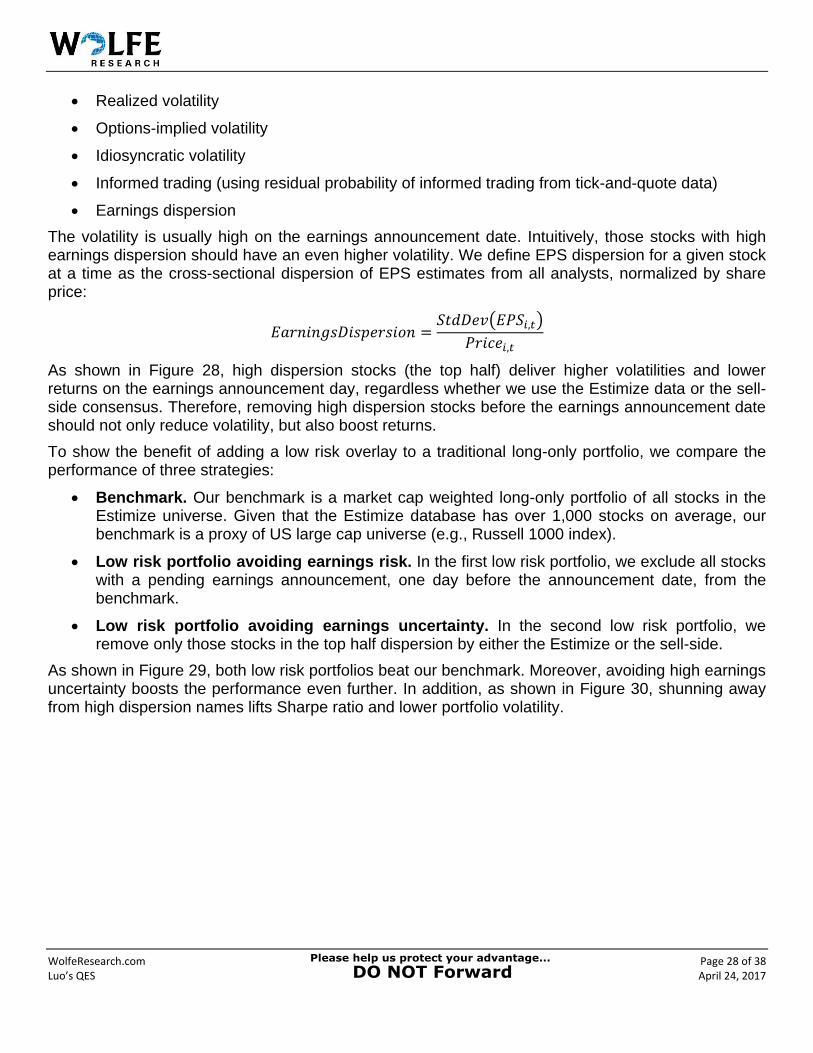
PEAD decays quickly. Even for the largest earnings surprises (> 40% and < −40%), the PEAD disappears after two days (see Figure 27). In all occasions, it is far more profitable to trade PEAD based on the Estimize data than the sell-side consensus.
Figure 27 Post earning drift decays quickly
A) Excess return when EPS beats over 40% B) Excess return when EPS misses over 40%
Sources: Estimize, IBES, S&P Capital IQ, FTSE Russell, Thomson Reuters, Wolfe Research Luo’s QES
LOW RISK STRATEGIES
Classic finance theory suggests that risky assets should earn higher returns to compensate investors who are willing to take on the extra risk. Empirically, however, we have found the low risk anomaly to be fairly robust in all asset classes (equity market, country, sector, fixed income, etc.) and over time, in that low risk assets deliver higher returns than risky securities. In our previous research, we observe the low risk anomaly in a number of ways to define risk, e.g.,
Beta
0.0%
0.1%
0.2%
0.3%
0.4%
0.5%
0.6%
10% surprise 20% surprise 30% surprise 40% surprise
Estimize Sell-side
-0.7%
-0.6%
-0.5%
-0.4%
-0.3%
-0.2%
-0.1%
0.0%
10% surprise 20% surprise 30% surprise 40% surprise
Estimize Sell-side
-0.2%
0.0%
0.2%
0.4%
0.6%
0.8%
day 1 day 2 day 3
Estimize Sell-side
-0.8%
-0.6%
-0.4%
-0.2%
0.0%
0.2%
day 1 day 2 day 3
Estimize Sell-side
WolfeResearch.com Page 28 of 38 Luo’s QES April 24, 2017
Realized volatility
Options-implied volatility
Idiosyncratic volatility
Informed trading (using residual probability of informed trading from tick-and-quote data)
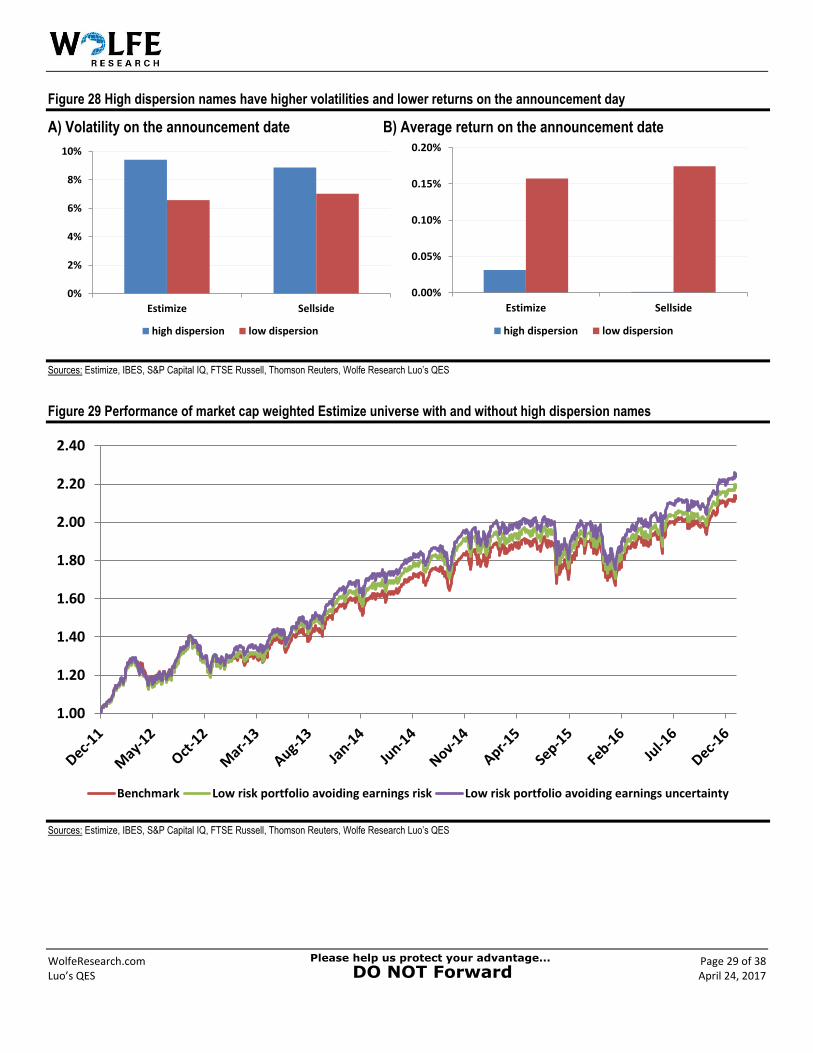
Earnings dispersion
The volatility is usually high on the earnings announcement date. Intuitively, those stocks with high earnings dispersion should have an even higher volatility. We define EPS dispersion for a given stock at a time as the cross-sectional dispersion of EPS estimates from all analysts, normalized by share price:
𝐸𝑎𝑟𝑛𝑖𝑛𝑔𝑠𝐷𝑖𝑠𝑝𝑒𝑟𝑠𝑖𝑜𝑛 =𝑆𝑡𝑑𝐷𝑒𝑣(𝐸𝑃𝑆𝑖,𝑡)
𝑃𝑟𝑖𝑐𝑒𝑖,𝑡
As shown in Figure 28, high dispersion stocks (the top half) deliver higher volatilities and lower returns on the earnings announcement day, regardless whether we use the Estimize data or the sell-side consensus. Therefore, removing high dispersion stocks before the earnings announcement date should not only reduce volatility, but also boost returns.
To show the benefit of adding a low risk overlay to a traditional long-only portfolio, we compare the performance of three strategies:
Benchmark. Our benchmark is a market cap weighted long-only portfolio of all stocks in theEstimize universe. Given that the Estimize database has over 1,000 stocks on average, ourbenchmark is a proxy of US large cap universe (e.g., Russell 1000 index).
Low risk portfolio avoiding earnings risk. In the first low risk portfolio, we exclude all stockswith a pending earnings announcement, one day before the announcement date, from thebenchmark.
Low risk portfolio avoiding earnings uncertainty. In the second low risk portfolio, weremove only those stocks in the top half dispersion by either the Estimize or the sell-side.
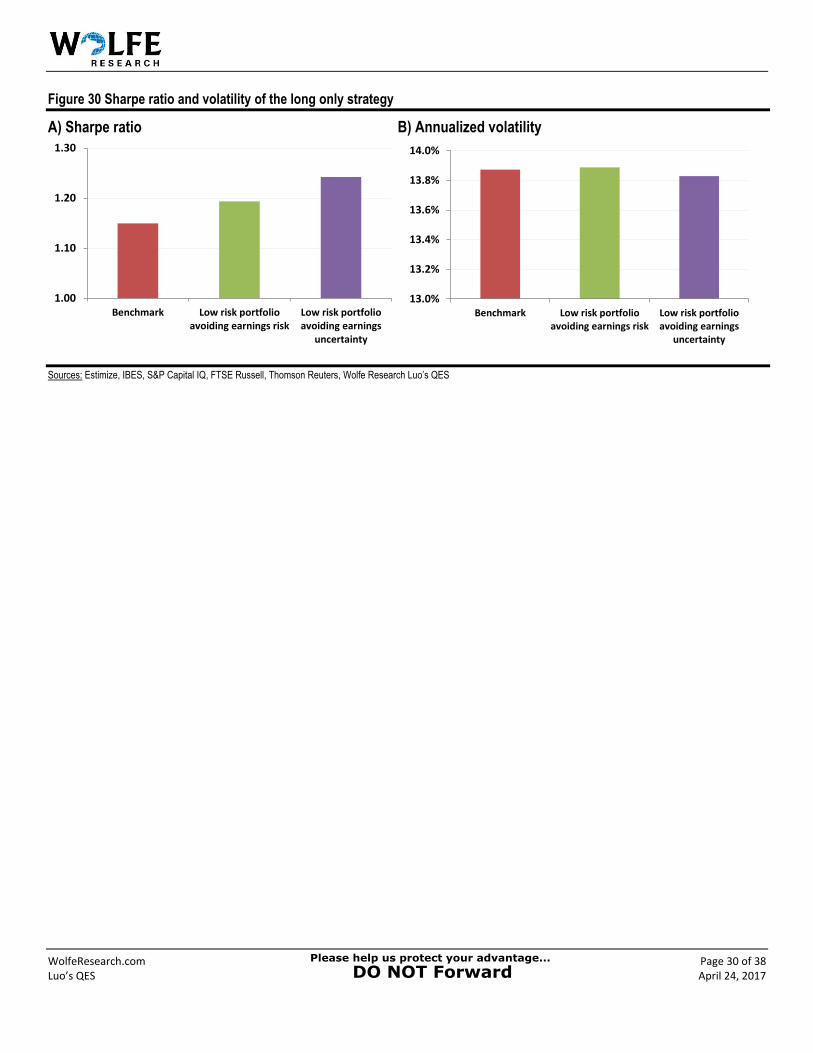
As shown in Figure 29, both low risk portfolios beat our benchmark. Moreover, avoiding high earnings uncertainty boosts the performance even further. In addition, as shown in Figure 30, shunning away from high dispersion names lifts Sharpe ratio and lower portfolio volatility.
WolfeResearch.com Page 29 of 38 Luo’s QES April 24, 2017
Figure 28 High dispersion names have higher volatilities and lower returns on the announcement day
A) Volatility on the announcement date B) Average return on the announcement date
Sources: Estimize, IBES, S&P Capital IQ, FTSE Russell, Thomson Reuters, Wolfe Research Luo’s QES
Figure 29 Performance of market cap weighted Estimize universe with and without high dispersion names
Sources: Estimize, IBES, S&P Capital IQ, FTSE Russell, Thomson Reuters, Wolfe Research Luo’s QES
0%
2%
4%
6%
8%
10%
Estimize Sellside
high dispersion low dispersion
0.00%
0.05%
0.10%
0.15%
0.20%
Estimize Sellside
high dispersion low dispersion
1.00
1.20
1.40
1.60
1.80
2.00
2.20
2.40
Benchmark Low risk portfolio avoiding earnings risk Low risk portfolio avoiding earnings uncertainty
WolfeResearch.com Page 30 of 38 Luo’s QES April 24, 2017
Figure 30 Sharpe ratio and volatility of the long only strategy
A) Sharpe ratio B) Annualized volatility
Sources: Estimize, IBES, S&P Capital IQ, FTSE Russell, Thomson Reuters, Wolfe Research Luo’s QES
1.00
1.10
1.20
1.30
Benchmark Low risk portfolioavoiding earnings risk
Low risk portfolioavoiding earnings
uncertainty
13.0%
13.2%
13.4%
13.6%
13.8%
14.0%
Benchmark Low risk portfolioavoiding earnings risk
Low risk portfolioavoiding earnings
uncertainty
WolfeResearch.com Page 31 of 38 Luo’s QES April 24, 2017
LONG TERM INVESTMENT STRATEGIES
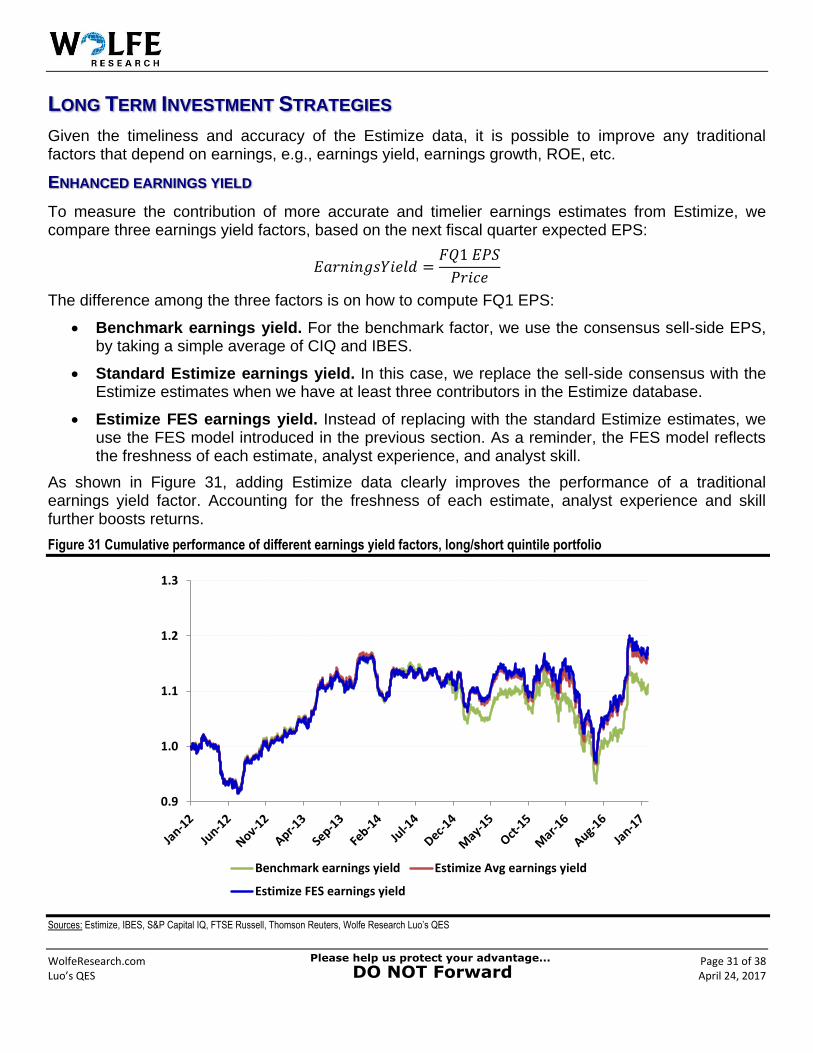
Given the timeliness and accuracy of the Estimize data, it is possible to improve any traditional factors that depend on earnings, e.g., earnings yield, earnings growth, ROE, etc.
ENHANCED EARNINGS YIELD
To measure the contribution of more accurate and timelier earnings estimates from Estimize, we compare three earnings yield factors, based on the next fiscal quarter expected EPS:
𝐸𝑎𝑟𝑛𝑖𝑛𝑔𝑠𝑌𝑖𝑒𝑙𝑑 =𝐹𝑄1 𝐸𝑃𝑆
𝑃𝑟𝑖𝑐𝑒
The difference among the three factors is on how to compute FQ1 EPS:
Benchmark earnings yield. For the benchmark factor, we use the consensus sell-side EPS,by taking a simple average of CIQ and IBES.
Standard Estimize earnings yield. In this case, we replace the sell-side consensus with theEstimize estimates when we have at least three contributors in the Estimize database.
Estimize FES earnings yield. Instead of replacing with the standard Estimize estimates, weuse the FES model introduced in the previous section. As a reminder, the FES model reflectsthe freshness of each estimate, analyst experience, and analyst skill.
As shown in Figure 31, adding Estimize data clearly improves the performance of a traditional earnings yield factor. Accounting for the freshness of each estimate, analyst experience and skill further boosts returns.
Figure 31 Cumulative performance of different earnings yield factors, long/short quintile portfolio
Sources: Estimize, IBES, S&P Capital IQ, FTSE Russell, Thomson Reuters, Wolfe Research Luo’s QES
0.9
1.0
1.1
1.2
1.3
Benchmark earnings yield Estimize Avg earnings yield
Estimize FES earnings yield
WolfeResearch.com Page 32 of 38 Luo’s QES April 24, 2017
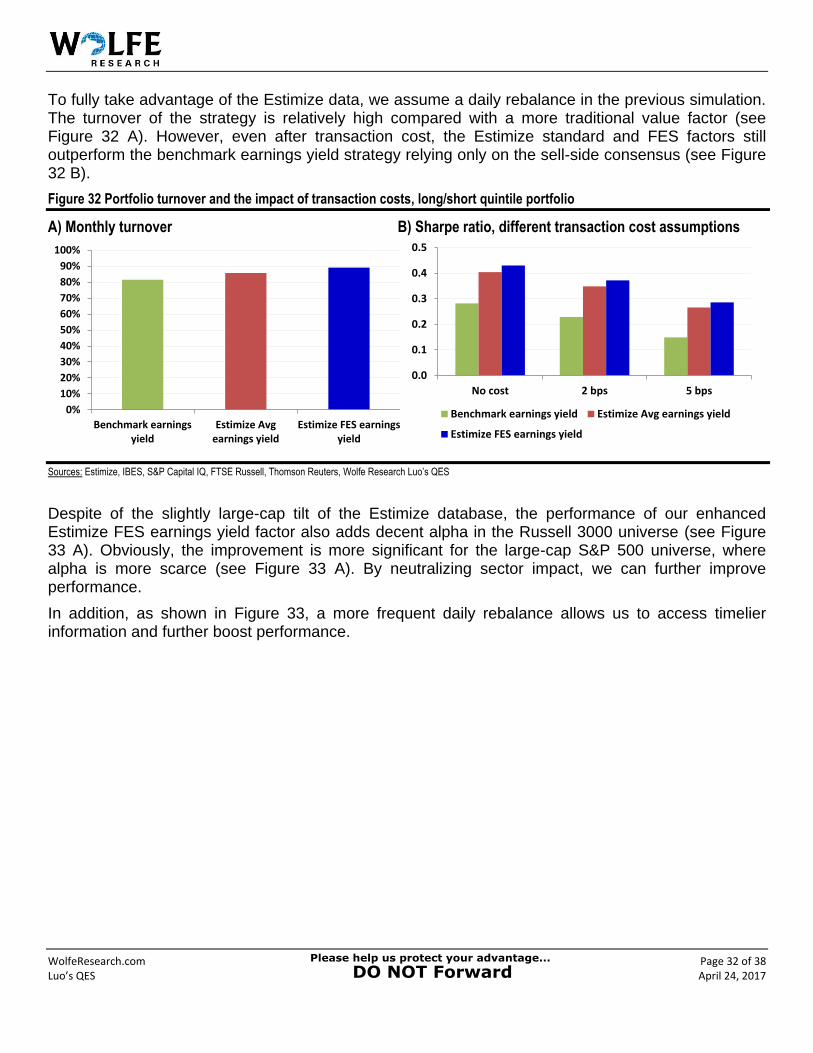
To fully take advantage of the Estimize data, we assume a daily rebalance in the previous simulation. The turnover of the strategy is relatively high compared with a more traditional value factor (see Figure 32 A). However, even after transaction cost, the Estimize standard and FES factors still outperform the benchmark earnings yield strategy relying only on the sell-side consensus (see Figure 32 B).
Figure 32 Portfolio turnover and the impact of transaction costs, long/short quintile portfolio
A) Monthly turnover B) Sharpe ratio, different transaction cost assumptions
Sources: Estimize, IBES, S&P Capital IQ, FTSE Russell, Thomson Reuters, Wolfe Research Luo’s QES
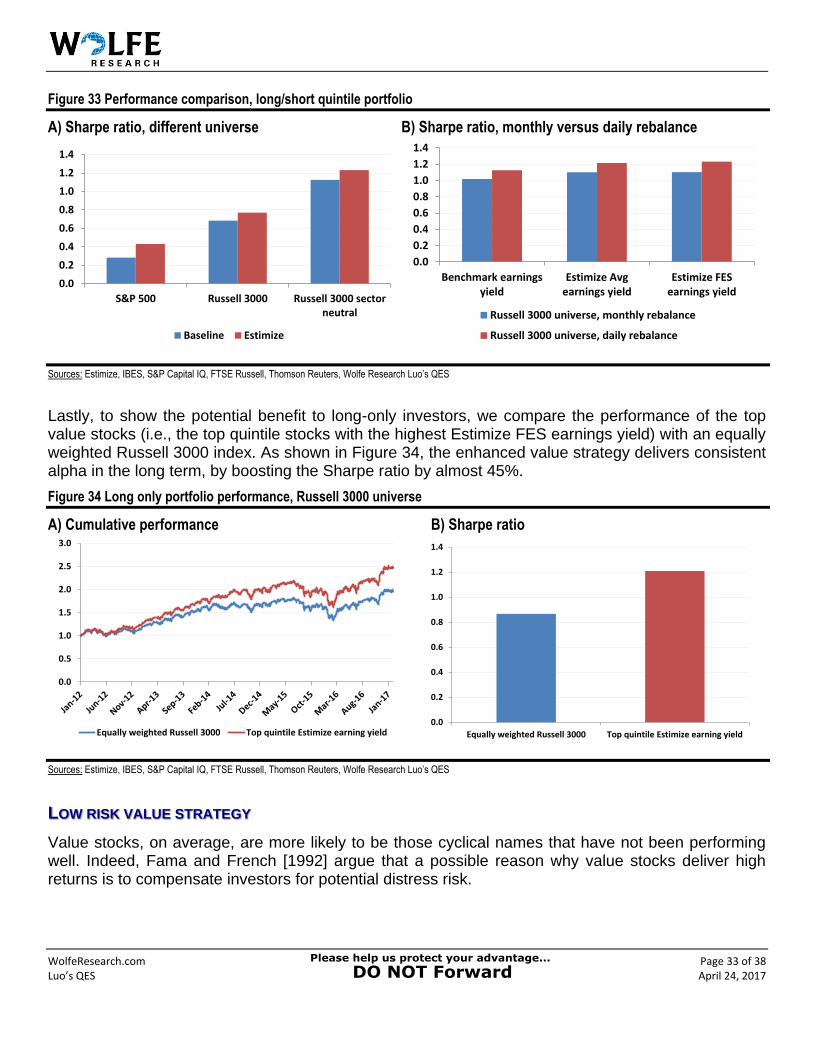
Despite of the slightly large-cap tilt of the Estimize database, the performance of our enhanced Estimize FES earnings yield factor also adds decent alpha in the Russell 3000 universe (see Figure 33 A). Obviously, the improvement is more significant for the large-cap S&P 500 universe, where alpha is more scarce (see Figure 33 A). By neutralizing sector impact, we can further improve performance.
In addition, as shown in Figure 33, a more frequent daily rebalance allows us to access timelier information and further boost performance.
0%
10%
20%
30%
40%
50%
60%
70%
80%
90%
100%
Benchmark earningsyield
Estimize Avgearnings yield
Estimize FES earningsyield
0.0
0.1
0.2
0.3
0.4
0.5
No cost 2 bps 5 bps
Benchmark earnings yield Estimize Avg earnings yield
Estimize FES earnings yield
WolfeResearch.com Page 33 of 38 Luo’s QES April 24, 2017
Figure 33 Performance comparison, long/short quintile portfolio
A) Sharpe ratio, different universe B) Sharpe ratio, monthly versus daily rebalance
Sources: Estimize, IBES, S&P Capital IQ, FTSE Russell, Thomson Reuters, Wolfe Research Luo’s QES
Lastly, to show the potential benefit to long-only investors, we compare the performance of the top value stocks (i.e., the top quintile stocks with the highest Estimize FES earnings yield) with an equally weighted Russell 3000 index. As shown in Figure 34, the enhanced value strategy delivers consistent alpha in the long term, by boosting the Sharpe ratio by almost 45%.
Figure 34 Long only portfolio performance, Russell 3000 universe
A) Cumulative performance B) Sharpe ratio
Sources: Estimize, IBES, S&P Capital IQ, FTSE Russell, Thomson Reuters, Wolfe Research Luo’s QES
LOW RISK VALUE STRATEGY
Value stocks, on average, are more likely to be those cyclical names that have not been performing well. Indeed, Fama and French [1992] argue that a possible reason why value stocks deliver high returns is to compensate investors for potential distress risk.
0.0
0.2
0.4
0.6
0.8
1.0
1.2
1.4
S&P 500 Russell 3000 Russell 3000 sectorneutral
Baseline Estimize
0.0
0.2
0.4
0.6
0.8
1.0
1.2
1.4
Benchmark earningsyield
Estimize Avgearnings yield
Estimize FESearnings yield
Russell 3000 universe, monthly rebalance
Russell 3000 universe, daily rebalance
0.0
0.5
1.0
1.5
2.0
2.5
3.0
Equally weighted Russell 3000 Top quintile Estimize earning yield0.0
0.2
0.4
0.6
0.8
1.0
1.2
1.4
Equally weighted Russell 3000 Top quintile Estimize earning yield
WolfeResearch.com Page 34 of 38 Luo’s QES April 24, 2017
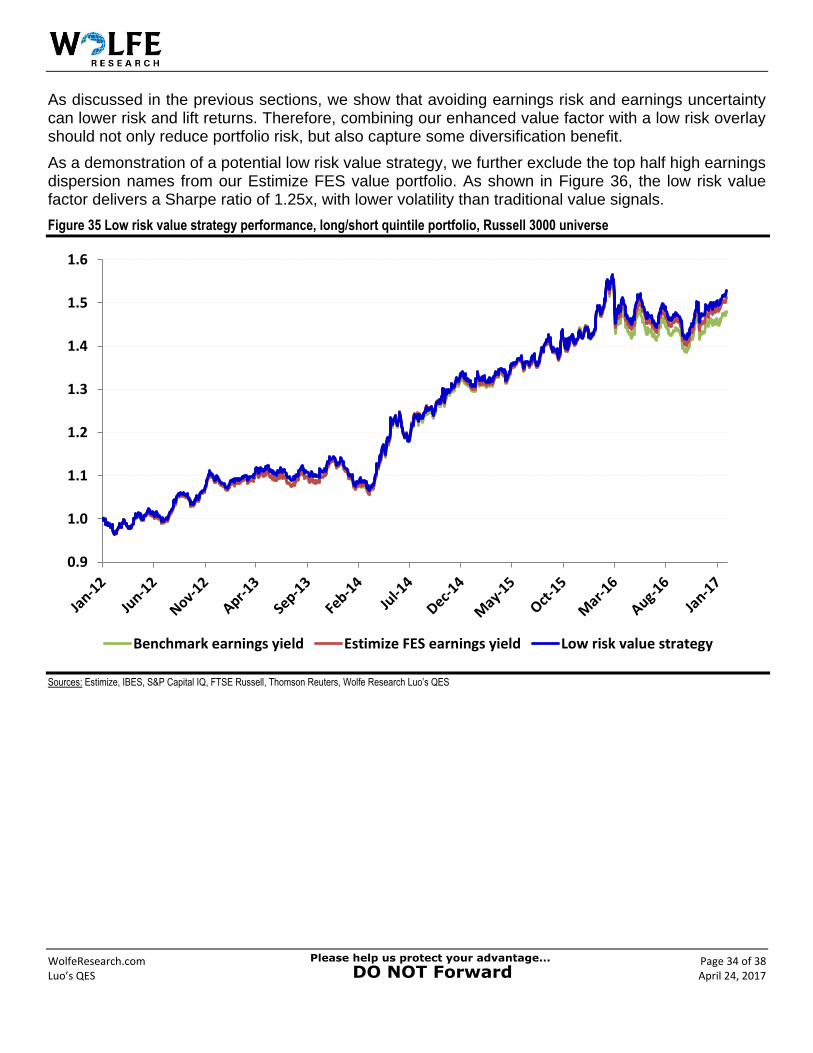
As discussed in the previous sections, we show that avoiding earnings risk and earnings uncertainty can lower risk and lift returns. Therefore, combining our enhanced value factor with a low risk overlay should not only reduce portfolio risk, but also capture some diversification benefit.
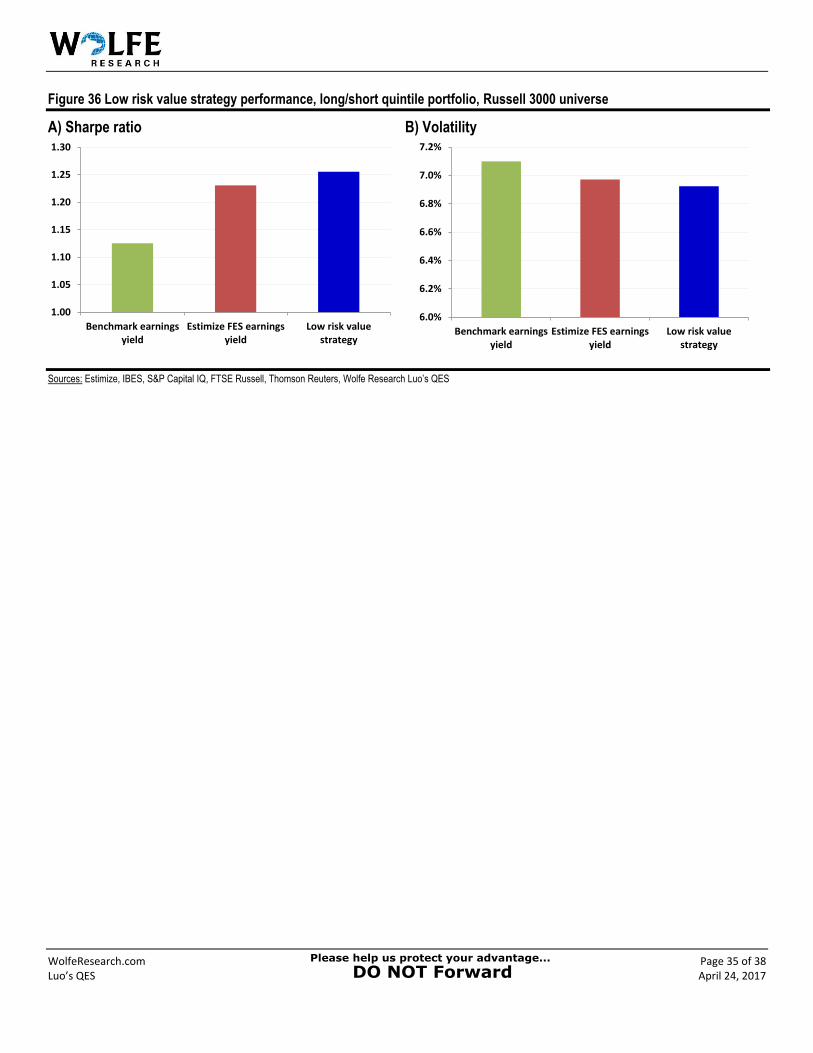
As a demonstration of a potential low risk value strategy, we further exclude the top half high earnings dispersion names from our Estimize FES value portfolio. As shown in Figure 36, the low risk value factor delivers a Sharpe ratio of 1.25x, with lower volatility than traditional value signals.
Figure 35 Low risk value strategy performance, long/short quintile portfolio, Russell 3000 universe
Sources: Estimize, IBES, S&P Capital IQ, FTSE Russell, Thomson Reuters, Wolfe Research Luo’s QES
0.9
1.0
1.1
1.2
1.3
1.4
1.5
1.6
Benchmark earnings yield Estimize FES earnings yield Low risk value strategy
WolfeResearch.com Page 35 of 38 Luo’s QES April 24, 2017
Figure 36 Low risk value strategy performance, long/short quintile portfolio, Russell 3000 universe
A) Sharpe ratio B) Volatility
Sources: Estimize, IBES, S&P Capital IQ, FTSE Russell, Thomson Reuters, Wolfe Research Luo’s QES
1.00
1.05
1.10
1.15
1.20
1.25
1.30
Benchmark earningsyield
Estimize FES earningsyield
Low risk valuestrategy
6.0%
6.2%
6.4%
6.6%
6.8%
7.0%
7.2%
Benchmark earningsyield
Estimize FES earningsyield
Low risk valuestrategy
WolfeResearch.com Page 36 of 38 Luo’s QES April 24, 2017
BIBLIOGRAPHY
Batchelor, R., & Dua, P. [1995]. “Forecaster diversity and the benefits of combining forecasts”, Management Science, 41(1), 68-75.
Da, Z., and Huang, X. [2016]. “Harnessing the wisdom of crowds”, Available at SSRN: https://ssrn.com/abstract=2731884
Drogen, L. , and Jha, V. [2013]. “Generating Abnormal Returns Using Crowdsourced Earnings Forecasts from Estimize”, Available at SSRN: https://ssrn.com/abstract=2337709
Fama, E.F., and French, K.R. [1992]. “The Cross-Section of Expected Stock Returns”, Journal of Finance, vol 47, Issue 2, 427-465
Jame, R., Johnston, R., Markov, S., and Wolfe, M. [2016]. “The value of crowdsourced earnings forecasts”, Journal of Accounting Research, 54(4), 1077-1110.
Johnston, R., Kang, T., and Wolfe, M. [2013]. “Crowdsourcing Forecasts: competition for sell-side analysts”, Journal of Accounting Research, Spring (2013): 493-522.
Liew, J. K. S., Guo, S., & Zhang, T. [2016]. “Tweet Sentiments and Crowd-Sourced Earnings Estimates as Valuable Sources of Information around Earnings Releases”, The Journal of Alternative Investments, 19(3), 7-26.
Lee, C. M., Ma, P., and Wang, C. [2016]. “The Search for Peer Firms: When Do Crowds Provide Wisdom?”, Harvard Business School Accounting & Management Unit Working Paper, No. 15-032
Luo, Y., Jussa, J., and Wang, S. [2017a]. “The Big and The Small Sides of Big Data”, Wolfe Research Luo’s QES, February 8, 2017
Luo, Y., Jussa, J., and Wang, S. [2017b]. “Signal Research and Multifactor Models”, Wolfe Research Luo’s QES, February 16, 2017
Luo, Y., Jussa, J., and Wang, S. [2017c]. “Style Rotation, Machine Learning, and The Quantum LEAP” Wolfe Research Luo’s QES, February 24, 2017
Nikolic, B., Bliss, B. A., and Kumar, A. [2016]. “Geography, Diversity, and Accuracy of Crowdsourced Earnings Forecasts”, Available at SSRN: https://ssrn.com/abstract=2579402

WolfeResearch.com Page 37 of 38 Luo’s QES April 24, 2017
DISCLOSURE SECTION
Analyst Certification: The analyst of Wolfe Research primarily responsible for this research report whose name appears first on the front page of this research report hereby certifies that (i) the recommendations and opinions expressed in this research report accurately reflect the research analysts’ personal views about the subject securities or issuers and (ii) no part of the research analysts’ compensation was, is or will be directly or indirectly related to the specific recommendations or views contained in this report.
Other Disclosures: Wolfe Research, LLC does not assign ratings of Buy, Hold or Sell to the stocks it covers. Outperform, Peer Perform and Underperform are not the respective equivalents of Buy, Hold and Sell but represent relative weightings as defined above. To satisfy regulatory requirements, Outperform has been designated to correspond with Buy, Peer Perform has been designated to correspond with Hold and Underperform has been designated to correspond with Sell.
Wolfe Research Securities and Wolfe Research, LLC have adopted the use of Wolfe Research as brand names. Wolfe Research Securities, a member of FINRA (www.finra.org) is the broker-dealer affiliate of Wolfe Research, LLC and is responsible for the contents of this material. Any analysts publishing these reports are dually employed by Wolfe Research, LLC and Wolfe Research Securities.
The content of this report is to be used solely for informational purposes and should not be regarded as an offer, or a solicitation of an offer, to buy or sell a security, financial instrument or service discussed herein. Opinions in this communication constitute the current judgment of the author as of the date and time of this report and are subject to change without notice. Information herein is believed to be reliable but Wolfe Research and its affiliates, including but not limited to Wolfe Research Securities, makes no representation that it is complete or accurate. The information provided in this communication is not designed to replace a recipient's own decision-making processes for assessing a proposed transaction or investment involving a financial instrument discussed herein. Recipients are encouraged to seek financial advice from their financial advisor regarding the appropriateness of investing in a security or financial instrument referred to in this report and should understand that statements regarding the future performance of the financial instruments or the securities referenced herein may not be realized. Past performance is not indicative of future results. This report is not intended for distribution to, or use by, any person or entity in any location where such distribution or use would be contrary to applicable law, or which would subject Wolfe Research, LLC or any affiliate to any registration requirement within such location. For additional important disclosures, please see www.wolferesearch.com/disclosures.
The views expressed in Wolfe Research, LLC research reports with regards to sectors and/or specific companies may from time to time be inconsistent with the views implied by inclusion of those sectors and companies in other Wolfe Research, LLC analysts’ research reports and modeling screens. Wolfe Research communicates with clients across a variety of mediums of the clients’ choosing including emails, voice blasts and electronic publication to our proprietary website.
Copyright © Wolfe Research, LLC 2017. All rights reserved. All material presented in this document, unless specifically indicated otherwise, is under copyright to Wolfe Research, LLC. None of the material, nor its content, nor any copy of it, may be altered in any way, or transmitted to or distributed to any other party, without the prior express written permission of Wolfe Research, LLC.

WolfeResearch.com Page 38 of 38 Luo’s QES April 24, 2017
This report is limited for the sole use of clients of Wolfe Research. Authorized users have received an encryption decoder which legislates and monitors the access to Wolfe Research, LLC content. Any distribution of the content produced by Wolfe Research, LLC will violate the understanding of the terms of our relationship.