Embed Size (px)
Citation preview
J A C C : C A R D I O V A S C U L A R I M A G I N G V O L . 1 1 , N O . 1 1 , 2 0 1 8
ª 2 0 1 8 B Y T H E A M E R I C A N C O L L E G E O F C A R D I O L O G Y F O U N D A T I O N
P U B L I S H E D B Y E L S E V I E R
Lung Ultrasound for the Cardiologist
Eugenio Picano, MD, PHD,a Maria Chiara Scali, MD, PHD,b Quirino Ciampi, MD, PHD,c Daniel Lichtenstein, MDdABSTRACT
ISS
Fro
Div
Un
to
Ma
For a cardiologist, lung ultrasound is an add-on to transthoracic echocardiography, just as lung auscultation is part of a
cardiac physical examination. A cardiac 3.5- to 5.0-MHz transducer is generally suitable because the small footprint
makes it ideal for scanning intercostal spaces. The image quality is often adequate, and the lung acoustic window is
always patent. The cumulative increase in imaging time is <1 min for the 2 main applications targeted on pleural water
(pleural effusion) and lung water (pulmonary congestion as multiple B-lines). In these settings, lung ultrasound out-
performs the diagnostic accuracy of the chest radiograph, with a low-cost, portable, real-time, radiation-free method. A
“wet lung” detected by lung ultrasound predicts impending acute heart failure decompensation and may trigger lung
decongestion therapy. The doctors of tomorrow may still listen with a stethoscope to their patient’s lung, but they will
certainly be seeing it with ultrasound. (J Am Coll Cardiol Img 2018;11:1692–705) © 2018 by the American College of
Cardiology Foundation.
LUNG ULTRASOUND IN CARDIOLOGY:
HISTORICAL BACKGROUND
Two hundred years after Laennec (1), who firstintroduced mediated lung auscultation as part of thephysical examination of the heart in 1819, the trans-ducer follows the same pathway as the stethoscope,from the cardiac area to lung fields, with severaldiagnostic benefits in the same examination. Thismay seem obvious now, but for our generation ofcardiologists it took 50 years of transthoracic echo-cardiography (TTE) practice before we shifted thetransducer by a few centimeters from the cardiacacoustic window to gain a view of the amazing newdiagnostic world of lung ultrasound.
In the 1990s, lung ultrasound was first proposedwith pioneering applications in the critically ill in arange of clinical conditions (2), including the detec-tion of hemodynamic acute pulmonary edema (APE).It was only in 2004 that TTE was combined with lungultrasound to detect pulmonary congestion in pa-tients with heart failure who were admitted to a car-diology ward (3).
In retrospect, the technological and cultural gapbetween TTE and lung ultrasound was very narrowand did not require an intuitive mind to bridge it. The2 techniques share the same equipment, with
N 1936-878X/$36.00
m the aCNR Institute of Clinical Physiology, Pisa, Italy; bCardiology Dep
ision, Fatebenefratelli Hospital, Benevento, Italy; and the dMedical Inte
iversity, Boulogne, France. All authors have reported that they have no
disclose.
nuscript received January 25, 2018; revised manuscript received May 25,
neighboring or superimposed scanning fields on theleft anterior hemithorax. The diagnostic informationprovided by lung ultrasound is of obvious clinicalinterest to the cardiologist, who is well aware of theprognostic and therapeutic relevance of extravascularlung water, and how a real-time assessment of lungwater may provide information complementary toconventional methods based on physical examinationand chest radiographs to detect pulmonary conges-tion. In addition, intensivists and cardiologists oftenwork on the same patients, and there is usually aclose spatial proximity between the intensive careand coronary units. This logistic setting shouldtheoretically facilitate the spread of innovative prac-tices. However, TTE and lung ultrasound remaineddivided for decades by an invisible but impenetrablecultural wall. Standard textbook knowledge told usthat the lung is filled with air (>90%), and air stopsthe ultrasound signal because of the very highimpedance mismatch with chest tissues. The clinicalcorollary was that “ultrasound imaging is not usefulfor evaluation of pulmonary parenchyma” (4). In re-ality, the lung acoustic window is always open, evenwhen the cardiac acoustic window for TTE is shut (5).Although only a limited portion of lung parenchymacan be visualized, this minute portion is criticallyimportant because most acute life-threatening
https://doi.org/10.1016/j.jcmg.2018.06.023
artment, Nottola Hospital, Siena, Italy; cCardiology
nsive Care Unit, Ambroise-Paré Hospital, Paris-West
relationships relevant to the contents of this paper
2018, accepted June 19, 2018.
AB BR E V I A T I O N S
AND ACRONYM S
AHF = acute heart failure
APE = acute pulmonary edema
ARDS = acute respiratory
distress syndrome
BLUE = bedside lung
ultrasonography in emergency
PLAPS = posterolateral
alveolar and/or pleural
syndrome
TTE = transthoracic
echocardiography
J A C C : C A R D I O V A S C U L A R I M A G I N G , V O L . 1 1 , N O . 1 1 , 2 0 1 8 Picano et al.N O V E M B E R 2 0 1 8 : 1 6 9 2 – 7 0 5 Heart-Driven Lung Ultrasound
1693
disorders abut the pleural line: pleural effusions,pneumothorax, and acute interstitial syndrome in100% of cases; and lung consolidation in 98.5% ofcases.
Once the cultural wall of impedance bias sur-rounding ultrasound evaluation of the chest hadfallen, cardiologists learned quickly what intensivistshad known for decades. Lung ultrasound (also calledthoracic ultrasound or chest sonography, but theselabels may include mediastinum and the heart) pro-vides a highly versatile and valuable diagnostic toolin many conditions that cardiologists encounterevery day in their practice, from heart failure to pul-monary embolism. The information on lung water canbe easily obtained at baseline and by seriallyfollowing interventions for tracking dynamic changesin pulmonary congestion and decongestion (6). Withcomprehensive, limited, or focused examinations,lung ultrasound is now ready to be embedded in thestandard TTE, from full functionality platforms per-formed by certified echocardiographers up to pocketdevices used by nonechocardiographers. It is difficultto find so much diagnostic gain with so little invest-ment in terms of technology, training, and time inother areas of cardiology (7). This review is primarilyaimed at those caring for cardiology patients (cardi-ologists, emergency room physicians, cardiacultrasonographers).
CURRENT METHODOLOGY
For the cardiologist, a lung ultrasound study is anadd-on to a TTE study, and it must be focused, fast,and factual without becoming an extra examinationrequiring excessive additional time, separatereporting, and supplementary billing. The averagetime of a comprehensive TTE cardiac scan is 40 to 45min, and we can easily add 1 min more to scan thelung for pleural effusion or pulmonary edema. Themethodology of a heart-driven lung ultrasound ex-amination can be summarized as follows, regardingthe basic requirements: training, transducer, tech-nology, technique, and targets of examination(Table 1).
TRAINING. The American College of Chest Physicianshas defined the knowledge and technical elementsrequired for competence in lung ultrasound (8). Inour own experience, 1 morning hands-on experienceor even a standardized Internet-based module of 2 his sufficient to achieve excellent reproducibility inidentification and quantification of B-lines, evenamong lung ultrasound–naive sonographers. They areamong the easiest and most reproducible signs torecognize in cardiovascular ultrasound, considered to
be “kindergarten” in the echocardiographycursus studiorum, whereas the identificationof regional wall motion abnormalities is themore challenging “university” (7).
TRANSDUCER. The probe is applied perpen-dicular to the chest wall, in a sublongitudinalview following rib obliquity. The small foot-print of a cardiac transducer makes it espe-cially suitable for scanning spaces betweenribs, and a 3.5- to 5.0-MHz frequency allowsadequate visualization of subpleural struc-tures, although with limited resolution tolocate the pleural line with confidence. Crit-
ical care physicians increasingly use 5-MHz micro-convex probes that give a better view of the wholelung, superficial and deep, and allow simple emer-gency TTE, as well as venous, abdominal, and wholebody urgent approaches (9).TECHNOLOGY. No Doppler, second harmonic, orcontrast medium is needed (7), and lung ultrasound isperformed at best using simple equipment.
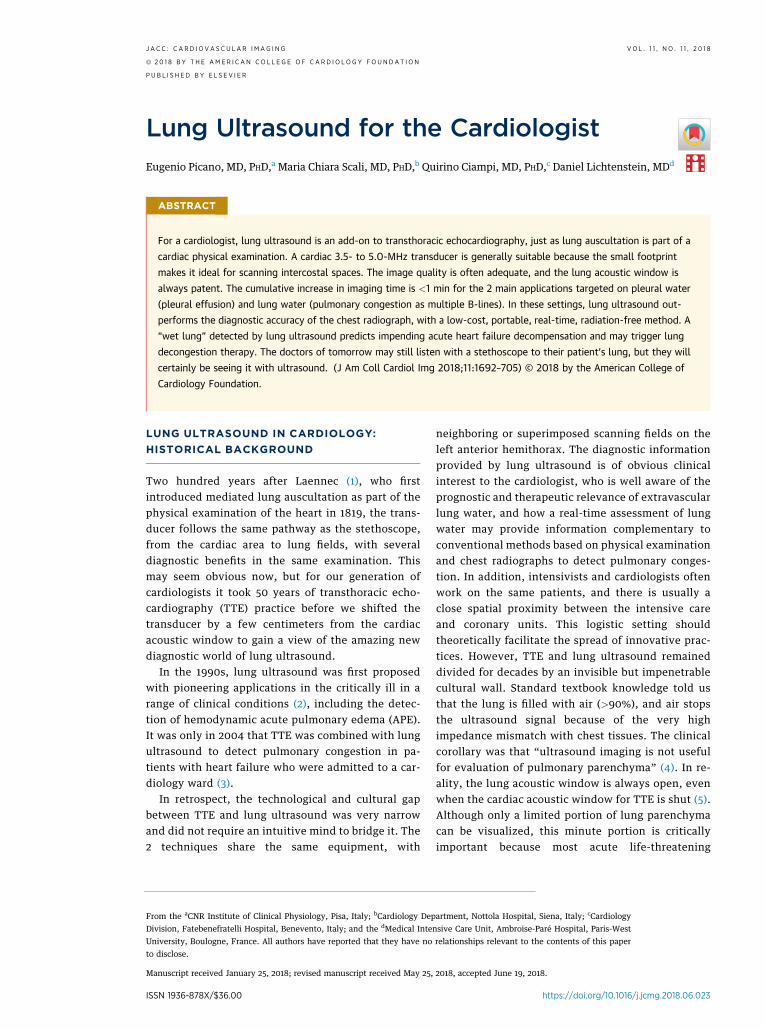
TECHNIQUE. The acoustic window for lung ultra-sound is always patent, even when TTE is notfeasible. On the left side of the chest, the lung ultra-sound window is close to TTE apical and parasternalwindows and corresponds to the popular BLUE pointsin intensivists’ approach (10), where BLUE stands forbedside lung ultrasonography in emergency (11).There are 3 symmetrical regions per lung: 2 anteriorpoints (upper BLUE point, lower BLUE point); and 1posterolateral point, at or behind the posterior axil-lary line, at the level of the lower BLUE point, calledthe PLAPS point, where PLAPS stands for posterolat-eral alveolar and/or pleural syndrome (Figure 1). Theanterior BLUE points are sought for the diagnosis ofpneumothorax and pulmonary edema and are theelective site for detection of pulmonary congestion atrest. With stress, there is an additional but importantfocus on the third intercostal space in the 2 regionsbetween the posterior axillary and anterior axillarylines and the anterior axillary and the midclavicularlines (12), the “wet spots” where lung water accu-mulates most during semisupine exercise (Figure 2).The PLAPS point allows for immediately diagnosis ofmost pleural effusions (13) and posterior alveolarsyndromes (14) with >90% sensitivity. The PLAPSpoint is accessible in all patients, including venti-lated, supine, bariatric patients, by using a probe thatcan be inserted between this posterolateral part of thechest and the bed; the most posterior is the best, butsometimes this is not easy to access, so the mostpossible lateral part makes the best compromise fordetecting PLAPS. Once a pleural effusion is detected,

TABLE 1 Requirements and Technique for Combined TTE and Lung Ultrasound Scanning
Training, Techniques,and Targets TTE Lung Ultrasound
Training
Certification Standardized Deregulated in cardiology
Complexity “University” (complex) “Kindergarten” (easy)
Rater variability Good to fair (>20%) Good to excellent (<10%)
Transducer type Cardiac (3.5–5.0 MHz) Cardiac or microconvex 5 MHz
Technology required High-end desirable Simple technology optimal
Technique
Acoustic window 1 Apical PLAPS effusion or consolidation
Acoustic window 2 Parasternal 3 IS, MC, AA, MA for water
Acoustic window 3 Subxiphoid Upper BLUE points for PNT
Patient position Supine Supine or sitting
Imaging time 30 min <2 min
Analysis time 10 min <2 min
Emergency setting May reduce data quality Unchanged data quality
Targets
Target 1, effusion Pericardial effusion Pleural effusion
Target 2, hemodynamics Pulmonary pressures Pulmonary congestion
Target 3, others LV and RV systolic function,diastole, valves, and so on
Interstitial syndrome,consolidation, PNT
AA ¼ anterior axillary; BLUE ¼ bedside lung ultrasonography in emergency; IS ¼ intercostal space; LV ¼ leftventricular; MA ¼ midaxillary; MC ¼ midclavicular; PA ¼ posterior axillary; PLAPS ¼ posterolateral alveolar and/or pleural syndrome; PNT ¼ pneumothorax; RV ¼ right ventricular; TTE ¼ transthoracic echocardiography.
Picano et al. J A C C : C A R D I O V A S C U L A R I M A G I N G , V O L . 1 1 , N O . 1 1 , 2 0 1 8
Heart-Driven Lung Ultrasound N O V E M B E R 2 0 1 8 : 1 6 9 2 – 7 0 5
1694
the positive diagnosis is made, and the operator isfree to assess the volume of the effusion by movingthe probe; if no effusion is found, however, time isspared. Using this simplified approach, lung scanningcan be achieved in far <2 min. For serial examina-tions, the position (sitting or supine) must beconsistent because pleural and pulmonary lung waterchanges with posture. Lung ultrasound remainsfeasible and reliable under all hemodynamic andventilatory conditions, unlike TTE information,which can deteriorate in acute conditions because ofhyperventilation and tachycardia, which make imag-ing and interpretation of some parameters (e.g.,regional wall motion, diastolic filling) morechallenging.
TARGETS. For the cardiologist, the main diseasestargeted by lung ultrasound are characterized by achange in water in the pleural space (pleural effusion)or lung parenchyma (pulmonary congestion, at restand during stress). In both conditions, lung ultra-sound has obvious advantages of sensitivity andspecificity compared with chest radiographs. TheBLUE protocol has proposed a standardized approachto the most common causes of acute respiratory fail-ure, which are in the scope of the cardiologistassessing undifferentiated dyspnea (by decreasingfrequency): pneumonia, APE, chronic obstructivepulmonary disease, asthma, pulmonary embolism,and pneumothorax (11).
MAIN SIGNS OF LUNG ULTRASOUND IN
PHYSIOLOGY AND DISEASE
With lung ultrasound, the lung surface has always asimple pattern wherever the probe is applied. Thewhole structure is dynamic and produces physiolog-ical variations in movement from end-inspiration toend-expiration through the respiratory cycle mirroredin the pleural movement. The main signs of cardio-logical interest involve the pleural line, the pleuralspace, lung motion, the lung interstitium, and thelung alveolar space.
PLEURAL LINE. Normal pattern. The 2 separateanatomic structures of parietal and visceral pleura areapposed and, with low-frequency transducers, mergeinto a single pleural line, a 0.2- to 0.3-mm thickechogenic, horizontal, smooth specular echo(Figure 3). The reverberation or repetition artifactsbehind the pleural line can be horizontal (A-lines) orvertical (B-lines) images with regular, straight, andgeometric shapes more precisely converging to thehead of the probe (the top of the screen) like parallels(A-lines) or meridians (B-lines).
Abnormal pattern. In acute respiratory distress syn-drome (ARDS) and pneumonia, the fluid exudated byinflammation is a glue (15), which sticks the lung tothe parietal pleura, thereby abolishing lung sliding.The pleural line appears thickened and irregular,possibly because of a small subpleural alveolar syn-drome (Figure 3). Usually, these static signs cometogether with a single critical dynamic sign, theabolition (or severe impairment) of lung sliding. Thissign is helpful in the differential diagnosis of B-linesin ARDS or pneumonia versus cardiogenic APE (15).The thickening of the pleural line is the main andmost sensitive sign of lung fibrosis, found, forinstance, in rheumatologic disease, and it is bestdetected with a high-frequency probe.
PLEURAL MOVEMENT. Normal pattern. The visceralpleura slides over the motionless parietal pleuraduring breathing. The “lung sliding” is a horizontal,to-and-fro movement, beginning at the pleural line,synchronous with respiration. There is an obviousvertical gradient in the amplitude of lung sliding,which is near zero at the apex and gradually increasesup to a maximum near the diaphragm (15). In healthysubjects quietly breathing, the amplitude of lungsliding is roughly 10 to 15 mm on the anterior chestwindow at the bases (lower BLUE points).
Abnormal pattern. When air separates the 2 pleurallayers (pneumothorax), the movement disappears.When a sticky exudate glues the parietal and thevisceral pleura (pneumonia, ARDS), the movement is

FIGURE 1 The BLUE Points
UpperBLUE-point
Posterioraxillary
line
LowerBLUE-point
PLAPSpoint
Heart(usual
location)
Diaphrag
m(usu
allocat
ion)
Phrenic line(usual location)
The bedside lung ultrasonography in emergency (BLUE) points used in the BLUE protocol with the patient in the supine or semirecumbent
position: (left) upper BLUE points and lower BLUE points; (right) posterolateral alveolar and/or pleural syndrome (PLAPS) point. Two hands
(of the size of the patient’s hands, thus allowing universal use in all kinds of patients) applied this way usually cover the anterior lung surface
(note the upper finger applied just below the clavicle). The upper BLUE point is defined using the middle of the upper hand. The lower BLUE
point is defined using the middle of the lower palm. This makes a symmetrical, trapezoid definition that follows the lung anatomy, is usually
far from the heart and the abdominal structures, and keeps clinical value. The lateral continuation of the lower BLUE point, as posterior as
possible behind the posterior axillary line, defines the PLAPS point, always located quite a bit above the diaphragm. Modified with permission
from Lichtenstein and Mezière (10).
J A C C : C A R D I O V A S C U L A R I M A G I N G , V O L . 1 1 , N O . 1 1 , 2 0 1 8 Picano et al.N O V E M B E R 2 0 1 8 : 1 6 9 2 – 7 0 5 Heart-Driven Lung Ultrasound
1695
reduced or abolished. When collagen bundles bridgethe parietal and visceral pleura, the movement is alsoreduced, as in pleural adhesions.
PLEURAL CAVITY. Normal pattern. The fluid-filledspace between the 2 specular reflectors of parietal
FIGURE 2 The 4-Sites Simplified Scan for B-Lines
Lung Ultrasound and Tright side
PA MA MC PS MAAPA = Posterior-axillary
MA = Mid-axillary
AA = Anterior-axillary
MC = Mid-clavicular
PS = Para-sternal
MS = Margino-sternal
IS = Int
The specific spaces (“wet zones”) to look for interstitial lung water accum
transthoracic echocardiography. Modified with permission from Scali et
and visceral pleura is only a potential space undernormal conditions because the 2 pleurae adhere toeach other through the few milliliters of serous fluid,thus allowing smooth movement of the visceralpleura during the respiratory cycle (Figure 3).
TE Windows (Supine Patient)left side
Yellow:lung waterat rest andafter semi-supineexercise
S MS
IS
II˚
III˚
IV˚
V˚ V4 V5
MCPS PAAA MA
er-costal space
Black:ParasternalTTE windows
ulation at rest and after stress with the 4-sites simplified scan. TTE ¼al. (12).
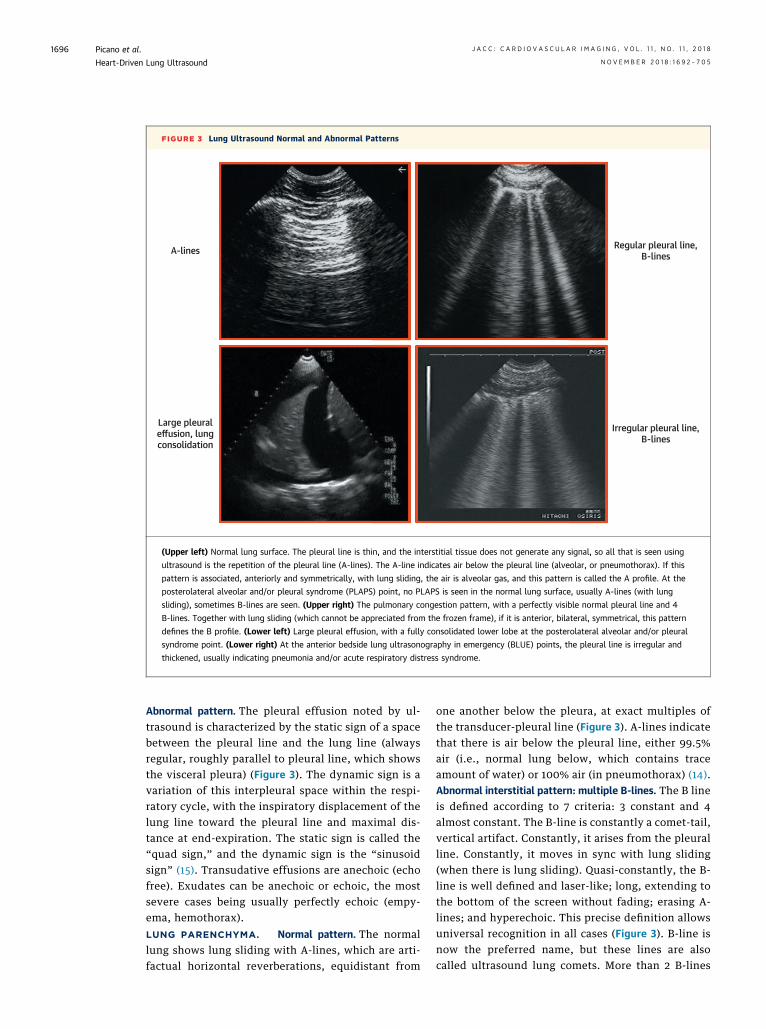
FIGURE 3 Lung Ultrasound Normal and Abnormal Patterns
A-lines
Large pleuraleffusion, lungconsolidation
Regular pleural line,B-lines
Irregular pleural line,B-lines
(Upper left) Normal lung surface. The pleural line is thin, and the interstitial tissue does not generate any signal, so all that is seen using
ultrasound is the repetition of the pleural line (A-lines). The A-line indicates air below the pleural line (alveolar, or pneumothorax). If this
pattern is associated, anteriorly and symmetrically, with lung sliding, the air is alveolar gas, and this pattern is called the A profile. At the
posterolateral alveolar and/or pleural syndrome (PLAPS) point, no PLAPS is seen in the normal lung surface, usually A-lines (with lung
sliding), sometimes B-lines are seen. (Upper right) The pulmonary congestion pattern, with a perfectly visible normal pleural line and 4
B-lines. Together with lung sliding (which cannot be appreciated from the frozen frame), if it is anterior, bilateral, symmetrical, this pattern
defines the B profile. (Lower left) Large pleural effusion, with a fully consolidated lower lobe at the posterolateral alveolar and/or pleural
syndrome point. (Lower right) At the anterior bedside lung ultrasonography in emergency (BLUE) points, the pleural line is irregular and
thickened, usually indicating pneumonia and/or acute respiratory distress syndrome.
Picano et al. J A C C : C A R D I O V A S C U L A R I M A G I N G , V O L . 1 1 , N O . 1 1 , 2 0 1 8
Heart-Driven Lung Ultrasound N O V E M B E R 2 0 1 8 : 1 6 9 2 – 7 0 5
1696
Abnormal pattern. The pleural effusion noted by ul-trasound is characterized by the static sign of a spacebetween the pleural line and the lung line (alwaysregular, roughly parallel to pleural line, which showsthe visceral pleura) (Figure 3). The dynamic sign is avariation of this interpleural space within the respi-ratory cycle, with the inspiratory displacement of thelung line toward the pleural line and maximal dis-tance at end-expiration. The static sign is called the“quad sign,” and the dynamic sign is the “sinusoidsign” (15). Transudative effusions are anechoic (echofree). Exudates can be anechoic or echoic, the mostsevere cases being usually perfectly echoic (empy-ema, hemothorax).
LUNG PARENCHYMA. Normal pattern. The normallung shows lung sliding with A-lines, which are arti-factual horizontal reverberations, equidistant from
one another below the pleura, at exact multiples ofthe transducer-pleural line (Figure 3). A-lines indicatethat there is air below the pleural line, either 99.5%air (i.e., normal lung below, which contains traceamount of water) or 100% air (in pneumothorax) (14).Abnormal interstitial pattern: multiple B-lines. The B lineis defined according to 7 criteria: 3 constant and 4almost constant. The B-line is constantly a comet-tail,vertical artifact. Constantly, it arises from the pleuralline. Constantly, it moves in sync with lung sliding(when there is lung sliding). Quasi-constantly, the B-line is well defined and laser-like; long, extending tothe bottom of the screen without fading; erasing A-lines; and hyperechoic. This precise definition allowsuniversal recognition in all cases (Figure 3). B-line isnow the preferred name, but these lines are alsocalled ultrasound lung comets. More than 2 B-lines
J A C C : C A R D I O V A S C U L A R I M A G I N G , V O L . 1 1 , N O . 1 1 , 2 0 1 8 Picano et al.N O V E M B E R 2 0 1 8 : 1 6 9 2 – 7 0 5 Heart-Driven Lung Ultrasound
1697
per intercostal space have been called lung rockets(15). In some locations, 1 or 2 B-lines are physiolog-ical, for instance, anteriorly corresponding to lungfissures or lung rockets at the bases (likely naturalgravity). Ultrasound interstitial syndrome is definedby lung rockets. It can be diffuse at the whole chestwall or symmetrical and associated with conservedlung sliding in the case of cardiogenic APE. This veryprecise pattern is called the B profile in the BLUEprotocol (11). It can be diffuse but associated withabolished or very decreased lung sliding and labeledthe B0 profile (11) in some cases of pneumonia and/orARDS. It can be localized, usually in infectious or in-flammatory processes (pneumonia, ARDS), andlabeled the A/B profile.
Ultrasound multiple B-lines are the equivalent ofthe radiological interstitial syndrome (Kerley linesand more). We see interstitial syndrome, in acuteconditions, in 2 main diagnoses with opposed man-agement: cardiogenic APE and pneumonia or ARDS.Cardiogenic APE is associated with normal lungsliding, which is often reduced or abolished inpneumonia or ARDS.
B-lines must not be mixed up with Z-lines, whichare frequently observed as bundle-shaped reflectionsarising from the pleural line, but that—unlike true B-lines—do not erase A-lines, are ill-defined, are lessechogenic than the pleural line, are short, and do notmove in synchrony with respiration (15).Abnormal alveolar pattern: lung consolidation. In someconditions, the extreme progression of the interstitialsyndrome leads to the consolidation process with anechogenic lung, with a tissue texture similar to that ofspleen or liver, the result of replacement of air in thealveolar space with material other than air, usuallywater, pus, or blood (15) (Figure 3). Lung consolida-tion can have a variety of causes, including alveolarcardiogenic APE, pneumonia, lung infarction, cancer,lung contusion, and obstructive atelectasis. In someetiologies, such as drowning or aspiration pneumo-nitis, the fluid comes directly to fill the alveoli first,and the initial presentation is lung consolidation,without the usual initial phase of interstitial syn-drome. Lung consolidations may arise in any site,and, although only the peripheral part of the lungscan be visualized by ultrasound, 98.5% of consolida-tions touch the pleura, and 90% of cases locate at thePLAPS point (14).
PLEURAL EFFUSION IN HEART FAILURE
PATHOPHYSIOLOGICAL MEANING. Elevated leftatrial pressure in left-sided heart failure may cause
pleural effusion only after pulmonary edema hasdeveloped (16,17). Elevated right atrial pressure inright-sided heart failure can increase the pressure inthe thoracic duct, thus limiting the volume oflymphatic drainage from the pleural space to the rightatrium through the superior vena cava (16–19).
BEDSIDE RECOGNITION. The main signs on physicalexamination are reduced air entry and dullness topercussion at lung bases (20). In up to 20% of pa-tients with acute heart failure (AHF), the chestradiograph is nearly normal, and the sensitivity ofthe method is less than one-half compared with lungultrasound, especially for mild to moderate pleuraleffusions (20).
METHODOLOGY. Semiquantitative grading of theamount of pleural effusion is possible by measuringthe maximal expiratory interpleural distance from thepleural line to the lung line on the posterior axillaryline with the patient in the supine position (13) or theparavertebral, scapular, posterior axillary, or medialaxillary lines in the sitting position (21). The amountof pleural effusion can be scored as trivial (<2 mm),small (2 to 15 mm, too small to tap), moderate (15 to 25mm), or large (>25 mm) (Table 2).
DIAGNOSTIC, PROGNOSTIC, AND THERAPEUTIC
IMPLICATIONS. The prevalence of pleural effusionmay range anywhere between 56% and 90% in AHF,30% and 60% at pre-discharge, 10% and 70% inoutpatients with chronic stable heart failure, or25% in patients with isolated right-sided heart failure(10,21–31) (Table 3). The main TTE predictor ofpleural effusion is the increased systolic pulmonaryarterial pressure (31).
In patients with heart failure, the presence ofpleural effusion is associated with a higher rehospi-talization rate (26) and clearly worse quality of life,which has improved after reduction of pleuraleffusion with medical therapy (30). In patients withAHF and pleural effusion, thoracentesis with fluidevacuation may be considered if feasible to alleviatedyspnea (20). For thoracentesis, a $15-mm inter-pleural inspiratory distance is required (13); the nee-dle is inserted after careful check that 6 organs are notin the pathway of the needle: the diaphragm, ofcourse, but also the heart, descending aorta, spleen,liver, and lung. The quantification is especiallyimportant for assessing variations in the same patientin natural history or following intervention. Lungultrasound is ideal for guiding thoracentesis anddraining effusions. The absence of a virtual spaceafter the procedure (interpleural space >10 mm) re-flects an incomplete procedure.
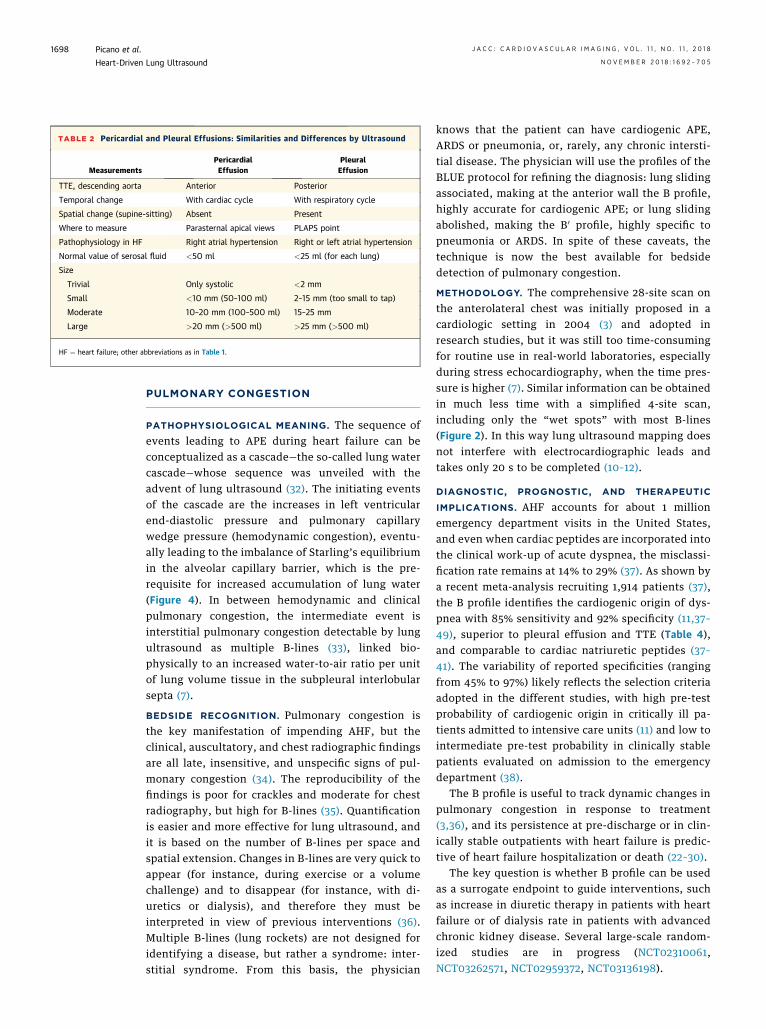
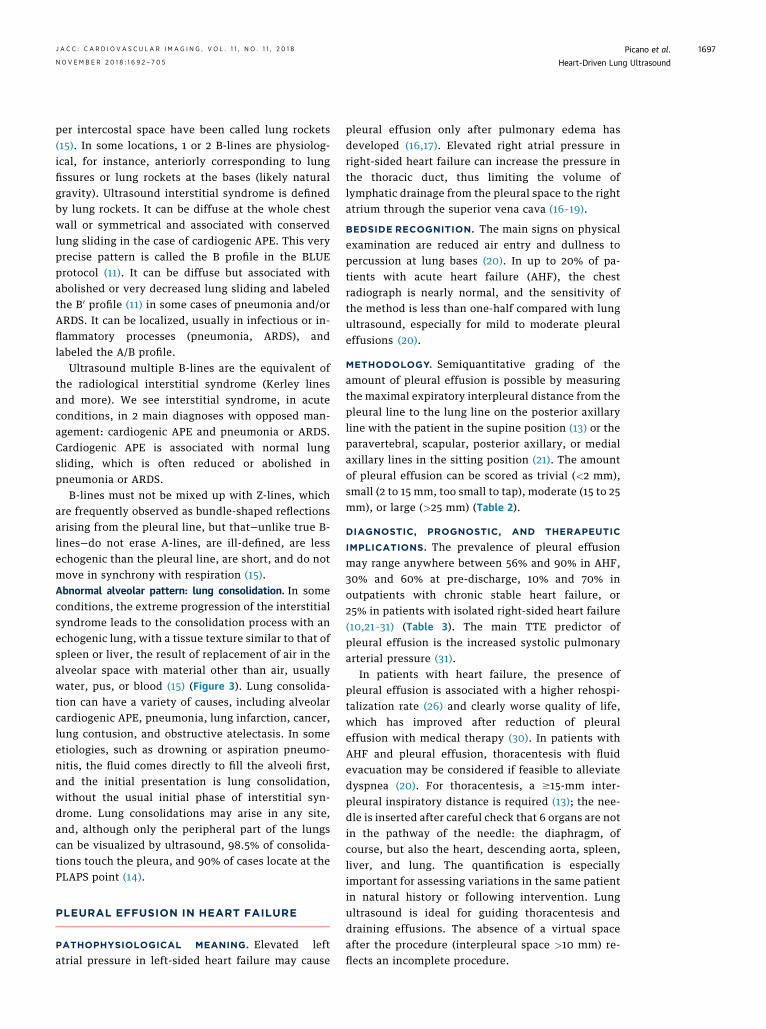
TABLE 2 Pericardial and Pleural Effusions: Similarities and Differences by Ultrasound
MeasurementsPericardialEffusion
PleuralEffusion
TTE, descending aorta Anterior Posterior
Temporal change With cardiac cycle With respiratory cycle
Spatial change (supine-sitting) Absent Present
Where to measure Parasternal apical views PLAPS point
Pathophysiology in HF Right atrial hypertension Right or left atrial hypertension
Normal value of serosal fluid <50 ml <25 ml (for each lung)
Size
Trivial Only systolic <2 mm
Small <10 mm (50–100 ml) 2–15 mm (too small to tap)
Moderate 10–20 mm (100–500 ml) 15–25 mm
Large >20 mm (>500 ml) >25 mm (>500 ml)
HF ¼ heart failure; other abbreviations as in Table 1.
Picano et al. J A C C : C A R D I O V A S C U L A R I M A G I N G , V O L . 1 1 , N O . 1 1 , 2 0 1 8
Heart-Driven Lung Ultrasound N O V E M B E R 2 0 1 8 : 1 6 9 2 – 7 0 5
1698
PULMONARY CONGESTION
PATHOPHYSIOLOGICAL MEANING. The sequence ofevents leading to APE during heart failure can beconceptualized as a cascade—the so-called lung watercascade—whose sequence was unveiled with theadvent of lung ultrasound (32). The initiating eventsof the cascade are the increases in left ventricularend-diastolic pressure and pulmonary capillarywedge pressure (hemodynamic congestion), eventu-ally leading to the imbalance of Starling’s equilibriumin the alveolar capillary barrier, which is the pre-requisite for increased accumulation of lung water(Figure 4). In between hemodynamic and clinicalpulmonary congestion, the intermediate event isinterstitial pulmonary congestion detectable by lungultrasound as multiple B-lines (33), linked bio-physically to an increased water-to-air ratio per unitof lung volume tissue in the subpleural interlobularsepta (7).
BEDSIDE RECOGNITION. Pulmonary congestion isthe key manifestation of impending AHF, but theclinical, auscultatory, and chest radiographic findingsare all late, insensitive, and unspecific signs of pul-monary congestion (34). The reproducibility of thefindings is poor for crackles and moderate for chestradiography, but high for B-lines (35). Quantificationis easier and more effective for lung ultrasound, andit is based on the number of B-lines per space andspatial extension. Changes in B-lines are very quick toappear (for instance, during exercise or a volumechallenge) and to disappear (for instance, with di-uretics or dialysis), and therefore they must beinterpreted in view of previous interventions (36).Multiple B-lines (lung rockets) are not designed foridentifying a disease, but rather a syndrome: inter-stitial syndrome. From this basis, the physician
knows that the patient can have cardiogenic APE,ARDS or pneumonia, or, rarely, any chronic intersti-tial disease. The physician will use the profiles of theBLUE protocol for refining the diagnosis: lung slidingassociated, making at the anterior wall the B profile,highly accurate for cardiogenic APE; or lung slidingabolished, making the B0 profile, highly specific topneumonia or ARDS. In spite of these caveats, thetechnique is now the best available for bedsidedetection of pulmonary congestion.
METHODOLOGY. The comprehensive 28-site scan onthe anterolateral chest was initially proposed in acardiologic setting in 2004 (3) and adopted inresearch studies, but it was still too time-consumingfor routine use in real-world laboratories, especiallyduring stress echocardiography, when the time pres-sure is higher (7). Similar information can be obtainedin much less time with a simplified 4-site scan,including only the “wet spots” with most B-lines(Figure 2). In this way lung ultrasound mapping doesnot interfere with electrocardiographic leads andtakes only 20 s to be completed (10–12).
DIAGNOSTIC, PROGNOSTIC, AND THERAPEUTIC
IMPLICATIONS. AHF accounts for about 1 millionemergency department visits in the United States,and even when cardiac peptides are incorporated intothe clinical work-up of acute dyspnea, the misclassi-fication rate remains at 14% to 29% (37). As shown bya recent meta-analysis recruiting 1,914 patients (37),the B profile identifies the cardiogenic origin of dys-pnea with 85% sensitivity and 92% specificity (11,37–49), superior to pleural effusion and TTE (Table 4),and comparable to cardiac natriuretic peptides (37–41). The variability of reported specificities (rangingfrom 45% to 97%) likely reflects the selection criteriaadopted in the different studies, with high pre-testprobability of cardiogenic origin in critically ill pa-tients admitted to intensive care units (11) and low tointermediate pre-test probability in clinically stablepatients evaluated on admission to the emergencydepartment (38).
The B profile is useful to track dynamic changes inpulmonary congestion in response to treatment(3,36), and its persistence at pre-discharge or in clin-ically stable outpatients with heart failure is predic-tive of heart failure hospitalization or death (22–30).
The key question is whether B profile can be usedas a surrogate endpoint to guide interventions, suchas increase in diuretic therapy in patients with heartfailure or of dialysis rate in patients with advancedchronic kidney disease. Several large-scale random-ized studies are in progress (NCT02310061,NCT03262571, NCT02959372, NCT03136198).

TABLE 3 Lung Ultrasound in Left- and Right-Sided Heart Failure
First Author,Year (Ref. #) Patients
PleuralEffusion B Profile Main Finding
Morales-Rull, 2018 (31) 3,245 AHF inpatients 56% N/A SPAP >55 mm Hg predicts pleural effusion
Gundersen, 2017 (30) 62 CHF outpatients 42% N/A Pleural effusion predicts quality of life
Scali, 2017 (10) 103 CHF patients N/A 58% B profile predicts events
Miglioranza, 2017 (29) 97 CHF outpatients N/A 68% B profile predicts events
Platz, 2016 (28) 185 CHF outpatients N/A 32% B profile predicts events
Cogliati, 2016 (27) 149 AHF pre-discharge 36% 64% B profile predicts events
Gustaffson, 2015 (26) 104 CHF outpatients 10% 27% Pleural effusion and B profile predict events
Coiro, 2015 (25) 60 AHF pre-discharge N/A 30% B profile predicts readmission
Gargani, 2015 (24) 99 AHF pre-discharge 24% 40% B profile predicts readmission
Zoccali, 2013 (23) 392 patients undergoing hemodialysis N/A 59% B profile predicts death
Luo, 2011 (19) 89 patients with connective tissue disease 39%* N/A Pleural effusion with RHF
Tang, 2009 (18) 147 patients with PAH 21%* N/A Pleural effusion with RHF
Lichtenstein, 2008 (11) 64 patients with acute respiratory failure N/A 97% Patients in ICU
Frassi, 2007 (22) 290 inpatients (chest pain or dyspnea) N/A 47% B profile predicts events
Jambrik, 2004 (3) 121 CCU inpatients 15%† 68% SPAP and E/e0 predict B profile
Kataoka, 2000 (21) 60 AHF inpatients 91% N/A 41% with pleural effusion by chest radiograph
Wiener-Kronish, 1985 (17) 37 AHF inpatients 51% N/A Left atrial pressure higher in pleural effusion
*Chest radiograph, computed tomography, lung ultrasound, or autopsy. †Chest radiograph.
AHF ¼ acute heart failure; CCU ¼ coronary care unit; CHF ¼ chronic heart failure; ICU ¼ intensive care unit; N/A ¼ not available; PAH ¼ pulmonary arterial hypertension;RHF ¼ right-sided heart failure; SPAP ¼ systolic pulmonary arterial pressure.
J A C C : C A R D I O V A S C U L A R I M A G I N G , V O L . 1 1 , N O . 1 1 , 2 0 1 8 Picano et al.N O V E M B E R 2 0 1 8 : 1 6 9 2 – 7 0 5 Heart-Driven Lung Ultrasound
1699
Lung ultrasound is a useful adjunct to TTE dur-ing stress echocardiography (10,50,51), by providinginformation on a different pathophysiological target(alveolar-capillary barrier rather than physiologi-cally critical epicardial artery stenosis), with a
FIGURE 4 The Lung Water Cascade
(hours,
Stress B
Starling equation uWedge pressure rise
STRESSLung Ultrasound
RESTLung Ultrasound
SYMPTOMS/SIGNS
Stable Chronic Heart Failure
THE LUNG WAT
Events
Hemodynamic congestion is the early event before the imaging sign (mu
event than resting B-lines. Only after hours, days, or weeks is the clinica
more effective when initiated at the early, pre-symptomatic and pre-rad
different sign (B-lines rather than regional wallmotion abnormalities), and in a different timewindow (after rather than at peak stress). As aparameter, B-lines are more feasible, simpler toimage and to measure, and inherently more
Crackles/Dyspnea/Weight gain
Time days or weeks)
Acute decompensated Heart Failure
B-lines
-lines
nbalance Asymptomatic hemodynamic congestion
Asymptomatic pulmonary congestion
Clinical congestion
ER CASCADE
ltiple B-lines) of pulmonary congestion. Stress B-lines are an earlier
l congestion apparent. The therapeutic countermeasures are likely
iologic, silent stages of the cascade.
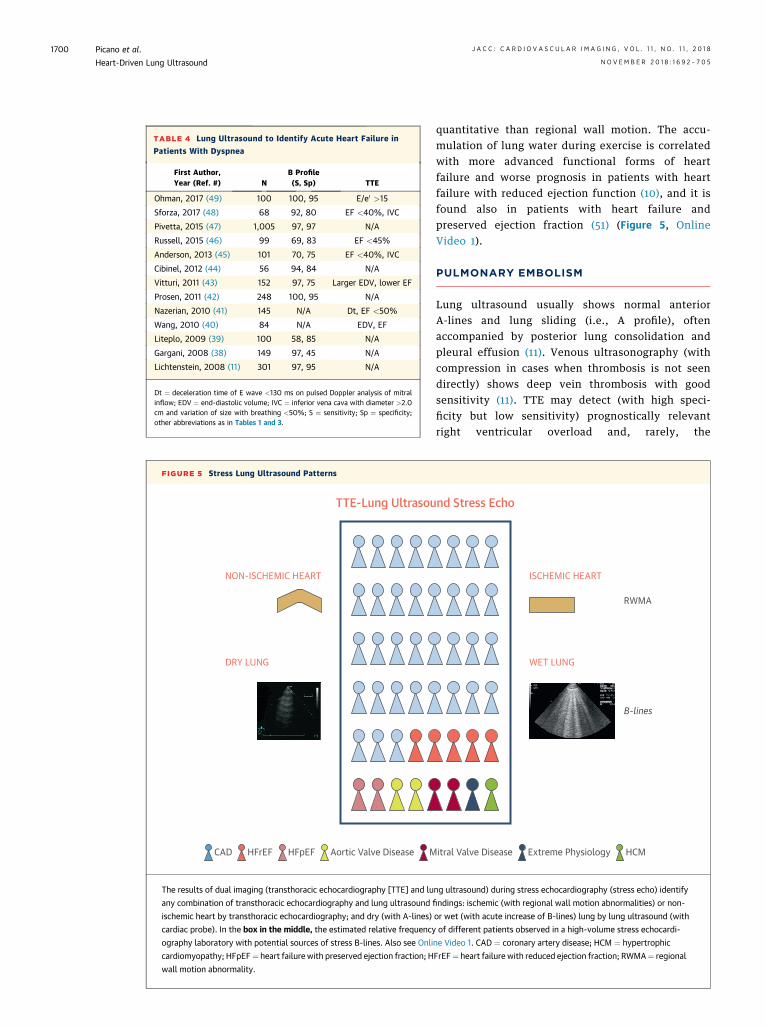
TABLE 4 Lung Ultrasound to Identify Acute Heart Failure in
Patients With Dyspnea
First Author,Year (Ref. #) N
B Profile(S, Sp) TTE
Ohman, 2017 (49) 100 100, 95 E/e0 >15
Sforza, 2017 (48) 68 92, 80 EF <40%, IVC
Pivetta, 2015 (47) 1,005 97, 97 N/A
Russell, 2015 (46) 99 69, 83 EF <45%
Anderson, 2013 (45) 101 70, 75 EF <40%, IVC
Cibinel, 2012 (44) 56 94, 84 N/A
Vitturi, 2011 (43) 152 97, 75 Larger EDV, lower EF
Prosen, 2011 (42) 248 100, 95 N/A
Nazerian, 2010 (41) 145 N/A Dt, EF <50%
Wang, 2010 (40) 84 N/A EDV, EF
Liteplo, 2009 (39) 100 58, 85 N/A
Gargani, 2008 (38) 149 97, 45 N/A
Lichtenstein, 2008 (11) 301 97, 95 N/A
Dt ¼ deceleration time of E wave <130 ms on pulsed Doppler analysis of mitralinflow; EDV ¼ end-diastolic volume; IVC ¼ inferior vena cava with diameter >2.0cm and variation of size with breathing <50%; S ¼ sensitivity; Sp ¼ specificity;other abbreviations as in Tables 1 and 3.
FIGURE 5 Stress Lung Ultrasound Patterns
TTE-Lung Ultrasou
NON-ISCHEMIC HEART
DRY LUNG
CAD HFrEF HFpEF Aortic Valve Disease M
The results of dual imaging (transthoracic echocardiography [TTE] and lu
any combination of transthoracic echocardiography and lung ultrasound
ischemic heart by transthoracic echocardiography; and dry (with A-lines)
cardiac probe). In the box in the middle, the estimated relative frequency
ography laboratory with potential sources of stress B-lines. Also see Onli
cardiomyopathy; HFpEF¼ heart failure with preserved ejection fraction; H
wall motion abnormality.
Picano et al. J A C C : C A R D I O V A S C U L A R I M A G I N G , V O L . 1 1 , N O . 1 1 , 2 0 1 8
Heart-Driven Lung Ultrasound N O V E M B E R 2 0 1 8 : 1 6 9 2 – 7 0 5
1700
quantitative than regional wall motion. The accu-mulation of lung water during exercise is correlatedwith more advanced functional forms of heartfailure and worse prognosis in patients with heartfailure with reduced ejection function (10), and it isfound also in patients with heart failure andpreserved ejection fraction (51) (Figure 5, OnlineVideo 1).
PULMONARY EMBOLISM
Lung ultrasound usually shows normal anteriorA-lines and lung sliding (i.e., A profile), oftenaccompanied by posterior lung consolidation andpleural effusion (11). Venous ultrasonography (withcompression in cases when thrombosis is not seendirectly) shows deep vein thrombosis with goodsensitivity (11). TTE may detect (with high speci-ficity but low sensitivity) prognostically relevantright ventricular overload and, rarely, the
nd Stress Echo
ISCHEMIC HEART
WET LUNG
RWMA
B-lines
itral Valve Disease Extreme Physiology HCM
ng ultrasound) during stress echocardiography (stress echo) identify
findings: ischemic (with regional wall motion abnormalities) or non-
or wet (with acute increase of B-lines) lung by lung ultrasound (with
of different patients observed in a high-volume stress echocardi-
ne Video 1. CAD ¼ coronary artery disease; HCM ¼ hypertrophic
FrEF¼ heart failure with reduced ejection fraction; RWMA¼ regional
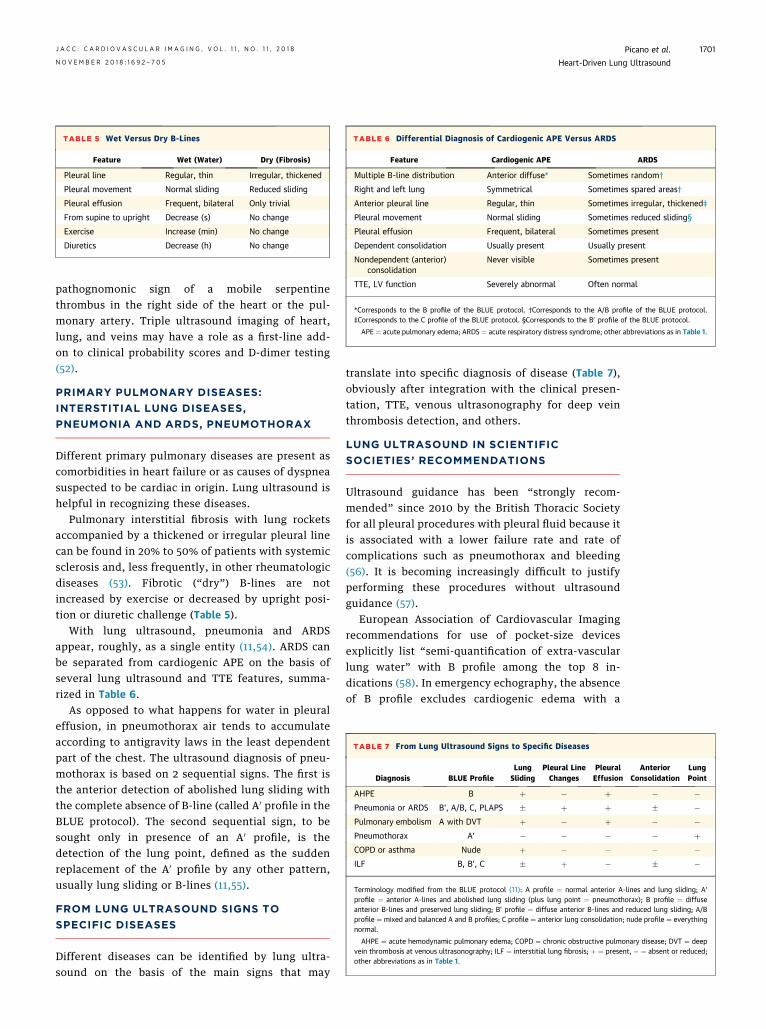
TABLE 5 Wet Versus Dry B-Lines
Feature Wet (Water) Dry (Fibrosis)
Pleural line Regular, thin Irregular, thickened
Pleural movement Normal sliding Reduced sliding
Pleural effusion Frequent, bilateral Only trivial
From supine to upright Decrease (s) No change
Exercise Increase (min) No change
Diuretics Decrease (h) No change
TABLE 6 Differential Diagnosis of Cardiogenic APE Versus ARDS
Feature Cardiogenic APE ARDS
Multiple B-line distribution Anterior diffuse* Sometimes random†
Right and left lung Symmetrical Sometimes spared areas†
Anterior pleural line Regular, thin Sometimes irregular, thickened‡
Pleural movement Normal sliding Sometimes reduced sliding§
Pleural effusion Frequent, bilateral Sometimes present
Dependent consolidation Usually present Usually present
Nondependent (anterior)consolidation
Never visible Sometimes present
TTE, LV function Severely abnormal Often normal
*Corresponds to the B profile of the BLUE protocol. †Corresponds to the A/B profile of the BLUE protocol.‡Corresponds to the C profile of the BLUE protocol. §Corresponds to the B0 profile of the BLUE protocol.
APE ¼ acute pulmonary edema; ARDS ¼ acute respiratory distress syndrome; other abbreviations as in Table 1.
TABLE 7 From Lung Ultrasound Signs to Specific Diseases
Diagnosis BLUE ProfileLungSliding
Pleural LineChanges
PleuralEffusion
AnteriorConsolidation
LungPoint
AHPE B þ � þ � �Pneumonia or ARDS B’, A/B, C, PLAPS � þ þ � �Pulmonary embolism A with DVT þ � þ � �Pneumothorax A’ � � � � þCOPD or asthma Nude þ � � � �ILF B, B’, C � þ � � �
Terminology modified from the BLUE protocol (11): A profile ¼ normal anterior A-lines and lung sliding; A’profile ¼ anterior A-lines and abolished lung sliding (plus lung point ¼ pneumothorax); B profile ¼ diffuseanterior B-lines and preserved lung sliding; B’ profile ¼ diffuse anterior B-lines and reduced lung sliding; A/Bprofile ¼ mixed and balanced A and B profiles; C profile ¼ anterior lung consolidation; nude profile ¼ everythingnormal.
AHPE ¼ acute hemodynamic pulmonary edema; COPD ¼ chronic obstructive pulmonary disease; DVT ¼ deepvein thrombosis at venous ultrasonography; ILF ¼ interstitial lung fibrosis; þ ¼ present, � ¼ absent or reduced;other abbreviations as in Table 1.
J A C C : C A R D I O V A S C U L A R I M A G I N G , V O L . 1 1 , N O . 1 1 , 2 0 1 8 Picano et al.N O V E M B E R 2 0 1 8 : 1 6 9 2 – 7 0 5 Heart-Driven Lung Ultrasound
1701
pathognomonic sign of a mobile serpentinethrombus in the right side of the heart or the pul-monary artery. Triple ultrasound imaging of heart,lung, and veins may have a role as a first-line add-on to clinical probability scores and D-dimer testing(52).
PRIMARY PULMONARY DISEASES:
INTERSTITIAL LUNG DISEASES,
PNEUMONIA AND ARDS, PNEUMOTHORAX
Different primary pulmonary diseases are present ascomorbidities in heart failure or as causes of dyspneasuspected to be cardiac in origin. Lung ultrasound ishelpful in recognizing these diseases.
Pulmonary interstitial fibrosis with lung rocketsaccompanied by a thickened or irregular pleural linecan be found in 20% to 50% of patients with systemicsclerosis and, less frequently, in other rheumatologicdiseases (53). Fibrotic (“dry”) B-lines are notincreased by exercise or decreased by upright posi-tion or diuretic challenge (Table 5).
With lung ultrasound, pneumonia and ARDSappear, roughly, as a single entity (11,54). ARDS canbe separated from cardiogenic APE on the basis ofseveral lung ultrasound and TTE features, summa-rized in Table 6.
As opposed to what happens for water in pleuraleffusion, in pneumothorax air tends to accumulateaccording to antigravity laws in the least dependentpart of the chest. The ultrasound diagnosis of pneu-mothorax is based on 2 sequential signs. The first isthe anterior detection of abolished lung sliding withthe complete absence of B-line (called A0 profile in theBLUE protocol). The second sequential sign, to besought only in presence of an A0 profile, is thedetection of the lung point, defined as the suddenreplacement of the A0 profile by any other pattern,usually lung sliding or B-lines (11,55).
FROM LUNG ULTRASOUND SIGNS TO
SPECIFIC DISEASES
Different diseases can be identified by lung ultra-sound on the basis of the main signs that may
translate into specific diagnosis of disease (Table 7),obviously after integration with the clinical presen-tation, TTE, venous ultrasonography for deep veinthrombosis detection, and others.
LUNG ULTRASOUND IN SCIENTIFIC
SOCIETIES’ RECOMMENDATIONS
Ultrasound guidance has been “strongly recom-mended” since 2010 by the British Thoracic Societyfor all pleural procedures with pleural fluid because itis associated with a lower failure rate and rate ofcomplications such as pneumothorax and bleeding(56). It is becoming increasingly difficult to justifyperforming these procedures without ultrasoundguidance (57).
European Association of Cardiovascular Imagingrecommendations for use of pocket-size devicesexplicitly list “semi-quantification of extra-vascularlung water” with B profile among the top 8 in-dications (58). In emergency echography, the absenceof B profile excludes cardiogenic edema with a
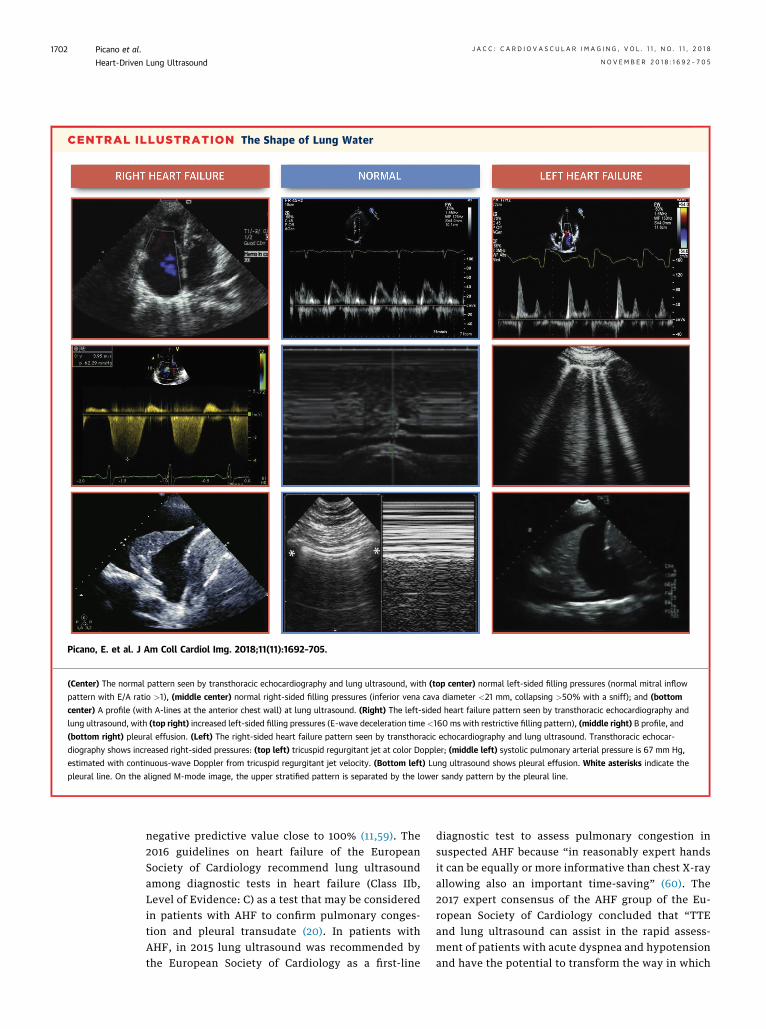
CENTRAL ILLUSTRATION The Shape of Lung Water
Picano, E. et al. J Am Coll Cardiol Img. 2018;11(11):1692–705.
(Center) The normal pattern seen by transthoracic echocardiography and lung ultrasound, with (top center) normal left-sided filling pressures (normal mitral inflow
pattern with E/A ratio >1), (middle center) normal right-sided filling pressures (inferior vena cava diameter <21 mm, collapsing >50% with a sniff); and (bottom
center) A profile (with A-lines at the anterior chest wall) at lung ultrasound. (Right) The left-sided heart failure pattern seen by transthoracic echocardiography and
lung ultrasound, with (top right) increased left-sided filling pressures (E-wave deceleration time <160 ms with restrictive filling pattern), (middle right) B profile, and
(bottom right) pleural effusion. (Left) The right-sided heart failure pattern seen by transthoracic echocardiography and lung ultrasound. Transthoracic echocar-
diography shows increased right-sided pressures: (top left) tricuspid regurgitant jet at color Doppler; (middle left) systolic pulmonary arterial pressure is 67 mm Hg,
estimated with continuous-wave Doppler from tricuspid regurgitant jet velocity. (Bottom left) Lung ultrasound shows pleural effusion. White asterisks indicate the
pleural line. On the aligned M-mode image, the upper stratified pattern is separated by the lower sandy pattern by the pleural line.
Picano et al. J A C C : C A R D I O V A S C U L A R I M A G I N G , V O L . 1 1 , N O . 1 1 , 2 0 1 8
Heart-Driven Lung Ultrasound N O V E M B E R 2 0 1 8 : 1 6 9 2 – 7 0 5
1702
negative predictive value close to 100% (11,59). The2016 guidelines on heart failure of the EuropeanSociety of Cardiology recommend lung ultrasoundamong diagnostic tests in heart failure (Class IIb,Level of Evidence: C) as a test that may be consideredin patients with AHF to confirm pulmonary conges-tion and pleural transudate (20). In patients withAHF, in 2015 lung ultrasound was recommended bythe European Society of Cardiology as a first-line
diagnostic test to assess pulmonary congestion insuspected AHF because “in reasonably expert handsit can be equally or more informative than chest X-rayallowing also an important time-saving” (60). The2017 expert consensus of the AHF group of the Eu-ropean Society of Cardiology concluded that “TTEand lung ultrasound can assist in the rapid assess-ment of patients with acute dyspnea and hypotensionand have the potential to transform the way in which
J A C C : C A R D I O V A S C U L A R I M A G I N G , V O L . 1 1 , N O . 1 1 , 2 0 1 8 Picano et al.N O V E M B E R 2 0 1 8 : 1 6 9 2 – 7 0 5 Heart-Driven Lung Ultrasound
1703
the clinicians assess and manage critically ill patientswith AHF and cardiogenic shock” (61).
According to the 2016 joint European Associationof Cardiovascular Imaging and American Society ofEchocardiography recommendations, during exercisestress echocardiography the acute increase in B-linesdetected by lung ultrasound is a feasible way fordemonstrating that the symptom “dyspnea whenexercising” is related to pulmonary congestion sec-ondary to backward heart failure (62).
CURRENT LIMITATIONS
Severe subcutaneous emphysema can be an absolutehindrance. Dressings should be limited for favoringultrasound studies. Morbid obesity is not a limitationfor several areas of lung ultrasound, mainly detectionof A profile, A0 profile, B profile, and B0 profile (15).
Lung rockets reflect the presence of an interstitialsyndrome that can be caused by water, inflamma-tion, or fibrosis, but integration with clinicalpresentation, systematic application of lung ultra-sound with the BLUE protocol, and association withTTE allow the clinician to identify the underlyingetiologic factors and to answer the clinical questionmost of the time (11).
Lung ultrasound is currently used by manydifferent medical disciplines, from cardiology tointensive care, from pneumology to nephrology, fromrheumatology to sports medicine. This range addsappeal to the technique, but it may pose communi-cation difficulties related to heterogeneity ofterminology, execution, and reporting, and betterharmonization is needed (7). For the past 3 decades,standardized labels for lung ultrasound have beenrefined for maximal efficiency in a field made free ofany confusion (11,15).
Lung ultrasound can reduce medicolegal risk byshortening the time to diagnosis in patients with life-threatening conditions. The best defense againstlitigation is to follow training strictly. Malpracticelawsuits have been filed for not performing the ex-amination in a timely manner (63).
PERSPECTIVES
The image texture is, at least in principle, suitable fortreatment with video-densitometric analysis, andlung water software is already included in somecommercially available instruments to providequantitative support to B-line reading. This option isattractive, but as in any field, and especially in im-aging, checking the quantitative, machine-generated
findings using experience, prudence, and clinicalwisdom is always necessary.
Large scale, prospective, international, multi-center, effectiveness studies are currently ongoingwith rest and stress B-lines in known or suspectedheart failure and coronary artery disease in the StressEcho 2020 study, which is planning to recruit 10,000patients within the year 2020 with the new standardof dual imaging, including regional wall motion andB-lines (64).
Randomized outcome studies are needed to assessthe value of lung ultrasound are needed to reducemortality in patients with either chronic heart failureor acute circulatory failure.
CONCLUSIONS
After opening the acoustic window on lung paren-chyma, the cardiologist discovers unique informationthat will soon induce a durable mutation in thestructure of cardiac ultrasound examination,destined to become a cardiopulmonary (TTE-lungultrasound) study. Now is the appropriate time forprofessional cardiology and echocardiographysocieties to incorporate lung ultrasound into themainstream of core teaching, certification, andreporting in TTE. Lung ultrasound can provideunique information in the cardiology ward, intensivecare unit, emergency room, echocardiography labo-ratory, stress testing laboratory, outpatient clinic,and perhaps especially in home care with handhelddevices in patients with heart failure (Central Illus-tration). The use of lung ultrasound will reduce theuse of techniques based on ionizing radiation, such aschest radiography or computed tomography, therebycontributing to minimize the cumulative burden ofunwanted effects of radiation exposure, especiallyrelevant in cardiology patients (65). A “wet lung”detected as B profile by lung ultrasound, at rest orafter stress, in a stable patient with chronic heartfailure predicts impending AHF decompensation andmay trigger lung decongestion therapy. No cardiolo-gist would evaluate a patient with heart failurewithout listening to lung fields for crackles or apleural effusion. In the same way, today no compre-hensive, limited, or focused TTE examination will beconsidered complete without a short but efficientassessment of the lung.
ADDRESS FOR CORRESPONDENCE: Dr. Eugenio Pic-ano, Institute of Clinical Physiology, Italian NationalResearch Council, Via Moruzzi 1, 56124 Pisa, Italy.E-mail: [email protected].
Picano et al. J A C C : C A R D I O V A S C U L A R I M A G I N G , V O L . 1 1 , N O . 1 1 , 2 0 1 8
Heart-Driven Lung Ultrasound N O V E M B E R 2 0 1 8 : 1 6 9 2 – 7 0 5
1704
RE F E RENCE S
1. Laënnec RTH. Traité de l’auscultation médiate,ou traité du diagnostic des maladies des poumonset du cœur. Paris, France: J.A. Brosson & J.S.Chaudé, 1819. New York, NY: Hafner, 1962.
2. Lichtenstein D, Mézière G, Biderman P,Gepner A, Barré O. The comet-tail artifact. An ul-trasound sign of alveolar-interstitial syndrome.Am J Respir Crit Care Med 1997;156:1640–6.
3. Jambrik Z, Monti S, Coppola V, Agricola E,Mottola G, Picano E. Usefulness of ultrasound lungcomets as a nonradiologic sign of extravascularlung water. Am J Cardiol 2004;93:1265–70.
4. Longo D, Fauci AS, Kasper DL, Hauser SK,Jameson JL, Loscalzo J, editors. Harrison’s Prin-ciples of Internal Medicine. 18th ed. New York,NY: McGraw-Hill, 2011. Part 11, Section 1, Chap-ter 253.
5. Volpicelli G, Elbarbary M, Blaivas M, et al., In-ternational Liaison Committee on Lung Ultrasoundfor International Consensus Conference on LungUltrasound. International evidence-based recom-mendations for point-of-care lung ultrasound.Intensive Care Med 2012;38:577–91.
6. Picano E, Frassi F, Agricola E, Gligorova S,Gargani L, Mottola G. Ultrasound lung comets: aclinically useful sign of extravascular lung water.J Am Soc Echocardiogr 2006;19:356–63.
7. Picano E, Pellikka PA. Ultrasound of extravas-cular lung water: a new standard for pulmonarycongestion. Eur Heart J 2016;37:2097–104.
8. Mayo PH, Beaulieu Y, Doelken P, et al. AmericanCollege of Chest Physicians/La Société de Réan-imation de Langue Française statement oncompetence in critical care ultrasonography. Chest2009;135:1050–60.
9. Lichtenstein D. The probe. In: Lung Ultrasoundin the Critically Ill – The BLUE-Protocol. Heidel-berg, Germany: Springer, 2016; p 23–35.
10. Scali MC, Cortigiani L, Simionuc A, Gregori D,Marzilli M, Picano E. Exercise-induced B-linesidentify worse functional and prognostic stage inheart failure patients with depressed left ventric-ular ejection fraction. Eur J Heart Failure 2017;19:1468–78.
11. Lichtenstein D, Mézière G. Relevance of lungultrasound in the diagnosis of acute respiratoryfailure: the BLUE protocol. Chest 2008;134:117–25.
12. Scali MC, Zagatina A, Simova I, et al. B-lineswith lung ultrasound: the optimal scan techniqueat rest and during stress Ultrasound Med Biol2017;43:2558–66.
13. Lichtenstein D, Hulot JS, Rabiller A, Tostivint I,Mezière G. Feasibility and safety of ultrasound-aided thoracentesis in mechanically ventilatedpatients. Intensive Care Med 1999;25:955–8.
14. Lichtenstein D, Lascols N, Mézière G,Gepner A. Ultrasound diagnosis of alveolarconsolidation in the critically ill. Intensive CareMed 2004;30:276–81.
15. Lichtenstein D. Lung ultrasound in the criticallyill. Ann Intensive Care 2014;4:1.
16. Brixey AG, Light RW. Pleural effusions occur-ring with right heart failure. Curr Opin Pulm Med2011;17:226–31.
17. Wiener-Kronish JP, Matthay MA, Callen PW,et al. Relationship of pleural effusions to pulmo-nary hemodynamics in patients with congestiveheart failure. Am Rev Respir Dis 1985;132:1253–6.
18. Tang K, Robbins IM, Light RW. Incidence ofpleural effusions in idiopathic and familial pul-monary arterial hypertension patients. Chest2009;136:688–93.
19. Luo Y, Robbins IM, Kataras M, et al. Incidenceof pleural effusions in patients with pulmonaryarterial hypertension associated with connectivetissue diseases. Chest 2011;140:42–7.
20. Ponikowski P, Voors AA, Anker SD, et al. ESCguidelines for the diagnosis and treatment ofacute and chronic heart failure: the Task Force forthe Diagnosis and Treatment of Acute and ChronicHeart Failure of the European Society of Cardiol-ogy. Eur J Heart Fail 2016;18:891–975.
21. Kataoka H, Takada S. The role of thoracic ul-trasonography for evaluation of patients withdecompensated chronic heart failure. J Am CollCardiol 2000;35:1638–46.
22. Frassi F, Gargani L, Tesorio P, Raciti M,Mottola G, Picano E. Prognostic value of extra-vascular lung water assessed with ultrasound lungcomets by chest sonography in patients withdyspnea and/or chest pain. J Card Fail 2007;13:830–5.
23. Zoccali C, Torino C, Tripepi R, et al. Pulmonarycongestion predicts cardiac events and mortalityin ESRD. J Am Soc Nephrol 2013;24:639–46.
24. Gargani L, Pang PS, Frassi F, et al. Persistentpulmonary congestion before discharge predictsrehospitalization in heart failure: a lung ultrasoundstudy. Cardiovasc Ultrasound 2015;13:40.
25. Coiro S, Rossignol P, Ambrosio G, et al. Prog-nostic value of residual pulmonary congestion atdischarge assessed by lung ultrasound imaging inheart failure. Eur J Heart Fail 2015;17:1172–81.
26. Gustafsson M, Alehagen U, Johansson P. im-aging congestion with a pocket ultrasound device:prognostic implications in patients with chronicheart failure. J Card Fail 2015;21:548–54.
27. Cogliati C, Casazza G, Ceriani E, et al. Lungultrasound and short-term prognosis in heartfailure patients. Int J Cardiol 2016;218:104–8.
28. Platz E, Lewis EF, Uno H, et al. Detection andprognostic value of pulmonary congestion by lungultrasound in ambulatory heart failure patients.Eur Heart J 2016;37:1244–51.
29. Miglioranza HM, Picano E, Badano L, et al.Pulmonary congestion evaluated by lung ultra-sound predicts decompensation in heart failureoutpatients. Int J Cardiol 2017;240:271–8.
30. Gundersen GH, Norekval TM, Graven T, et al.Patient-reported outcomes and associations withpleural effusions in outpatients with heart failure:an observational cohort study. BMJ Open 2017;7:e013734.
31. Morales-Rull JL, Bielsa S, Conde-Martel A,et al. Pleural effusions in acute decompensatedheart failure: prevalence and prognostic implica-tions. Eur J Intern Med 2018;52:49–53.
32. Picano E, Scali MC. The lung water cascade.Echocardiography 2017;34:1503–7.
33. Lichtenstein D, Mézière G, Lagoueyte JF,Biderman P, Goldstein I, Gepner A. A-lines and B-lines: lung ultrasound as a bedside tool for pre-dicting pulmonary artery occlusion pressure in thecritically ill. Chest 2009;136:1014–20.
34. Platz E, Jhund PS, Campbell ST, McMurray JJ.Assessment and prevalence of pulmonary edemain contemporary acute heart failure trials: a sys-tematic review. Eur J Heart Fail 2015;17:906–16.
35. Torino C, Gargani L, Sicari R, et al. The agree-ment between auscultation and lung ultrasound inhemodialysis patients: the LUST study. Clin J AmSoc Nephrol 2016;11:2005–11.
36. Platz E, Merz AA, Jhund PS, Vazir A,Campbell R, McMurray JJ. Dynamic changes andprognostic value of pulmonary congestion by lungultrasound in acute and chronic heart failure: asystematic review. Eur J Heart Fail 2017;19:1154–63.
37. Martindale JL, Wakai A, Collins SP, et al.Diagnosing acute heart failure in the emergencydepartment: a systematic review and meta-anal-ysis. Acad Emerg Med 2016;23:223–42.
38. Gargani L, Frassi F, Soldati G, Tesorio P,Gheorghiade M, Picano E. Ultrasound lung cometsfor the differential diagnosis of acute cardiogenicdyspnoea: a comparison with natriuretic peptides.Eur J Heart Fail 2008;10:70–7.
39. Liteplo AS, Marill KA, Villen T, et al. Emergencythoracic ultrasound in the differentiation of theetiology of shortness of breath (ETUDES): sono-graphic B-lines and N-terminal pro-brain-typenatriuretic peptide in diagnosing congestive heartfailure. Acad Emerg Med 2009;16:201–10.
40. Wang HK, Tsai MS, Chang JH, Wang TD,Chen WJ, Huang CH. Cardiac ultrasound helps fordifferentiating the causes of acute dyspnea withavailable B-type natriuretic peptide tests. Am JEmerg Med 2010;28:987–93.
41. Nazerian P, Vanni S, Zanobetti M, et al. Diag-nostic accuracy of emergency Doppler echocardi-ography for identification of acute left ventricularheart failure in patients with acute dyspnea:comparison with Boston criteria and N-terminalprohormone brain natriuretic peptide. Acad EmergMed 2010;17:18–26.
42. Prosen G, Klemen P, �Strnad M, Grmec S.Combination of lung ultrasound (a comet-tail sign)and N-terminal pro-brain natriuretic peptide indifferentiating acute heart failure from chronicobstructive pulmonary disease and asthma ascause of acute dyspnea in prehospital emergencysetting. Crit Care 2011;15:R114.
43. Vitturi N, Soattin M, Allemand E, Simoni F,Realdi G. Thoracic ultrasonography: a new methodfor the work-up of patients with dyspnea.J Ultrasound 2011;14:147–51.
J A C C : C A R D I O V A S C U L A R I M A G I N G , V O L . 1 1 , N O . 1 1 , 2 0 1 8 Picano et al.N O V E M B E R 2 0 1 8 : 1 6 9 2 – 7 0 5 Heart-Driven Lung Ultrasound
1705
44. Cibinel GA, Casoli G, Elia F, et al. Diagnosticaccuracy and reproducibility of pleural and lungultrasound in discriminating cardiogenic causes ofacute dyspnea in the emergency department.Intern Emerg Med 2012;7:65–70.
45. Anderson KL, Jenq KY, Fields JM,Panebianco NL, Dean AJ. Diagnosing heart failureamong acutely dyspneic patients with cardiac,inferior vena cava, and lung ultrasonography. Am JEmerg Med 2013;31:1208–14.
46. Russell FM, Ehrman RR, Cosby K, et al. Diag-nosing acute heart failure in patients with undif-ferentiated dyspnea: a lung and cardiac ultrasound(LuCUS) protocol. Acad Emerg Med 2015;22:182–91.
47. Pivetta E, Goffi A, Lupia E, et al. Lung ultra-sound implemented diagnosis of acute decom-pensated heart failure in the ED: a SIMEUmulticenter study. Chest 2015;148:202–10.
48. Sforza A, Mancusi C, Carlino MV, et al. Diag-nostic performance of multiorgan ultrasound withpocket-sized device in the management of acutedyspnea. Cardiovasc Ultrasound 2017;15:16.
49. Ohman J, Harjola VP, Karjalainen P, Lassus J.Rapid cardiothoracic ultrasound protocol fordiagnosis of acute heart failure in the emergencydepartment. Eur J Emerg Med 2017 Oct 3 [E-pubahead of print].
50. Agricola E, Picano E, Oppizzi M, et al.Assessment of stress-induced pulmonary intersti-tial edema by chest ultrasound during exerciseechocardiography and its correlation with leftventricular function. J Am Soc Echocardiogr 2006;19:457–63.
51. Simonovic D, Coiro S, Carluccio E, Girerd N,Deljanic-Ilic M, Ambrosio G. Exercise elicits dy-namic changes in extravascular lung water andhemodynamic congestion in heart failure patientswith preserved ejection fraction. Eur J Heart Fail2018;20:1366–9.
52. Nazerian P, Vanni S, Volpicelli G, et al. Accu-racy of point-of-care multiorgan ultrasonographyfor the diagnosis of pulmonary embolism. Chest2014;145:950–7.
53. Song G, Bae SC, Lee YH. Diagnostic accuracy oflung ultrasound for interstitial lung disease inpatients with connective tissue diseases: a meta-analysis. Clin Exp Rheumatol 2016;34:11–6.
54. Chavez MA, Shams N, Ellington LE, et al. Lungultrasound for the diagnosis of pneumonia inadults: a systematic review and meta-analysis.Respir Res 2014;15:50.
55. Alrajab S, Youssef AM, Akkus NI, Caldito G.Pleural ultrasonography versus chest radiographyfor the diagnosis of pneumothorax: review ofliterature and meta-analysis. Crit Care 2013;17:R208.
56. Havelock T, Teoh R, Laws D, Gleeson F, BTSPleural Disease Guideline Group. Pleural proced-ures and thoracic ultrasound: British Thoracic So-ciety pleural disease guideline 2010. Thorax 2010;65 Suppl 2:II61–76.
57. Dancel R, Schnobrick D, Puri N, et al. Recom-mendations on the use of ultrasound guidance foradult thoracentesis: a position statement of theSociety of Hospital Medicine. J Hosp Med 2018;13:126–35.
58. Sicari R, Galderisi M, Voigt UJ, et al. The use ofpocket-size imaging devices. A position statementof the European Association of Echocardiography.Eur J Echocardiogr 2011;12:85–97.
59. Neskovic AN, Hagendorff A, Lancellotti P,et al. Emergency echocardiography: the EuropeanAssociation of Echocardiography recommenda-tions. Eur Heart J Cardiovasc Imaging 2013;14:1–11.
60. Mebazaa A, Yilmaz MB, Levy P, et al. Rec-ommendations on pre-hospital and early hospitalmanagement of acute heart failure: a consensuspaper from the Heart Failure Association of theEuropean Society of Cardiology, the European
Society of Emergency Medicine and the Society ofAcademic Emergency Medicine–short version. EurHeart J 2015;36:1958–66.
61. Price S, Platz E, Cullen L, et al. Echocardiog-raphy and lung ultrasonography for the assess-ment and management of acute heart failure.Expert consensus document for the Acute HeartFailure Study Group of the European Society ofCardiology Acute Cardiovascular Care Association.Nat Rev Cardiol 2017;14:427–40.
62. Lancellotti P, Pellikka PA, Budts W, et al.Recommendations for the clinical use of stressechocardiography in non-ischemic heart disease:joint document of the European Association ofCardiovascular Imaging and the American Societyof Echocardiography. Eur Heart J Cardiovasc Im-aging 2016;17:1191–229.
63. Stolz L, O’ Brien KM, Miller MM, et al. A reviewof lawsuits related to point-of-care emergencyultrasound applications. West J Emerg Med 2015;16:1–4.
64. Picano E, Ciampi Q, Citro R, et al. Stress echo2020: the international stress echo study inischemic and non-ischemic heart disease. Car-diovasc Ultrasound 2017;15:3.
65. Picano E, Vano E, Rehani MM, et al. Theappropriate and justified use of medical radiationin cardiovascular imaging: a position document ofthe ESC Associations of Cardiovascular Imaging,Percutaneous Cardiovascular Interventions andElectrophysiology. Eur Heart J 2014;35:665–72.
KEY WORDS chest sonography,echocardiography, pleural effusion,pulmonary congestion, thoracic ultrasound
APPENDIX For a supplemental video,please see the online version of this paper.