Embed Size (px)
Citation preview
Lunch and Learn
February 10, 2004
Crop Insurance UpdateGeorge Patrick
Crop Insurance Update
Topics1. Review of crop insurance
2. Risk management crop insurance and pre-harvest
pricing3. Crop insurance for hogs
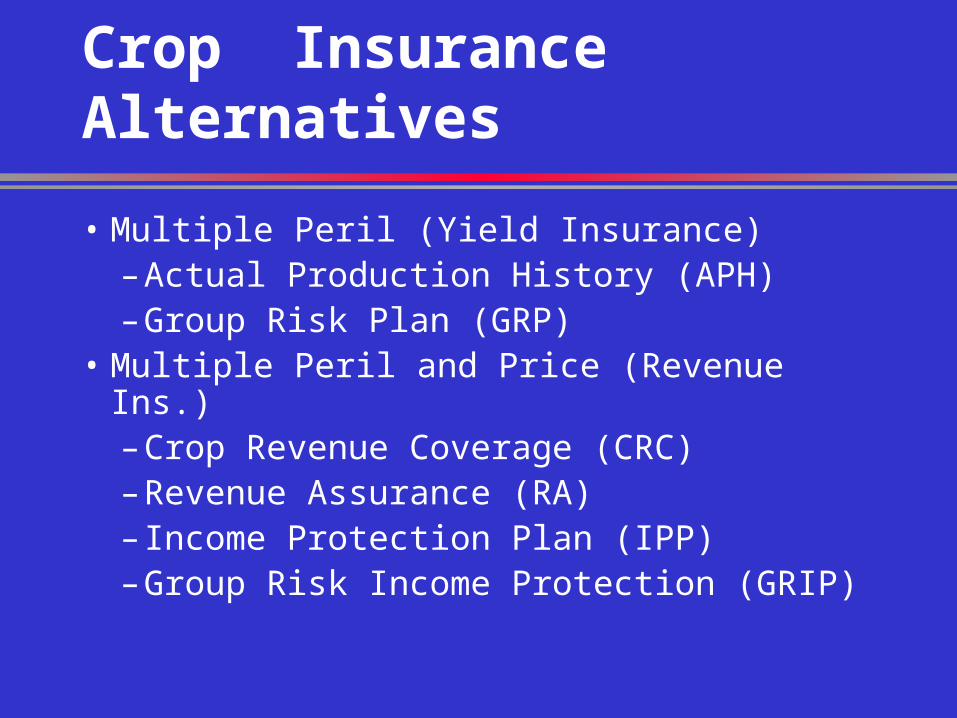
Crop Insurance Alternatives
• Multiple Peril (Yield Insurance)– Actual Production History (APH)– Group Risk Plan (GRP)
• Multiple Peril and Price (Revenue Ins.)– Crop Revenue Coverage (CRC)– Revenue Assurance (RA)– Income Protection Plan (IPP)– Group Risk Income Protection (GRIP)
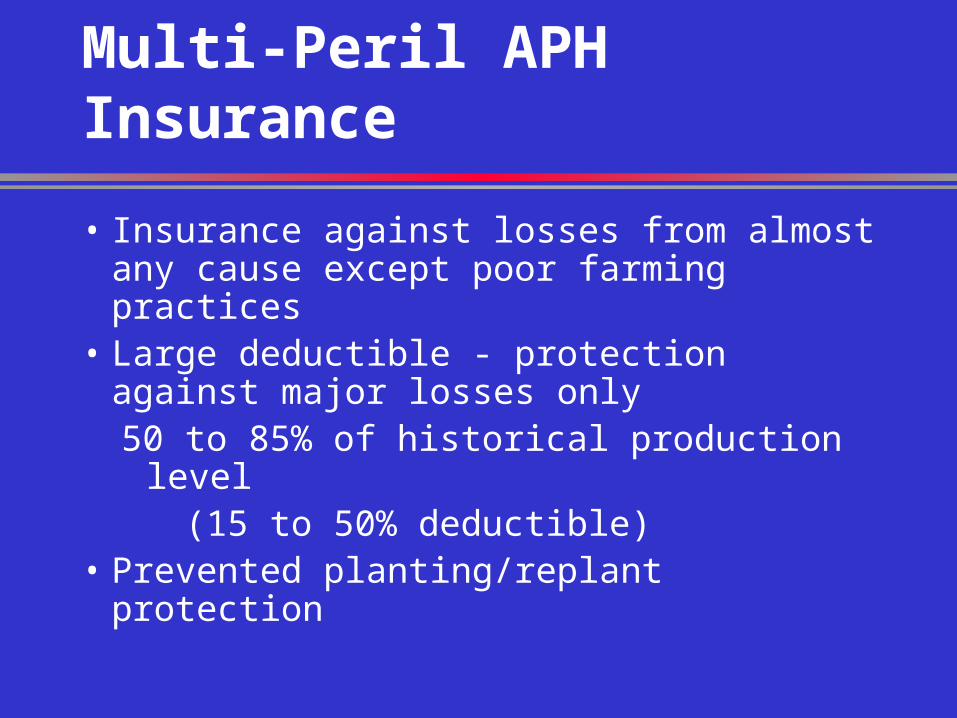
Multi-Peril APH Insurance
• Insurance against losses from almost any cause except poor farming practices
• Large deductible - protection against major losses only50 to 85% of historical production level (15 to 50% deductible)
• Prevented planting/replant protection
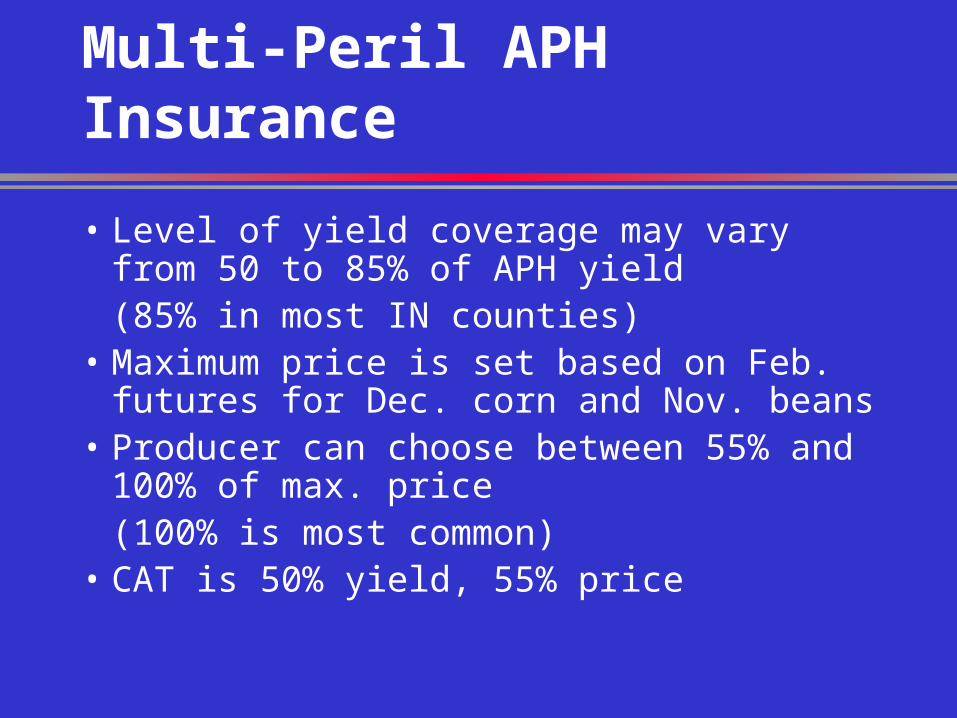
Multi-Peril APH Insurance
• Level of yield coverage may vary from 50 to 85% of APH yield
(85% in most IN counties)• Maximum price is set based on Feb.
futures for Dec. corn and Nov. beans• Producer can choose between 55% and
100% of max. price (100% is most common)
• CAT is 50% yield, 55% price
Multi-Peril Crop Insurance
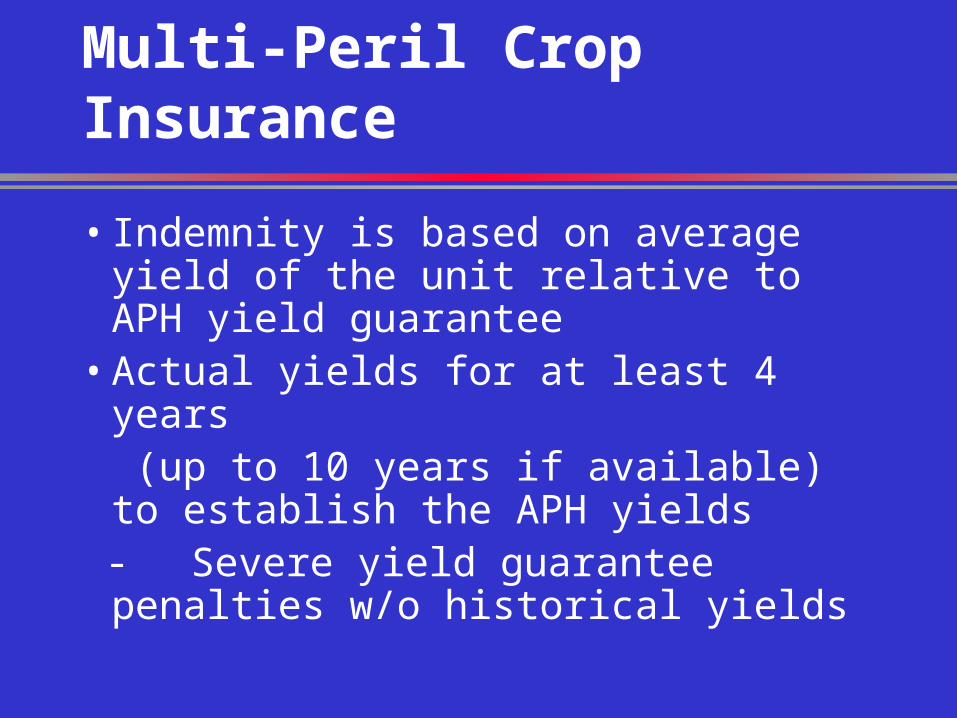
• Indemnity is based on average yield of the unit relative to APH yield guarantee
• Actual yields for at least 4 years (up to 10 years if available) to establish the APH yields
-Severe yield guarantee penalties w/o historical yields
Multi-Peril Crop Insurance
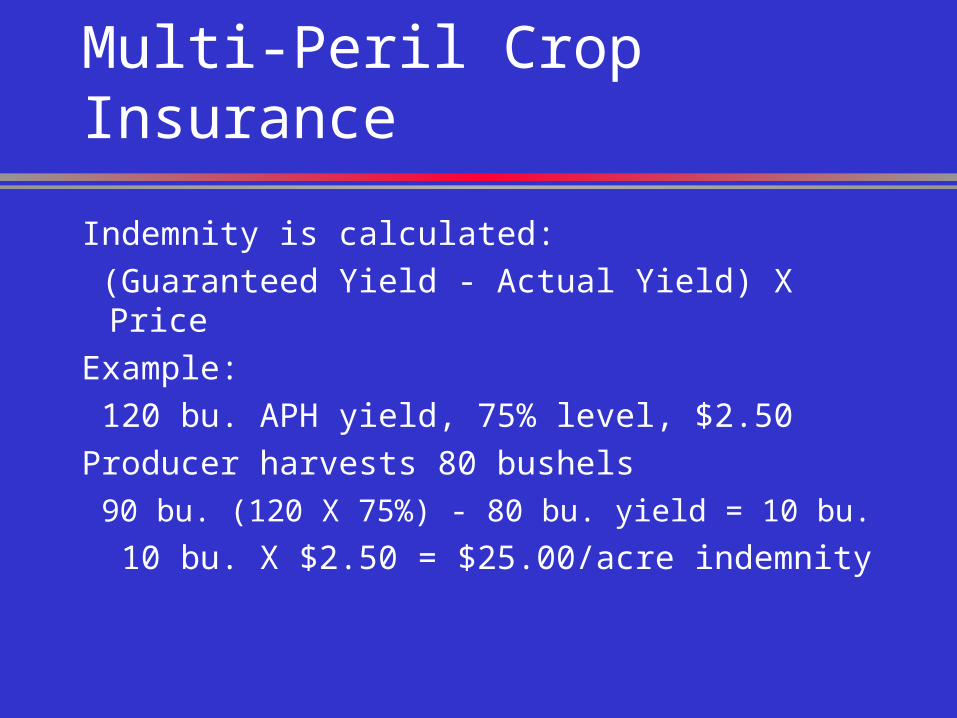
Indemnity is calculated:
(Guaranteed Yield - Actual Yield) X Price
Example:
120 bu. APH yield, 75% level, $2.50
Producer harvests 80 bushels
90 bu. (120 X 75%) - 80 bu. yield = 10 bu.
10 bu. X $2.50 = $25.00/acre indemnity
APH Premiums
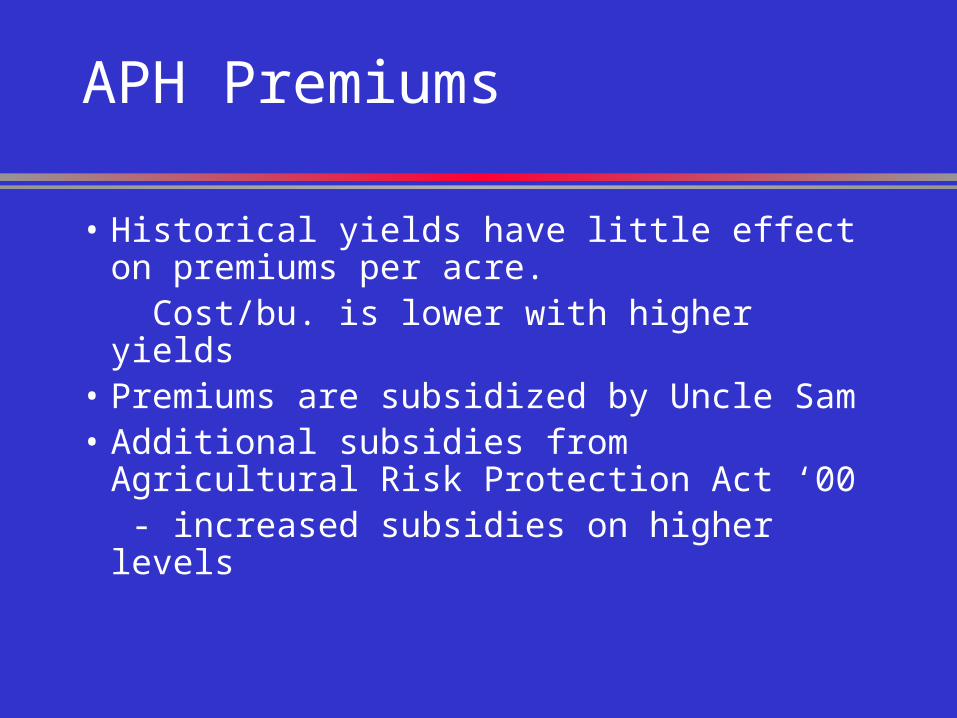
• Historical yields have little effect on premiums per acre.
Cost/bu. is lower with higher yields
• Premiums are subsidized by Uncle Sam• Additional subsidies from Agricultural
Risk Protection Act ‘00 - increased subsidies on higher levels
Revenue Insurances
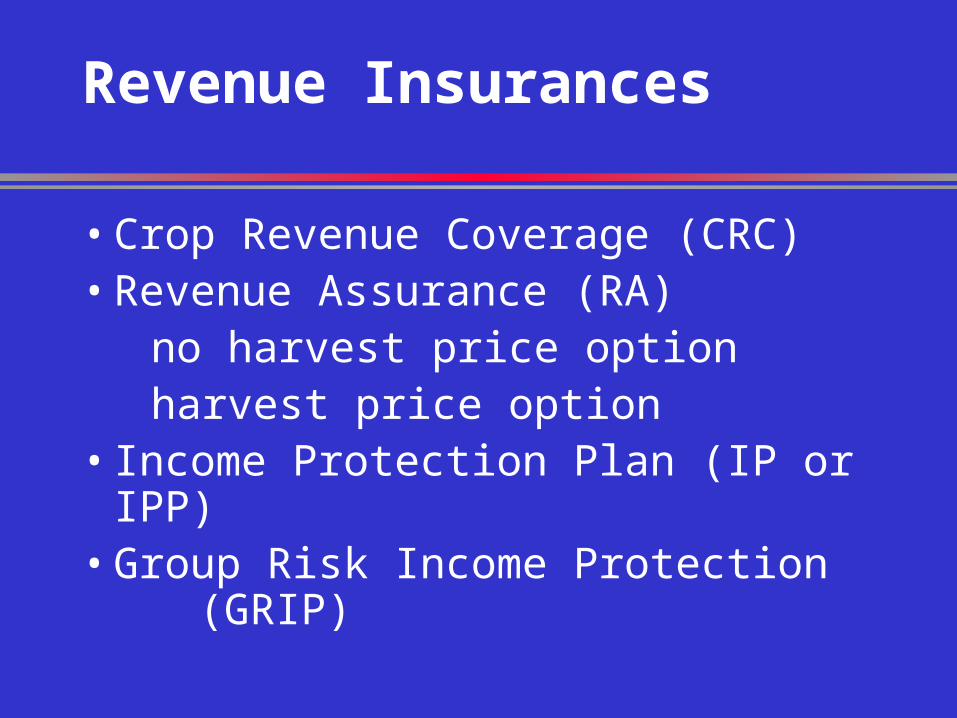
• Crop Revenue Coverage (CRC)• Revenue Assurance (RA)
no harvest price optionharvest price option
• Income Protection Plan (IP or IPP)• Group Risk Income Protection
(GRIP)
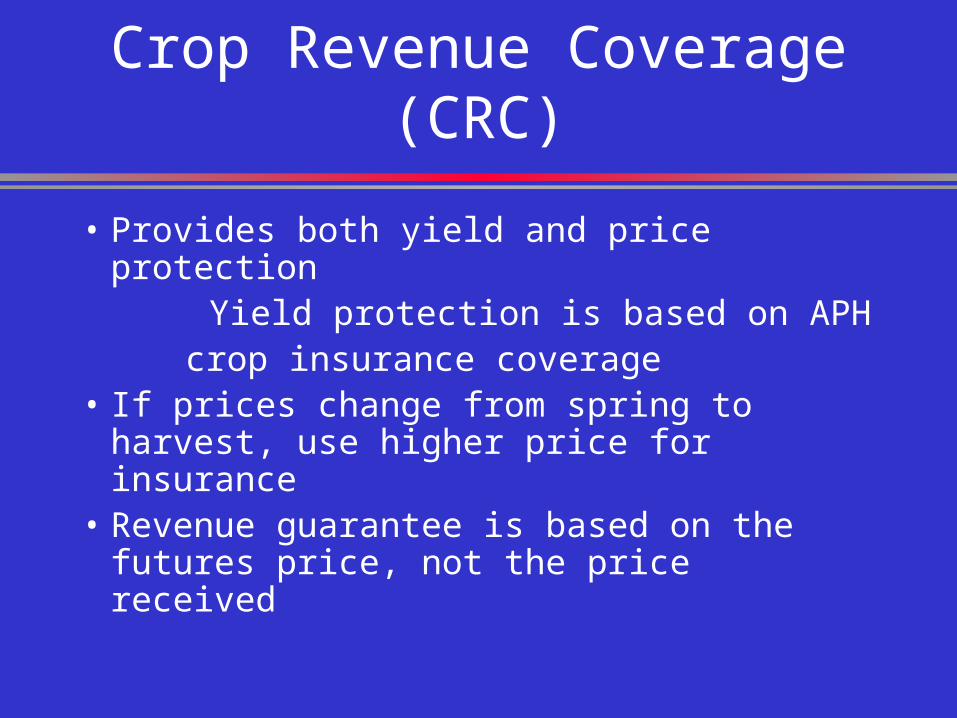
Crop Revenue Coverage (CRC)
• Provides both yield and price protection Yield protection is based on APH crop insurance coverage• If prices change from spring to harvest,
use higher price for insurance• Revenue guarantee is based on the
futures price, not the price received
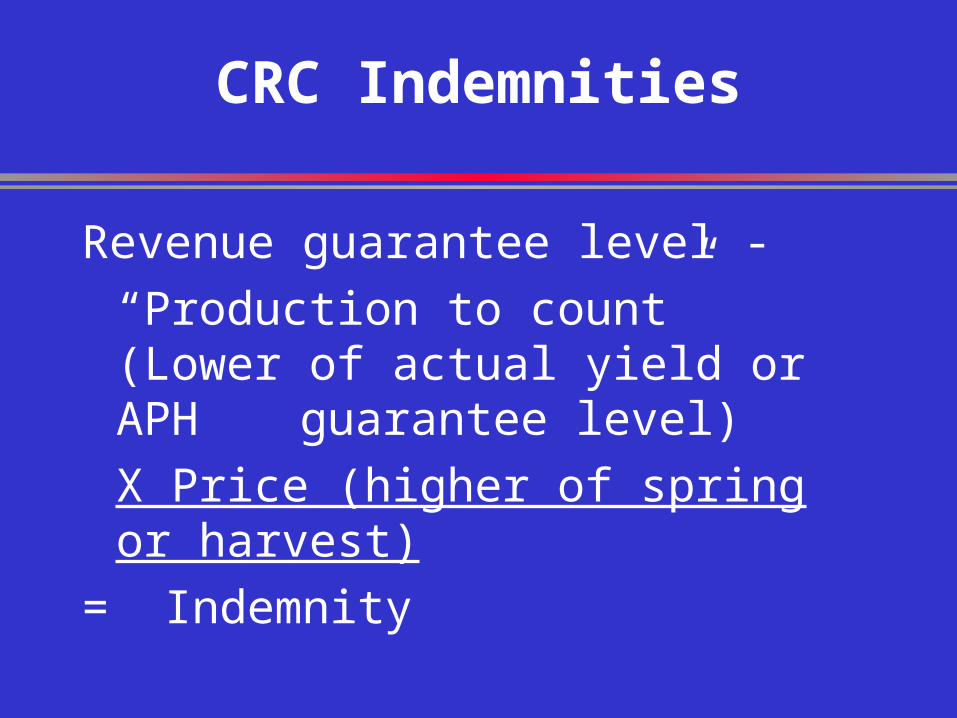
CRC Indemnities
Revenue guarantee level -
“Production to count” (Lower of actual yield or APH guarantee level)
X Price (higher of spring or harvest)
= Indemnity
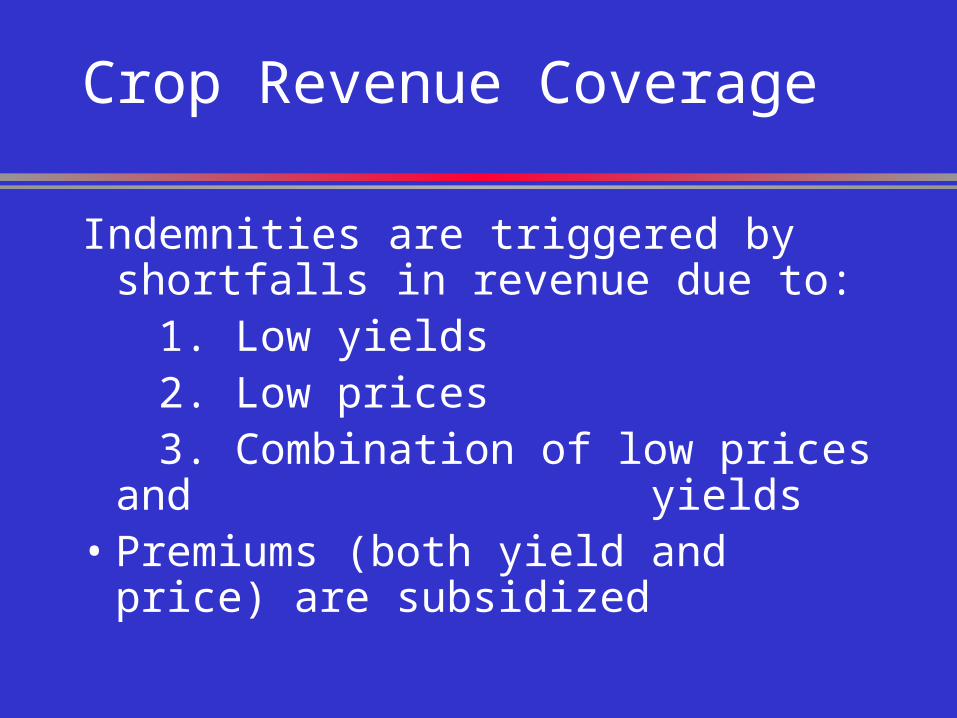
Crop Revenue Coverage
Indemnities are triggered by shortfalls in revenue due to:
1. Low yields 2. Low prices 3. Combination of low prices and
yields• Premiums (both yield and price) are
subsidized
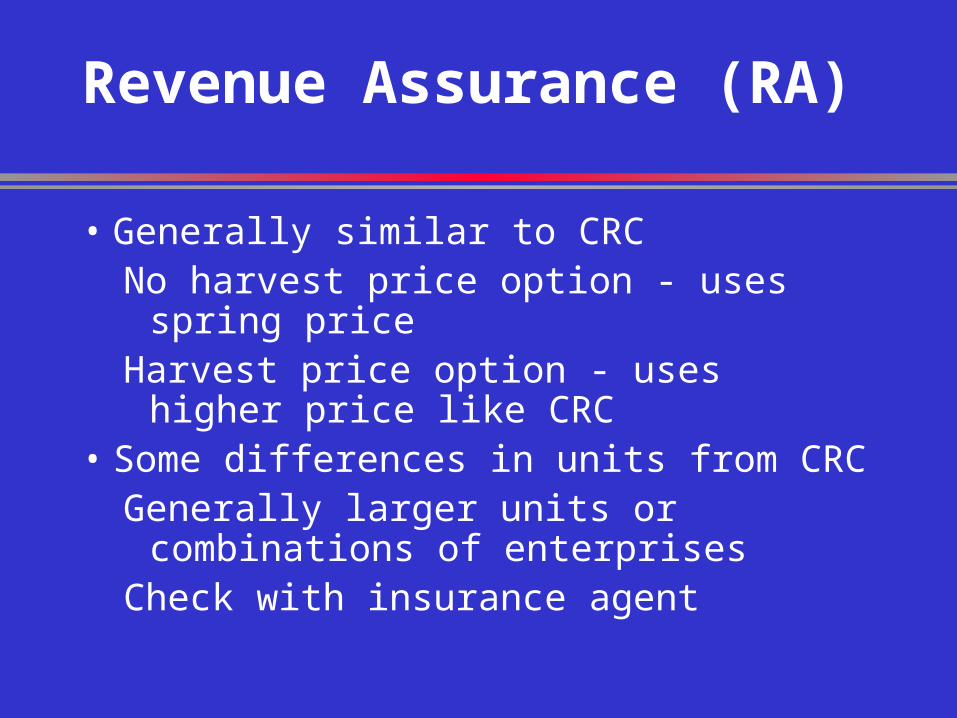
Revenue Assurance (RA)
• Generally similar to CRCNo harvest price option - uses spring priceHarvest price option - uses higher price
like CRC• Some differences in units from CRC
Generally larger units or combinations of enterprises
Check with insurance agent
Income Protection Plan (IPP)
• Similar to CRC - income coverage• If income falls below insured level, pays
an indemnity • Low yield/high price may result in no
indemnity if income level is above insured level
• Builds on the “natural hedge”Low yields generally have higher prices
• Premiums generally lower than APH
Group Risk Plan (GRP)
• Coverage is based on expected county yields and actual county yields
• Individual’s yield is not relevant• “Trigger level” - based on % of expected
county yieldRanges from 70 to 90% of exp. yieldCan insure up to 150% of county yield
GRP Indemnity
• Indemnity is paid if county yield is below the trigger yield of the insurance (140 bu. X 90%)=126 bu.
• Indemnity is % shortfall X coverage level
((126- 90)/126)= 28.6%* $300 = $86
GRP Crop Insurance
• Indemnity is paid only if county yield is below trigger yield
• Producer could have a disaster and county be near normal
• Producer could do well and get an indemnity if county is low
Group Risk Income Protection (GRIP)
• Based off the GRP concept• Pays if actual county revenue drops
below trigger revenue• Expected prices are based on
futures prices in mid-March• “Harvest” price is Nov. soybeans
futures in Oct and Dec. corn in Nov.
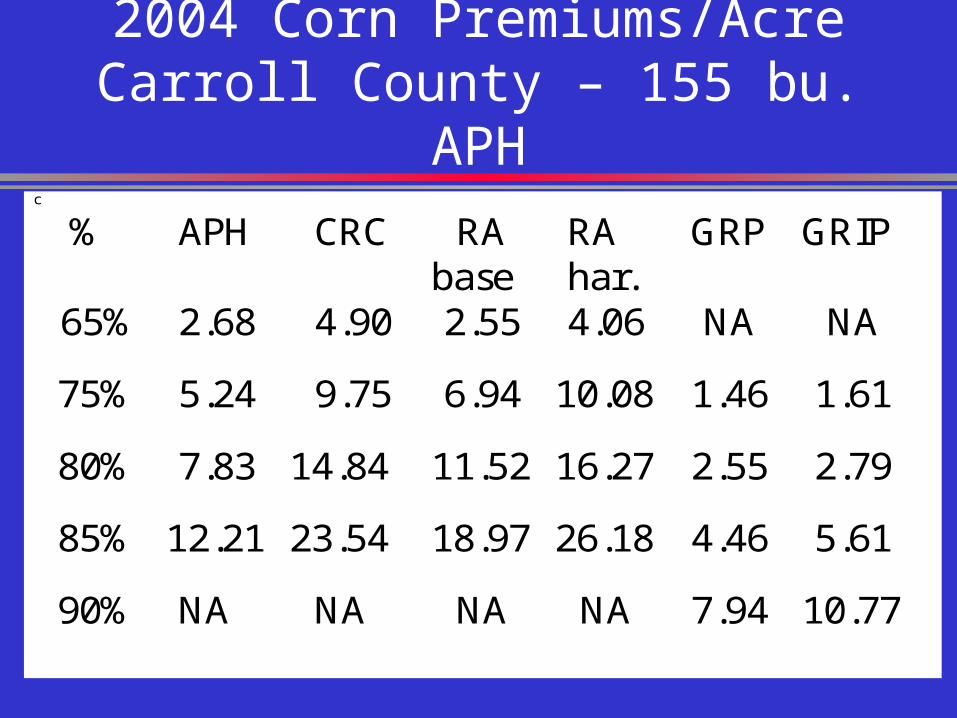
2004 Corn Premiums/AcreCarroll County – 155 bu. APH
c
% APH CRC RA base
RA har.
GRP GRIP
65% 2.68 4.90 2.55 4.06 NA NA
75% 5.24 9.75 6.94 10.08 1.46 1.61
80% 7.83 14.84 11.52 16.27 2.55 2.79
85% 12.21 23.54 18.97 26.18 4.46 5.61
90% NA NA NA NA 7.94 10.77

2004 Soybean Premiums/AcreCarroll County 51 bu. APH
c
% APH CRC RA base
RA har.
GRP GRIP
65% 1.99 3.49 2.12 2.94 NA NA
75% 3.87 6.89 5.80 7.62 1.15 1.29
80% 6.07 10.84 9.58 12.42 1.48 2.10
85% 9.68 17.48 15.72 20.13 2.46 3.47
90% NA NA NA NA 4.50 6.85
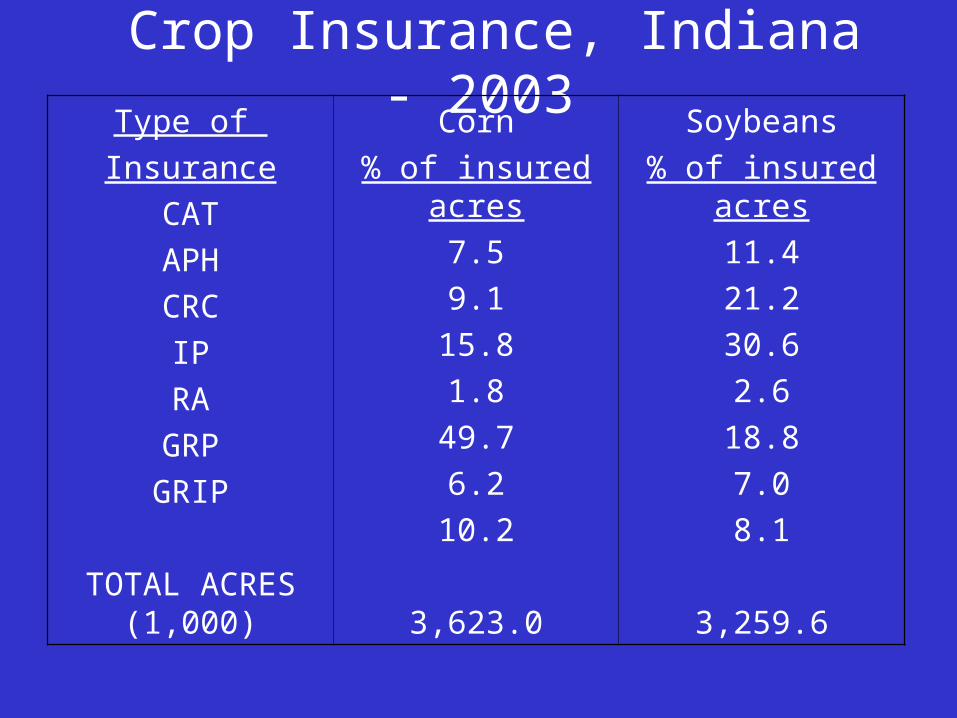
Crop Insurance, Indiana - 2003Type of
Insurance
CAT
APH
CRC
IP
RA
GRP
GRIP
TOTAL ACRES (1,000)
Corn
% of insured acres
7.5
9.1
15.8
1.8
49.7
6.2
10.2
3,623.0
Soybeans
% of insured acres
11.4
21.2
30.6
2.6
18.8
7.0
8.1
3,259.6
General Crop Insurance Information
Purdue Ag. Econ. Report
Sept. 2001 “Crop and Revenue Insurance Alternatives”
www.agecon.purdue.edu/
extension/pubs/paer/archives.asp
County Specific Information
www.farmdoc.uiuc.edu/cropins/1. Premium Calculator Specify county, crop and yield2. Insurance Evaluator
Specify county and crop Analyzes performance
Research Results
Carroll County farm 1986-2000
Excludes ’89,’92,’94 and ’96
- years following “short” crop have different price patterns
Benchmark - Cash sale at harvest with no insurance
Average returns after risk management costs
are subtracted
Value at Risk (VaR) Concept
5% VaR “Value at Risk” concept
• Measure of downside risk
95% of the time revenue will be greater than this amount (worst year in 20)
• Strategy with higher VaR is preferred if average revenue is the same
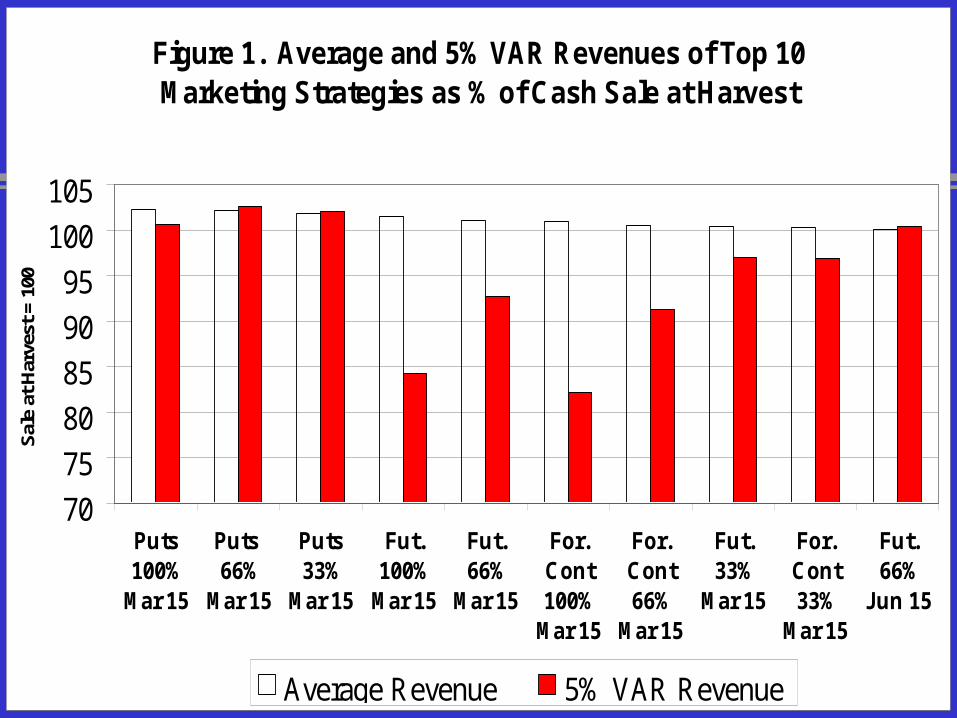
Figure 1. Average and 5% VAR Revenues of Top 10 Marketing Strategies as % of Cash Sale at Harvest
70
75
80
85
90
95
100
105
Puts100%
Mar 15
Puts 66%
Mar 15
Puts33%
Mar 15
Fut.100%
Mar 15
Fut.66%
Mar 15
For.Cont100%
Mar 15
For.Cont66%
Mar 15
Fut.33%
Mar 15
For.Cont33%
Mar 15
Fut.66%
Jun 15
Sal
e at
Har
vest
= 1
00
Average Revenue 5% VAR Revenue
Marketing Strategies
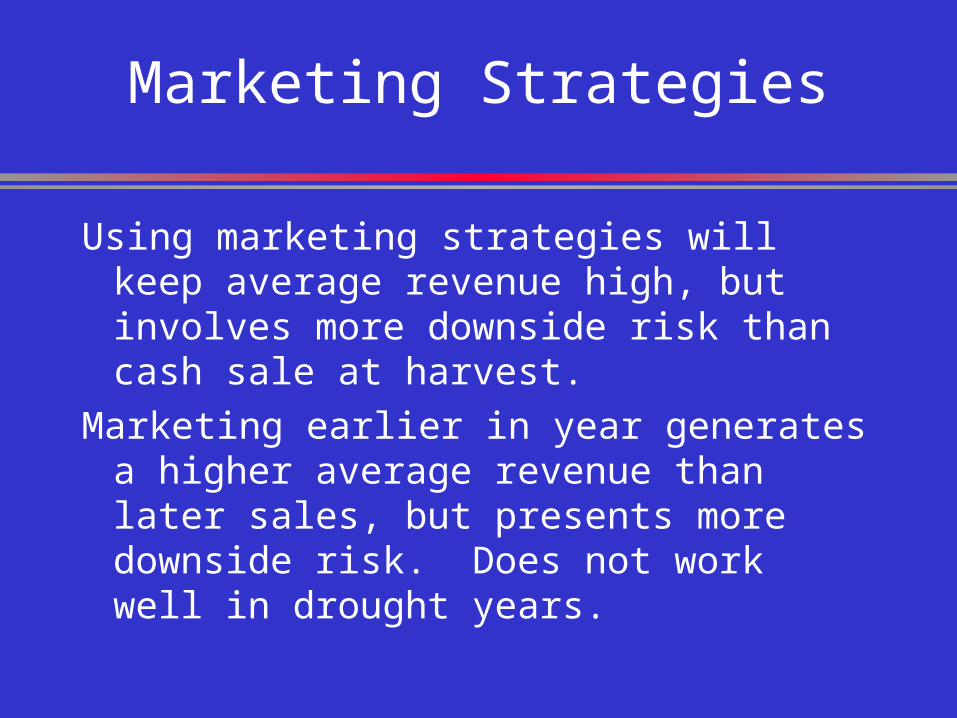
Using marketing strategies will keep average revenue high, but involves more downside risk than cash sale at harvest.
Marketing earlier in year generates a higher average revenue than later sales, but presents more downside risk. Does not work well in drought years.
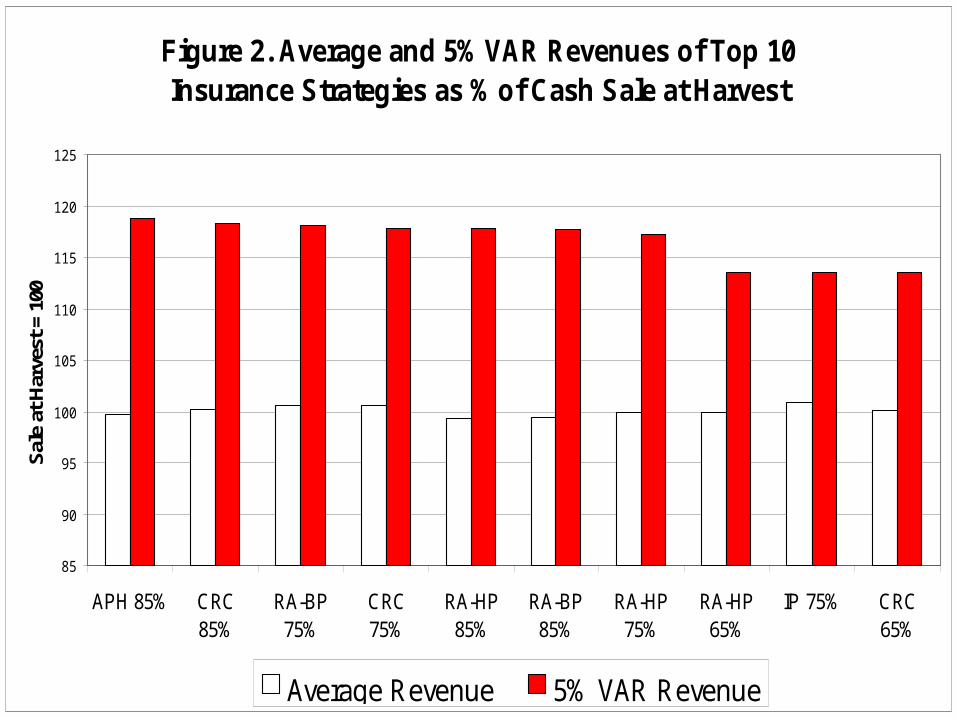
Figure 2. Average and 5% VAR Revenues of Top 10 Insurance Strategies as % of Cash Sale at Harvest
85
90
95
100
105
110
115
120
125
APH 85% CRC85%
RA-BP75%
CRC75%
RA-HP85%
RA-BP85%
RA-HP75%
RA-HP65%
IP 75% CRC65%
Sal
e at
Har
vest
= 1
00
Average Revenue 5% VAR Revenue
Insurance Strategies
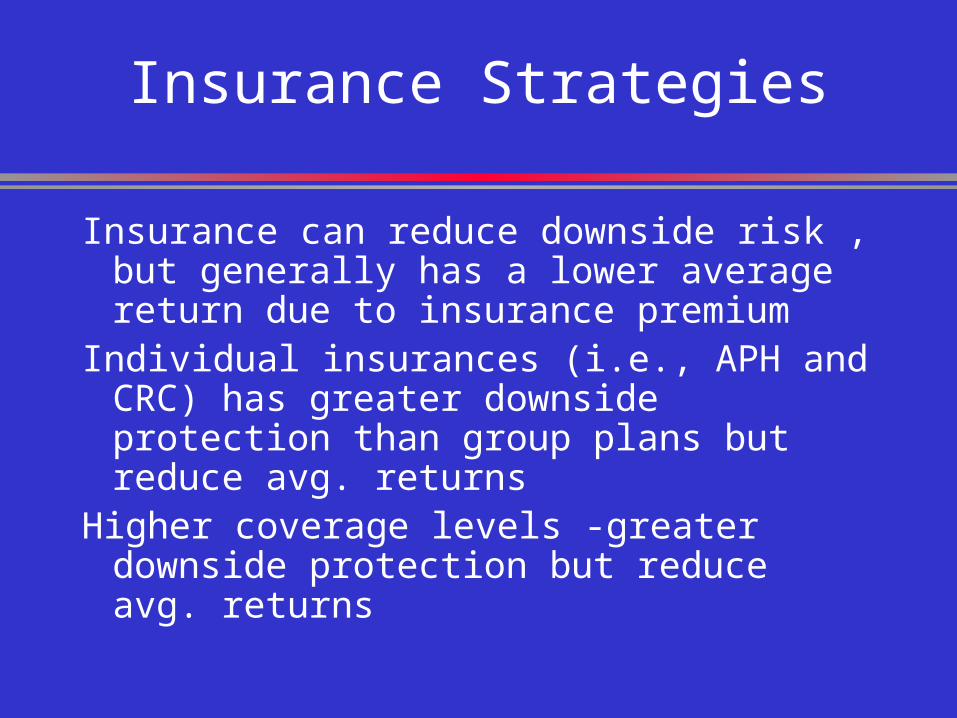
Insurance can reduce downside risk , but generally has a lower average return due to insurance premium
Individual insurances (i.e., APH and CRC) has greater downside protection than group plans but reduce avg. returns
Higher coverage levels -greater downside protection but reduce avg. returns
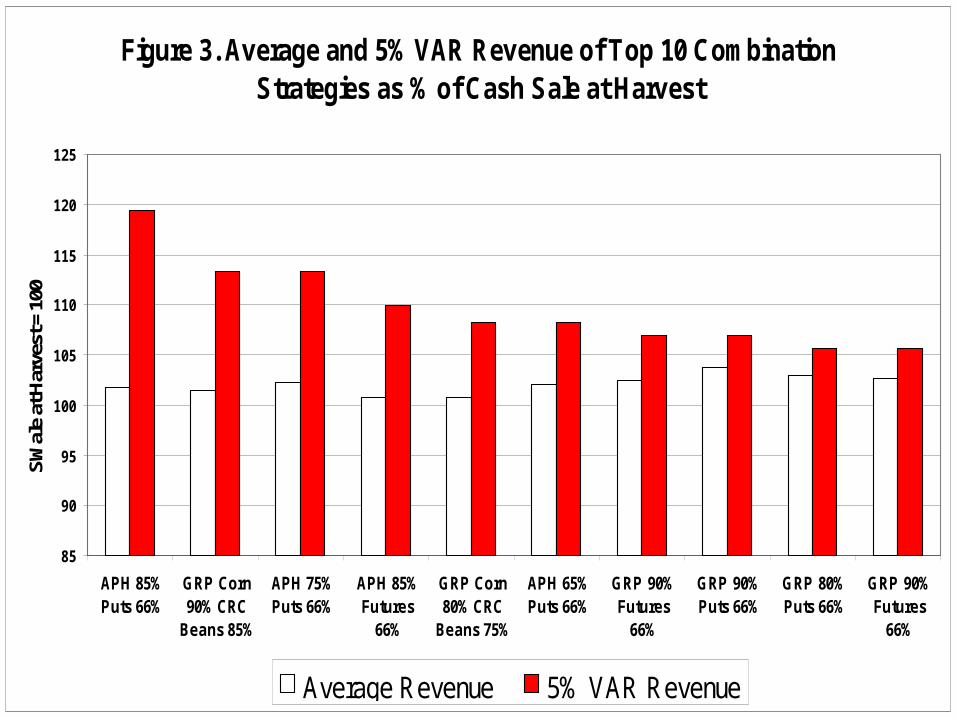
Figure 3. Average and 5% VAR Revenue of Top 10 Combination Strategies as % of Cash Sale at Harvest
85
90
95
100
105
110
115
120
125
APH 85%Puts 66%
GRP Corn90% CRC
Beans 85%
APH 75%Puts 66%
APH 85%Futures
66%
GRP Corn80% CRC
Beans 75%
APH 65%Puts 66%
GRP 90%Futures
66%
GRP 90%Puts 66%
GRP 80%Puts 66%
GRP 90%Futures
66%
SW
ale
at H
arve
st =
100
Average Revenue 5% VAR Revenue
Combination Strategies
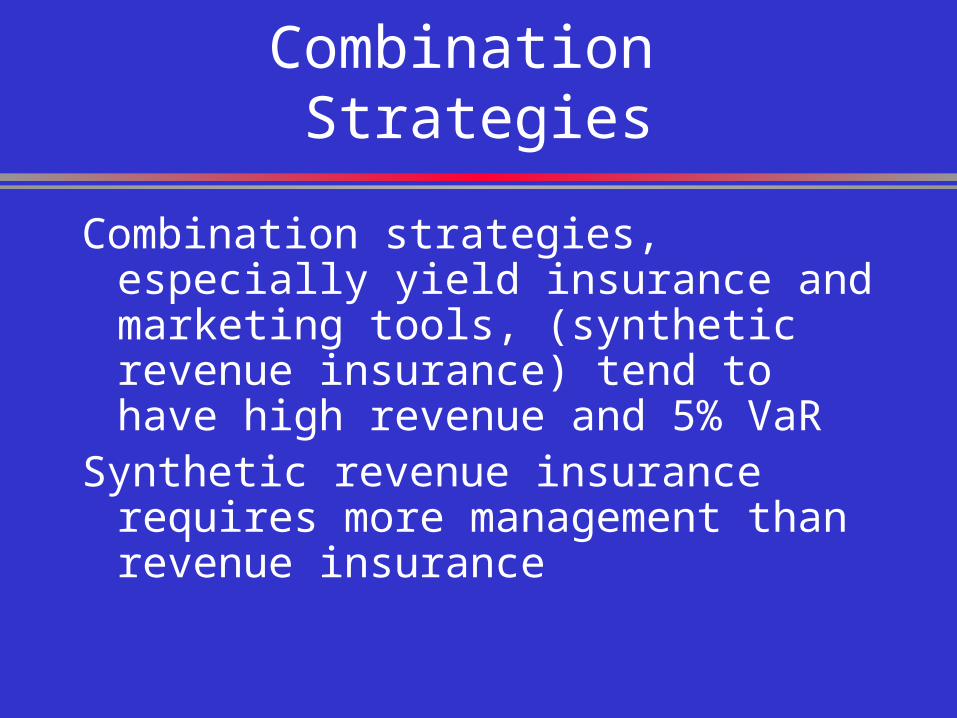
Combination strategies, especially yield insurance and marketing tools, (synthetic revenue insurance) tend to have high revenue and 5% VaR
Synthetic revenue insurance requires more management than revenue insurance
Concluding Remarks
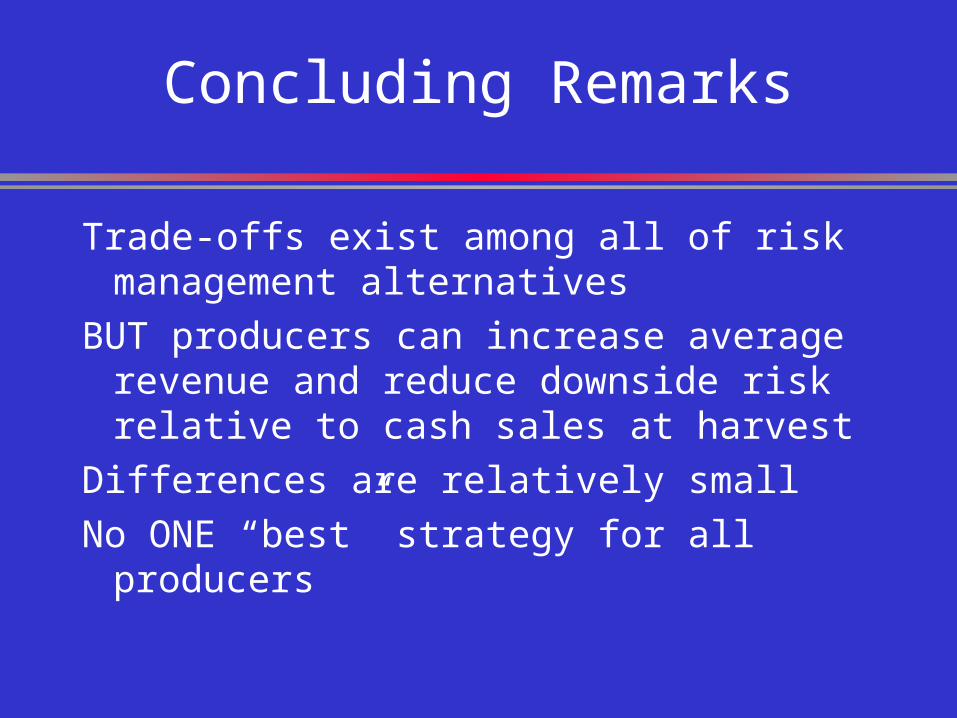
Trade-offs exist among all of risk management alternatives
BUT producers can increase average revenue and reduce downside risk relative to cash sales at harvest
Differences are relatively small
No ONE “best” strategy for all producers
Reference Material
“Protecting Farm Revenues with Pre-Harvest Pricing and Insurance”
Purdue Ag. Econ. Report
Dec. 2001 p. 5-12
www.agecon.purdue.edu/
extension/pubs/paer/archives.asp
Crop Insurance for Hogs
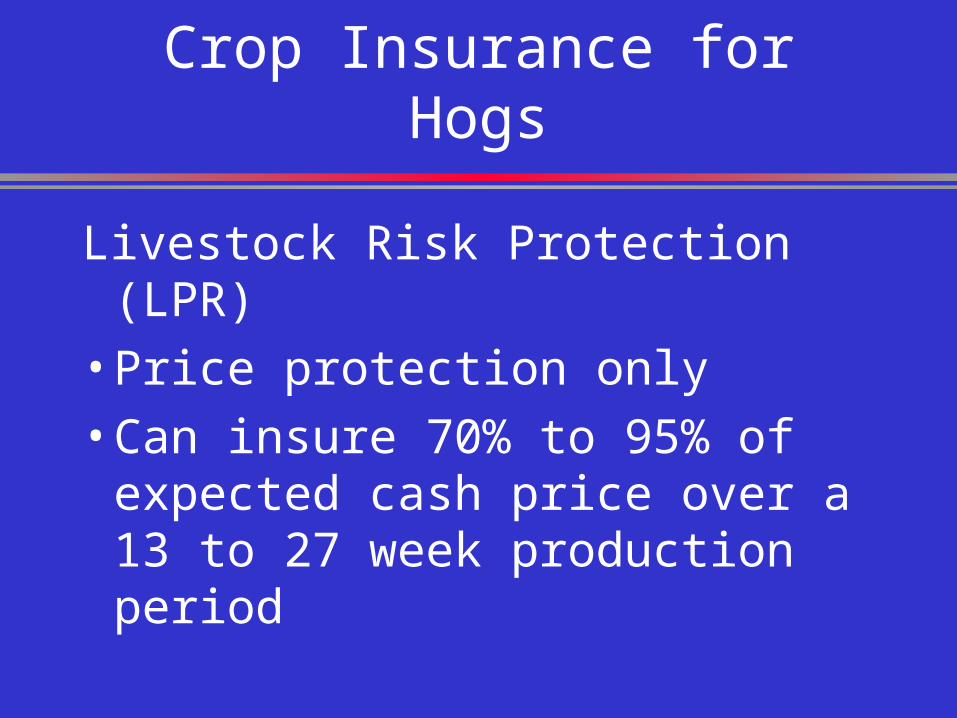
Livestock Risk Protection (LPR)
• Price protection only
• Can insure 70% to 95% of expected cash price over a 13 to 27 week production period

Crop Insurance for Hogs
• Very similar to an option – provides downside protection and does not limit upside potential
• 1 hog to 32,000 hogs annually
Advantages of LRP Coverage
1. More flexible than options or futures (quantity)
2. No margin calls
3. Premiums are subsidized
4. Simple to understand
5. Provides some basis protection
Disadvantages of LRP
1. Offers only price protection
2. Some basis risk
3. Specified settlement date whether hogs are ready
4. Use of futures/options restricted
5. Based on price outlook