Embed Size (px)
Citation preview

Lunch and
Learn:
A Collaborative Time for
North Carolina Teachers
Your Presenter Information

Thank You Burroughs Wellcome
Your lunch today was provided through a generous donation by Burroughs Wellcome

Goals for Lunch and Learn
• Network with teachers from across North Carolina to share resources for implementation of Common Core State Standards.
• Review important NCDPI resources.• Review latest assessment information.• Participate in grade level activities that
support deep understanding of standards.
New Friends
Introduce yourself to the teachers in the room by sharing the following information…
Name, School, CountyWhat is your favorite number?
Explain.

Major WorkEighth Grade
Major Clusters Supporting/Additional ClustersExpressions and Equations Work with radicals and integer exponents. Understand the connections between
proportional relationships, lines, and linear equations.
Analyze and solve linear equations and pairs of simultaneous linear equations.
Functions Define, evaluate, and compare functions. Use functions to model relationships between
quantities.
Geometry Understand congruence and similarity using
physical models, transparencies, or geometry software.
Understand and apply the Pythagorean Theorem. Solve real-world and mathematical problems
involving volume of cylinders, cones and spheres.
The Number System Know that there are numbers that are not rational,
and approximate them by rational numbers.
Statistics and Probability Investigate patterns of association in bivariate data.

Resources • NCDPI wikispaces
http://maccss.ncdpi.wikispaces.net/Kindergarten• K-2 Assessment Tasks http://commoncoretasks.wikispaces.com/• Illustrative Mathematics http://www.illustrativemathematics.org/standards/k8• Inside Mathematics http://www.insidemathematics.org/• Turnonccmath.org- NCSU Collaborative with Jere
Confrey and colleagues• http://turnonccmath.net/

Grade 6-8 Assessment

Grade 6-8 Assessment• Assessment items will be designed, developed,
and classified to ensure that the cognitive rigor of the operational test forms align to the cognitive complexity and demands of the Common Core State Standards (CCSS) for Mathematics.
• These items will require students to not only recall information, but also apply concepts and skills and make decisions.
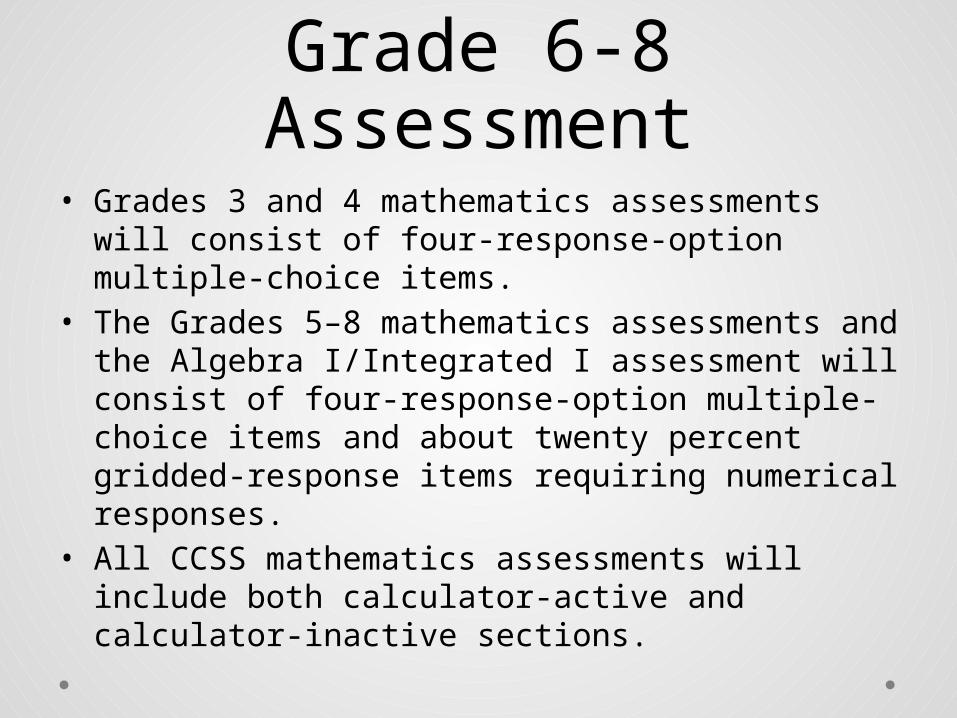
Grade 6-8 Assessment• Grades 3 and 4 mathematics assessments will
consist of four-response-option multiple-choice items.
• The Grades 5–8 mathematics assessments and the Algebra I/Integrated I assessment will consist of four-response-option multiple-choice items and about twenty percent gridded-response items requiring numerical responses.
• All CCSS mathematics assessments will include both calculator-active and calculator-inactive sections.
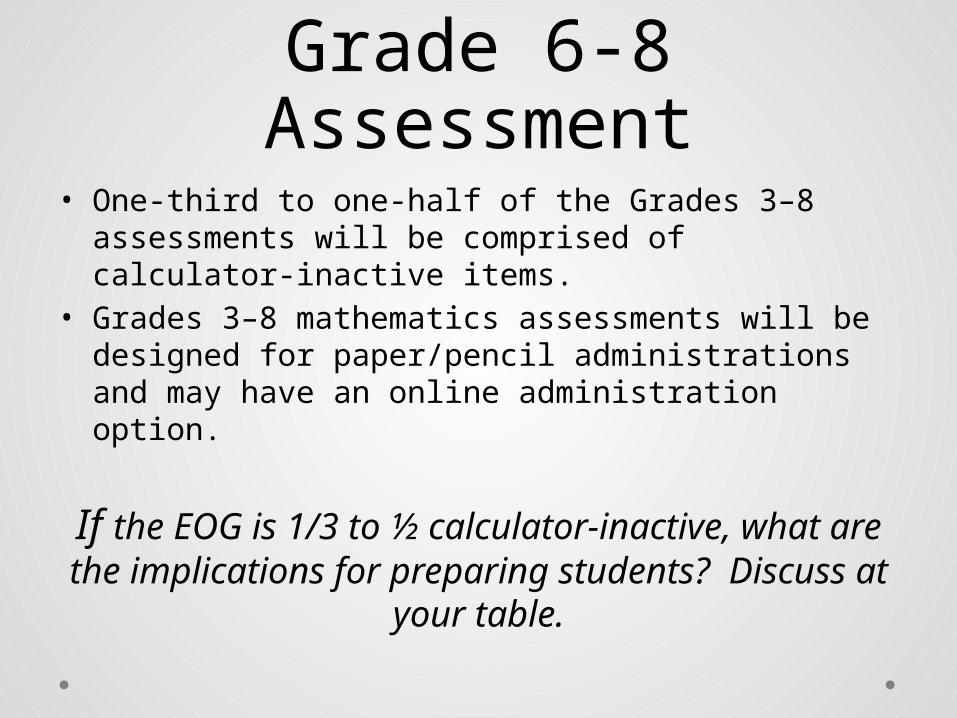
Grade 6-8 Assessment• One-third to one-half of the Grades 3–8
assessments will be comprised of calculator-inactive items.
• Grades 3–8 mathematics assessments will be designed for paper/pencil administrations and may have an online administration option.
If the EOG is 1/3 to ½ calculator-inactive, what are the implications for preparing
students? Discuss at your table.
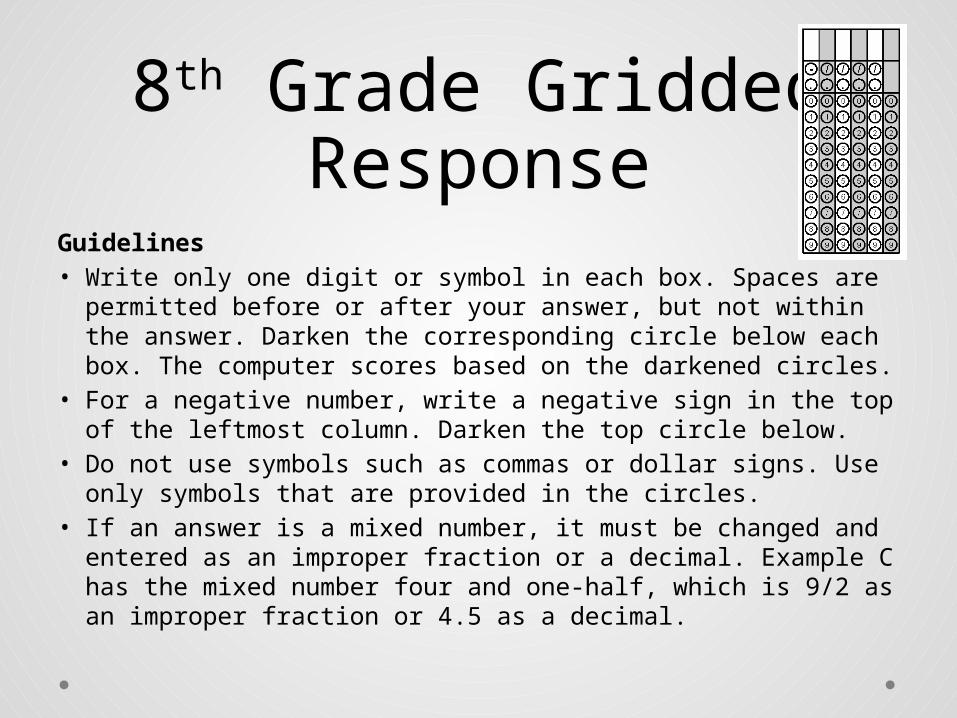
8th Grade Gridded Response
Guidelines• Write only one digit or symbol in each box. Spaces are
permitted before or after your answer, but not within the answer. Darken the corresponding circle below each box. The computer scores based on the darkened circles.
• For a negative number, write a negative sign in the top of the leftmost column. Darken the top circle below.
• Do not use symbols such as commas or dollar signs. Use only symbols that are provided in the circles.
• If an answer is a mixed number, it must be changed and entered as an improper fraction or a decimal. Example C has the mixed number four and one-half, which is 9/2 as an improper fraction or 4.5 as a decimal.

8th Grade Gridded Response

8th Grade Gridded Response
Think-Pair-ShareHow do you plan to integrate gridded response into your
instruction?

Eighth Grade Workshop
Phases of a good CCSS math lesson Engage Explore Explain Elaborate Evaluate• Formative• Summative

Eighth Grade Workshop
8.SP.Investigate patterns of association in bivariate data.
1. Construct and interpret scatter plots for bivariate measurement data to investigate patterns of association between two quantities. Describe patterns such as clustering, outliers, positive or negative association, linear association, and nonlinear association.
2. Know that straight lines are widely used to model relationships between two quantitative variables. For scatter plots that suggest a linear association, informally fit a straight line, and informally assess the model fit by judging the closeness of the data points to the line.

Eighth Grade Workshop
8.SP.Investigate patterns of association in bivariate data.
3. Use the equation of a linear model to solve problems in the context of bivariate measurement data, interpreting the slope and intercept.
For example, in a linear model for a biology experiment, interpret a slope of 1.5 cm/hr as meaning that an additional hour of sunlight each day is associated with an additional 1.5 cm in mature plant height.

Eighth Grade Workshop
8.SP.Investigate patterns of association in bivariate data.
4. Understand that patterns of association can also be seen in bivariate categorical data by displaying frequencies and relative frequencies in a two-way table. Construct and interpret a two-way table summarizing data on two categorical variables collected from the same subjects. Use relative frequencies calculated for rows or columns to describe possible association between the two variables.
For example, collect data from students in your class on whether or not they have a curfew on school nights and whether or not they have assigned chores at home. Is there evidence that those who have a curfew also tend to have chores?

Eighth Grade Unpacking
• Bivariate data refers to two-variable data, one to be graphed on the x-axis and the other on the y-axis. Students represent numerical data on a scatter plot, to examine relationships between variables. They analyze scatter plots to determine if the relationship is linear (positive, negative association or no association) or non-linear.
• Students can use tools such as those at the National Center for Educational Statistics to create a graph or generate data sets. (http://nces.ed.gov/nceskids/createagraph/default.aspx)
• Data can be expressed in years. In these situations it is helpful for the years to be “converted” to 0, 1, 2, etc. For example, the years of 1960, 1970, and 1980 could be represented as 0 (for 1960), 10 (for 1970) and 20 (for 1980).

Eighth Grade Tasks
Student 1 2 3 4 5 6 7 8 9 10
Math 64 50 85 34 56 24 72 63 42 93
Science 68 70 83 33 60 27 74 63 40 96
8.SP.1 Construct and interpret scatter plots for bivariate measurement data to investigate patternsExample 1:Data for 10 students’ Math and Science scores are provided in the chart. Describe the association between the Math and Science scores.

Eighth Grade Tasks
Student 1 2 3 4 5 6 7 8 9 10Math 64 50 85 34 56 24 72 63 42 93Distance from School (miles)
0.5 1.8 1 2.3 3.4 0.2 2.5 1.6 0.8 2.5
8.SP.1 Construct and interpret scatter plots for bivariate measurement data to investigate patternsExample 2:Data for 10 students’ Math scores and the distance they live from school are provided in the table below. Describe the association between the Math scores and the distance they live from school.

Eighth Grade Tasks8.SP.1 Construct and interpret scatter plots for bivariate measurement data to investigate patternsExample 3:Data from a local fast food restaurant is provided showing the number of staff members and the average time for filling an order are provided in the table below. Describe the association between the number of staff and the average time for filling an order.
Number of Staff 3 4 5 6 7 8Average time to fill order (seconds)
56 24 72 63 42 93

Eighth Grade Tasks8.SP.1 Construct and interpret scatter plots for bivariate measurement data to investigate patternsExample 4:The chart below lists the life expectancy in years for people in the United States every five years from 1970 to 2005. What would you expect the life expectancy of a person in the United States to be in 2010, 2015, and 2020 based upon this data? Explain how you determined your values.Date 197
01975
1980
1985
1990
1995
2000
2005
Life Expectancy (in years)
70.8
72.6
73.7
74.7
75.4
75.8
76.8
77.4

Eighth Grade Tasks8.SP.1 Construct and interpret scatter plots for bivariate measurement data to investigate patterns
Example 5
Analyzing Inside Mathematics Performance Task
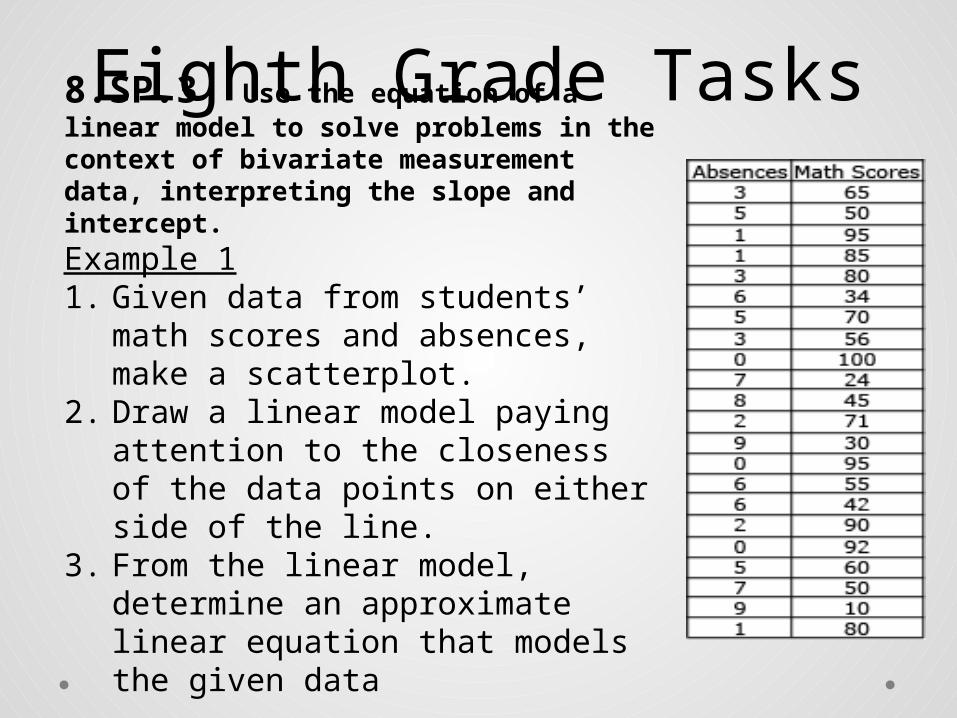
Eighth Grade Tasks8.SP.3 Use the equation of a linear model to solve problems in the context of bivariate measurement data, interpreting the slope and intercept.
Example 11. Given data from students’ math scores and
absences, make a scatterplot.2. Draw a linear model paying attention to
the closeness of the data points on either side of the line.
3. From the linear model, determine an approximate linear equation that models the given data

Eighth Grade Workshop
Renee and Kaley,You will edit this portion of the PowerPoint to include…• bivariate data/two way tables• other resources that I added that you like
and want to include• 90 minute workshop• This includes the time needed to eat

Goals for Lunch and Learn
• Network with teachers from across North Carolina to share resources for implementation of Common Core State Standards.
• Review important NCDPI resources.• Review latest assessment information.• Participate in grade level activities that
support deep understanding of standards.
Lunch and
Learn:
A Collaborative Time for
North Carolina Teachers
Your Presenter Information