Embed Size (px)
Citation preview
Lunar LRO Data to SketchUp Landscape Using LMMP Maps & LODE Data & Excel Modules
For the Big Moon Dig
Tom Riley Beta March 30, 2015 File: BMDLRODatammdddyy.docx Copy write: Tom Riley
1. Purpose
This task is to download scientific data from the LRO lunar mission, then work that data into a friendly form for 3D map surface in Google SketchUp. The data is then saved in formats that can be used for:
• E-Games • 3D Printing • CNC Machine
This document will help you obtain lunar data and convert it into useful lunar landscapes for
use in electronic media. It features the use the Lunar Mapping & Modeling Portal (LMMP) and Lunar Orbital Data Explorer (LODE) to develop landscapes of the Moon based on the Lunar Reconnaissance Orbiter (LRO) data. The raw data is then reduced and formatted for use in Google SketchUp graphics for our games and stories of the Big Moon Dig. Custom Excel VBA Modules and existing SketchUp Ruby Plug-ins do the hard work.
This process is used to insure that the lunar landscapes used on the Big Moon Dig games and stories are as authentic as possible and is based on the latest scientific data.
The Big Moon Dig would like to thank NASA for the use of the LRO lunar data.
1.1. Requirements and Capabilities If you have an Internet browser you will be able to:
1. Review lunar images
BMD 1

2. Download lunar altimeter data
If you have a spread sheet program, like Excel or OpenOffice, then you will be able to:
3. Read in data points 4. Reduce altimeter data to points to a well behaved surface 5. Edit the surface data points in a number of ways 6. Save a surface as a CVS file 7. Assemble blocks of files into a larger area mosaic file.
If you have access to SketchUp Version 13, you will be able to:
8. Read in a CVS file of points 9. Convert the points to a triangulated surface
If you have access to SketchUp any version, you will be able to:
10. Edit the triangulated surface 11. Save the surface in a format for e-games 12. Convert the surface into a printable block 13. Convert the surface into a CNC millable block
If you have access to SketchUp Version 15, you will be able to:
14. Save the block as a 3D printable file 15. Save the blocks as CNC milling files
If you have access to a 3D printer, like MakerBot, you will be able to:
16. Print out the blocks
If you have access to a CNC Router, like CNC Piranha, you will be able to:
17. Mill out the blocks Similar processes could be developed for other graphics editing programs.
2. Process Outline
This process is rather complex and proceeds in a number of discrete steps:
1. Block out the location on a lunar map 2. Draw a layout graphic 3. Download available LRO data as a CVS file 4. Read the CVS file into Excel 5. Strip out unneeded data with a VBA Module 6. Add detailed calculations with a VBA Module
BMD 2
7. Assemble output data with a VBA Module 8. Export formatted data as a CVS file 9. Setup Google SketchUp 10. Read the data into Google SketchUp with a Plug-in 11. Add a triangular mesh with a Plug-in 12. Remove bad data passes 13. Edit the surface in a number of ways including:
a. Build a 3D printable block b. CNC milling block
14. Save finished product
______________________________-
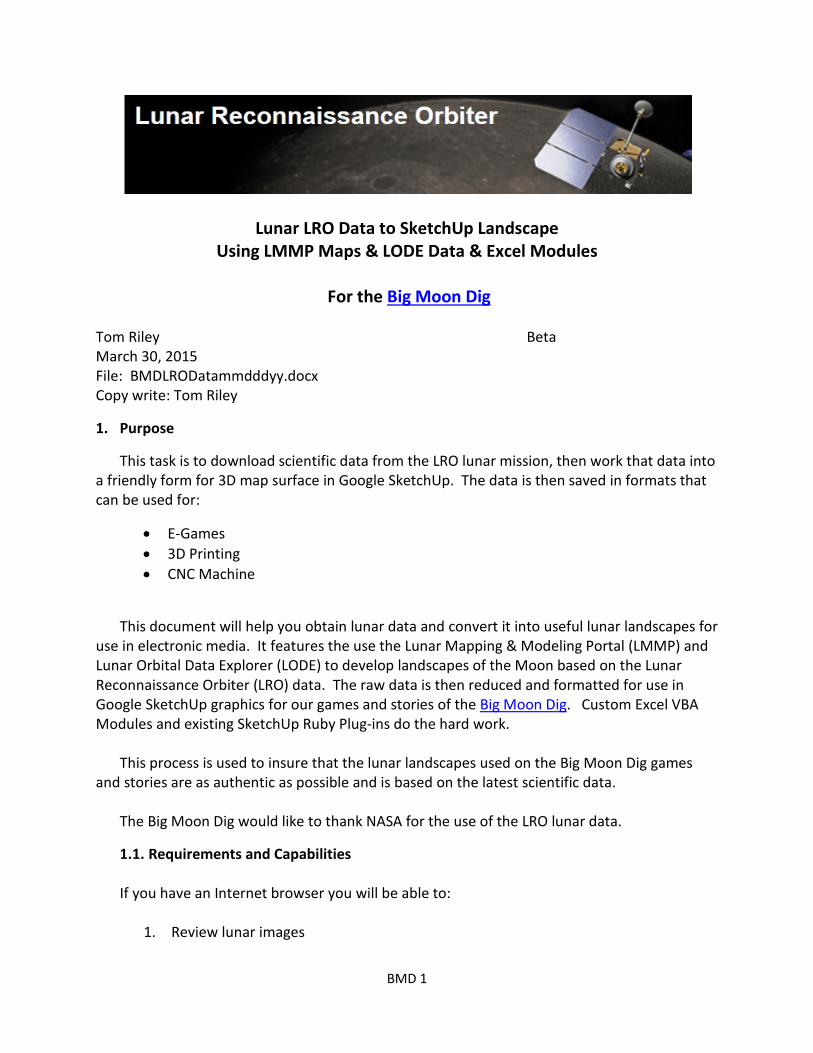
3. Working out the Location with LMMP The first step is to work out the exact latitude and longitudes of the sites of interest. In the
process we will also capture overhead shots of the area.
Lunar Mapper Web Page
3.1. Getting Started with LMMP
BMD 3

Our first task is to review to the available images and scientific data the lunar sites that we are interested in. Some of these sites are locations for possible lunar settlements and others are routes for exploration.
This work can be done with Lunar Mapping & Modeling Portal (LMMP) tool, "Lunar Mapper". This software works through your browser:
Lunar Mapping & Modeling Portal (LMMP) http://pub.lmmp.nasa.gov/LMMPUI/LMMP_CLIENT/LMMP.html# Click on TOOLS and then the Icon for Lunar Mapper.
3.2. Locating Areas of Interest
The task now is to identify the exact location of the areas of interest and record their longitude range and latitude range in degrees and those of a center reference point.
For the examples, we set the image to the South Solar Stereographic Projection, and the
map size to Maximum. We then centered the point of interest on the screen using the mouse and magnified the image as much as possible. We recentered with each step in magnification.
We then noted the latitude and longitude ranges for the area of interest by moving the
mouse and noting the readings on the screen in Map Position (degree). Examples of these area include:
Long to Long Lat to Lat Interest Mt. Malapert Mosaic Malapert Area -5.0 4.0 -85.8 -86.1 Eternal Light Mountain Malapert ref -4.0 -86.0 To Be Determined Carter Haworth Mosaic Haworth Area -10 20 -86.6 -88.20 Water source Haworth ref 34 -85.0 Use other group ref Scott A Massif Scott Area 20 45 -84.7 -86.1 Eternal Light Massif Scott Ref 34 -85.0 Scott A 4
Marius Hills Marius Hills -56.5 -49.0 9.5 17.0 Equatorial and volcanic
BMD 4

Marius Ref TBD TBD Marius Skylight -56.6 -56.0 13.8 14.3 Skylight area Marius Hole -56.37 14.13 Skylight
Latitude and Longitude ranges for areas of interest
For this Web site (and this is different for other sites we use), the 0.0 latitude and 0.0 longitude is the point on the Moon's equator on a line with the center of the Earth. The number for this Web page run minus -180 (West) to Plus 180 (East) degrees in Latitude and plus (North) to minus (South) 90 degrees in Longitude. Minus longitude numbers are West of 0.0 meridian (imagine a map of the USA). Minus latitude numbers are South of the Equator.
Note that the centering feature works well in the equatorial views but does not work in
the polar view mode. To save an image, work with the Lunar Mapper to generate good views with the study
area and set the scale as large as allows the full area to be seen. Then move the mouse cursor around the image and work out the exact latitude and longitude you want for a rectangular area of study. Note the maximum and minimum latitude and longitude of interest to define a box. Also note that the location of the cursor is given in meters at the bottom of the screen and you can use this feature to estimate the size of the area of study.
Use the menu bar --> Layers feature to over lay other data sets on the image. The Add
LRO Other, [_] LRO Diviner Surface Temp feature is particularly good for showing dark craters. This is a thermal mapping that allows you to work out boxes for dark craters.
When you have a useful image displayed used the Ctrl-PrtScn Key to capture an image of
the screen to the clip-board. Open a graphics program, such as Windows Paint, display the clipboard, and box in the area of interest on the image. Crop the image and save it in either the .jpg or .tiff formats.
Make a rough sketch of your area of interest and reference points. We will add more
detail to this drawing in the next several steps.
BMD 5
4. Start a Layout Drawing
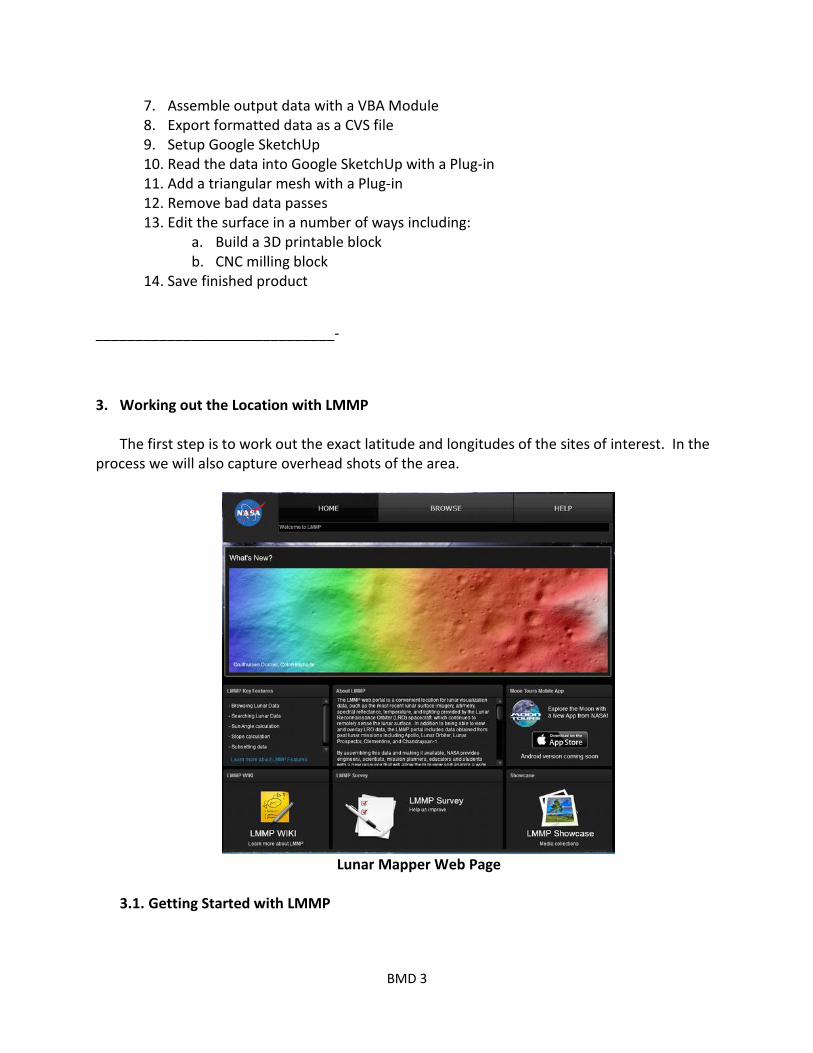
We now need to divide the area of interest into blocks of a size we can handle in a reasonable amount of time. The larger the area the more data you will have to deal with especially near the poles where many orbital passes converge. In our experience blocks with more than 700,000 points can hang up or take too long to process.
We therefore need to divide the area of interest into a mosaic of blocks none of which
have more than 700,000 lines of Excel (OpenOffice is limited to 64,000 lines). The great majority of these lines will be eliminated as questionable points. Normally we end up with 12,000 to 45,000 actual verified data points for polar locations but many fewer for equatorial areas.
Later on the much reduced files can be reassembled into larger blocks if desired. To
allow this, all the blocks must use the same reference point. Note that one degree of longitude on the Moon is always 30.3 km (18.8 miles). Degrees
of latitude vary in length with longitude {d = 30.3 * Cos (Longitude) in km}. Adjusting these numbers is equivalent to flatten the surface of a large sphere onto a flat surface. The reference latitude and longitude are used for this adjustment and there is some resulting distortion of the image.
BMD 6
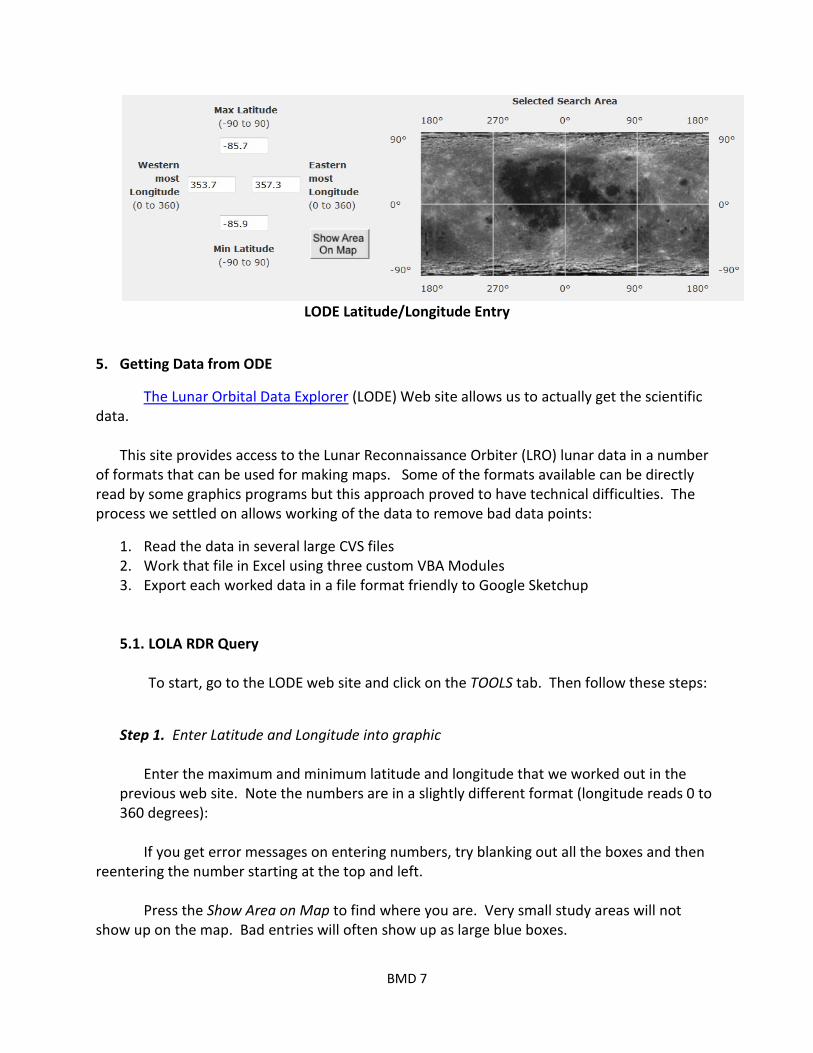
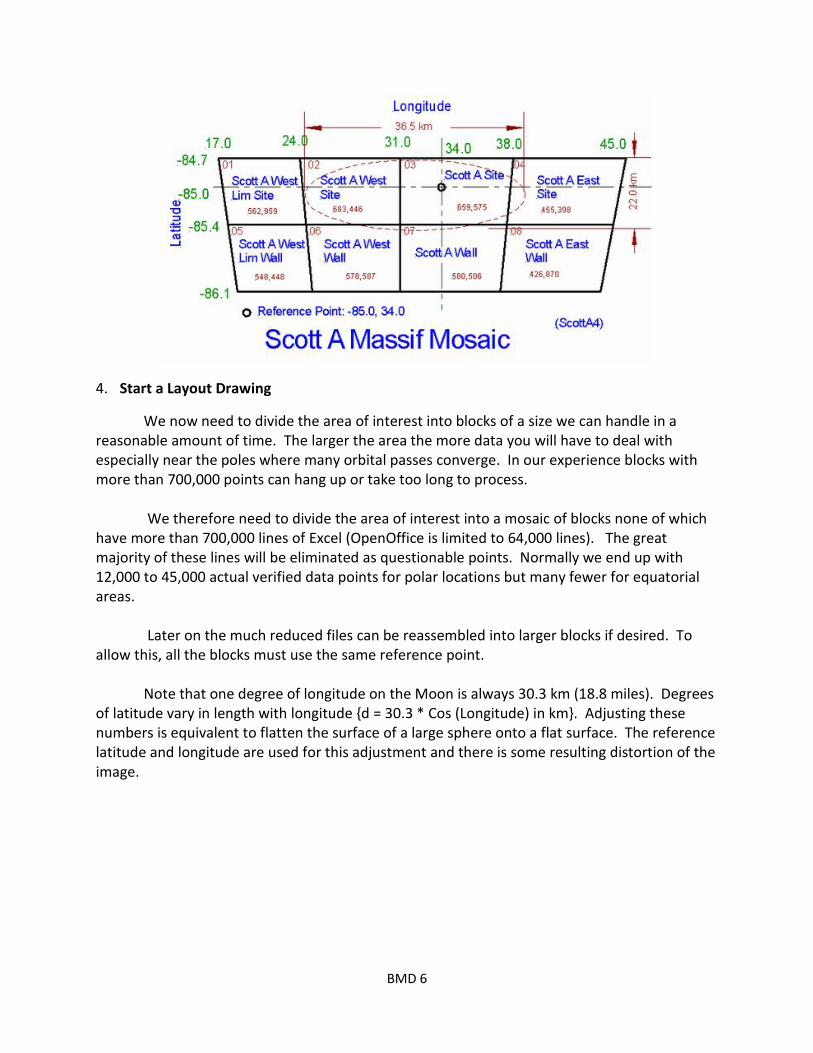
LODE Latitude/Longitude Entry
5. Getting Data from ODE
The Lunar Orbital Data Explorer (LODE) Web site allows us to actually get the scientific data.
This site provides access to the Lunar Reconnaissance Orbiter (LRO) lunar data in a number of formats that can be used for making maps. Some of the formats available can be directly read by some graphics programs but this approach proved to have technical difficulties. The process we settled on allows working of the data to remove bad data points:
1. Read the data in several large CVS files 2. Work that file in Excel using three custom VBA Modules 3. Export each worked data in a file format friendly to Google Sketchup
5.1. LOLA RDR Query
To start, go to the LODE web site and click on the TOOLS tab. Then follow these steps:
Step 1. Enter Latitude and Longitude into graphic Enter the maximum and minimum latitude and longitude that we worked out in the
previous web site. Note the numbers are in a slightly different format (longitude reads 0 to 360 degrees):
If you get error messages on entering numbers, try blanking out all the boxes and then
reentering the number starting at the top and left.
Press the Show Area on Map to find where you are. Very small study areas will not show up on the map. Bad entries will often show up as large blue boxes.
BMD 7

Step 2. Set Additional Filter Parameters (Optional) No action needed in this bock. Step 3. Preview Results Count Press [Query Count] to get an idea of the number of data points available in the defined
area. This will take a minute or two for a large area. Note the number of data points available for your study area. These large files contain
a substantial amount of data you do not need and quite a bit of bad data. We have found that the maximum number of data points that can be provided without danger of hanging up a Windows system is about 700,000. Give this program a maximum of ten of minutes, but if the count query hangs, try a smaller area.
If your area of interest is too big, try dividing it into a mosaic grid. The Scott A Massif
Mosaic shown above ended up with eight blocks none of which exceeded 690,000 points Near polar areas also have a very large number of LRO data passes and therefore
generate very large files. Most of the reduction steps take only a few minutes, but two steps (removing duplicate points, triangulation of points) can take tens of minutes for large files.
Step 4. Request Results
CSV Format [Generate Files] -- Press this button and wait for the files to be generated. CSV is a comma delimited text format that can be read by an Excel Spread sheet. Download specifically the third file down in the list entitled: RDR(long number) _FramePerRow_csv_table.csv. This can take several minutes depending on your system link speed.
Note that there a number of other file formats available. We do not now use them but list
then for possible use under Future Work below.
Save all Files: Save all the files you just downloaded by moving then from the down load folder to a specific project folder. Simplifying the names of the files helps. These can be large files.
6. Complete the Layout Drawing
BMD 8
Now go back and complete your layout drawing (see Scott A Massif diagram above). Show how you have divided up the area of interest. Number each block. Note the limits of latitude and longitude. Note reference latitude and longitude for the entire group. Add the number of raw data lines for each block. All this information will be needed later.
Note also that the process of flattening the blocks turns them into a keystone shape with
the short end toward the pole and centered on the reference point.
7. Setup Folders
Make a main folder for this run with a name like Malapert5.
Make up the following subfolders:
• nameRawData • nameXLSM • nameCVS • nameSU13 • nameSU15 • nameSTL
Move the raw data to the appropriate folder and reduce the length of the file names. RDR(long number) _FramePerRow_csv_table.csv Becomes: RDR(long number)M601.csv
______________-
BMD 9
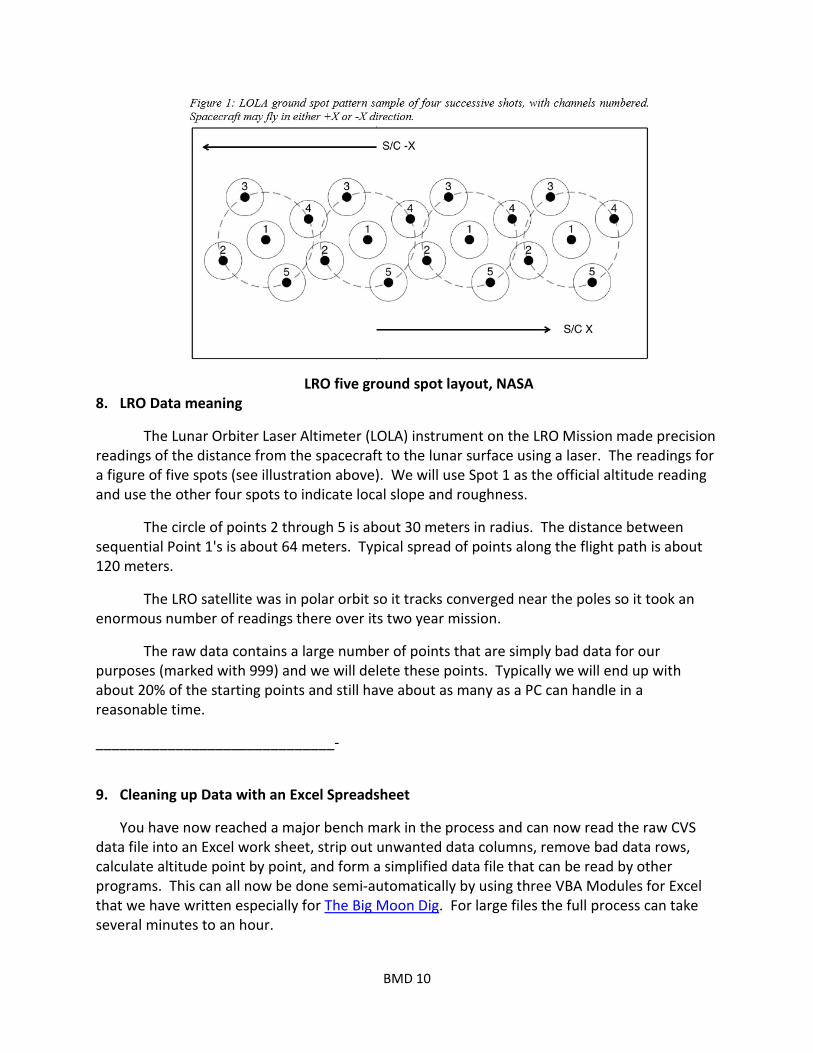
LRO five ground spot layout, NASA 8. LRO Data meaning
The Lunar Orbiter Laser Altimeter (LOLA) instrument on the LRO Mission made precision readings of the distance from the spacecraft to the lunar surface using a laser. The readings for a figure of five spots (see illustration above). We will use Spot 1 as the official altitude reading and use the other four spots to indicate local slope and roughness.
The circle of points 2 through 5 is about 30 meters in radius. The distance between sequential Point 1's is about 64 meters. Typical spread of points along the flight path is about 120 meters.
The LRO satellite was in polar orbit so it tracks converged near the poles so it took an enormous number of readings there over its two year mission.
The raw data contains a large number of points that are simply bad data for our purposes (marked with 999) and we will delete these points. Typically we will end up with about 20% of the starting points and still have about as many as a PC can handle in a reasonable time.
______________________________-
9. Cleaning up Data with an Excel Spreadsheet
You have now reached a major bench mark in the process and can now read the raw CVS data file into an Excel work sheet, strip out unwanted data columns, remove bad data rows, calculate altitude point by point, and form a simplified data file that can be read by other programs. This can all now be done semi-automatically by using three VBA Modules for Excel that we have written especially for The Big Moon Dig. For large files the full process can take several minutes to an hour.
BMD 10

9.1. Setting up
To use VBA Modules in Excel on a Windows system, you must accomplish two steps:
1. Make Developer tab visible -- Right click on ribbon at top of Excel. Choose
Customize Quick Access Tool Bar. Choose Popular. Check the box Show Developer tab in the Ribbon.
2. Enable micros on your machine -- Click on the four frames in a circle in the upper right hand of Excel. Select Trust Center. Click on Trust Center Settings in the lower right hand corner. The on Macro Settings. Now move the radio button in the top section to Enable all macros (not recommended; potentially dangerous code can run). Clearly when you are finished with your micro work, you would be well advised to put this radio button back where it was, which is usually Disable all macros with notification.
9.2. Download the Modules and save them
Go to the Big Moon Dig Web site, Why & What where you got this document. Down load the file small Excel file. This is a relatively small sized file that also contains the six VBA Modules. Go to the Visual Basic tab a look for Developer and then click on the Visual Basic icon. This will open up the Visual Basic Editor. Find the Project-VBAProject window and click on + Modules. This will show the three Visual Basic Modules:
1. LRODataVnn.bas – Removes unused and bad data 2. LROSlopeCalVnn.bas – Converts latitude and longitude to meters, calculates altitude
and slope. 3. LROPoints3DVnn.bas – Removes bad strings of data and points on top of each other.
Formats output file. 4. LROCratersVmm.bas – Adds simulated craters to terrain (not now commonly used). 5. LROPrintBotVnn.bas – Makes a file that can be father processed for a 3D printer or
CNC machine. 6. LROMakeBotMosaicVnn.bas – Assembles Sheet03 from up to eight blocks into on
larger mosaic.
Go to File tab and Export each of these .bas programs to a designated folder on your machine. Each of these programs has gone through a number of versions in development.
9.3. Read the CVS Data File
BMD 11
Open Excel and read one large raw data CVS file you saved earlier. Most spreadsheet software should be able to read this file and run the visual basic modules but may be limited in the size of files it can handle.
9.4. Import the VBE Models
Go to Developer, Visual Basic on the Excel sheet top tab bar. Click on File, Import File and find the VBA Modules you just saved. Select and import:
1. LROData 2. LROSlopeCal 3. LROPoints Each of these will have been worked through several versions.
9.5. Remove unneeded data and save as .slxm file
The first routine, LROData, removes the unneeded columns and any data with bad data markers (999). This greatly reduces the size of the file. All the good data points are then written to Sheet1.
Enter Ctrl-G to bring up the Immediate window. Position this window up and out of the way so that you can see it even when other windows open and close. Also reduce the size of the main Excel window and the Visual Basic windows so that they do not completely block each other. Depending on how well the run goes you may either need to see a pop-up screen in the middle of the Excel window, which does not come to the front, or get to the Run tab in the Visual Basic window. Go to the bottom of the Excel sheet and click on the tab to create six more empty sheets: Sheet1, Sheet2, Sheet3, Sheet4, Sheet5, and Sheet6. We will be using Sheets1 for the main data file. Sheet2 will contain worked data. Sheet3 is the basic output file. Sheet4, Sheet5, and Sheet6 are specialty output files.
Be sure that you end up with the first named file sheet selected. (If you omit this step you will get an error message when you run the first Module.) Now start by double clicking on Modules, LROData. This will bring up the code in the window. Now click on the small green Run Arrow to start the Module running. Click on Yes, to keep the Module running. This Module can take several minutes on large files. Note the progress being ticked off in the Immediate Window. When the action is complete a notice will appear. Check to see that there is a copy of all the good data points now on Sheet1. The number of good data rows is usually about 20% of the number of raw data rows.
BMD 12
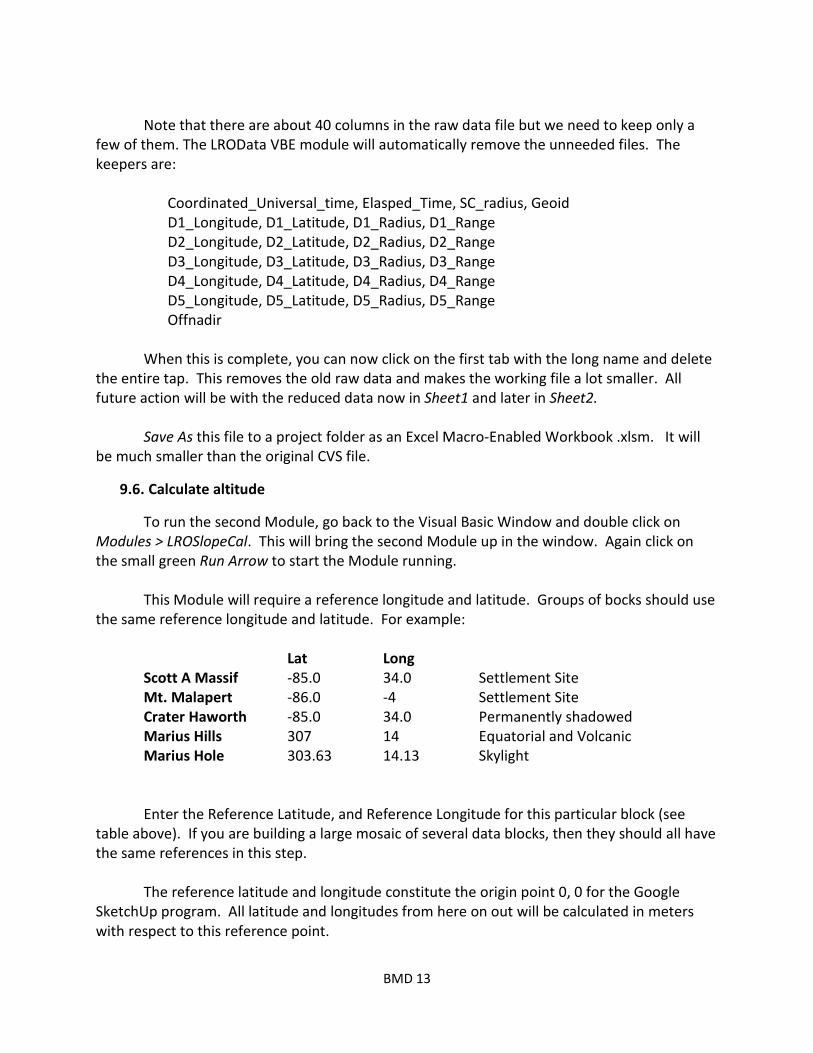
Note that there are about 40 columns in the raw data file but we need to keep only a few of them. The LROData VBE module will automatically remove the unneeded files. The keepers are:
Coordinated_Universal_time, Elasped_Time, SC_radius, Geoid D1_Longitude, D1_Latitude, D1_Radius, D1_Range D2_Longitude, D2_Latitude, D2_Radius, D2_Range D3_Longitude, D3_Latitude, D3_Radius, D3_Range D4_Longitude, D4_Latitude, D4_Radius, D4_Range D5_Longitude, D5_Latitude, D5_Radius, D5_Range Offnadir
When this is complete, you can now click on the first tab with the long name and delete the entire tap. This removes the old raw data and makes the working file a lot smaller. All future action will be with the reduced data now in Sheet1 and later in Sheet2. Save As this file to a project folder as an Excel Macro-Enabled Workbook .xlsm. It will be much smaller than the original CVS file.
9.6. Calculate altitude
To run the second Module, go back to the Visual Basic Window and double click on Modules > LROSlopeCal. This will bring the second Module up in the window. Again click on the small green Run Arrow to start the Module running. This Module will require a reference longitude and latitude. Groups of bocks should use the same reference longitude and latitude. For example:
Lat Long Scott A Massif -85.0 34.0 Settlement Site Mt. Malapert -86.0 -4 Settlement Site Crater Haworth -85.0 34.0 Permanently shadowed Marius Hills 307 14 Equatorial and Volcanic Marius Hole 303.63 14.13 Skylight
Enter the Reference Latitude, and Reference Longitude for this particular block (see table above). If you are building a large mosaic of several data blocks, then they should all have the same references in this step. The reference latitude and longitude constitute the origin point 0, 0 for the Google SketchUp program. All latitude and longitudes from here on out will be calculated in meters with respect to this reference point.
BMD 13
The software contains an internal reference of 49 degrees for the Maximum Slope. Lunar regolith will not stand at a steep angle for long periods of time. Over time small meteor strikes erode any steep clefts and reduce them to slopes of ground rock. Steep rock faces are very rare on the Moon. It is therefore safe to assume that any very steep slope is simply a bad data point and so are not copied to Sheet2. A small number, 0.001, is placed in the slope formula to prevent divide by zero errors. The LROSlopeCal can take several minutes to run and the progress is shown in the Immediate window. There is a completion note at the end. When it is done, check the right side of Sheet2 to see the calculation of the latitude, longitude, and altitude for each of LRO five spots. The slope calculated from Spot 1 to each of the other four spots, which are about 30 meters apart, and the largest value is taken as representative of the whole spot. This is good information as it indicates how difficult a spot will be to land on, build on, or even drive over. Add the block name and number to Sheet1, D1. In the top 10 rows of Sheet2, you can also find information about the input numbers, and the range covered by the data. Feel free to add any identifying labels in the first or second rows. Save the file as .xlsm so that the Visual Basic programs will be included. Be sure that the save action is complete before taking any farther steps. You should be able to select squares on the sheet when it is done. __________________-
10. Test for Bad Passes
Most of the data points are good at this point but a few instrument passes, strings of data points, may be clearly out of calibration. In the next step we will identify this bad passes so we can remove them.
10.1. Run LROPoints, No To run the third Module, go back to the Visual Basic Window and double click on
Modules > LROPoints. Run this module but be very careful to answer “No” to the question about removing duplicate points.
With the “No” this module will only take a couple minutes to run. Later we will use the
“yes” feature which can take much longer.
BMD 14
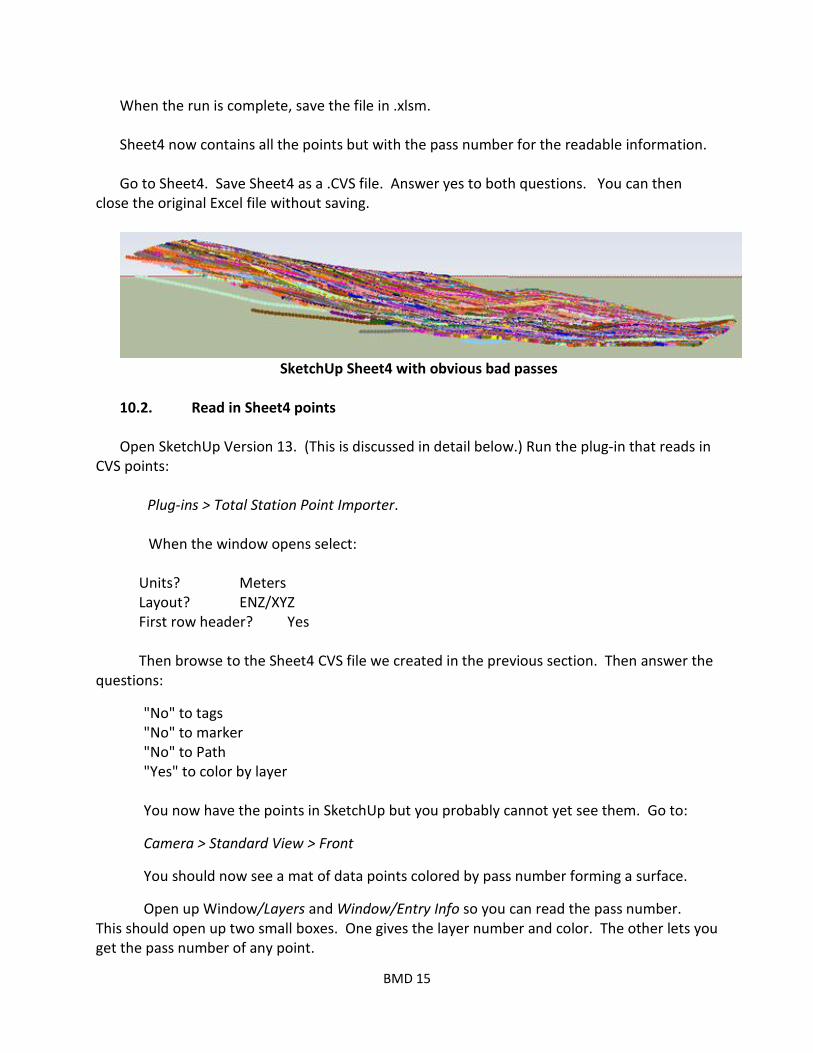
When the run is complete, save the file in .xlsm. Sheet4 now contains all the points but with the pass number for the readable information. Go to Sheet4. Save Sheet4 as a .CVS file. Answer yes to both questions. You can then
close the original Excel file without saving.
SketchUp Sheet4 with obvious bad passes
10.2. Read in Sheet4 points Open SketchUp Version 13. (This is discussed in detail below.) Run the plug-in that reads in
CVS points: Plug-ins > Total Station Point Importer.
When the window opens select:
Units? Meters Layout? ENZ/XYZ First row header? Yes Then browse to the Sheet4 CVS file we created in the previous section. Then answer the
questions:
"No" to tags "No" to marker "No" to Path "Yes" to color by layer You now have the points in SketchUp but you probably cannot yet see them. Go to:
Camera > Standard View > Front
You should now see a mat of data points colored by pass number forming a surface.
Open up Window/Layers and Window/Entry Info so you can read the pass number. This should open up two small boxes. One gives the layer number and color. The other lets you get the pass number of any point.
BMD 15

Right Click on the mass of points and select Edit Components. This will let you get information for individual points.
Review the surface of points. Look for strings of points that are obviously away from the surface. Some may be high. Some may be low. On a good block there will not be any at all. On a bad block there may be eight.
Click on one point in each bad line and read the pass number from the Entry Info box. Make a written list.
Rotate the surface around and look at it from several angles just to be sure.
10.3. Record bad passes
Open the .xlsm spread sheet again and find Bad Pass on Sheet2, A3. Enter the bad pass numbers you just recorded into line 3 starting with D3. You may keep or overwrite the 0.
Enter the total bad passes in Sheet2, B3.
The next time you run Modules > LROPoints, these entire passes will be removed.
Save the .xlsm file.
10.4. Repeat Check
You may want to repeat this Sheet4 process to be sure you have gotten all the bad passes out.
You can also run the triangulate feature as the bad points really stick out when triangulated. To read a data point after triangulation, you have to unclick the triangles layer in the Layers box.
_______________-
11. Remove Duplicate Points
When you are happy that you have removed all the bad passes. Reopen the .xlsm file
Consider turning off your Internet connection and any other programs that generate interrupts (such as Smart Firewall). The next run for tens of minutes and can be spoiled by the wrong interrupt.
Now run Modules > LROPoints, and answer Yes. This will first remove the bad passes and then start the process of removing duplicate points. The latest software versions have enormously speeded up this process.
Many of the passes cross each other. If the calibrations is off even a few meters, then the close points can show sharp slopes that simply are not there. In bad cases these can even bomb the triangulation calculations. This module will look for any points within 100 meters of
BMD 16
each other, take an average for one and remove the other. This will remove up to 15% of the points and make the surface much easier to generate.
Allow the computer to run undisturbed for and watch the immediate window for progress. The software count up while giving the time for 100 points in minutes along with the elapsed time. Time steps over one minute indicate the program will run for hours. When you reach have way by the numbers, you will be 75% of the way by time. Once the time step gets below 0.1 minute, the end is near.
When the software completes, save the .xlsm file. Save it again just to be sure and take your time. These saves may take several minutes.
Review that you have a good Sheet3 and look at the number of lines in it.
Go to Sheet3 and same it as a CVS file. Sheet3 gives the points and their slopes.
Close the file without saving.
12. Making a full Block If you want a 3D block with sides and a bottom, for example for CNC or 3D printing, you will need to run: 1. LROPrintBotVnn.bas – Makes a file that can be father processed for a 3D printer.
Or, 2. LROMakeBotMosaicVnn.bas – Assembles Sheet03 from up to eight blocks into on larger
mosaic.
Save the complete .xlsm file. Go to Sheet6 and same it as a CVS file. Sheet6 gives the points and their slopes and has
added points to turn the surface into a block.
Close the main file without saving.
_____________________________-
13. Make a Basic Lunar Surface in SketchUp
You have now achieved a major benchmark in the process. You can now read in the LRO data into SketchUp and use it in 3D drawings by using standard Ruby plug-ins. You can then use this process to make a number of refinements to the surface.
BMD 17

13.1. Getting the Ruby routines
(Unfortunately these Ruby routines only work in Google SketchUp 13. We need to find routines that work in SketchUp 15 or upgrade these plug-ins.)
Two Ruby Plug-ins for Google SketchUp are needed for this work: 1. "Total Station Point Importer" by CMD (Ruby Plug-in)
This plug-in lets you read in the CVS file we created with Excel and display it as a sheet of points in a group.
The download produces a zipped folder with the extension .ribs. SketchUp has an automated process for loading this form of file. However, this folder can be opened with whatever program your use that opens .zip files. It may be simplest to change the extension to .zip and then open the folder. The open folder contains one program with an .rb extension and a folder. Copy both these to the Sketchup/Plugins folder on your computer.
2. "Points cloud triangulation" C. Fale, D. Bur (Ruby Plug-in) This plug-in converts a cloud of points into a triangulated surface grid. Download both the program and it required supporting program. This produces two files with Ruby .rb extension, but does not have an auto loading zip file. Copy both these files to the SketchUp/Plugins folder on your computer.
13.2. Reading in the Sheet3 CVS file
If you have placed the Ruby Plug-in files in the correct directory, when you reboot SketchUp, (sometimes you need to reboot Windows too) you should now have an entry in the top ribbon, Plug-Ins. Click on this tab and select: Plug-ins > Total Station Point Importer.
When the window opens select:
Units? Meters Layout? ENZ/XYZ First row header? Yes Then browse to the Sheet3 CVS file we created in the previous section. Large files will
take a minute or two to load. Then answer the questions:
BMD 18
"No" to tags "No" to marker "No" to Path "Yes" to color by layer You now have the points in SketchUp but you probably cannot yet see them. Go to:
Camera > Standard View > Front
This process can take a minute or two for large files. Save the file in the nameSU13 folder with the block name.
13.3. Making a grid
The gridding process only takes about ½ hour for small files but can run for a very long time for large files and mosaics. The process can be hung up by external interrupts. Be sure that you can let the machine run for up to 2 hours for large files.
Turn off all other programs that might interrupt progress, like e-mail. Click on the Internet control icon in the lower left corner and turn off the Internet connection.
This program starts off fast but makes two passes and slows down at the end. You can judge the progress by watching the numbers in the lower left.
Select the component you just make for editing with: Edit > Component > Edit Components
Now select all the points inside the component. Selecting the component is not enough, you must select the points inside the component. If you are making a block with a bottom and sides, do not select the bottom four points that make the bottom but do select the four rows of points along the sides.
Select the gridding plug-in:
Plug-ins > Cloud point triangulation. Accept putting the triangles in a layer called Triangles.
The gridding program will now run for 10 to 45 minutes for normal sized files but can run for hours for 50k files. You can watch progress in the lower left-hand corner as the program runs through all the points several times.
BMD 19

Save the SketchUpV13 file. Reboot your computer to turn back on anything you turned off.
13.4. Open in SketchUp V15 After rebooting, open the file with SketchUp Version 15. Save the file into the
SketchUpV15 directory with the name addition V15. This file will no longer be readable by Version 13.
13.5. Editing the Surface
The finished grid can be edited to remove obviously high or low points and then fix the triangles. This is a slow manual process.
Inspect the grid surface to see if there are any very high or low points. You can rotate the grad around until you frame the bad points against the sky.
To remove an unwanted pointy hill, select the entire grid and go to:
Edit > Edit Group
Erase Icon
Carefully place the little circle on the Erase Icon directly over the point or line you wish to ease and left click. This will select both the point or line and the surrounding triangles leaving a hole.
This will punch an obvious hole in the grid. Now use the Pencil icon to draw lines between the points around the edge of the hole to make new triangles. You must be exactly on existing points and you cannot cross lines. When you have a new triangle the skin will fill in automatically. If the new triangle does not appear, look carefully to see if you missed a point.
If you find long strings of very high or low points, then you have missed a bad pass and have to go back several steps.
Save your SketchUp V15 file.
13.6. Completing the Skirt
If you are making a three dimension block, and not just a surface, you will need to complete the sides and bottom. This will take three editing passes along the four sides:
1. Complete edge triangles – Draw lines with the Pencil Icon to complete any missing triangles along the edge. Sometimes it will take to lines to make two triangles. Also draw lines from the four low corner points up to the surface to make sets of two or three triangles to define the corners.
BMD 20
2. Complete the Bottom – Draw in lines compete the bottom and the lower four edges. Draw enough lines to make large triangles.
3. Clean up the edge – Go around the edge looking for sharp indentations. These are hard to build in 3D. Erase one or two lines coming up the side into such indentations and then draw lines across the top redefining a few large side triangles and smaller top surface triangles.
4. Inspect for holes – Sometimes you can miss drawing a line while editing. Turn the surface different ways and look for holes. You may have to erase and redraw a line or two to patch a hole.
13.7. Layer Meaning
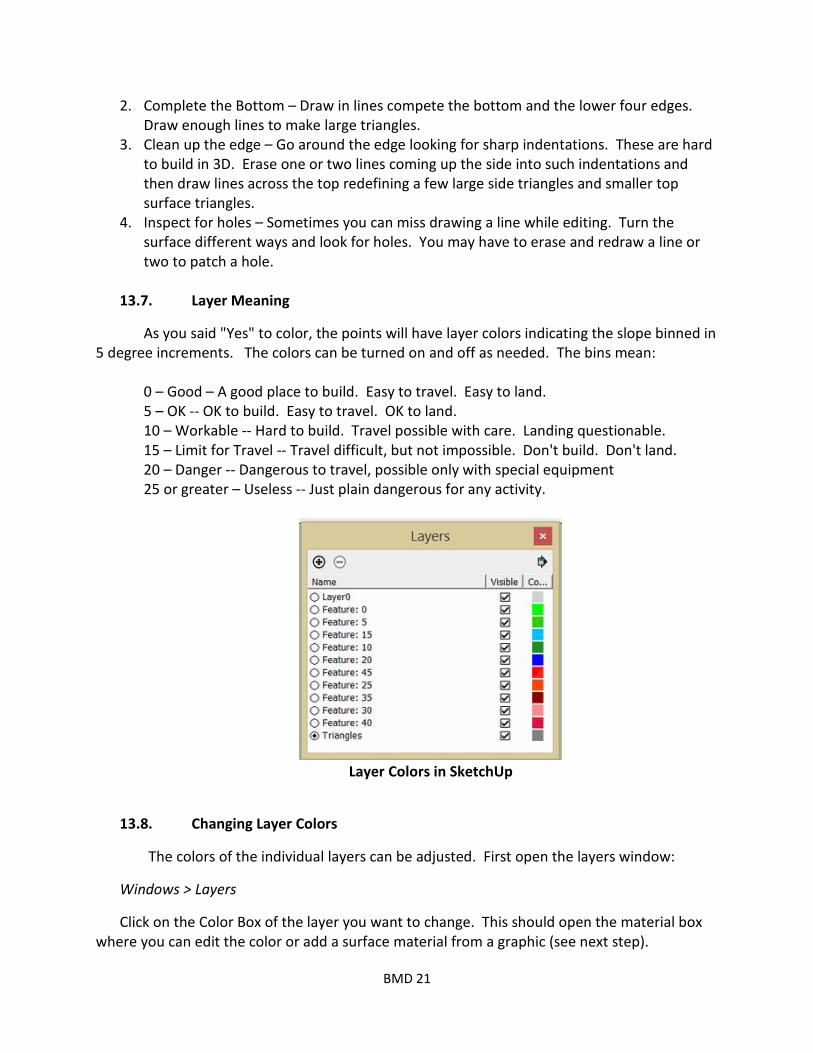
As you said "Yes" to color, the points will have layer colors indicating the slope binned in 5 degree increments. The colors can be turned on and off as needed. The bins mean:
0 – Good – A good place to build. Easy to travel. Easy to land. 5 – OK -- OK to build. Easy to travel. OK to land. 10 – Workable -- Hard to build. Travel possible with care. Landing questionable. 15 – Limit for Travel -- Travel difficult, but not impossible. Don't build. Don't land. 20 – Danger -- Dangerous to travel, possible only with special equipment 25 or greater – Useless -- Just plain dangerous for any activity.
Layer Colors in SketchUp
13.8. Changing Layer Colors
The colors of the individual layers can be adjusted. First open the layers window:
Windows > Layers
Click on the Color Box of the layer you want to change. This should open the material box where you can edit the color or add a surface material from a graphic (see next step).
BMD 21
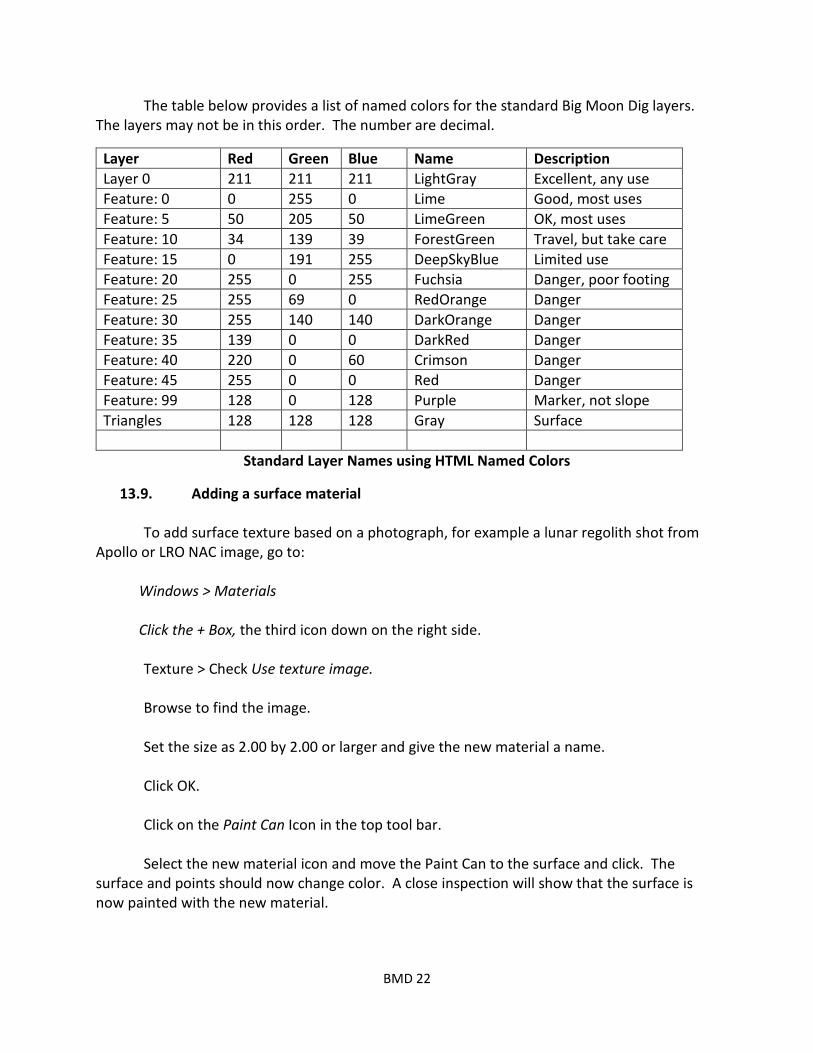
The table below provides a list of named colors for the standard Big Moon Dig layers. The layers may not be in this order. The number are decimal.
Layer Red Green Blue Name Description Layer 0 211 211 211 LightGray Excellent, any use Feature: 0 0 255 0 Lime Good, most uses Feature: 5 50 205 50 LimeGreen OK, most uses Feature: 10 34 139 39 ForestGreen Travel, but take care Feature: 15 0 191 255 DeepSkyBlue Limited use Feature: 20 255 0 255 Fuchsia Danger, poor footing Feature: 25 255 69 0 RedOrange Danger Feature: 30 255 140 140 DarkOrange Danger Feature: 35 139 0 0 DarkRed Danger Feature: 40 220 0 60 Crimson Danger Feature: 45 255 0 0 Red Danger Feature: 99 128 0 128 Purple Marker, not slope Triangles 128 128 128 Gray Surface
Standard Layer Names using HTML Named Colors
13.9. Adding a surface material
To add surface texture based on a photograph, for example a lunar regolith shot from Apollo or LRO NAC image, go to:
Windows > Materials
Click the + Box, the third icon down on the right side.
Texture > Check Use texture image. Browse to find the image. Set the size as 2.00 by 2.00 or larger and give the new material a name. Click OK. Click on the Paint Can Icon in the top tool bar. Select the new material icon and move the Paint Can to the surface and click. The surface and points should now change color. A close inspection will show that the surface is now painted with the new material.
BMD 22

If you do not want to see the points, now black dots, you can go through the Layers window and uncheck any or all of the slope bin layers.
Save the SketchUp file.
Congratulations, you now have a section of lunar surface, based on real science data that you can use in most graphics programs.
______________________________-
14. Advanced Surface Techniques
You have now reach a major benchmark in this process and can take a number of actions depending on what you need. Each of these actions is detailed in a sub-section below:
1. Add Craters – This action adds small craters to area that are read as rough. This process is now obsolete and is being replaced by painting with actual LRO NAC images.
2. Assembling a Mosaic – You can now assemble the smaller block files back into a large file.
3. 3D Printer – This process produces a file that can be read by a 3D printer. 4. CNC Milling Machine – Very like 3D printing only milling from wood.
Specific CVS files can be saved for each of these processes.
14.1. Add Craters
When you have the surface exactly how you want it, you can run the Craters Module to add typical craters. This action is optional and is now considered obsolete. A much better approach is now becoming available by low loading actually images from the LRO Narrow Angle Camera. The random craters added are less than 60 meters in diameter and would only show up as roughness in the LRO Data. They add interest to the otherwise overly smoothed surface.
The fraction of points getting craters can be set and only craters with less than 15 degrees are allowed to have craters. The craters are drawn in three rings of new points around an existing point. All point locations and altitudes are slightly randomized to create a fractal effect. The outer ring is tipped slightly along the north/south axis to better fit into slopes.
14.2. Assembling a Mosaic
If you want to end up with one large mosaic you can do this with a special VBE module LROMakeBotMosaic.bas . You need all the blocks of data referenced to one reference point. Open a new Excel file and add 10 sheets. Copy the basic information required in the text at the start of the module onto Sheet1. Most of this is on Sheet1 of each of the blocks. This includes the Reference Longitude and mosaic Reference Latitude (typically the reference for the main site) in the slope generation routine, and LROSlopeCal.
BMD 23
You will need the most northern latitude, most southern latitude, most eastern longitude, and most western longitude for the entire mosaic.
Then cut and paste the entire Sheet3 from each block run into one of the pages of the new file. Block 01 to Sheet2 etc..
Run the LROMakeBotMoasic module to generate a full block with lower points. The module contains a bottom off set number, nominally -4000 m, to insure that the points do not go below zero.
The program can save every second or fourth data point to reduce the size of the final file. This saves a lot of time and the 3D printing and CNC processes cannot handle more detail than this.
Save the file and then save Sheet10 as a CVS file.
Read the CVS file with the SketchUp V13 modules. Triangulating this large file in SketchUp can take several hours if there are than 20,000 points.
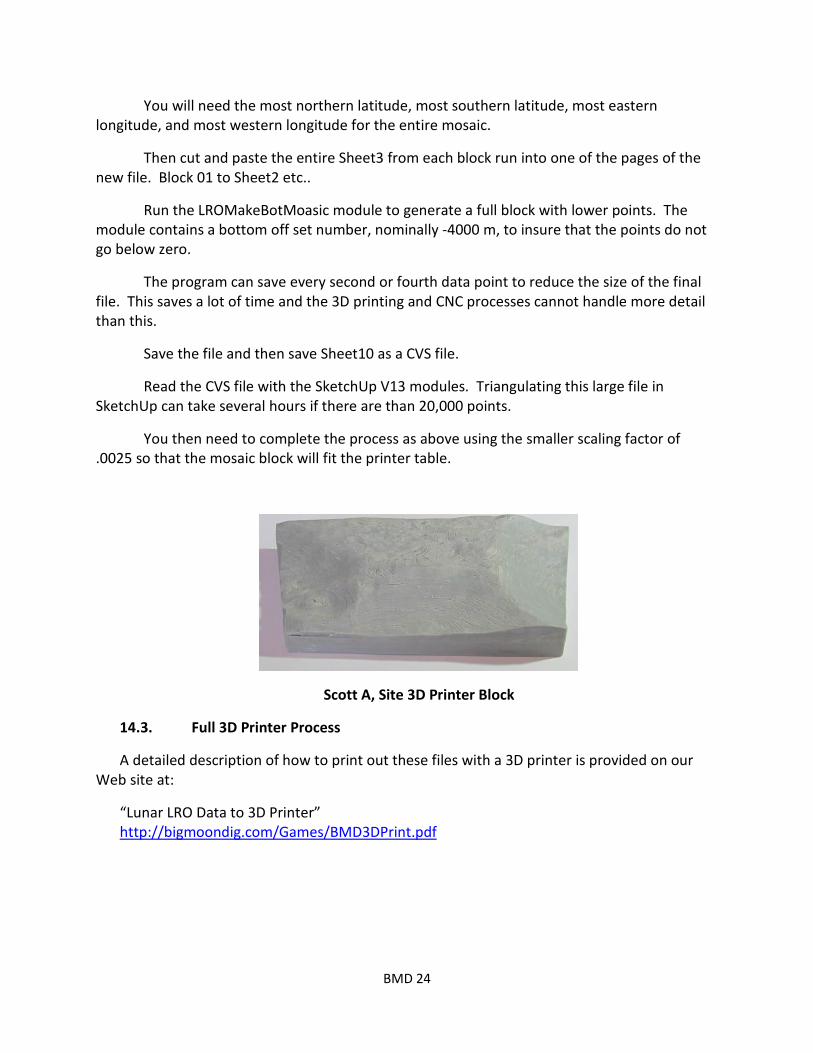
You then need to complete the process as above using the smaller scaling factor of .0025 so that the mosaic block will fit the printer table.
Scott A, Site 3D Printer Block
14.3. Full 3D Printer Process
A detailed description of how to print out these files with a 3D printer is provided on our Web site at:
“Lunar LRO Data to 3D Printer” http://bigmoondig.com/Games/BMD3DPrint.pdf
BMD 24
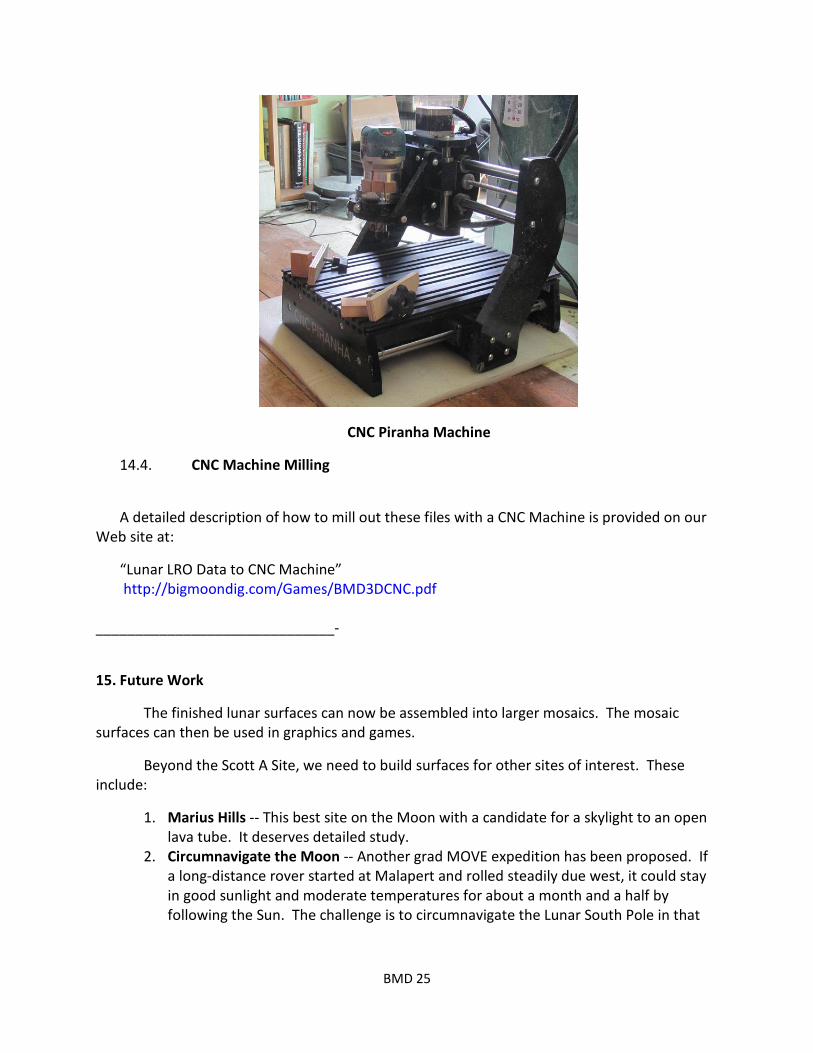
CNC Piranha Machine
14.4. CNC Machine Milling
A detailed description of how to mill out these files with a CNC Machine is provided on our Web site at:
“Lunar LRO Data to CNC Machine” http://bigmoondig.com/Games/BMD3DCNC.pdf
______________________________-
15. Future Work
The finished lunar surfaces can now be assembled into larger mosaics. The mosaic surfaces can then be used in graphics and games.
Beyond the Scott A Site, we need to build surfaces for other sites of interest. These include:
1. Marius Hills -- This best site on the Moon with a candidate for a skylight to an open lava tube. It deserves detailed study.
2. Circumnavigate the Moon -- Another grad MOVE expedition has been proposed. If a long-distance rover started at Malapert and rolled steadily due west, it could stay in good sunlight and moderate temperatures for about a month and a half by following the Sun. The challenge is to circumnavigate the Lunar South Pole in that
BMD 25

time. This would be a real trail brazing expedition and will take an enormous number of lunar surfaces for the planning and execution on the Virtual Moon.
3. Apollo Sites – There is interest in 3D printing and CNC blocks of the Apollo to the Moon sites.
15.1. Recent Completions
We have recently completed the following:
1. Mt. Malapert -- Right next door to Scott A, this site was our first site studied and can be identified with telescopes from the Earth. With the lessons learned to date and the recalibrated data, we need to rework this area. Its value, visa-vie Scott A, depends on which site has the best access to the permanently dark craters. This can only be judged by exploration on our Virtual Moon.
2. Crater Haworth – This large crater lies at the base of both Mt. Malapert and the Scott A Massif. It is a permanently shadowed crater and what’s more its east rim looks collapsed allowing easy access.
15.2. Improvements Needed
Clearly we need your help on the following tasks:
1. SketchUp Version 15 plug-in – This is a simple upgrade of two plugins (written in Ruby on Rails) for the latest version of SketchUp.
2. Custom program to reduce data size – If we wrote a custom stand-alone program that striped the excess data like the first two Excel plug-ins, then the file would be small enough to run on Open Office (a free program limited to 64K files).
3. Reading data with other Graphics programs – A wide variety of data file extensions are available. Some of these should be readable by open graphics programs like GIMP. The problems is figuring out how to add slope data and remove bad passes. It may be possible to use other data formats more easily: Shapefile Format [Generate Files] -- The shape file format can be read by some graphics programs. This would save a lot of the steps below but means you may not have direct control of the data reduction which may not be needed after the major recalibration in the summer of 2014. Check your graphics programs, such as GIMP, to see if you can read any of these files: Shape extensions: .shp .shx .prj .dbf .shp.xml .z.shp .zi.shx z.dbf .z.shp These files too can be big. Nothing more on this approach will be covered in this paper but if you can make any of them work for you, it would be a big help.
BMD 26
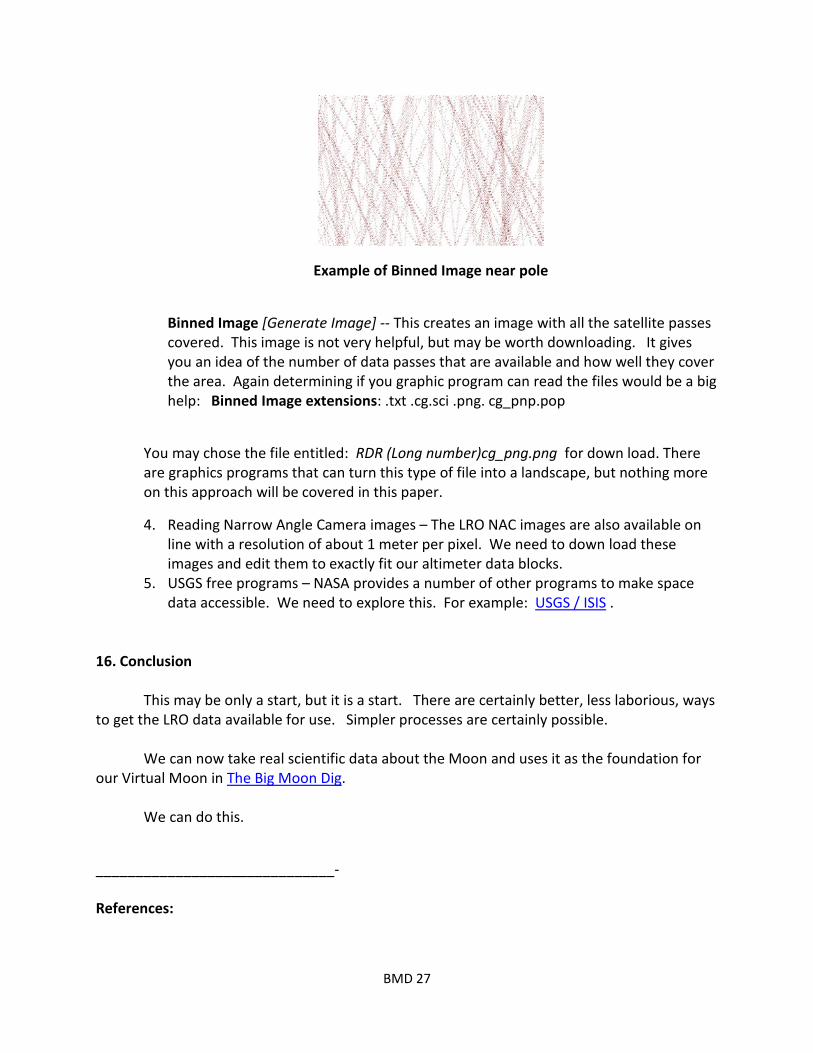
Example of Binned Image near pole
Binned Image [Generate Image] -- This creates an image with all the satellite passes covered. This image is not very helpful, but may be worth downloading. It gives you an idea of the number of data passes that are available and how well they cover the area. Again determining if you graphic program can read the files would be a big help: Binned Image extensions: .txt .cg.sci .png. cg_pnp.pop
You may chose the file entitled: RDR (Long number)cg_png.png for down load. There are graphics programs that can turn this type of file into a landscape, but nothing more on this approach will be covered in this paper.
4. Reading Narrow Angle Camera images – The LRO NAC images are also available on line with a resolution of about 1 meter per pixel. We need to down load these images and edit them to exactly fit our altimeter data blocks.
5. USGS free programs – NASA provides a number of other programs to make space data accessible. We need to explore this. For example: USGS / ISIS .
16. Conclusion
This may be only a start, but it is a start. There are certainly better, less laborious, ways to get the LRO data available for use. Simpler processes are certainly possible.
We can now take real scientific data about the Moon and uses it as the foundation for our Virtual Moon in The Big Moon Dig. We can do this.
______________________________- References:
BMD 27

1. The Big Moon Dig (internet) http://bigmoondig.com/BigMoonDig.html
2. Skylight article(internet) http://news.nationalgeographic.com/news/2009/10/091026-moon-skylight-lunar-base.html
3. Skylight picture (internet) http://news.nationalgeographic.com/news/bigphotos/64282316.html
4. LODE (Internet) http://ode.rsl.wustl.edu/moon/indextools.aspx?displaypage=lolardr
5. GeoSketch Tools: Import Shapefile (internet) http://www.youtube.com/watch?v=ERSpWsvLSwc -- Tutorial video on Importing Shapefile into Goggle SketchUp
6. How to Mesh Point Cloud with SketchUp http://www.my3dscanner.com/index.php?option=com_k2&view=item&id=43:mesh-point-cloud-with-sketchup&Itemid=93
7. points cloud triangulation SketchUcation (membership required) http://rld.crai.archi.fr/rld/plugin_details.php?id=292
8. [Plug-in] Create 3d mesh from construction points... ver 1.0 http://sketchucation.com/forums/viewtopic.php?t=20961
9. Loading Ruby Scripts http://www.sketchup.com/intl/en/developer/docs/loading.php
BMD 28