Embed Size (px)
Citation preview

1 Luminor Bank AS Interim Report to 30 June 2021
Luminor Bank Interim Report Q2 2021
2 Luminor Bank AS Interim Report to 30 June 2021
AT A GLANCE
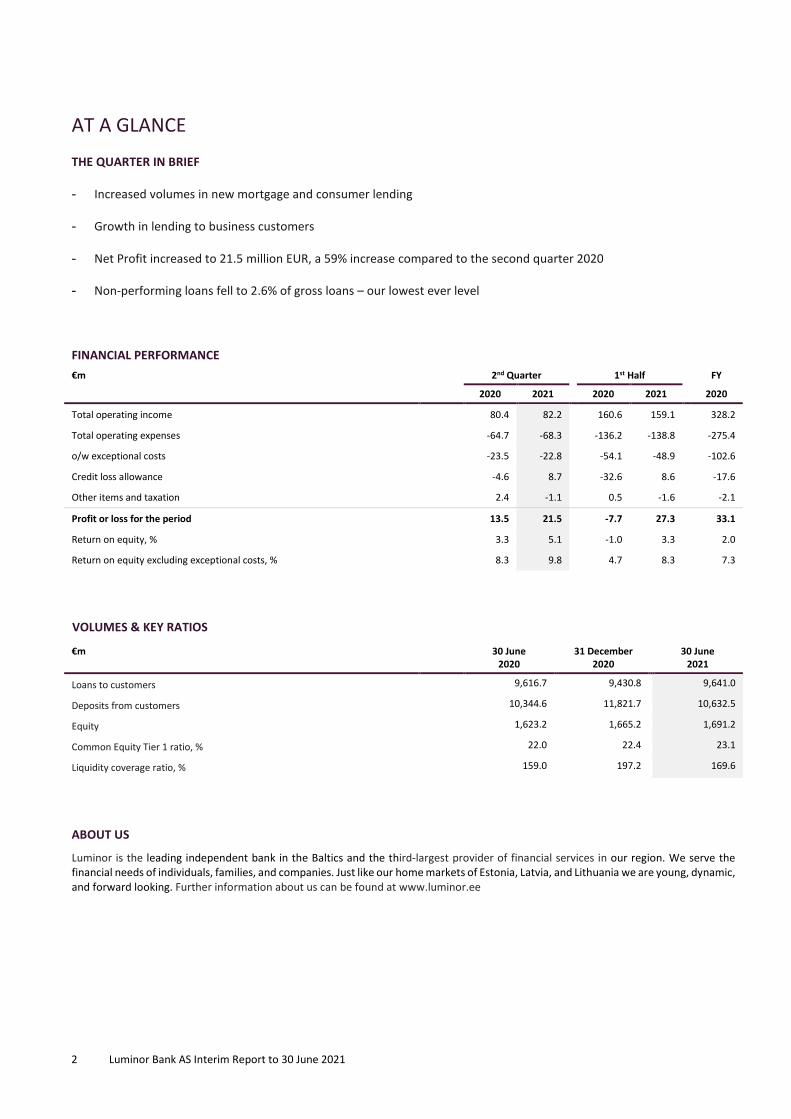
THE QUARTER IN BRIEF
- Increased volumes in new mortgage and consumer lending
- Growth in lending to business customers
- Net Profit increased to 21.5 million EUR, a 59% increase compared to the second quarter 2020
- Non-performing loans fell to 2.6% of gross loans – our lowest ever level
FINANCIAL PERFORMANCE €m 2nd Quarter 1st Half FY
2020 2021 2020 2021 2020
Total operating income 80.4 82.2 160.6 159.1 328.2
Total operating expenses -64.7 -68.3 -136.2 -138.8 -275.4
o/w exceptional costs -23.5 -22.8 -54.1 -48.9 -102.6
Credit loss allowance -4.6 8.7 -32.6 8.6 -17.6
Other items and taxation 2.4 -1.1 0.5 -1.6 -2.1
Profit or loss for the period 13.5 21.5 -7.7 27.3 33.1
Return on equity, % 3.3 5.1 -1.0 3.3 2.0
Return on equity excluding exceptional costs, % 8.3 9.8 4.7 8.3 7.3
VOLUMES & KEY RATIOS
€m 30 June 2020
31 December 2020
30 June 2021
Loans to customers 9,616.7 9,430.8 9,641.0
Deposits from customers 10,344.6 11,821.7 10,632.5
Equity 1,623.2 1,665.2 1,691.2
Common Equity Tier 1 ratio, % 22.0 22.4 23.1
Liquidity coverage ratio, % 159.0 197.2 169.6
ABOUT US
Luminor is the leading independent bank in the Baltics and the third-largest provider of financial services in our region. We serve the financial needs of individuals, families, and companies. Just like our home markets of Estonia, Latvia, and Lithuania we are young, dynamic, and forward looking. Further information about us can be found at www.luminor.ee

Luminor Bank AS Interim Report to 30 June 2021 3
CHIEF EXECUTIVE’S STATEMENT The second quarter witnessed a reduction in the incidence of COVID-19 and the lifting of many restrictions across the Baltic countries. Both developments are most welcome for our customers and the societies we serve. Against this improving environment we boosted our business performance, advanced our digital transformation, and increased our net profits as compared to the same quarter last year. Once again, our staff did a super job.
In January this year we started the next stage of our strategy, as we turned the focus of Luminor to our customers and to business growth. Our priorities are to grow our lending, notably in mortgages and to SME customers, to increase customer satisfaction, and to raise our level of digitisation and automation, while fulfilling our wider obligations to our communities and the environment.
We have substantial work ahead of us to realise these goals, but I am encouraged by signs of progress in the second quarter. New sales volumes in mortgages were up substantially from a year ago, loans to business customers grew in the quarter and, once again, we were at the heart of developments in the Baltic capital markets as we led a number of new issues for clients including the first international bond from the real estate sector. We deepened our work with IBM to support our IT services, entered a contract with Worldline to manage our ATM network, and developed new digital functionalities which will be launched later this year. Finally, we stepped up our ESG efforts and launched ESG funds to clients of our pensions business.
To support this focus, we announced the integration of our Products and Offering Division into our Retail Banking and Corporate Banking Divisions, and other divisions including Finance, Legal and Technology. Kristina Siimar, Head of the Products and Offering Division and Member of the Management Board resigned effective from 31 July. Kristina’s success is manifest, and I am grateful for her commitment, professionalism, and dedication.
We generated a net profit of 21.5 million EUR in the quarter, as compared to 13.5 million EUR in the same quarter last year. This improvement was driven principally by a net reversal of credit loss allowances. As we increased our profit, our return on equity improved to 5.1% from 3.3%. Exceptional costs, incurred as we transform our operations, totalled 22.8 million EUR. Without these costs we would have generated a return on equity of 9.8%.
Our Common Equity, Tier 1 and Total Capital Ratios on 30 June were 23.1% of Risk Exposure Amounts, virtually unchanged over the quarter and substantially above our target Total Capital Ratio of 17%. Consistent with prevailing guidance from the European Central Bank (the ECB), we retained the profit we generated in the quarter. We ended the period with a loan to deposit ratio of 91.1% as compared to 82.4% on 31 March 2021. In July, the ECB published the results of their Comprehensive Assessment of us which confirmed our resilience, robust asset quality and capitalisation.
Preventing money laundering and terrorist financing remains firmly in the focus of our Management Board and the Supervisory Council. We continue our efforts in this field by accelerating our technological development, enhancing further our internal processes, and strengthening our pan-Baltic alignment.
We continue to monitor the risks of inflation and pay close attention to changes in interest rates. That said, the economies of the Baltic countries have proven resilient through the pandemic, and economic fundamentals are robust and supportive of above EU-average GDP growth.
I look forward to Luminor doing more business, more effectively, with more individuals and businesses across our home markets of Estonia, Latvia, and Lithuania. In so doing, we will maintain our strong financial standing, prudent risk management and commitment to preventing financial crime.
Peter Bosek
4 Luminor Bank AS Interim Report to 30 June 2021
CONTENTS
AT A GLANCE ............................................................................................................................................................................................. 2 CHIEF EXECUTIVE’S STATEMENT ................................................................................................................................................................ 3 MANAGEMENT REPORT ............................................................................................................................................................................ 5 INTERIM FINANCIAL STATEMENTS ........................................................................................................................................................... 20
Condensed Consolidated Statement Of Profit Or Loss And Other Comprehensive Income ...........................................................................20 Condenced Consolidated Balance Sheet ........................................................................................................................................................21 Condenced Consolidated Statement Of Changes In Equity ............................................................................................................................22 Condenced Consolidated Statement Of Cash Flows .......................................................................................................................................23
NOTES TO THE CONDENSED CONSOLIDATED INTERIM FINANCIAL STATEMENTS ..................................................................................... 24 1. Significant Accounting Policies, Estimates And Judgements .......................................................................................................................24 2. General Risk Management Policies .............................................................................................................................................................26 3. Net Interest And Similar Income .................................................................................................................................................................29 4. Net Fee And Commission Income ...............................................................................................................................................................30 5. Net Other Financial Income ........................................................................................................................................................................31 6. Other Administrative Expenses...................................................................................................................................................................32 7. Loans To Customers ....................................................................................................................................................................................32 8. Deposits From Customers ...........................................................................................................................................................................39 9. Debt Securities Issued .................................................................................................................................................................................40 10. Derivative Financial Instruments ..............................................................................................................................................................40 11. Other Financial Liabilities ..........................................................................................................................................................................41 12. Contingent liabilities .................................................................................................................................................................................41 13. Fair Value Of Financial Assets And Liabilities ............................................................................................................................................41 14. Related Parties ..........................................................................................................................................................................................44 15. Segment Reporting ...................................................................................................................................................................................45
CONTACT DETAILS ................................................................................................................................................................................... 48 INDEPENDENT AUDITOR’S REPORT ON REVIEW OF CONDENSED CONSOLIDATED INTERIM FINANCIAL STATEMENTS .............................. 49
This interim report has been prepared in accordance with IAS 34 Interim Financial Reporting and Estonian law. In this report ‘Luminor’, ‘Luminor Bank’, ‘we’, ‘us’ and ‘our’ refer to Luminor Bank AS together with its subsidiaries. The abbreviations ‘€m’ and ‘€bn’ represent millions and billions (thousands of millions) of euro, respectively.

Luminor Bank AS Interim Report to 30 June 2021 5
MANAGEMENT REPORT ECONOMIC ENVIRONMENT
The Baltic economies have continued to outperform many of their euro area peers, with growth broadening and economic confidence firming across both industry and services. The second wave of COVID-19 brought new targeted lockdowns from the fourth quarter of 2020 in Latvia and Lithuania and from the first quarter of 2021 in Estonia. After the virus was once again contained, the COVID-19 restrictions were lifted across the Baltic countries during the spring.
The resilience of the economies during the second lockdown reflects how individuals and companies have learned to live with the virus, and the benefit received from recovering global trade and state income support measures. GDP exceeded its pre-crisis level in the first quarter of 2021 in Estonia and Lithuania with yearly growth reaching a 5% and 1.2% respectively. The Latvian economy contracted by 1.2% in the first quarter from a year before, in line with the euro area average.
In Estonia the robust yearly growth was achieved despite subdued industrial demand. The retail and wholesale, information and communication technology (ICT), and energy sectors made the most substantial contributions to a brighter and broadening outlook for growth. Latvia and Lithuania experienced somewhat stronger industrial demand in the first quarter, with Latvia benefiting from export-orientated businesses like wood and wood processing, and electrical equipment manufacturing. Consumer demand in Latvia is expected to rebound as coronavirus restrictions are lifted and improved confidence will lead to robust spending and acceleration in investments. The Lithuanian economy has already experienced quite a broad based recovery in 2021, with industrial volume growing 17.4% over the year in January - May 2021. The growth in industry was accompanied by advances in finance and insurance, ICT, and real estate activities.
The Baltic countries are poised for a cyclical rebound driven by the reopening of societies and by consumer appetites, as the well-established growth in trade in goods is accompanied by expansion in the services sector. The Baltic consumer is expected to stage a strong recovery as social restrictions are lifted, and pent-up savings are channelled to consumption. Retail sales volumes in Estonia grew by 10.9% in January - May 2021 as compared to a year ago. The corresponding increases for Latvia and Lithuania were 0.9% and 14.1%, respectively.
BUSINESS DEVELOPMENTS
At the turn of the year, we embarked on the next phase of our strategy, to increase customer focus and grow our business. To allow our organisational design to reflect and support that focus, in the second quarter we announced the integration of our Products and Offering Division into our Retail Banking and Corporate Banking Divisions, and other divisions including Finance, Legal and Technology. This change will increase our customer focus and agility, and improve collaboration and process efficiency, while reducing organisational complexity. The integration will be completed by the end of the third quarter. Kristina Siimar, Head of the Products and Offering Division and Member of the Management Board resigned effective from 31 July.
We continued to focus on our digital transformation in cooperation with our strategic partner IBM to ensure smooth banking services for our customers and to strengthen further our security and regulatory compliance processes. We signed a five-year contract with Worldline, the European leader in the payments and transactional services industry, under which Worldline will unify and upgrade our ATM network. Our digital development continued with the preparation and rollout of new functionalities and products. We will launch later this year new e-commerce acquiring capabilities and introduce new payment methods, instant payments, and mobile wallets.
In July, the ECB, in cooperation with the Estonian Financial Supervision and Resolution Authority, completed its Comprehensive Assessment of us, which comprised an Asset Quality Review (AQR) and a stress test. The Asset Quality Review was performed on our financial position at the end of 2019. The Stress Test applied the 2020 European Banking Association Stress Test methodology on the same starting point and incorporated regulatory and governmental relief measures to account for COVID-19. The results of the Comprehensive Assessment confirmed our resilience, robust asset quality and capitalisation.

6 Luminor Bank AS Interim Report to 30 June 2021

Luminor Bank AS Interim Report to 30 June 2021 7
Financial Performance
Summary income statement 2nd Quarter 1st Half FY
€m 2020 2021 2020 2021 2020
Net interest and similar income 55.9 60.3 111.7 116.9 226.9
Net fee and commission income 15.4 19.3 33.2 36.8 73.6
Net other operating income 9.1 2.6 15.7 5.4 27.7
Total operating income 80.4 82.2 160.6 159.1 328.2
Total operating expenses -64.7 -68.3 -136.2 -138.8 -275.4
Share of profit from associates 0.3 0.6 0.7 1.0 1.0
Credit loss allowance -4.6 8.7 -32.6 8.6 -17.6
Other non-operating expenses 0.0 -0.1 -0.1 -0.3 -0.4
Profit before tax 11.4 23.1 -7.6 29.6 35.8
Tax expense 2.1 -1.6 -0.1 -2.3 -2.7
Profit or loss for the period 13.5 21.5 -7.7 27.3 33.1
Cost / income ratio, % 80.5 83.1 84.8 87.2 83.9
Cost / income ratio excluding exceptional costs, % 51.3 55.3 51.1 56.5 52.7
Profit before tax for the quarter was 23.1 million EUR compared to 11.4 million EUR in the same period last year. An increase in Total operating income of 1.8 million EUR was offset by a 3.6 million EUR increase in Total operating expenses, while credit loss allowances decreased by 13.3 million EUR.
Total operating income was 82.2 million EUR. Net interest income increased by 4.4 million EUR to 60.3 million EUR in the second quarter of 2021. Interest income was virtually unchanged, while interest expense fell by 4.8 million EUR due to lower interest payable on deposits and the repayment of facilities under the funding facility provided by our former parent banks. Net fee and commission income increased by 3.9 million EUR, compared to the same quarter last year, driven by a rebound in number of payments and card transactions as COVID-19 related restrictions were lifted. Net other operating income decreased by 6.5 million EUR driven as income generated in the second quarter of 2020 from revaluation of Treasury bonds and VISA shares did not recur.
Total operating expenses were 68.3 million EUR. Personnel expenses were 1.1 million EUR lower in this period as 185 people transferred from our Technology Division to IBM as part of our digital transformation initiative. Other administrative expenses increased by 4.6 million EUR, driven by higher IT development costs and an increase in external IT costs which reflect our agreement with IBM. Exceptional costs were 22.8 million EUR, a 0.7 million EUR decrease compared to the same period last year. Exceptional costs relate to specific projects which are temporary in nature and are approved by the Supervisory Council as part of our financial plan. Although migration-related costs were lower, we continued to make significant investments into IT operations, credit risk analytics and business development.
We recorded a net reversal of credit loss allowances of 8.7 million EUR this quarter. This compares to credit loss allowances of 4.6 million EUR in the second quarter of 2020 which were driven by forbearance measures that triggered non-performing status as well as changes in the macroeconomic outlook and downgrades. This year, the reversals were driven by changes in individual provisions due to repayments and full and gradual exits from non-performing exposures, and by cures resulting from the end of probation periods for loans to individuals.
Profit for the period was 21.5 million EUR, an increase of 8.0 million from the profit of 13.5 million EUR in the second quarter of 2020. Our return on equity was 5.1% in this period and 3.3% in the same period last year. Excluding exceptional costs, the respective returns were 9.8% and 8.3%.

8 Luminor Bank AS Interim Report to 30 June 2021
Luminor Bank AS Interim Report to 30 June 2021 9
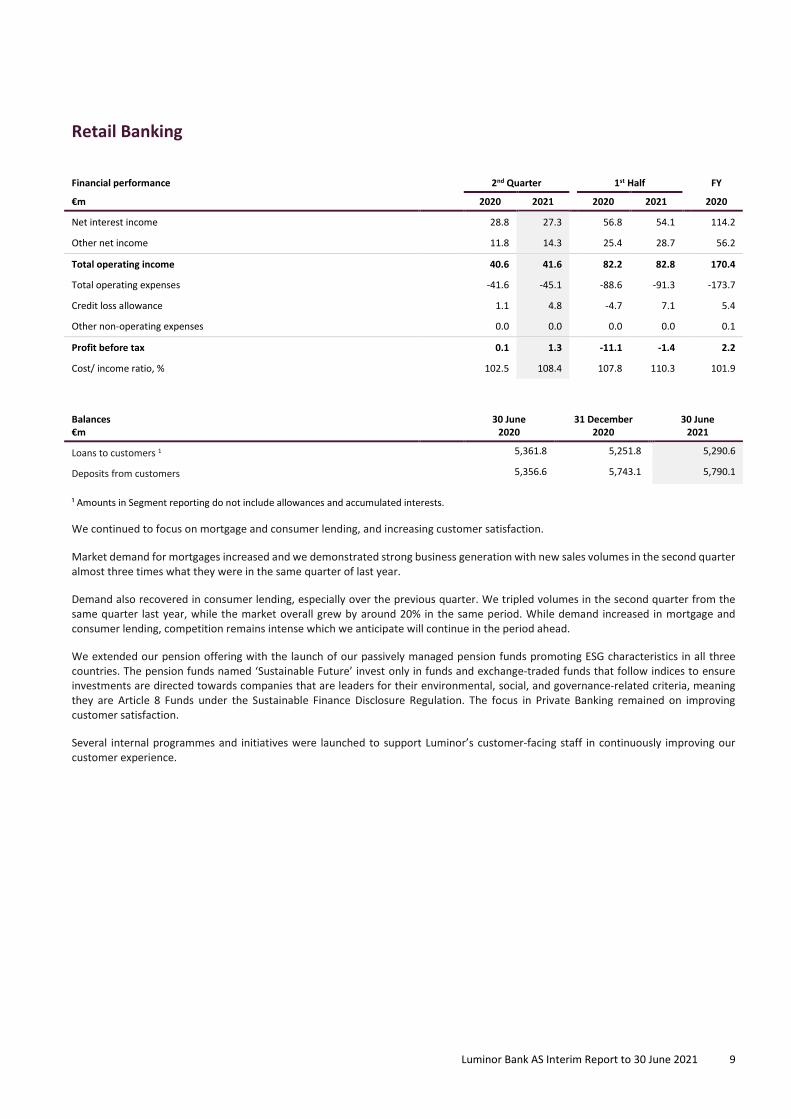
Retail Banking
Financial performance 2nd Quarter 1st Half FY
€m 2020 2021 2020 2021 2020
Net interest income 28.8 27.3 56.8 54.1 114.2
Other net income 11.8 14.3 25.4 28.7 56.2
Total operating income 40.6 41.6 82.2 82.8 170.4
Total operating expenses -41.6 -45.1 -88.6 -91.3 -173.7
Credit loss allowance 1.1 4.8 -4.7 7.1 5.4
Other non-operating expenses 0.0 0.0 0.0 0.0 0.1
Profit before tax 0.1 1.3 -11.1 -1.4 2.2
Cost/ income ratio, % 102.5 108.4 107.8 110.3 101.9
Balances €m
30 June 2020
31 December 2020
30 June 2021
Loans to customers 1 5,361.8 5,251.8 5,290.6
Deposits from customers 5,356.6 5,743.1 5,790.1
¹ Amounts in Segment reporting do not include allowances and accumulated interests. We continued to focus on mortgage and consumer lending, and increasing customer satisfaction.
Market demand for mortgages increased and we demonstrated strong business generation with new sales volumes in the second quarter almost three times what they were in the same quarter of last year.
Demand also recovered in consumer lending, especially over the previous quarter. We tripled volumes in the second quarter from the same quarter last year, while the market overall grew by around 20% in the same period. While demand increased in mortgage and consumer lending, competition remains intense which we anticipate will continue in the period ahead.
We extended our pension offering with the launch of our passively managed pension funds promoting ESG characteristics in all three countries. The pension funds named ‘Sustainable Future’ invest only in funds and exchange-traded funds that follow indices to ensure investments are directed towards companies that are leaders for their environmental, social, and governance-related criteria, meaning they are Article 8 Funds under the Sustainable Finance Disclosure Regulation. The focus in Private Banking remained on improving customer satisfaction.
Several internal programmes and initiatives were launched to support Luminor’s customer-facing staff in continuously improving our customer experience.

10 Luminor Bank AS Interim Report to 30 June 2021

Luminor Bank AS Interim Report to 30 June 2021 11
Corporate Banking
Financial performance 2nd Quarter 1st Half FY
€m 2020 2021 2020 2021 2020
Net interest income 29.9 31.4 58.3 60.4 123.2
Other net income 8.0 9.1 16.4 15.8 33.2
Total operating income 37.9 40.5 74.7 76.2 156.4
Total operating expenses -21.9 -22.7 -46.0 -46.3 -96.1
Credit loss allowance -5.9 3.7 -28.2 1.1 -24.0
Other non-operating expenses -0.1 0.6 0.1 0.8 0.1
Profit before tax 10.0 22.1 0.6 31.8 36.4
Cost/ income ratio, % 57.8 56.0 61.6 60.8 61.4
Balances €m
30 June 2020
31 December 2020
30 June 2021
Loans to customers 1 4,442.5 4,307.8 4,481.7
Deposits from customers 4,962.9 6,024.8 4,803.6
¹ Amounts in Segment reporting do not include allowances and accumulated interests. Lending to corporate banking customers increased in the second quarter as we lifted our market share in Latvia and Lithuania.
Market demand was depressed over the winter months, but it has since increased across sectors. Greater market activity and support from the European Investment Bank guarantee programme have benefited lending to the SME segment and boosted growth rates in the leasing portfolio, where we increased our market share in the new and used vehicle segments.
We foresee the use of overdrafts to increase in the next quarter on the back of the harvest season, especially in Lithuania and Latvia. The overall demand in the market seems to be holding strong, but downward pressure on margins is somewhat higher than was initially expected.
Positive developments also continued in the capital markets segment, where we focus on serving large Baltic corporate borrowers. Among other landmark transactions, we led the first international bond issue from the real estate sector in the Baltic states. We continue to develop our activities in the Baltic capital markets and have a healthy debt origination pipeline.
In the second quarter, we introduced the remote onboarding service for our business customers in Latvia. We plan to introduce this service in Estonia and Lithuania by the end of the year.
12 Luminor Bank AS Interim Report to 30 June 2021
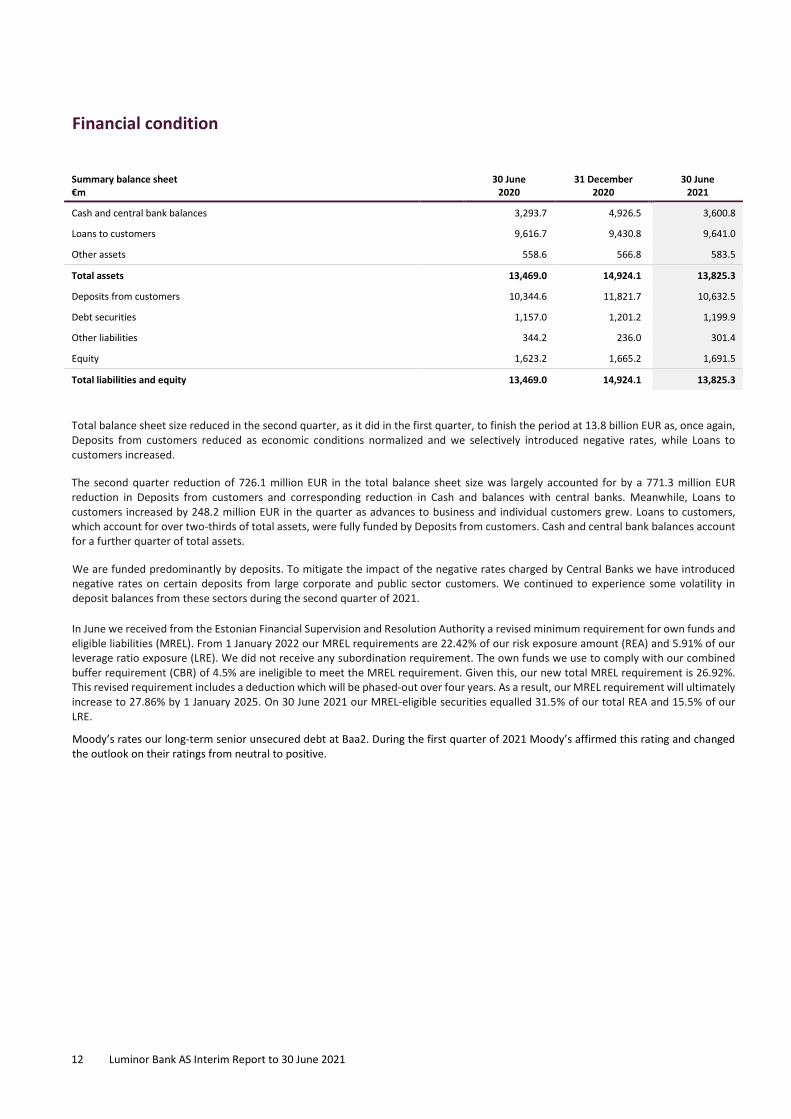
Financial condition
Summary balance sheet €m
30 June 2020
31 December 2020
30 June 2021
Cash and central bank balances 3,293.7 4,926.5 3,600.8
Loans to customers 9,616.7 9,430.8 9,641.0
Other assets 558.6 566.8 583.5
Total assets 13,469.0 14,924.1 13,825.3
Deposits from customers 10,344.6 11,821.7 10,632.5
Debt securities 1,157.0 1,201.2 1,199.9
Other liabilities 344.2 236.0 301.4
Equity 1,623.2 1,665.2 1,691.5
Total liabilities and equity 13,469.0 14,924.1 13,825.3
Total balance sheet size reduced in the second quarter, as it did in the first quarter, to finish the period at 13.8 billion EUR as, once again, Deposits from customers reduced as economic conditions normalized and we selectively introduced negative rates, while Loans to customers increased.
The second quarter reduction of 726.1 million EUR in the total balance sheet size was largely accounted for by a 771.3 million EUR reduction in Deposits from customers and corresponding reduction in Cash and balances with central banks. Meanwhile, Loans to customers increased by 248.2 million EUR in the quarter as advances to business and individual customers grew. Loans to customers, which account for over two-thirds of total assets, were fully funded by Deposits from customers. Cash and central bank balances account for a further quarter of total assets.
We are funded predominantly by deposits. To mitigate the impact of the negative rates charged by Central Banks we have introduced negative rates on certain deposits from large corporate and public sector customers. We continued to experience some volatility in deposit balances from these sectors during the second quarter of 2021.
In June we received from the Estonian Financial Supervision and Resolution Authority a revised minimum requirement for own funds and eligible liabilities (MREL). From 1 January 2022 our MREL requirements are 22.42% of our risk exposure amount (REA) and 5.91% of our leverage ratio exposure (LRE). We did not receive any subordination requirement. The own funds we use to comply with our combined buffer requirement (CBR) of 4.5% are ineligible to meet the MREL requirement. Given this, our new total MREL requirement is 26.92%. This revised requirement includes a deduction which will be phased-out over four years. As a result, our MREL requirement will ultimately increase to 27.86% by 1 January 2025. On 30 June 2021 our MREL-eligible securities equalled 31.5% of our total REA and 15.5% of our LRE.
Moody’s rates our long-term senior unsecured debt at Baa2. During the first quarter of 2021 Moody’s affirmed this rating and changed the outlook on their ratings from neutral to positive.

Luminor Bank AS Interim Report to 30 June 2021 13
Capital and liquidity
Capital €m
30 June 2020
31 December 2020
30 June 2021
Shareholders’ Equity 1,623.2 1,665.2 1,691.5
Regulatory adjustments -34.6 -78.5 -47.5
Prudential filters -1.7 -0.3 -0.4
Common Equity Tier 1 1,586.9 1,586.4 1,643.6
Credit risk exposure amounts 6,490.2 6,375.2 6,410.8
Operational risk exposure amounts 662.4 673.6 673.6
Other risk exposure amounts 46.0 37.5 35.3
Total risk exposure amounts 7,198.6 7,086.3 7,119.7
Common Equity Tier 1 ratio, % 22.0 22.4 23.1
Leverage ratio, % 11.2 10.2 11.4
At the end of the second quarter of 2021, we had 1,643.6 million EUR in own funds, composed entirely of Common Equity Tier 1 (CET1) capital. Our CET1, Tier 1, and Total capital ratios at the end of the quarter were 23.1%, virtually unchanged from 23.4% at the end of the first quarter. The marginal reduction in the ratio was driven mainly by the increase of REA to 7,119.7 million EUR as credit risk exposure amounts increased by nearly 100 million EUR during the second quarter.
Our capital ratios remain well above our minimum capital requirements set by the regulatory authorities, which require us to have a CET1 ratio exceeding 10.1%, a Tier 1 ratio above 12.0% and a Total Capital ratio greater than 14.5%. The capital ratios were also above our targets of 16% for CET1 and Tier 1 capital and 17% for Total capital.
In response to COVID-19, the Baltic countries left their systemic risk buffer and countercyclical buffer requirements at 0%. The buffers are expected to be reviewed once the economic difficulties caused by COVID-19 ease. On 15 December 2020, the European Central Bank (the ECB) issued a recommendation to banks which asked banks to refrain from or limit dividends until the end of September 2021. On 23 July 2021, the ECB released an update not to extend the dividend recommendation beyond September 2021.
Our leverage ratio increased to 11.4% due to a decrease in assets and off-balance sheet exposures.
% 30 June 2020
31 December 2020
30 June 2021
Liquidity Coverage Ratio 159.0 197.2 169.6
Net Stable Funding Ratio 133.2 159.0 146.9
Our structural liquidity risk is conservative and well-balanced. It is based on metrics that measure liquidity risk and is appropriately adapted to the current economic and regulatory environment. We use a range of metrics to measure liquidity risk, one of which is the Liquidity Coverage Ratio (LCR). On 30 June 2021 our LCR was 169.6% compared to 197.3% at end of Q1 2021, and a minimum regulatory requirement of 100%. Volatility of the LCR is driven mainly by activities to manage excess liquidity via the selective introduction of negative rates to deposits. The liquidity buffer is composed of highly liquid central bank eligible securities and cash.
Long-term liquidity risk is measured by the Net Stable Funding Ratio (NSFR). On 30 June 2021 our NSFR was 146.9% compared to 159.4% at end of Q1 2021, and a minimum regulatory requirement of 100%. The decrease of the ratio during the quarter was driven by the decrease of Available Stable Funding due to a drop in corporate and sovereign deposits which was partly offset by an increase in the Required Stable Funding, driven by growth of our loan portfolio. The NSFR for June 2021 was calculated in accordance with the new European Banking Authority and Capital Requirements Regulation 2 requirements.
14 Luminor Bank AS Interim Report to 30 June 2021
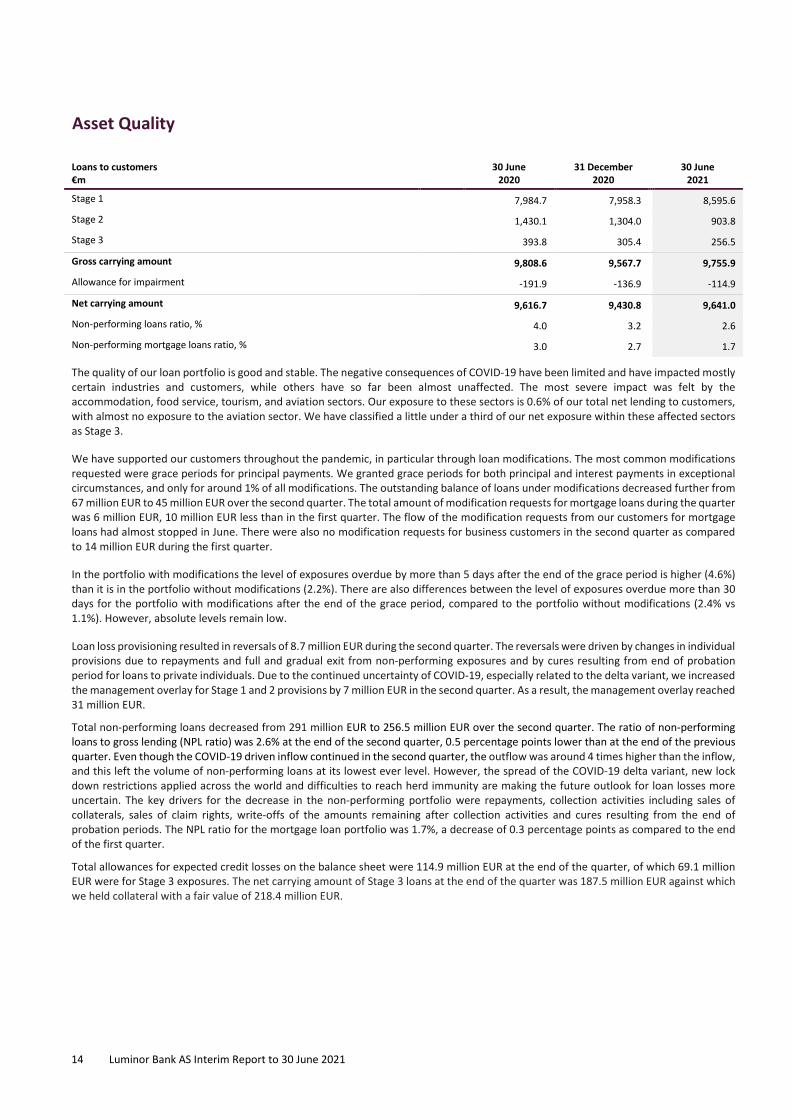
Asset Quality
Loans to customers €m
30 June 2020
31 December 2020
30 June 2021
Stage 1 7,984.7 7,958.3 8,595.6
Stage 2 1,430.1 1,304.0 903.8
Stage 3 393.8 305.4 256.5
Gross carrying amount 9,808.6 9,567.7 9,755.9
Allowance for impairment -191.9 -136.9 -114.9
Net carrying amount 9,616.7 9,430.8 9,641.0
Non-performing loans ratio, % 4.0 3.2 2.6
Non-performing mortgage loans ratio, % 3.0 2.7 1.7
The quality of our loan portfolio is good and stable. The negative consequences of COVID-19 have been limited and have impacted mostly certain industries and customers, while others have so far been almost unaffected. The most severe impact was felt by the accommodation, food service, tourism, and aviation sectors. Our exposure to these sectors is 0.6% of our total net lending to customers, with almost no exposure to the aviation sector. We have classified a little under a third of our net exposure within these affected sectors as Stage 3.
We have supported our customers throughout the pandemic, in particular through loan modifications. The most common modifications requested were grace periods for principal payments. We granted grace periods for both principal and interest payments in exceptional circumstances, and only for around 1% of all modifications. The outstanding balance of loans under modifications decreased further from 67 million EUR to 45 million EUR over the second quarter. The total amount of modification requests for mortgage loans during the quarter was 6 million EUR, 10 million EUR less than in the first quarter. The flow of the modification requests from our customers for mortgage loans had almost stopped in June. There were also no modification requests for business customers in the second quarter as compared to 14 million EUR during the first quarter.
In the portfolio with modifications the level of exposures overdue by more than 5 days after the end of the grace period is higher (4.6%) than it is in the portfolio without modifications (2.2%). There are also differences between the level of exposures overdue more than 30 days for the portfolio with modifications after the end of the grace period, compared to the portfolio without modifications (2.4% vs 1.1%). However, absolute levels remain low.
Loan loss provisioning resulted in reversals of 8.7 million EUR during the second quarter. The reversals were driven by changes in individual provisions due to repayments and full and gradual exit from non-performing exposures and by cures resulting from end of probation period for loans to private individuals. Due to the continued uncertainty of COVID-19, especially related to the delta variant, we increased the management overlay for Stage 1 and 2 provisions by 7 million EUR in the second quarter. As a result, the management overlay reached 31 million EUR.
Total non-performing loans decreased from 291 million EUR to 256.5 million EUR over the second quarter. The ratio of non-performing loans to gross lending (NPL ratio) was 2.6% at the end of the second quarter, 0.5 percentage points lower than at the end of the previous quarter. Even though the COVID-19 driven inflow continued in the second quarter, the outflow was around 4 times higher than the inflow, and this left the volume of non-performing loans at its lowest ever level. However, the spread of the COVID-19 delta variant, new lock down restrictions applied across the world and difficulties to reach herd immunity are making the future outlook for loan losses more uncertain. The key drivers for the decrease in the non-performing portfolio were repayments, collection activities including sales of collaterals, sales of claim rights, write-offs of the amounts remaining after collection activities and cures resulting from the end of probation periods. The NPL ratio for the mortgage loan portfolio was 1.7%, a decrease of 0.3 percentage points as compared to the end of the first quarter.
Total allowances for expected credit losses on the balance sheet were 114.9 million EUR at the end of the quarter, of which 69.1 million EUR were for Stage 3 exposures. The net carrying amount of Stage 3 loans at the end of the quarter was 187.5 million EUR against which we held collateral with a fair value of 218.4 million EUR.

Luminor Bank AS Interim Report to 30 June 2021 15
Additional information
ENVIRONMENTAL, SOCIAL AND GOVERNANCE (ESG)
During the quarter, we furthered our ESG efforts by agreeing our ESG ambitions and updated our corporate sustainability policy to reflect them.
Our ESG ambitions are to support the transformation towards a low-carbon economy, to reduce any negative impact on society and the environment from our business activities, to become climate neutral in our own operations, and to support our clients in their transition towards more sustainable practices.
We updated our ESG Credit Risk Assessment Guidelines for climate and social risk. We also established a process for tracking our energy consumption data and started uploading it into the reporting platform. Following the results of an employee survey, we prepared a sustainability training programme for our employees to help them learn more about sustainability and to make it easier for them to integrate sustainability into their business decisions.
We continued to contribute actively to promoting financial literacy and raising awareness about fraud through a range of activities. These included supporting the European Money Quiz contest about the economy and finance, participating in the “Be smarter than fraudsters” campaign, and sharing advice and information on responsible financing in the media. We also donated computers to regional educational institutions in Latvia.
PREVENTING FINANCIAL CRIME
We do not tolerate financial crime. During the second quarter of 2021, we continued to apply our financial crime risk management framework to prevent, detect, and report potential financial crime. Our framework covers the technology, and policies and procedures we employ to prevent and detect financial crime, assess risks, run training and awareness-raising sessions, and monitor new and developing financial crime risks.
We serve predominantly residents of the Baltic countries and customers who have a strong personal or business connection to the Baltic countries. While this mitigates some financial crime risks, we review continuously our anti-financial crime (AFC) practices and invest significantly in the human and technological resources we need to meet our commitments. We are enhancing our common monitoring and screening solution across all three Baltic countries and will implement further developments in 2021.
We work closely with our regulatory and supervisory authorities and use this experience to enhance our systems and processes. We also follow international guidelines, recommendations and standards issued by regulatory and supervisory authorities, international bodies, local banking associations, and financial intelligence units in each Baltic country.
Preventing money laundering and terrorist financing remains firmly in the focus of our Management Board and the Supervisory Council. We continue our efforts in this field by accelerating our technological development, further enhancing our internal processes and strengthening our pan-Baltic alignment. An important component of the financial crime risk management framework is to raise awareness. In the second quarter of 2021 we held 18 training events related to the AFC and corporate compliance.
OTHER EVENTS
We were fined 0.35 million EUR by the Bank of Lithuania for payments-related incidents that occurred in July and August 2020.
Jerome Mourgue D’Algue resigned as a Member of the Supervisory Council effective 6 July. Mari Mõis, Head of Compliance, was elected to the Management Board effective 1 August.
16 Luminor Bank AS Interim Report to 30 June 2021
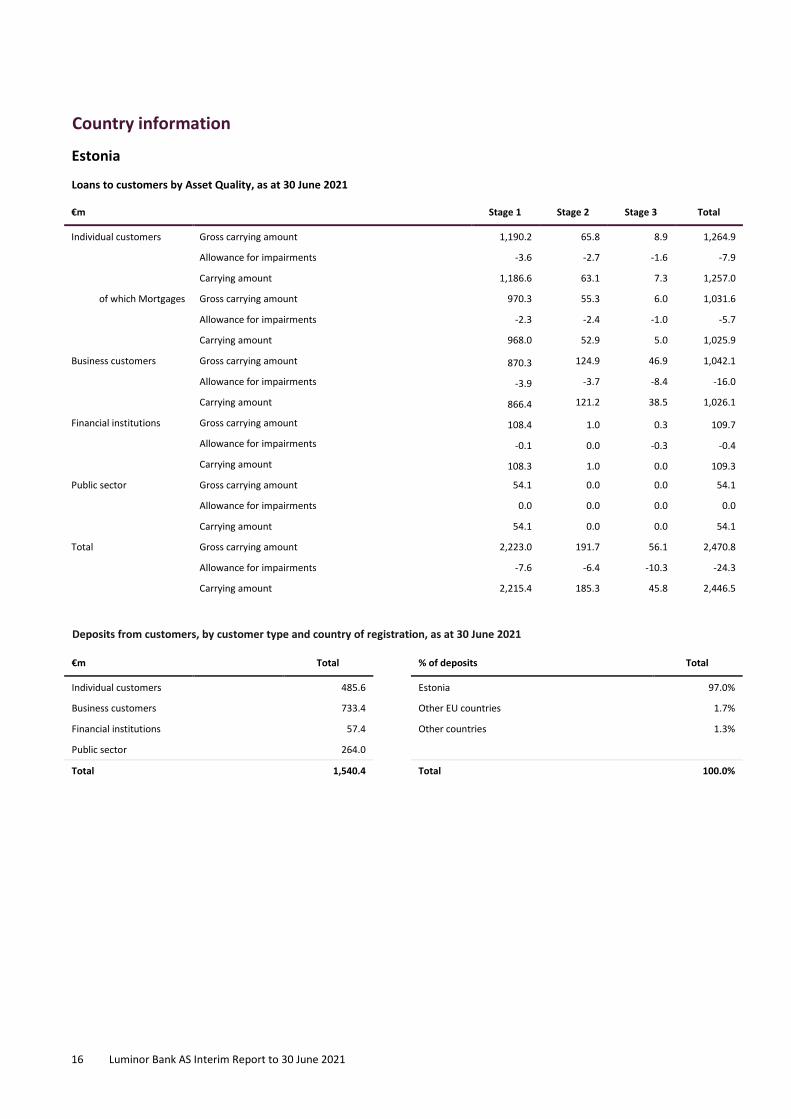
Country information
Estonia
Loans to customers by Asset Quality, as at 30 June 2021
€m Stage 1 Stage 2 Stage 3 Total
Individual customers Gross carrying amount 1,190.2 65.8 8.9 1,264.9
Allowance for impairments -3.6 -2.7 -1.6 -7.9
Carrying amount 1,186.6 63.1 7.3 1,257.0
of which Mortgages Gross carrying amount 970.3 55.3 6.0 1,031.6
Allowance for impairments -2.3 -2.4 -1.0 -5.7
Carrying amount 968.0 52.9 5.0 1,025.9
Business customers Gross carrying amount 870.3 124.9 46.9 1,042.1
Allowance for impairments -3.9 -3.7 -8.4 -16.0
Carrying amount 866.4 121.2 38.5 1,026.1
Financial institutions Gross carrying amount 108.4 1.0 0.3 109.7
Allowance for impairments -0.1 0.0 -0.3 -0.4
Carrying amount 108.3 1.0 0.0 109.3
Public sector Gross carrying amount 54.1 0.0 0.0 54.1
Allowance for impairments 0.0 0.0 0.0 0.0
Carrying amount 54.1 0.0 0.0 54.1
Total Gross carrying amount 2,223.0 191.7 56.1 2,470.8
Allowance for impairments -7.6 -6.4 -10.3 -24.3
Carrying amount 2,215.4 185.3 45.8 2,446.5
Deposits from customers, by customer type and country of registration, as at 30 June 2021
€m Total % of deposits Total
Individual customers 485.6 Estonia 97.0%
Business customers 733.4 Other EU countries 1.7%
Financial institutions 57.4 Other countries 1.3%
Public sector 264.0
Total 1,540.4 Total 100.0%

Luminor Bank AS Interim Report to 30 June 2021 17
Latvia
Loans to customers by Asset Quality, as at 30 June 2021
€m Stage 1 Stage 2 Stage 3 Total
Individual customers Gross carrying amount 1,399.6 96.2 68.9 1,564.7
Allowance for impairments -2.6 -5.4 -18.5 -26.5
Carrying amount 1,397.0 90.8 50.4 1,538.2
of which Mortgages Gross carrying amount 1,233.7 90.1 61.9 1,385.7
Allowance for impairments -2.0 -5.2 -16.9 -24.1
Carrying amount 1,231.7 84.9 45.0 1,361.6
Business customers Gross carrying amount 955.1 305.0 66.4 1,326.5
Allowance for impairments -0.5 -2.6 -18.5 -21.6
Carrying amount 954.6 302.4 47.9 1,304.9
Financial institutions Gross carrying amount 3.8 0.1 0.0 3.9
Allowance for impairments 0.0 0.0 0.0 0.0
Carrying amount 3.8 0.1 0.0 3.9
Public sector Gross carrying amount 43.0 0.4 0.0 43.4
Allowance for impairments 0.0 0.0 0.0 0.0
Carrying amount 43.0 0.4 0.0 43.4
Total Gross carrying amount 2,401.5 401.7 135.3 2,938.5
Allowance for impairments -3.1 -8.0 -37.0 -48.1
Carrying amount 2,398.4 393.7 98.3 2,890.4
Deposits from customers, by customer type and country of registration, as at 30 June 2021
€m Total % of deposits Total
Individual customers 1,426.8 Latvia 97.0%
Business customers 1,159.1 Other EU countries 1.9%
Financial institutions 74.7 Other countries 1.1%
Public sector 148.8
Total 2,809.4 Total 100.0%

18 Luminor Bank AS Interim Report to 30 June 2021
Lithuania
Loans to customers by Asset Quality, as at 30 June 2021
€m Stage 1 Stage 2 Stage 3 Total
Individual customers Gross carrying amount 2,587.7 87.7 25.3 2,700.7
Allowance for impairments -4.3 -3.6 -4.5 -12.4
Carrying amount 2,583.4 84.1 20.8 2,688.3
of which Mortgages Gross carrying amount 2,199.5 52.0 12.8 2,264.3
Allowance for impairments -2.9 -2.6 -1.4 -6.9
Carrying amount 2,196.6 49.4 11.4 2,257.4
Business customers Gross carrying amount 1,273.2 218.5 39.8 1,531.5
Allowance for impairments -3.8 -8.7 -17.3 -29.8
Carrying amount 1,269.4 209.8 22.5 1,501.7
Financial institutions Gross carrying amount 39.0 4.2 0.0 43.2
Allowance for impairments 0.0 -0.3 0.0 -0.3
Carrying amount 39.0 3.9 0.0 42.9
Public sector Gross carrying amount 71.2 0.0 0.0 71.2
Allowance for impairments 0.0 0.0 0.0 0.0
Carrying amount 71.2 0.0 0.0 71.2
Total Gross carrying amount 3,971.1 310.4 65.1 4,346.6
Allowance for impairments -8.1 -12.6 -21.8 -42.5
Carrying amount 3,963.0 297.8 43.3 4,304.1
Deposits from customers, by customer type and country of registration, as at 30 June 2021
€m Total % of deposits Total
Individual customers 2,622.2 Lithuania 97.8%
Business customers 2,036.8 Other EU countries 1.1%
Financial institutions 111.2 Other countries 1.1%
Public sector 1,512.5
Total 6,282.7 Total 100.0%
Luminor Bank AS Interim Report to 30 June 2021 19
Statement of the Management Board The interim report of Luminor Bank AS for the second quarter of 2021 consists of the following parts and reports:
• The Management Report;
• The Condensed Consolidated Interim Financial Statements.
The data and additional information presented in the interim report of Luminor Bank AS for the second quarter of 2021 are true and complete. The Condensed Consolidated Interim Financial Statements have been prepared according to the principles of the International Accounting Standard IAS 34 Interim Financial Reporting as adopted by the European Union and the requirements established by the Credit Institutions Act of the Republic of Estonia for the disclosure of information.
Luminor Bank AS and the Bank’s subsidiaries are going concerns.
Peter Bosek Chief Executive Officer and Chairman of the Management Board
Tallinn, 17 August 2021

20 Luminor Bank AS Interim Report to 30 June 2021
INTERIM FINANCIAL STATEMENTS CONDENSED CONSOLIDATED STATEMENT OF PROFIT OR LOSS AND OTHER COMPREHENSIVE INCOME €m Notes 2nd Quarter 1st Half FY
2020 2021 2020 2021 2020
Interest income calculated using the effective interest method 3 55.3 54.2 113.5 106.2 226.1
Other similar income 3 11.5 12.2 23.9 24.1 47.6
Interest and similar expense 3 -10.9 -6.1 -25.7 -13.4 -46.8
Net interest and similar income 55.9 60.3 111.7 116.9 226.9
Fee and commission income 4 21.8 25.2 46.1 47.7 95.8
Fee and commission expense 4 -6.4 -5.9 -12.9 -10.9 -22.2
Net fee and commission income 15.4 19.3 33.2 36.8 73.6
Net other financial income 5 6.9 5.3 14.7 9.8 27.7
Other operating income 3.2 0.0 3.8 0.9 6.4
Other operating expense -1.0 -2.7 -2.8 -5.3 -6.4
Net other operating income 9.1 2.6 15.7 5.4 27.7
Total operating income 80.4 82.2 160.6 159.1 328.2
Salaries and other personnel expenses -25.2 -24.1 -49.0 -49.7 -100.2
Other administrative expenses 6 -36.6 -41.2 -81.3 -83.1 -163.1
Depreciation, amortization and impairment -2.9 -3.0 -5.9 -6.0 -12.1
Total operating expenses -64.7 -68.3 -136.2 -138.8 -275.4
Share of profit from associates 0.3 0.6 0.7 1.0 1.0
Credit loss allowance, excluding off-balance sheet commitments 2, 7 -3.2 6.8 -29.6 7.3 -14.5
Credit loss allowance on off-balance sheet commitments 2, 7 -1.4 1.9 -3.0 1.3 -3.1
Other non-operating expenses 0.0 -0.1 -0.1 -0.3 -0.4
Profit before tax 11.4 23.1 -7.6 29.6 35.8
Tax expense 2.1 -1.6 -0.1 -2.3 -2.7
Profit or loss for the period 13.5 21.5 -7.7 27.3 33.1
Total other comprehensive income 0.0 0.0 0.0 0.0 0.0
Total comprehensive income 13.5 21.5 -7.7 27.3 33.1

Luminor Bank AS Interim Report to 30 June 2021 21
CONDENSED CONSOLIDATED BALANCE SHEET
€m Notes 30 June 2020
31 December 2020
30 June 2021
Assets
Cash and balances with central banks 2 3,293.7 4,926.5 3,600.8
Due from other credit institutions 103.4 103.6 74.7
Loans to customers 7 9,616.7 9,430.8 9,641.0
Debt securities 13 261.4 284.3 331.8
Derivative financial instruments 10 47.1 43.4 37.1
Equity instruments 13 4.0 2.8 3.5
Investments in associates 6.3 5.3 6.3
Intangible assets 8.2 6.7 11.1
Property, plant and equipment, etc. 64.1 56.6 49.1
Investment properties 1.1 0.6 0.3
Current tax assets 0.0 0.5 1.5
Deferred tax assets 6.7 9.4 10.7
Other assets 56.2 53.6 57.4
Non-current assets and disposal groups held for sale 0.1 0.0 0.0
Total assets 13,469.0 14,924.1 13,825.3
Liabilities
Loans and deposits from credit institutions 103.1 47.3 64.0
Deposits from customers 8 10,344.6 11,821.7 10,632.5
Debt securities issued 9 1,157.0 1,201.2 1,199.9
Derivative financial instruments 10 43.7 50.6 29.4
Tax liabilities 1.5 0.2 0.1
Lease liabilities 55.1 49.7 44.2
Other financial liabilities 11 61.6 14.7 91.9
Other liabilities 72.4 64.2 63.8
Provisions 6.8 9.3 8.0
Total liabilities 11,845.8 13,258.9 12,133.8
Shareholders’ equity
Issued capital 34.9 34.9 34.9
Share premium 1,412.2 1,412.2 1,412.2
Retained earnings 173.1 215.1 241.4
Other reserves 3.0 3.0 3.0
Total shareholders’ equity 1,623.2 1,665.2 1,691.5
Total liabilities and shareholders’ equity 13,469.0 14,924.1 13,825.3

22 Luminor Bank AS Interim Report to 30 June 2021
CONDENSED CONSOLIDATED STATEMENT OF CHANGES IN EQUITY
€m Share capital
Share premium
Retained earnings
Other reserves
Total equity
Balance as at 31 December 2019 34.9 1,412.2 183.9 1.2 1,632.2
Profit or loss for the period 0.0 0.0 -7.7 0.0 -7.7
Total comprehensive income 0.0 0.0 -7.7 0.0 -7.7
Transfer to mandatory reserve 0.0 0.0 -1.8 1.8 0.0
Other 0.0 0.0 -1.3 0.0 -1.3
Balance as at 30 June 2020 34.9 1,412.2 173.1 3.0 1,623.2
Balance as at 31 December 2019 34.9 1,412.2 183.9 1.2 1,632.2
Profit (-loss) for the period 0.0 0.0 33.1 0.0 33.1
Total comprehensive income 0.0 0.0 33.1 0.0 33.1
Transfer to mandatory reserve 0.0 0.0 -1.8 1.8 0.0
Other 0.0 0.0 -0.1 0.0 -0.1
Balance as at 31 December 2020 34.9 1,412.2 215.1 3.0 1,665.2
Balance as at 31 December 2020 34.9 1,412.2 215.1 3.0 1,665.2
Profit (-loss) for the period 0.0 0.0 27.3 0.0 27.3
Total comprehensive income 0.0 0.0 27.3 0.0 27.3
Dividends 0.0 0.0 -1.0 0.0 -1.0
Balance as at 30 June 2021 34.9 1,412.2 241.4 3.0 1,691.5
Luminor Bank AS Interim Report to 30 June 2021 23
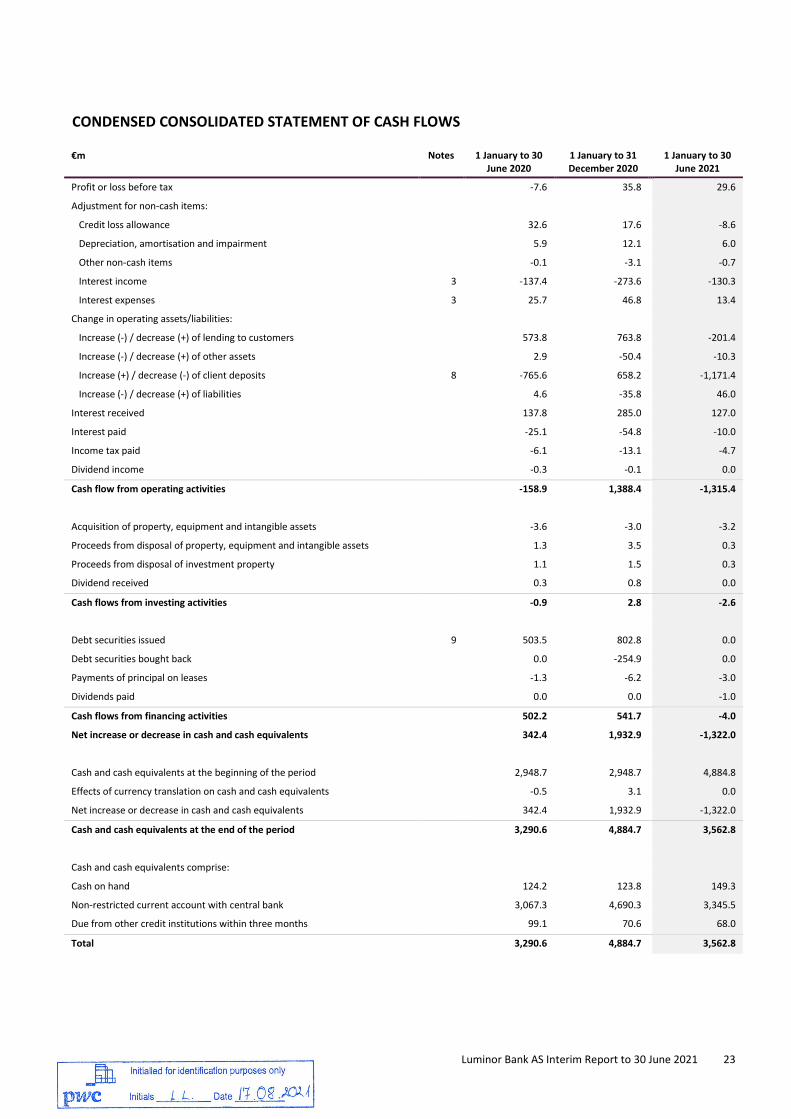
CONDENSED CONSOLIDATED STATEMENT OF CASH FLOWS
€m Notes 1 January to 30 June 2020
1 January to 31 December 2020
1 January to 30 June 2021
Profit or loss before tax -7.6 35.8 29.6
Adjustment for non-cash items:
Credit loss allowance 32.6 17.6 -8.6
Depreciation, amortisation and impairment 5.9 12.1 6.0
Other non-cash items -0.1 -3.1 -0.7
Interest income 3 -137.4 -273.6 -130.3
Interest expenses 3 25.7 46.8 13.4
Change in operating assets/liabilities:
Increase (-) / decrease (+) of lending to customers 573.8 763.8 -201.4
Increase (-) / decrease (+) of other assets 2.9 -50.4 -10.3
Increase (+) / decrease (-) of client deposits 8 -765.6 658.2 -1,171.4
Increase (-) / decrease (+) of liabilities 4.6 -35.8 46.0
Interest received 137.8 285.0 127.0
Interest paid -25.1 -54.8 -10.0
Income tax paid -6.1 -13.1 -4.7
Dividend income -0.3 -0.1 0.0
Cash flow from operating activities -158.9 1,388.4 -1,315.4
Acquisition of property, equipment and intangible assets -3.6 -3.0 -3.2
Proceeds from disposal of property, equipment and intangible assets 1.3 3.5 0.3
Proceeds from disposal of investment property 1.1 1.5 0.3
Dividend received 0.3 0.8 0.0
Cash flows from investing activities -0.9 2.8 -2.6
Debt securities issued 9 503.5 802.8 0.0
Debt securities bought back 0.0 -254.9 0.0
Payments of principal on leases -1.3 -6.2 -3.0
Dividends paid 0.0 0.0 -1.0
Cash flows from financing activities 502.2 541.7 -4.0
Net increase or decrease in cash and cash equivalents 342.4 1,932.9 -1,322.0
Cash and cash equivalents at the beginning of the period 2,948.7 2,948.7 4,884.8
Effects of currency translation on cash and cash equivalents -0.5 3.1 0.0
Net increase or decrease in cash and cash equivalents 342.4 1,932.9 -1,322.0
Cash and cash equivalents at the end of the period 3,290.6 4,884.7 3,562.8
Cash and cash equivalents comprise:
Cash on hand 124.2 123.8 149.3
Non-restricted current account with central bank 3,067.3 4,690.3 3,345.5
Due from other credit institutions within three months 99.1 70.6 68.0
Total 3,290.6 4,884.7 3,562.8

24 Luminor Bank AS Interim Report to 30 June 2021
NOTES TO THE CONDENSED CONSOLIDATED INTERIM FINANCIAL STATEMENTS
1. SIGNIFICANT ACCOUNTING POLICIES, ESTIMATES AND JUDGEMENTS
CORPORATE INFORMATION
Luminor Bank AS is a pan-Baltic credit institution whose headquarters are in Tallinn. Luminor Bank AS is owned by Luminor Holding AS, which is ultimately controlled by BCP VII, an investment fund managed by an affiliate of Blackstone Group Inc. Other shareholders of Luminor Holding AS - Nordea Bank Abp and DNB BANK ASA - are also considered to have significant influence over Luminor Holding AS.
BASIS OF PRESENTATION
The condensed consolidated interim financial information of Luminor Bank AS was prepared in accordance with IAS 34 Interim Financial Reporting as adopted by the European Union. The condensed consolidated interim financial information does not contain all the information and disclosures required in the annual financial statements and should be read in conjunction with the annual financial statements of Luminor Bank AS for the year ended 31 December 2020.
The accounting policies adopted in the preparation of the condensed consolidated interim financial information are consistent with those followed in the preparation of the Luminor Bank AS annual financial statements for the year ended 31 December 2020 (Annual Report 2020), except for the adoption of new standards effective as of 1 January 2021. Several amendments and interpretations are effective for the first time in 2021, but do not have a material impact on the interim condensed consolidated financial statements of Luminor. Luminor has not early adopted any standard, interpretation or amendment that has been issued but is not yet effective.
The financial information in this interim report is presented in the same format as in the Luminor Bank AS Annual Report 2020, except for several changes in classification as described below.
Change in presentation
Content of the Statement of Profit or Loss and Other Comprehensive Income, the Balance Sheet and the Statement of Cashflows has been reviewed for the Q2 2021 Interim Report. As a result, reclassifications have been made for better presentation of the financial information. Furthermore, to facilitate the presentation of the financial statements and provide additional insight on the comparative period, full results for the year ended 31 December 2020 were added. The full year results are not directly comparable to quarterly or half-year periods.
Reclassification of consolidated statements
Reclassification impacted the following Statement of Profit or Loss and Other Comprehensive Income items:
€m 2nd Quarter 2020 1st Half 2020
As restated Change As previously reported
As restated
Change As previously reported
Dividend income 0.0 -0.3 0.3 0.0 -0.3 0.3
Other operating income 3.2 0.3 2.9 3.8 0.3 3.5
To enhance the presentation of the primary financial statements certain positions related to other net income from the Luminor's financial assets/liabilities have been consolidated into “Net other financial income” position as is shown below:
Luminor Bank AS Interim Report to 30 June 2021 25
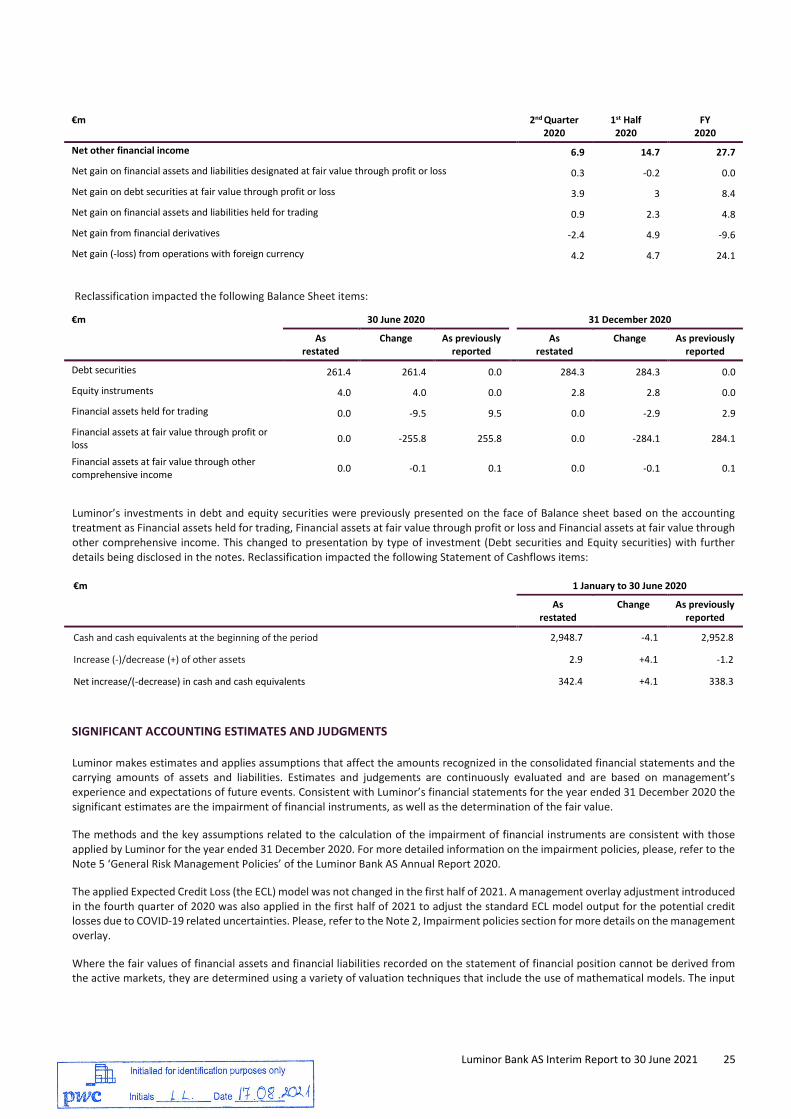
€m 2nd Quarter 2020
1st Half 2020
FY 2020
Net other financial income 6.9 14.7 27.7
Net gain on financial assets and liabilities designated at fair value through profit or loss 0.3 -0.2 0.0
Net gain on debt securities at fair value through profit or loss 3.9 3 8.4
Net gain on financial assets and liabilities held for trading 0.9 2.3 4.8
Net gain from financial derivatives -2.4 4.9 -9.6
Net gain (-loss) from operations with foreign currency 4.2 4.7 24.1
Reclassification impacted the following Balance Sheet items:
€m 30 June 2020 31 December 2020
As restated
Change As previously reported
As restated
Change As previously reported
Debt securities 261.4 261.4 0.0 284.3 284.3 0.0
Equity instruments 4.0 4.0 0.0 2.8 2.8 0.0
Financial assets held for trading 0.0 -9.5 9.5 0.0 -2.9 2.9
Financial assets at fair value through profit or loss 0.0 -255.8 255.8 0.0 -284.1 284.1
Financial assets at fair value through other comprehensive income 0.0 -0.1 0.1 0.0 -0.1 0.1
Luminor’s investments in debt and equity securities were previously presented on the face of Balance sheet based on the accounting treatment as Financial assets held for trading, Financial assets at fair value through profit or loss and Financial assets at fair value through other comprehensive income. This changed to presentation by type of investment (Debt securities and Equity securities) with further details being disclosed in the notes. Reclassification impacted the following Statement of Cashflows items:
€m 1 January to 30 June 2020
As restated
Change As previously reported
Cash and cash equivalents at the beginning of the period 2,948.7 -4.1 2,952.8
Increase (-)/decrease (+) of other assets 2.9 +4.1 -1.2
Net increase/(-decrease) in cash and cash equivalents 342.4 +4.1 338.3
SIGNIFICANT ACCOUNTING ESTIMATES AND JUDGMENTS
Luminor makes estimates and applies assumptions that affect the amounts recognized in the consolidated financial statements and the carrying amounts of assets and liabilities. Estimates and judgements are continuously evaluated and are based on management’s experience and expectations of future events. Consistent with Luminor’s financial statements for the year ended 31 December 2020 the significant estimates are the impairment of financial instruments, as well as the determination of the fair value.
The methods and the key assumptions related to the calculation of the impairment of financial instruments are consistent with those applied by Luminor for the year ended 31 December 2020. For more detailed information on the impairment policies, please, refer to the Note 5 ‘General Risk Management Policies’ of the Luminor Bank AS Annual Report 2020.
The applied Expected Credit Loss (the ECL) model was not changed in the first half of 2021. A management overlay adjustment introduced in the fourth quarter of 2020 was also applied in the first half of 2021 to adjust the standard ECL model output for the potential credit losses due to COVID-19 related uncertainties. Please, refer to the Note 2, Impairment policies section for more details on the management overlay.
Where the fair values of financial assets and financial liabilities recorded on the statement of financial position cannot be derived from the active markets, they are determined using a variety of valuation techniques that include the use of mathematical models. The input
26 Luminor Bank AS Interim Report to 30 June 2021
to these models is taken from observable markets where possible, but where this is not feasible, a degree of judgement is required in establishing fair values. For the fair value of financial assets and liabilities, please, refer to the Note 11.
2. GENERAL RISK MANAGEMENT POLICIES
CREDIT RISK
COVID-19
Luminor’s credit risk management and approach to address COVID-19 are described in detail in the Note 5 ‘General Risk Management Policies’ of the Luminor Bank AS Annual Report 2020. During the first half of 2021, the approach remained unchanged.
A key government support measures directly affecting the Luminor’s customers in the first half of 2021 was the moratoria agreements introduced in 2020 by the EBA and regulated by the EBA Guidelines on legislative and non-legislative moratoria on loan repayments applied in the light of COVID-19 (EBA/GL/2020/02). Luminor Bank AS joined the industry-wide private moratoria initiatives in each Baltic country, which comply with the EBA/GL/2020/02. Grace periods of COVID-19 affected and modified exposures have already ended for most of these exposures (ca. 94%). The grace periods for the remaining 6% of exposures (45 million EUR) will expire in 2021. The performance of customers after the end of grace periods is monitored, relative to the performance of customers without modifications. Modification gains / losses were immaterial during the current and comparative periods.
Impairment policies
Luminor recognises credit losses in accordance with the requirements of IFRS 9, which applies a forward-looking ECL approach. For more detailed information on the impairment policies, please, refer to the Note 5 ‘General Risk Management Policies’ of the Luminor Bank AS Annual Report 2020. During the first half of 2021, the impairment calculation model remained unchanged.
The three stages model is followed. For Stage 1 financial assets, loss allowances equal 12-month ECL, while for Stage 2 (including non-defaulted Purchased or Originated Credit Impaired (POCI) assets) and Stage 3 (including defaulted POCI assets), financial assets lifetime ECL is calculated. For Stage 3 financial assets which are classified as material, loss allowances are calculated on an individual basis.
A collective assessment of impairment is performed for all financial assets that are not defaulted as at the reporting date, i.e., are classified to either Stage 1 or Stage 2 or are non-defaulted POCI assets. The expected loss is calculated as the probability weighted average of losses expected in different macroeconomic scenarios. The expected loss in the concrete macroeconomic scenario is calculated as the multiple of PD, LGD, EAD and cumulative prepayment rate and is discounted using a discount rate.
Three macroeconomic variables – the annual change in real GDP, the rate of unemployment and the annual change of residential real estate prices – are included in the modelling for the individual customers' segment. Two of them – the annual change in real GDP together with the unemployment rate – are used for modelling the business customers’ segment.
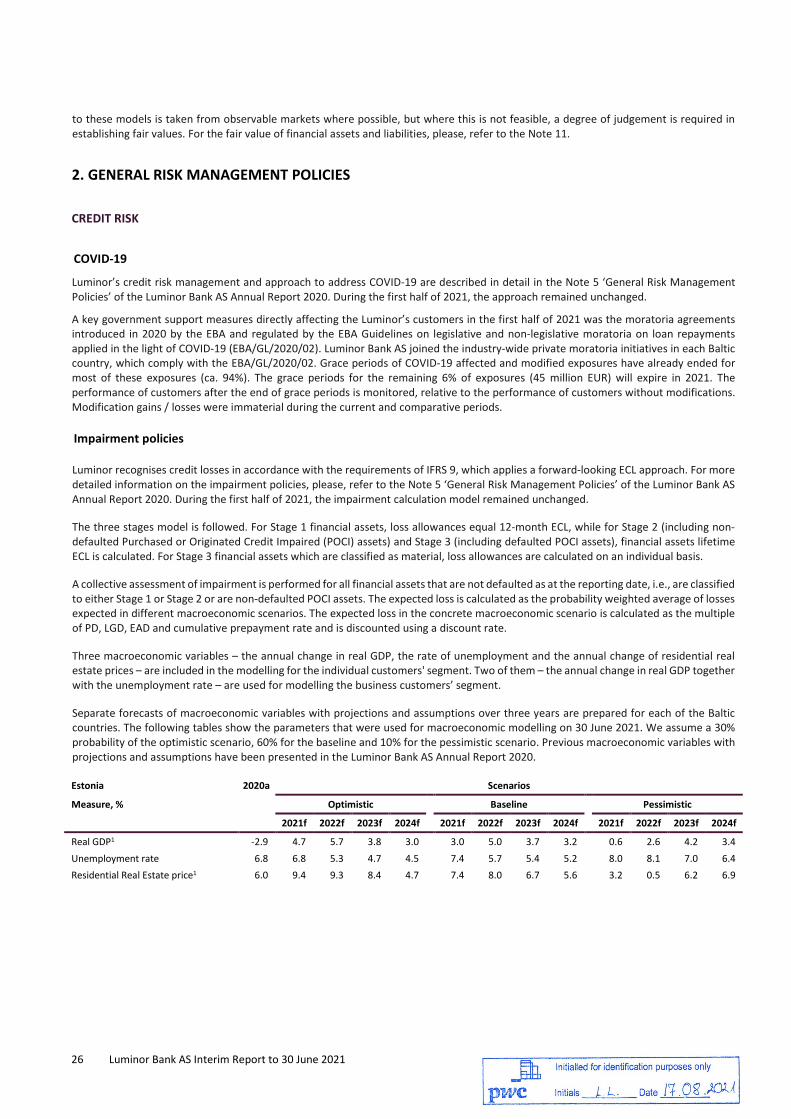
Separate forecasts of macroeconomic variables with projections and assumptions over three years are prepared for each of the Baltic countries. The following tables show the parameters that were used for macroeconomic modelling on 30 June 2021. We assume a 30% probability of the optimistic scenario, 60% for the baseline and 10% for the pessimistic scenario. Previous macroeconomic variables with projections and assumptions have been presented in the Luminor Bank AS Annual Report 2020.
Estonia 2020a Scenarios
Measure, % Optimistic Baseline Pessimistic
2021f 2022f 2023f 2024f 2021f 2022f 2023f 2024f 2021f 2022f 2023f 2024f
Real GDP1 -2.9 4.7 5.7 3.8 3.0 3.0 5.0 3.7 3.2 0.6 2.6 4.2 3.4 Unemployment rate 6.8 6.8 5.3 4.7 4.5 7.4 5.7 5.4 5.2 8.0 8.1 7.0 6.4 Residential Real Estate price1 6.0 9.4 9.3 8.4 4.7 7.4 8.0 6.7 5.6 3.2 0.5 6.2 6.9

Luminor Bank AS Interim Report to 30 June 2021 27
Latvia 2020a Scenarios
Measure, % Optimistic Baseline Pessimistic
2021f 2022f 2023f 2024f 2021f 2022f 2023f 2024f 2021f 2022f 2023f 2024f
Real GDP1 -3.6 4.2 7.6 5.6 2.8 2.8 6.2 4.9 2.8 0.1 3.7 5.0 2.5 Unemployment rate 8.1 7.0 5.7 4.9 4.8 7.5 6.8 5.8 5.4 8.6 9.4 7.4 6.4 Residential Real Estate price1 3.8 5.1 8.4 10.7 9.4 4.5 5.6 5.4 5.8 2.3 -1.9 5.8 5.5
Lithuania 2020a Scenarios
Measure, % Optimistic Baseline Pessimistic
2021f 2022f 2023f 2024f 2021f 2022f 2023f 2024f 2021f 2022f 2023f 2024f
Real GDP1 -0.8 6.0 5.7 4.9 3.0 4.6 4.2 4.0 2.9 0.9 1.9 3.6 2.6 Unemployment rate 8.5 7.4 5.3 5.3 5.6 8.4 6.9 6.3 6.0 9.7 9.3 7.7 6.8 Residential Real Estate price1 7.3 14.0 10.0 7.8 17.8 12.3 8.0 5.5 5.0 8.0 0.0 4.3 5.0
1. Annual change
The forecasts of macroeconomic variables over three years were reviewed in the second quarter of 2021 to reflect the outlook due to COVID-19. These, together with a review of historically observed default frequency levels performed at the same time, indicated additional reversals of ECLs as compared to the end of 2020.
However, given the unprecedented uncertainty caused by COVID-19, based on further analysis performed by the management we decided to maintain and further increase a management overlay in the quarter. The underlying reasons for the overlay, presented in the Luminor Bank AS Annual Report 2020, remained relevant. The further increase in amount of 7 million EUR was based on the concerns with regard to the spread of the delta variant, uncertainty over the efficacy of vaccines towards new variants, and new lock down restrictions applied in different parts of the world. Our decision was supported by the relative lack of effective early indicators to predict credit quality developments in the current crisis, no clear trend of customers’ post grace period behaviour, difficulties to reach herd immunity, and risks of inflation.
Material exposures are reviewed regularly. The regularity and deepness of the assessment is based on the risk level and size of the exposure. The aim of the follow-up is to identify a potential worsening of the situation and start early actions to improve the Luminor’s position, and to identify the occurrence of unlikeliness to pay criteria. Credit-impaired large exposures that are above materiality thresholds are reviewed every quarter or more frequently when individual circumstances require this. The valuation is updated when there are significant changes in cash flows, otherwise it is performed at least once a year.
For Stage 3 financial asset exposures (or defaulted POCI assets), which are classified as material, Luminor evaluates the impairment amount on an individual basis (individual assessment) under the discounted cash flows method, where both future cash flows from the customer’s operations and cash flows from collateral realization are considered. As a rule, two scenarios – base case and risk case – with certain probability weights are used. For exceptional cases one scenario can be used where only cash flow from collateral realization without any cash flow from operating activities is considered. The circumstances in which only one scenario may be acceptable could be a workout case.
For Stage 3 financial asset exposures (or defaulted POCI assets), which are classified as immaterial, Luminor evaluates the impairment amount on a collective basis (collective assessment defined by asset type). Impairment is calculated by applying the provision rate for the unsecured part. The unsecured part for impairment purposes is calculated using the collateral value capped to the exposure amount and afterwards discounted, eliminating situations when overcollateralized loans have an entirely secured part and result in zero impairment. Different provision rates for the unsecured part are applied for three homogeneous pools distinguished by Luminor, i.e., mortgage loans and private credits to individual customers, consumer loans and other loans to individual customers (including leasing), and loans to business customers.
Note 7 provides a summary of changes in the credit loss allowances and gross carrying amounts for loans to customers.

28 Luminor Bank AS Interim Report to 30 June 2021
MARKET RISK
Luminor has a low appetite for market risk. Based on internal risk self-assessment, the most significant parts of the market risk for Luminor are interest rate risk, credit spread risk and foreign exchange risk, which all stayed well within internal Risk Appetite Framework and lower-level limits. In the second quarter, Luminor has made significant improvements to its interest rate risk management (i.e., operational environment, measurements governance, and modelling), which allows the capture of underlying risks (e.g., optionality risk) more accurately and strengthen regulatory compliance. While interest rate risk stayed well within the Risk Appetite Framework limits, improved modelling resulted in higher interest risk estimates under certain rate scenarios in comparison to the previous quarter. The significance of other risks is lower as Luminor does not have any open positions in equity instruments for trading, and all commodity deals with customers are hedged with back-to-back transactions.
LIQUIDITY RISK
Liquidity risk is managed to ensure a constant ability to settle contractual obligations. Luminor has developed a set of early warning indicators, limits for a timely identification of liquidity issues, as well as business and funding contingency plans to manage Luminor’s liquidity during market disruptions. The liquidity risk management strategy is reviewed at least annually or after any significant change in the internal or external environment in which Luminor operates.
Liquidity risk management is focused on short term obligations and more structural long-term liquidity risk applying different internal and external metrics. Luminor uses a range of liquidity metrics for measuring, monitoring and controlling liquidity risk including the Liquidity Coverage Ratio (LCR), the Net Stable Funding Ratio (NSFR), internal liquidity limits for funding concentration, and the survival horizon metric as a part of the liquidity stress testing. Luminor’s liquidity position, despite the outflow of deposits due to deposit base optimization activities (e.g., introduction of negative rates on additional corporate deposits), has remained strong during the first half of the year. The outflow of deposits was one of the key drivers behind the reduction of Cash and balances with central banks as compared to the prior reporting period. Nevertheless, the liquidity metrics were within internal and external limits during the second quarter of 2021.
Luminor Bank AS Interim Report to 30 June 2021 29
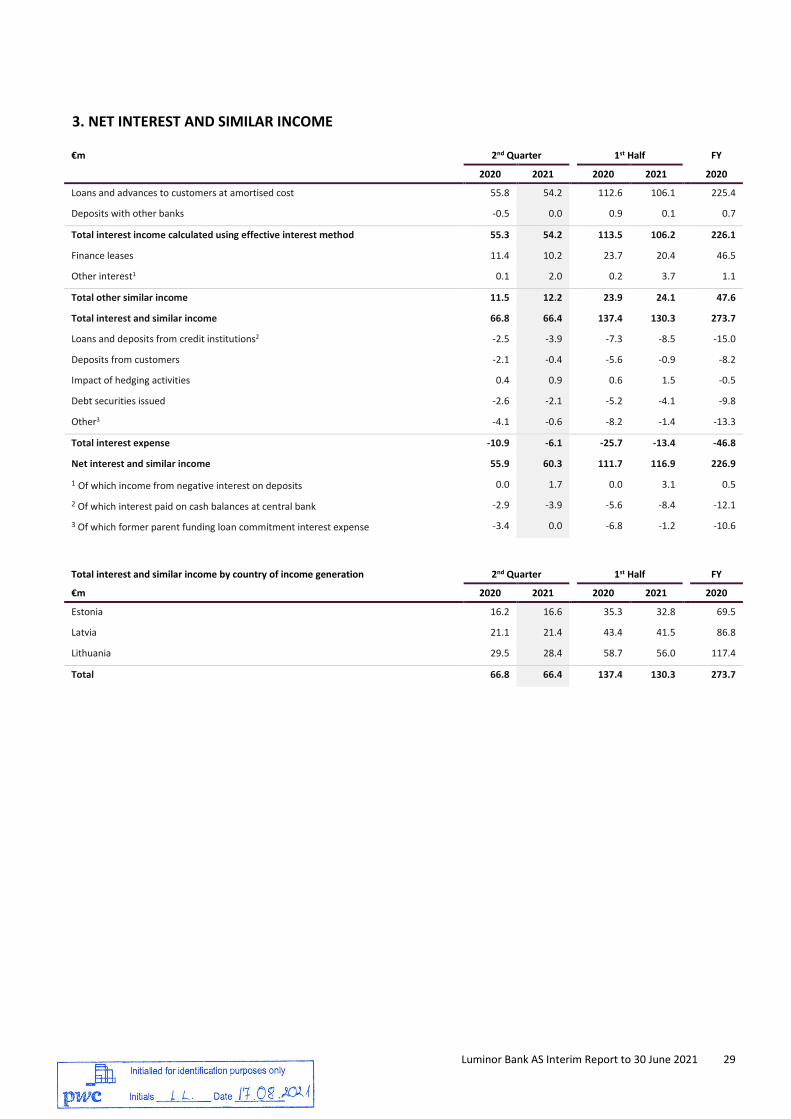
3. NET INTEREST AND SIMILAR INCOME
€m 2nd Quarter 1st Half FY
2020 2021 2020 2021 2020
Loans and advances to customers at amortised cost 55.8 54.2 112.6 106.1 225.4
Deposits with other banks -0.5 0.0 0.9 0.1 0.7
Total interest income calculated using effective interest method 55.3 54.2 113.5 106.2 226.1
Finance leases 11.4 10.2 23.7 20.4 46.5
Other interest1 0.1 2.0 0.2 3.7 1.1
Total other similar income 11.5 12.2 23.9 24.1 47.6
Total interest and similar income 66.8 66.4 137.4 130.3 273.7
Loans and deposits from credit institutions2 -2.5 -3.9 -7.3 -8.5 -15.0
Deposits from customers -2.1 -0.4 -5.6 -0.9 -8.2
Impact of hedging activities 0.4 0.9 0.6 1.5 -0.5
Debt securities issued -2.6 -2.1 -5.2 -4.1 -9.8
Other3 -4.1 -0.6 -8.2 -1.4 -13.3
Total interest expense -10.9 -6.1 -25.7 -13.4 -46.8
Net interest and similar income 55.9 60.3 111.7 116.9 226.9
1 Of which income from negative interest on deposits 0.0 1.7 0.0 3.1 0.5
2 Of which interest paid on cash balances at central bank -2.9 -3.9 -5.6 -8.4 -12.1
3 Of which former parent funding loan commitment interest expense -3.4 0.0 -6.8 -1.2 -10.6
Total interest and similar income by country of income generation 2nd Quarter 1st Half FY
€m 2020 2021 2020 2021 2020
Estonia 16.2 16.6 35.3 32.8 69.5
Latvia 21.1 21.4 43.4 41.5 86.8
Lithuania 29.5 28.4 58.7 56.0 117.4
Total 66.8 66.4 137.4 130.3 273.7
30 Luminor Bank AS Interim Report to 30 June 2021
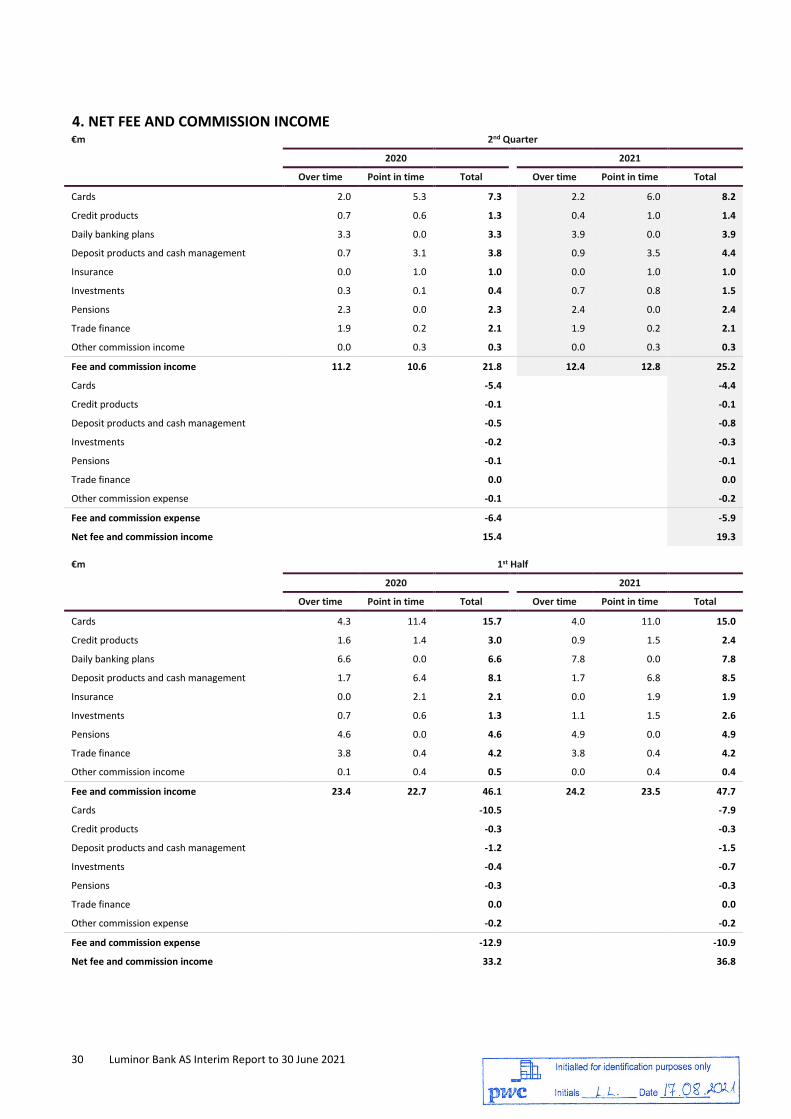
4. NET FEE AND COMMISSION INCOME€m 2nd Quarter
2020 2021
Over time Point in time Total Over time Point in time Total
Cards 2.0 5.3 7.3 2.2 6.0 8.2
Credit products 0.7 0.6 1.3 0.4 1.0 1.4
Daily banking plans 3.3 0.0 3.3 3.9 0.0 3.9
Deposit products and cash management 0.7 3.1 3.8 0.9 3.5 4.4
Insurance 0.0 1.0 1.0 0.0 1.0 1.0
Investments 0.3 0.1 0.4 0.7 0.8 1.5
Pensions 2.3 0.0 2.3 2.4 0.0 2.4
Trade finance 1.9 0.2 2.1 1.9 0.2 2.1
Other commission income 0.0 0.3 0.3 0.0 0.3 0.3
Fee and commission income 11.2 10.6 21.8 12.4 12.8 25.2
Cards -5.4 -4.4
Credit products -0.1 -0.1
Deposit products and cash management -0.5 -0.8
Investments -0.2 -0.3
Pensions -0.1 -0.1
Trade finance 0.0 0.0
Other commission expense -0.1 -0.2
Fee and commission expense -6.4 -5.9
Net fee and commission income 15.4 19.3
€m 1st Half
2020 2021
Over time Point in time Total Over time Point in time Total
Cards 4.3 11.4 15.7 4.0 11.0 15.0
Credit products 1.6 1.4 3.0 0.9 1.5 2.4
Daily banking plans 6.6 0.0 6.6 7.8 0.0 7.8
Deposit products and cash management 1.7 6.4 8.1 1.7 6.8 8.5
Insurance 0.0 2.1 2.1 0.0 1.9 1.9
Investments 0.7 0.6 1.3 1.1 1.5 2.6
Pensions 4.6 0.0 4.6 4.9 0.0 4.9
Trade finance 3.8 0.4 4.2 3.8 0.4 4.2
Other commission income 0.1 0.4 0.5 0.0 0.4 0.4
Fee and commission income 23.4 22.7 46.1 24.2 23.5 47.7
Cards -10.5 -7.9
Credit products -0.3 -0.3
Deposit products and cash management -1.2 -1.5
Investments -0.4 -0.7
Pensions -0.3 -0.3
Trade finance 0.0 0.0
Other commission expense -0.2 -0.2
Fee and commission expense -12.9 -10.9
Net fee and commission income 33.2 36.8
Luminor Bank AS Interim Report to 30 June 2021 31
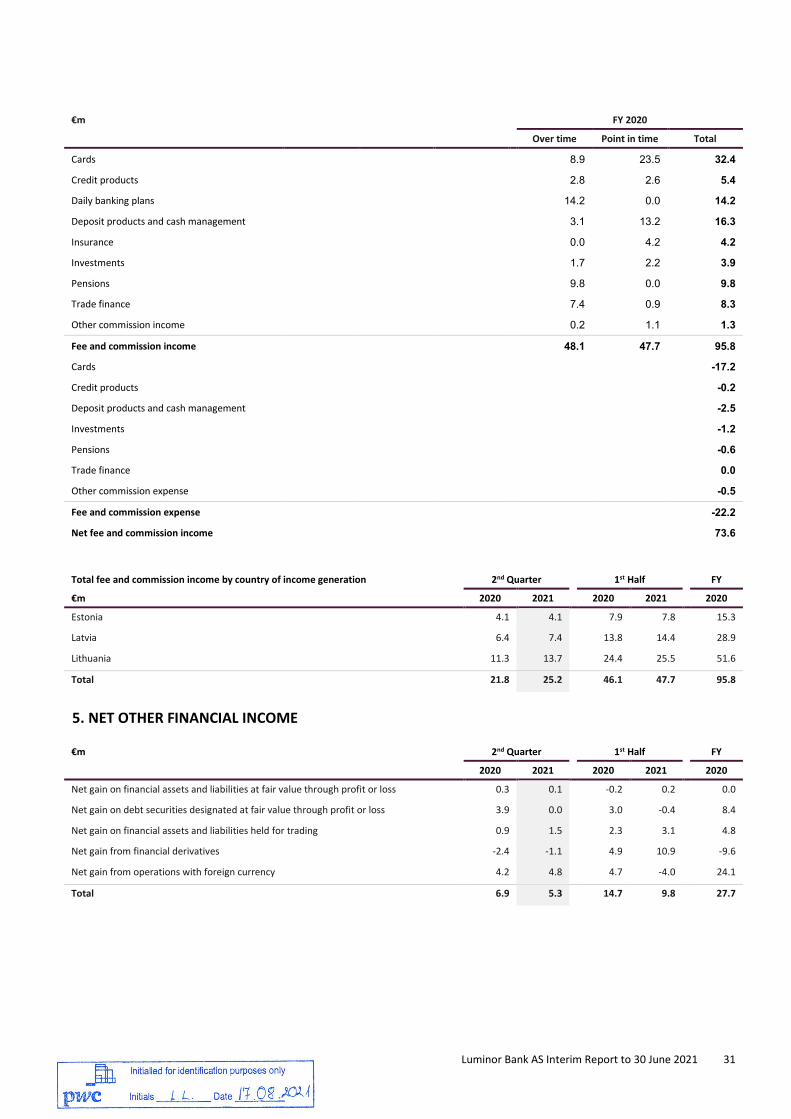
€m FY 2020
Over time Point in time Total
Cards 8.9 23.5 32.4
Credit products 2.8 2.6 5.4
Daily banking plans 14.2 0.0 14.2
Deposit products and cash management 3.1 13.2 16.3
Insurance 0.0 4.2 4.2
Investments 1.7 2.2 3.9
Pensions 9.8 0.0 9.8
Trade finance 7.4 0.9 8.3
Other commission income 0.2 1.1 1.3
Fee and commission income 48.1 47.7 95.8
Cards -17.2
Credit products -0.2
Deposit products and cash management -2.5
Investments -1.2
Pensions -0.6
Trade finance 0.0
Other commission expense -0.5
Fee and commission expense -22.2
Net fee and commission income 73.6
Total fee and commission income by country of income generation 2nd Quarter 1st Half FY
€m 2020 2021 2020 2021 2020
Estonia 4.1 4.1 7.9 7.8 15.3
Latvia 6.4 7.4 13.8 14.4 28.9
Lithuania 11.3 13.7 24.4 25.5 51.6
Total 21.8 25.2 46.1 47.7 95.8
5. NET OTHER FINANCIAL INCOME
€m 2nd Quarter 1st Half FY
2020 2021 2020 2021 2020
Net gain on financial assets and liabilities at fair value through profit or loss 0.3 0.1 -0.2 0.2 0.0
Net gain on debt securities designated at fair value through profit or loss 3.9 0.0 3.0 -0.4 8.4
Net gain on financial assets and liabilities held for trading 0.9 1.5 2.3 3.1 4.8
Net gain from financial derivatives -2.4 -1.1 4.9 10.9 -9.6
Net gain from operations with foreign currency 4.2 4.8 4.7 -4.0 24.1
Total 6.9 5.3 14.7 9.8 27.7
32 Luminor Bank AS Interim Report to 30 June 2021
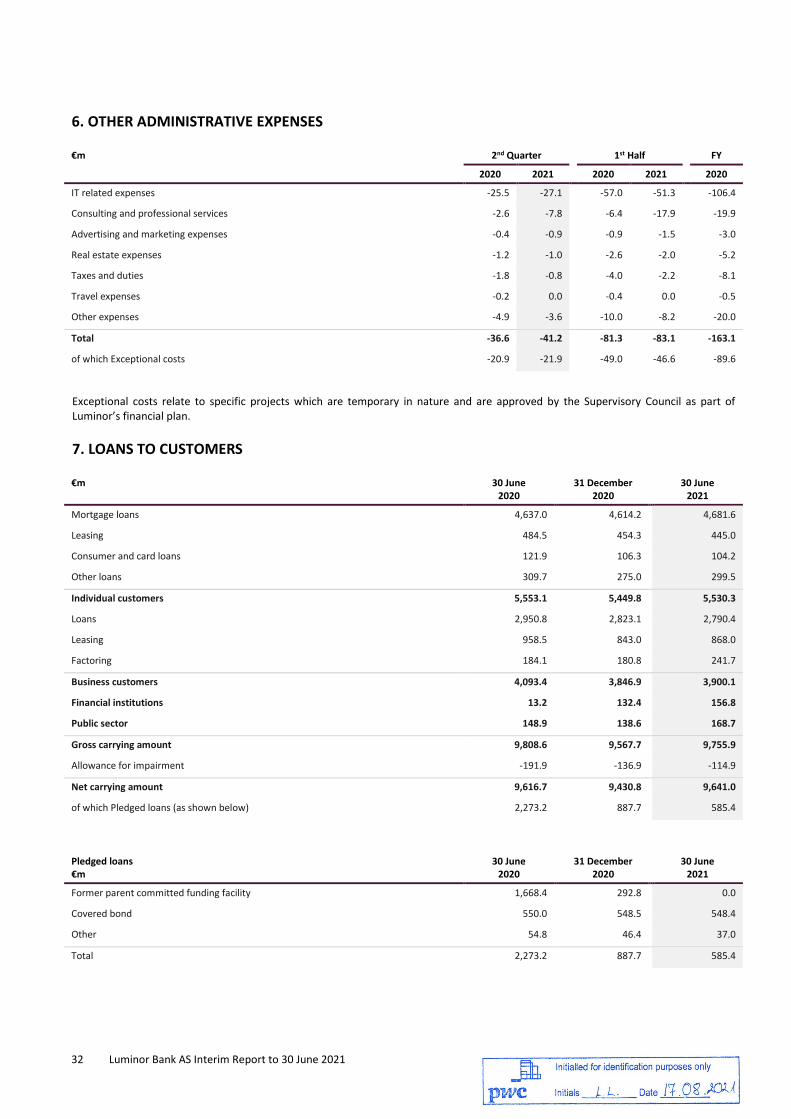
6. OTHER ADMINISTRATIVE EXPENSES
€m 2nd Quarter 1st Half FY
2020 2021 2020 2021 2020
IT related expenses -25.5 -27.1 -57.0 -51.3 -106.4
Consulting and professional services -2.6 -7.8 -6.4 -17.9 -19.9
Advertising and marketing expenses -0.4 -0.9 -0.9 -1.5 -3.0
Real estate expenses -1.2 -1.0 -2.6 -2.0 -5.2
Taxes and duties -1.8 -0.8 -4.0 -2.2 -8.1
Travel expenses -0.2 0.0 -0.4 0.0 -0.5
Other expenses -4.9 -3.6 -10.0 -8.2 -20.0
Total -36.6 -41.2 -81.3 -83.1 -163.1
of which Exceptional costs -20.9 -21.9 -49.0 -46.6 -89.6
Exceptional costs relate to specific projects which are temporary in nature and are approved by the Supervisory Council as part of Luminor’s financial plan.
7. LOANS TO CUSTOMERS
€m 30 June 2020
31 December 2020
30 June 2021
Mortgage loans 4,637.0 4,614.2 4,681.6
Leasing 484.5 454.3 445.0
Consumer and card loans 121.9 106.3 104.2
Other loans 309.7 275.0 299.5
Individual customers 5,553.1 5,449.8 5,530.3
Loans 2,950.8 2,823.1 2,790.4
Leasing 958.5 843.0 868.0
Factoring 184.1 180.8 241.7
Business customers 4,093.4 3,846.9 3,900.1
Financial institutions 13.2 132.4 156.8
Public sector 148.9 138.6 168.7
Gross carrying amount 9,808.6 9,567.7 9,755.9
Allowance for impairment -191.9 -136.9 -114.9
Net carrying amount 9,616.7 9,430.8 9,641.0
of which Pledged loans (as shown below) 2,273.2 887.7 585.4
Pledged loans €m
30 June 2020
31 December 2020
30 June 2021
Former parent committed funding facility 1,668.4 292.8 0.0
Covered bond 550.0 548.5 548.4
Other 54.8 46.4 37.0
Total 2,273.2 887.7 585.4

Luminor Bank AS Interim Report to 30 June 2021 33
Loans to customers by country of registration €m
30 June 2020
31 December 2020
30 June 2021
Estonia, Latvia, and Lithuania 9,344.5 9,188.3 9,370.9
Other EU countries 202.8 175.6 186.1
Other countries 69.4 66.9 84.0
Total 9,616.7 9,430.8 9,641.0
Loans to customers by gross carrying amount and expected credit loss allowance
30 June 2020 €m
Gross carrying amount
Allowance for impairment
Net carrying amount
Mortgage loans 4,637.0 -57.7 4,579.3
Leasing 484.5 -4.3 480.2
Consumer and card loans 121.9 -1.5 120.4
Other loans 309.7 -12.9 296.8
Individual customers 5,553.1 -76.4 5,476.7
Loans 2,950.8 -96.1 2,854.7
Leasing 958.5 -17.2 941.3
Factoring 184.1 -2.0 182.1
Business customers 4,093.4 -115.3 3,978.1
Financial institutions 13.2 -0.2 13.0
Public sector 148.9 0.0 148.9
Total 9,808.6 -191.9 9,616.7
31 December 2020 €m
Gross carrying amount
Allowance for impairment
Net carrying amount
Mortgage loans 4,614.2 -44.2 4,570.0
Leasing 454.3 -4.1 450.2
Consumer and card loans 106.3 -1.1 105.2
Other loans 275.0 -8.9 266.1
Individual customers 5,449.8 -58.3 5,391.5
Loans 2,823.1 -61.7 2,761.4
Leasing 843.0 -14.3 828.7
Factoring 180.8 -2.1 178.7
Business customers 3,846.9 -78.1 3,768.8
Financial institutions 132.4 -0.5 131.9
Public sector 138.6 0.0 138.6
Total 9,567.7 -136.9 9,430.8

34 Luminor Bank AS Interim Report to 30 June 2021
30 June 2021 €m
Gross carrying amount
Allowance for impairment
Net carrying amount
Mortgage loans 4,681.6 -36.7 4,644.9
Leasing 445.0 -3.4 441.6
Consumer and card loans 104.2 -0.8 103.4
Other loans 299.5 -5.9 293.6
Individual customers 5,530.3 -46.8 5,483.5
Loans 2,790.4 -51.9 2,738.5
Leasing 868.0 -14.0 854.0
Factoring 241.7 -1.5 240.2
Business customers 3,900.1 -67.4 3,832.7
Financial institutions 156.8 -0.7 156.1
Public sector 168.7 0.0 168.7
Total 9,755.9 -114.9 9,641.0
Loans to customers by risk category and stage
The credit quality of loans to customers is disclosed in the tables below according to our internal risk scale and methodology, the details of which have been disclosed in the Luminor Bank AS Annual Report 2020.
Loans to customers total
30 June 2020, €m Stage 1 Stage 2 Stage 3 POCI Total
Low risk 5,022.2 85.2 0.0 3.5 5,110.9
Moderate risk 2,824.6 846.4 0.0 14.7 3,685.7
High risk 137.8 459.4 0.0 21.0 618.2
Default 0.0 0.0 370.9 22.9 393.8
Gross carrying amount 7,984.6 1,391.0 370.9 62.1 9,808.6
Allowance for impairment -21.8 -32.7 -132.9 -4.5 -191.9
Net carrying amount 7,962.8 1,358.3 238.0 57.6 9,616.7
31 December 2020, €m Stage 1 Stage 2 Stage 3 POCI Total
Low risk 5,091.2 63.7 0.0 3.5 5,158.4
Moderate risk 2,721.0 868.2 0.0 12.6 3,601.8
High risk 146.1 334.3 0.0 21.7 502.1
Default 0.0 0.0 288.2 17.2 305.4
Gross carrying amount 7,958.3 1,266.2 288.2 55.0 9,567.7
Allowance for impairment -21.3 -23.1 -89.1 -3.4 -136.9
Net carrying amount 7,937.0 1,243.1 199.1 51.6 9,430.8
Luminor Bank AS Interim Report to 30 June 2021 35
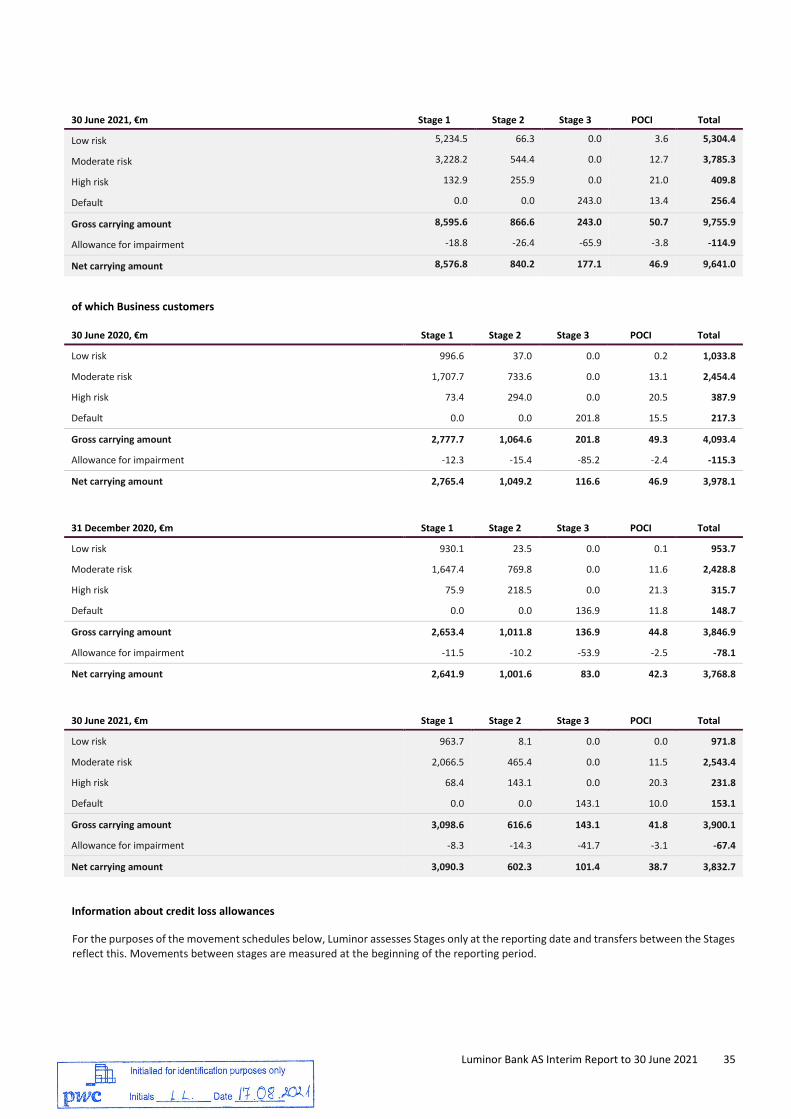
30 June 2021, €m Stage 1 Stage 2 Stage 3 POCI Total
Low risk 5,234.5 66.3 0.0 3.6 5,304.4
Moderate risk 3,228.2 544.4 0.0 12.7 3,785.3
High risk 132.9 255.9 0.0 21.0 409.8
Default 0.0 0.0 243.0 13.4 256.4
Gross carrying amount 8,595.6 866.6 243.0 50.7 9,755.9
Allowance for impairment -18.8 -26.4 -65.9 -3.8 -114.9
Net carrying amount 8,576.8 840.2 177.1 46.9 9,641.0
of which Business customers
30 June 2020, €m Stage 1 Stage 2 Stage 3 POCI Total
Low risk 996.6 37.0 0.0 0.2 1,033.8
Moderate risk 1,707.7 733.6 0.0 13.1 2,454.4
High risk 73.4 294.0 0.0 20.5 387.9
Default 0.0 0.0 201.8 15.5 217.3
Gross carrying amount 2,777.7 1,064.6 201.8 49.3 4,093.4
Allowance for impairment -12.3 -15.4 -85.2 -2.4 -115.3
Net carrying amount 2,765.4 1,049.2 116.6 46.9 3,978.1
31 December 2020, €m Stage 1 Stage 2 Stage 3 POCI Total
Low risk 930.1 23.5 0.0 0.1 953.7
Moderate risk 1,647.4 769.8 0.0 11.6 2,428.8
High risk 75.9 218.5 0.0 21.3 315.7
Default 0.0 0.0 136.9 11.8 148.7
Gross carrying amount 2,653.4 1,011.8 136.9 44.8 3,846.9
Allowance for impairment -11.5 -10.2 -53.9 -2.5 -78.1
Net carrying amount 2,641.9 1,001.6 83.0 42.3 3,768.8
30 June 2021, €m Stage 1 Stage 2 Stage 3 POCI Total
Low risk 963.7 8.1 0.0 0.0 971.8
Moderate risk 2,066.5 465.4 0.0 11.5 2,543.4
High risk 68.4 143.1 0.0 20.3 231.8
Default 0.0 0.0 143.1 10.0 153.1
Gross carrying amount 3,098.6 616.6 143.1 41.8 3,900.1
Allowance for impairment -8.3 -14.3 -41.7 -3.1 -67.4
Net carrying amount 3,090.3 602.3 101.4 38.7 3,832.7
Information about credit loss allowances
For the purposes of the movement schedules below, Luminor assesses Stages only at the reporting date and transfers between the Stages reflect this. Movements between stages are measured at the beginning of the reporting period.

36 Luminor Bank AS Interim Report to 30 June 2021
Loans to customers total
€m Credit loss allowance Gross carrying amount
Stage 1 Stage 2 Stage 3 POCI Total Stage 1 Stage 2 Stage 3 POCI Total
As at 31 December 2019 -16.5 -25.9 -138.9 -4.4 -185.7 9,131.1 846.1 364.9 66.1 10,408.2
Movements with impact on credit loss allowances Transfers within Stages:
to Stage 2 3.8 -6.7 2.9 0.0 0.0 -853.6 871.7 -18.1 0.0 0.0
to Stage 3 0.9 2.7 -3.6 0.0 0.0 -43.9 -63.7 107.6 0.0 0.0
to Stage 1 -5.6 4.3 1.3 0.0 0.0 114.0 -104.3 -9.7 0.0 0.0
Originated or purchased -4.9 0.0 0.0 0.0 -4.9 566.1 0.0 0.0 0.1 566.2
Derecognised and repaid 1.8 2.4 14.4 0.1 18.7 -929.0 -158.8 -50.7 -3.9 -1,142.4
Changes to ECL model assumptions and effect from changes in Stages
-1.4 -9.5 -32.0 -0.5 -43.4 0.0 0.0 0.0 0.0 0.0
Total -5.4 -6.8 -17.0 -0.4 -29.6 -1,146.4 544.9 29.1 -3.8 -576.2
Movements without impact on credit loss allowances
Write-offs 0.0 0.0 23.1 0.3 23.4 0.0 0.0 -23.1 -0.3 -23.4
As at 30 June 20201 -21.9 -32.7 -132.8 -4.5 -191.9 7,984.7 1,391.0 370.9 62.0 9,808.6 1 Out of total POCI loans credit loss allowances -0.3 million EUR is in non-credit-impaired and -4.2 million EUR is in credit-impaired, gross carrying amount 39.1 million EUR is in non-credit-impaired and 22.9 million EUR in credit-impaired.
€m Credit loss allowance Gross carrying amount
Stage 1 Stage 2 Stage 3 POCI Total Stage 1 Stage 2 Stage 3 POCI Total
As at 31 December 2019 -16.5 -25.9 -138.9 -4.4 -185.7 9,131.1 846.1 364.9 66.1 10,408.2
Movements with impact on credit loss allowances Transfers within Stages:
to Stage 2 4.2 -7.0 2.8 0.0 0.0 -907.2 924.3 -17.1 0.0 0.0
to Stage 3 2.4 3.5 -5.9 0.0 0.0 -62.8 -74.5 137.3 0.0 0.0
to Stage 1 -7.8 6.4 1.4 0.0 0.0 195.2 -181.0 -14.2 0.0 0.0
Originated or purchased -11.6 0.0 0.0 0.0 -11.6 1,504.7 0.0 0.0 0.3 1,505.0
Derecognised and repaid 3.4 4.0 11.3 0.2 18.9 -1,902.7 -248.7 -121.2 -9.6 -2,282.2
Changes to ECL model assumptions and effect from changes in Stages
17.2 4.3 -21.3 -1.0 -0.8 0.0 0.0 0.0 0.0 0.0
Management overlay adjustment
-12.5 -8.4 0.0 -0.1 -21.0 0.0 0.0 0.0 0.0 0.0
Total -4.7 2.8 -11.7 -0.9 -14.5 -1,172.8 420.1 -15.2 -9.3 -777.2
Movements without impact on credit loss allowances
Write-offs 0.0 0.0 61.5 1.8 63.3 0.0 0.0 -61.5 -1.8 -63.3
As at 31 December 20201 -21.2 -23.1 -89.1 -3.5 -136.9 7,958.3 1,266.2 288.2 55.0 9,567.7 1 Out of total POCI loans credit loss allowances -0.2 million EUR is in non-credit-impaired and -3.3 million EUR is in credit-impaired, gross carrying amount 37.8 million EUR is in non-credit-impaired and 17.2 million EUR in credit-impaired.

Luminor Bank AS Interim Report to 30 June 2021 37
€m Credit loss allowance Gross carrying amount
Stage 1 Stage 2 Stage 3 POCI Total Stage 1 Stage 2 Stage 3 POCI Total
As at 31 December 2020 -21.2 -23.1 -89.1 -3.5 -136.9 7,958.3 1,266.2 288.2 55.0 9,567.7
Movements with impact on credit loss allowances Transfers within Stages:
to Stage 2 1.2 -5.8 4.6 0.0 0.0 -181.0 216.8 -35.8 0.0 0.0
to Stage 3 2.5 1.2 -3.7 0.0 0.0 -23.0 -56.3 79.3 0.0 0.0
to Stage 1 -7.7 5.9 1.8 0.0 0.0 314.8 -302.7 -12.1 0.0 0.0
Originated or purchased -9.6 0.0 0.0 0.0 -9.6 1,152.0 0.0 0.0 5.8 1,157.8
Derecognised and repaid 1.1 1.7 20.7 0.0 23.5 -625.5 -257.4 -62.1 -9.8 -954.8
Changes to ECL model assumptions and effect from changes in Stages
15.0 0.7 -14.6 -0.7 0.4 0.0 0.0 0.0 0.0 0.0
Management overlay adjustment
-0.1 -7.0 0.0 0.0 -7.1 0.0 0.0 0.0 0.0 0.0
Total 2.4 -3.3 8.8 -0.7 7.2 637.3 -399.6 -30.7 -4.0 203.0
Movements without impact on credit loss allowances
Write-offs 0.0 0.0 14.5 0.3 14.8 0.0 0.0 -14.5 -0.3 -14.8
As at 30 June 20211 -18.8 -26.4 -65.8 -3.9 -114.9 8,595.6 866.6 243.0 50.7 9,755.9
1 Out of total POCI loans credit loss allowances -0.6 million EUR is in non-credit-impaired and -3.2 million EUR is in credit-impaired, gross carrying amount 37.2 million EUR is in non-credit-impaired and 13.5 million EUR in credit-impaired.
of which Business customers
€m Credit loss allowance Gross carrying amount
Stage 1 Stage 2 Stage 3 POCI Total Stage 1 Stage 2 Stage 3 POCI Total
As at 31 December 2019 -7.9 -7.2 -93.8 -2.1 -111.0 3,743.1 526.8 202.0 51.3 4,523.2
Movements with impact on credit loss allowances Transfers within Stages:
to Stage 2 2.9 -3.4 0.5 0.0 0.0 -741.6 743.4 -1.8 0.0 0.0
to Stage 3 0.6 0.3 -0.9 0.0 0.0 -25.1 -36.7 61.8 0.0 0.0
to Stage 1 -1.0 0.6 0.4 0.0 0.0 38.2 -36.8 -1.4 0.0 0.0
Originated or purchased -3.5 0.0 0.0 0.0 -3.5 332.5 0.0 0.0 0.0 332.5
Derecognised and repaid 1.3 0.8 11.8 0.0 13.9 -569.3 -132.1 -37.8 -1.9 -741.1
Changes to ECL model assumptions and effect from changes in Stages
-4.6 -6.6 -24.3 -0.4 -35.9 0.0 0.0 0.0 0.0 0.0
Total -4.3 -8.3 -12.5 -0.4 -25.5 -965.3 537.8 20.8 -1.9 -408.6
Movements without impact on credit loss allowances
Write-offs 0.0 0.0 21.1 0.1 21.2 0.0 0.0 -21.1 -0.1 -21.2
As at 30 June 2020 -12.2 -15.5 -85.2 -2.4 -115.3 2,777.8 1,064.6 201.7 49.3 4,093.4
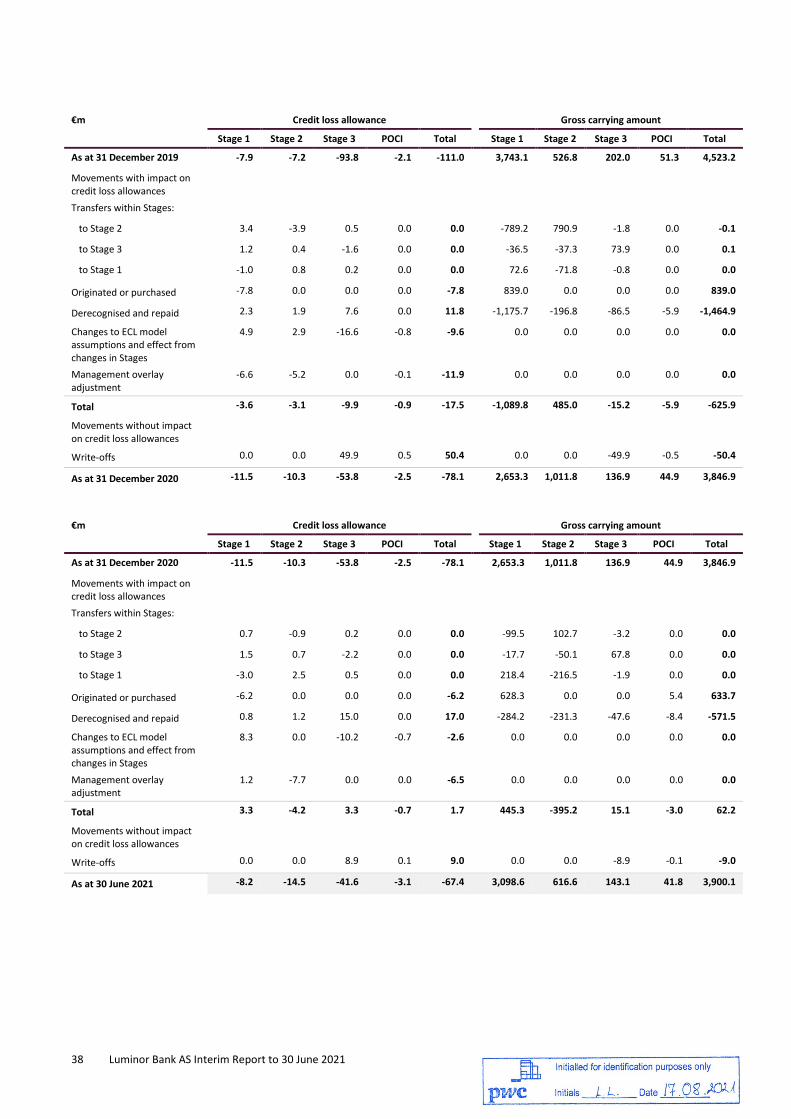
38 Luminor Bank AS Interim Report to 30 June 2021
€m Credit loss allowance Gross carrying amount
Stage 1 Stage 2 Stage 3 POCI Total Stage 1 Stage 2 Stage 3 POCI Total
As at 31 December 2019 -7.9 -7.2 -93.8 -2.1 -111.0 3,743.1 526.8 202.0 51.3 4,523.2
Movements with impact on credit loss allowances Transfers within Stages:
to Stage 2 3.4 -3.9 0.5 0.0 0.0 -789.2 790.9 -1.8 0.0 -0.1
to Stage 3 1.2 0.4 -1.6 0.0 0.0 -36.5 -37.3 73.9 0.0 0.1
to Stage 1 -1.0 0.8 0.2 0.0 0.0 72.6 -71.8 -0.8 0.0 0.0
Originated or purchased -7.8 0.0 0.0 0.0 -7.8 839.0 0.0 0.0 0.0 839.0
Derecognised and repaid 2.3 1.9 7.6 0.0 11.8 -1,175.7 -196.8 -86.5 -5.9 -1,464.9
Changes to ECL model assumptions and effect from changes in Stages
4.9 2.9 -16.6 -0.8 -9.6 0.0 0.0 0.0 0.0 0.0
Management overlay adjustment
-6.6 -5.2 0.0 -0.1 -11.9 0.0 0.0 0.0 0.0 0.0
Total -3.6 -3.1 -9.9 -0.9 -17.5 -1,089.8 485.0 -15.2 -5.9 -625.9
Movements without impact on credit loss allowances
Write-offs 0.0 0.0 49.9 0.5 50.4 0.0 0.0 -49.9 -0.5 -50.4
As at 31 December 2020 -11.5 -10.3 -53.8 -2.5 -78.1 2,653.3 1,011.8 136.9 44.9 3,846.9
€m Credit loss allowance Gross carrying amount
Stage 1 Stage 2 Stage 3 POCI Total Stage 1 Stage 2 Stage 3 POCI Total
As at 31 December 2020 -11.5 -10.3 -53.8 -2.5 -78.1 2,653.3 1,011.8 136.9 44.9 3,846.9
Movements with impact on credit loss allowances Transfers within Stages:
to Stage 2 0.7 -0.9 0.2 0.0 0.0 -99.5 102.7 -3.2 0.0 0.0
to Stage 3 1.5 0.7 -2.2 0.0 0.0 -17.7 -50.1 67.8 0.0 0.0
to Stage 1 -3.0 2.5 0.5 0.0 0.0 218.4 -216.5 -1.9 0.0 0.0
Originated or purchased -6.2 0.0 0.0 0.0 -6.2 628.3 0.0 0.0 5.4 633.7
Derecognised and repaid 0.8 1.2 15.0 0.0 17.0 -284.2 -231.3 -47.6 -8.4 -571.5
Changes to ECL model assumptions and effect from changes in Stages
8.3 0.0 -10.2 -0.7 -2.6 0.0 0.0 0.0 0.0 0.0
Management overlay adjustment
1.2 -7.7 0.0 0.0 -6.5 0.0 0.0 0.0 0.0 0.0
Total 3.3 -4.2 3.3 -0.7 1.7 445.3 -395.2 15.1 -3.0 62.2
Movements without impact on credit loss allowances
Write-offs 0.0 0.0 8.9 0.1 9.0 0.0 0.0 -8.9 -0.1 -9.0
As at 30 June 2021 -8.2 -14.5 -41.6 -3.1 -67.4 3,098.6 616.6 143.1 41.8 3,900.1

Luminor Bank AS Interim Report to 30 June 2021 39
Loans to customers by economic sectors €m
30 June 2020
31 December 2020
30 June 2021
Individual customers 5,476.7 5,391.5 5,483.5
Real estate activities 1,140.1 1,161.6 1,144.4
Wholesale and retail trade 720.9 705.8 678.9
Manufacturing 482.2 456.2 510.6
Transport and storage 339.0 308.3 309.0
Agriculture, forestry and fishing 314.3 272.3 292.8
Construction 184.7 151.6 194.5
Professional, scientific and technical activities 222.7 179.8 183.6
Administrative and support service activities 186.9 190.0 177.8
Electricity, gas, steam and air conditioning supply 122.0 117.9 89.2
Other services 265.3 225.3 251.9
Business customers 3,978.1 3,768.8 3,832.7
Financial institutions 13.0 131.9 156.1
Public sector 148.9 138.6 168.7
Total 9,616.7 9,430.8 9,641.0
8. DEPOSITS FROM CUSTOMERS
€m 30 June 2020
31 December 2020
30 June 2021
Term deposits 1,907.7 1,087.0 898.5
Demand deposits 8,436.9 10,734.7 9,734.0
Total 10,344.6 11,821.7 10,632.5
Deposits from customers by type of customers €m
30 June 2020
31 December 2020
30 June 2021
Individual customers 4,048.3 4,509.4 4,534.6
Business customers and Financial institutions 4,095.1 4,617.9 4,172.6
Public sector 2,201.2 2,694.4 1,925.3
Total 10,344.6 11,821.7 10,632.5
Deposits from customers by country of registration €m
30 June 2020
31 December 2020
30 June 2021
Estonia, Latvia, and Lithuania 10,117.6 11,614.2 10,414.8
Other EU countries 152.2 110.5 95.1
Other countries 74.8 97.0 122.6
Total 10,344.6 11,821.7 10,632.5

40 Luminor Bank AS Interim Report to 30 June 2021
9. DEBT SECURITIES ISSUED
€m First call date Maturity date Nominal amount Carrying amount
30 June 2020
31 December 2020
30 June 2021
1.5% senior bond October 2021 99.3 353.5 100.1 100.4
1.375% senior bond October 2022 300.0 303.2 301.6 303.5
0.01% covered bond March 2025 500.0 500.3 502.0 498.2
0.792% senior bond December 2023 December 2024 300.0 0.0 297.5 297.8
Total 1,199.3 1,157.0 1,201.2 1,199.9
10. DERIVATIVE FINANCIAL INSTRUMENTS
30 June 2020 Notional Fair values €m amounts Assets Liabilities
Interest rate-related contracts 3,427.6 18.5 12.3
Currency-related contracts 1,280.2 26.4 28.6
Commodity-related contracts 28.0 2.2 2.8
Total 4,735.8 47.1 43.7
31 December 2020 Notional Fair values
€m amounts Assets Liabilities
Interest rate-related contracts 2,879.4 13.1 11.5
Currency-related contracts 1,147.1 28.8 37.6
Commodity-related contracts 12.8 1.5 1.5
Total 4,039.3 43.4 50.6
30 June 2021 Notional Fair values €m amounts Assets Liabilities
Interest rate-related contracts 2,578.1 10.9 7.2
Currency-related contracts 1,072.5 20.9 17.1
Commodity-related contracts 20.2 5.3 5.1
Total 3,670.8 37.1 29.4
Hedge accounting Luminor applies hedge accounting only to fair value hedges of issued debt securities. To test hedge effectiveness, Luminor uses the hypothetical derivative method and compares the changes in the fair value of the hedging instrument against the changes in the fair value of the hedged item attributable to the hedged risk. Ineffectiveness was clearly immaterial as at 30 June 2020, 31 December 2020 and 30 June 2021. The carrying amount of the derivatives is included in line item ‘Assets: Derivative financial instruments’ in the statement of financial position. The notional and fair value of hedging instruments are:
Interest rate swaps €m
30 June 2020
31 December 2020
30 June 2021
Notional amount 1,150.0 1,100.0 1,100.0
Carrying amount 9.3 5.3 4.5
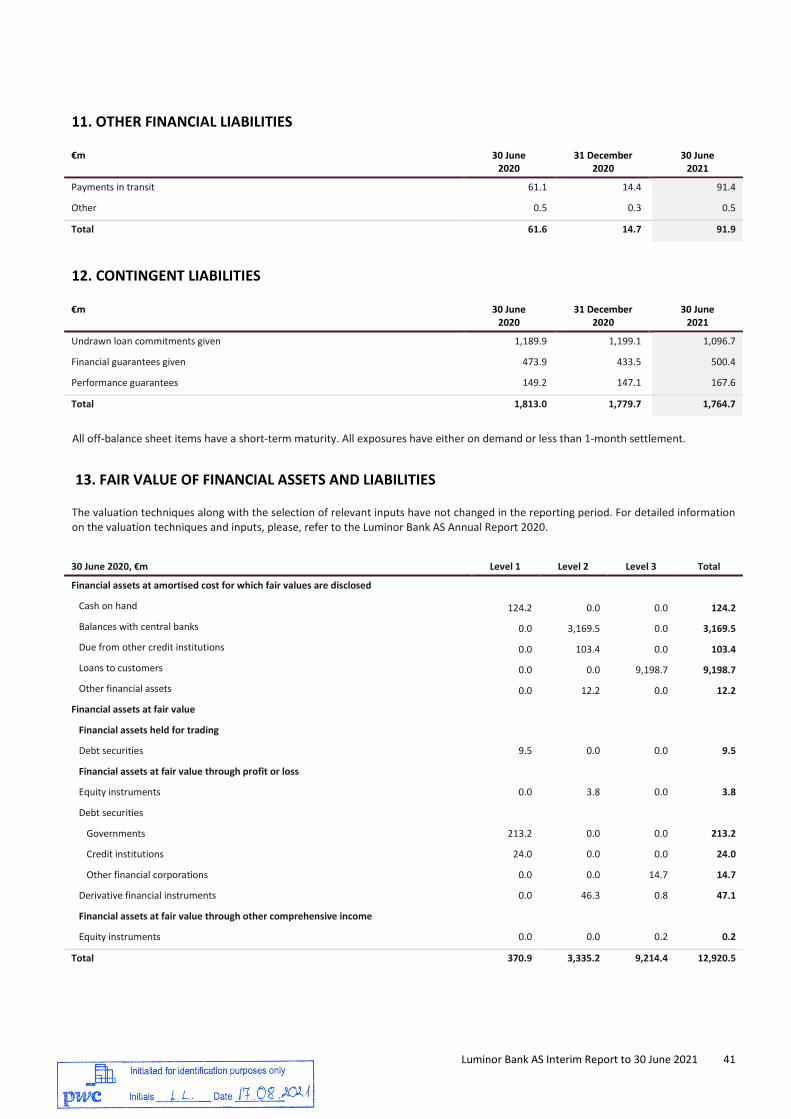
Luminor Bank AS Interim Report to 30 June 2021 41
11. OTHER FINANCIAL LIABILITIES
€m 30 June 2020
31 December 2020
30 June 2021
Payments in transit 61.1 14.4 91.4
Other 0.5 0.3 0.5
Total 61.6 14.7 91.9
12. CONTINGENT LIABILITIES
€m 30 June 2020
31 December 2020
30 June 2021
Undrawn loan commitments given 1,189.9 1,199.1 1,096.7
Financial guarantees given 473.9 433.5 500.4
Performance guarantees 149.2 147.1 167.6
Total 1,813.0 1,779.7 1,764.7
All off-balance sheet items have a short-term maturity. All exposures have either on demand or less than 1-month settlement.
13. FAIR VALUE OF FINANCIAL ASSETS AND LIABILITIES
The valuation techniques along with the selection of relevant inputs have not changed in the reporting period. For detailed information on the valuation techniques and inputs, please, refer to the Luminor Bank AS Annual Report 2020.
30 June 2020, €m Level 1 Level 2 Level 3 Total
Financial assets at amortised cost for which fair values are disclosed
Cash on hand 124.2 0.0 0.0 124.2
Balances with central banks 0.0 3,169.5 0.0 3,169.5
Due from other credit institutions 0.0 103.4 0.0 103.4
Loans to customers 0.0 0.0 9,198.7 9,198.7
Other financial assets 0.0 12.2 0.0 12.2
Financial assets at fair value
Financial assets held for trading
Debt securities 9.5 0.0 0.0 9.5
Financial assets at fair value through profit or loss
Equity instruments 0.0 3.8 0.0 3.8
Debt securities
Governments 213.2 0.0 0.0 213.2
Credit institutions 24.0 0.0 0.0 24.0
Other financial corporations 0.0 0.0 14.7 14.7
Derivative financial instruments 0.0 46.3 0.8 47.1
Financial assets at fair value through other comprehensive income
Equity instruments 0.0 0.0 0.2 0.2
Total 370.9 3,335.2 9,214.4 12,920.5

42 Luminor Bank AS Interim Report to 30 June 2021
Liabilities at amortised cost for which fair values are disclosed
Loans and deposits from credit institutions 0.0 103.1 0.0 103.1
Deposits from customers 0.0 8,436.9 1,907.7 10,344.6
Debt securities issued 497.3 658.4 0.0 1,155.7
Other financial liabilities 0.0 61.6 0.0 61.6
Financial liabilities at fair value
Derivative financial instruments 0.0 42.2 1.5 43.7
Total 497.3 9,302.2 1,909.2 11,708.7
31 December 2020, €m Level 1 Level 2 Level 3 Total
Financial assets at amortised cost for which fair values are disclosed
Cash on hand 123.8 0.0 0.0 123.8
Balances with central banks 0.0 4,802.7 0.0 4,802.7
Due from other credit institutions 0.0 103.6 0.0 103.6
Loans to customers 0.0 0.0 9,107.0 9,107.0
Other financial assets 0.0 0.0 10.2 10.2
Financial assets at fair value
Financial assets held for trading
Debt securities 2.9 0.0 0.0 2.9
Financial assets at fair value through profit or loss
Equity instruments 0.0 2.7 0.0 2.7
Debt securities
Governments 251.1 0.0 0.0 251.1
Credit institutions 24.1 0.0 0.0 24.1
Other financial corporations 0.0 0.0 6.2 6.2
Derivative financial instruments 0.0 42.7 0.7 43.4
Financial assets at fair value through other comprehensive income
Equity instruments 0.0 0.0 0.1 0.1
Total 401.9 4,951.7 9,124.2 14,477.8
Liabilities at amortised cost for which fair values are disclosed
Loans and deposits from credit institutions 0.0 47.3 0.0 47.3
Deposits from customers 0.0 10,734.7 1,087.0 11,821.7
Debt securities issued 499.2 701.0 0.0 1,200.2
Other financial liabilities 0.0 0.0 14.7 14.7
Financial liabilities at fair value
Derivative financial instruments 0.0 49.3 1.3 50.6
Total 499.2 11,532.3 1,103.0 13,134.5

Luminor Bank AS Interim Report to 30 June 2021 43
30 June 2021, €m Level 1 Level 2 Level 3 Total
Financial assets at amortised cost for which fair values are disclosed
Cash on hand 149.3 0.0 0.0 149.3
Balances with central banks 0.0 3,451.5 0.0 3,451.5
Due from other credit institutions 0.0 74.7 0.0 74.7
Loans to customers 0.0 0.0 9,424.7 9,424.7
Debt securities 44.2 0.0 0.0 44.2
Other financial assets 0.0 13.6 0.0 13.6
Financial assets at fair value
Financial assets held for trading
Debt securities 11.6 0.0 0.0 11.6
Financial assets at fair value through profit or loss
Equity instruments 0.0 3.4 0.0 3.4
Debt securities
Governments 244.5 0.0 0.0 244.5
Credit institutions 23.9 0.0 0.0 23.9
Other financial corporations 0.0 0.0 7.0 7.0
Derivative financial instruments 0.0 36.6 0.5 37.1
Financial assets at fair value through other comprehensive income
Equity instruments 0.0 0.0 0.1 0.1
Total 473.5 3,579.8 9,432.3 13,485.6
Liabilities at amortised cost for which fair values are disclosed
Loans and deposits from credit institutions 0.0 64.0 0.0 64.0
Deposits from customers 0.0 9,734.0 898.5 10,632.5
Debt securities issued 0.0 1,214.8 0.0 1,214.8
Other financial liabilities 0.0 91.9 0.0 91.9
Financial liabilities at fair value
Derivative financial instruments 0.0 28.7 0.7 29.4
Total 0.0 11,133.4 899.2 12,032.6
Change in debt securities in Level 3 €m
1st Half 2020 Full year 2020
1st Half 2021
Opening balance 12.9 12.9 6.2
Additions or disposals 0.0 -7.2 0.0
Unrealised gains for assets held at the end of the reporting period 1.8 0.5 0.8
Closing balance 14.7 6.2 7.0
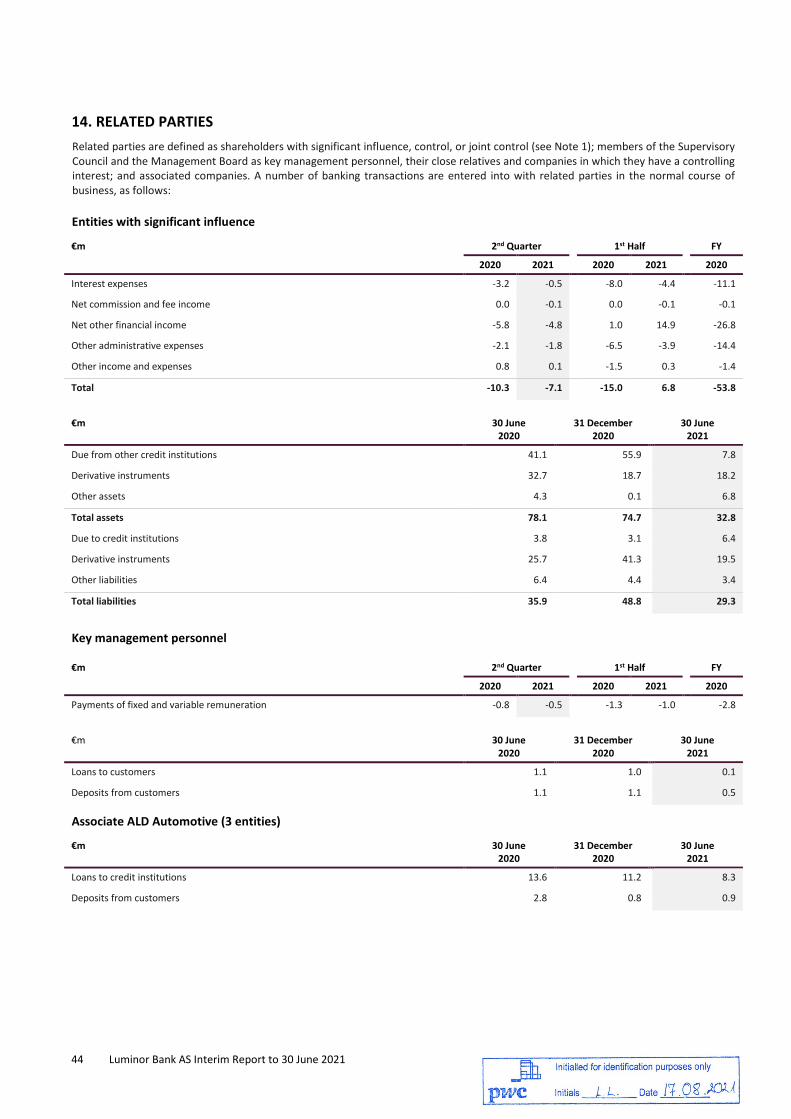
44 Luminor Bank AS Interim Report to 30 June 2021
14. RELATED PARTIESRelated parties are defined as shareholders with significant influence, control, or joint control (see Note 1); members of the Supervisory Council and the Management Board as key management personnel, their close relatives and companies in which they have a controlling interest; and associated companies. A number of banking transactions are entered into with related parties in the normal course of business, as follows:
Entities with significant influence
€m 2nd Quarter 1st Half FY
2020 2021 2020 2021 2020
Interest expenses -3.2 -0.5 -8.0 -4.4 -11.1
Net commission and fee income 0.0 -0.1 0.0 -0.1 -0.1
Net other financial income -5.8 -4.8 1.0 14.9 -26.8
Other administrative expenses -2.1 -1.8 -6.5 -3.9 -14.4
Other income and expenses 0.8 0.1 -1.5 0.3 -1.4
Total -10.3 -7.1 -15.0 6.8 -53.8
€m 30 June 2020
31 December 2020
30 June 2021
Due from other credit institutions 41.1 55.9 7.8
Derivative instruments 32.7 18.7 18.2
Other assets 4.3 0.1 6.8
Total assets 78.1 74.7 32.8
Due to credit institutions 3.8 3.1 6.4
Derivative instruments 25.7 41.3 19.5
Other liabilities 6.4 4.4 3.4
Total liabilities 35.9 48.8 29.3
Key management personnel
€m 2nd Quarter 1st Half FY
2020 2021 2020 2021 2020
Payments of fixed and variable remuneration -0.8 -0.5 -1.3 -1.0 -2.8
€m 30 June 2020
31 December 2020
30 June 2021
Loans to customers 1.1 1.0 0.1
Deposits from customers 1.1 1.1 0.5
Associate ALD Automotive (3 entities)
€m 30 June 2020
31 December 2020
30 June 2021
Loans to credit institutions 13.6 11.2 8.3
Deposits from customers 2.8 0.8 0.9

Luminor Bank AS Interim Report to 30 June 2021 45
15. SEGMENT REPORTING
€m 2nd Quarter
2020 2021
Retail Corporate Other Total Retail Corporate Other Total
Net interest and similar income 28.8 29.9 -2.8 55.9 27.3 31.4 1.6 60.3 Net fee and commission income 10.3 5.7 -0.6 15.4 12.5 6.4 0.4 19.3 Trading income 1.4 2.1 3.4 6.9 1.8 2.5 1.0 5.3 Other income 0.1 0.2 1.9 2.2 0.0 0.2 -2.9 -2.7
Total operating income 40.6 37.9 1.9 80.4 41.6 40.5 0.1 82.2 Total operating expenses -41.6 -21.9 -1.2 -64.7 -45.1 -22.7 -0.5 -68.3 Credit loss allowance 1.1 -5.9 0.2 -4.6 4.8 3.7 0.2 8.7 Other 0.0 -0.1 0.4 0.3 0.0 0.6 -0.1 0.5
Profit before tax 0.1 10.0 1.3 11.4 1.3 22.1 -0.3 23.1
€m 1st Half
2020 2021
Retail Corporate Other Total Retail Corporate Other Total
Net interest and similar income 56.8 58.3 -3.4 111.7 54.1 60.4 2.4 116.9 Net fee and commission income 22.1 11.6 -0.5 33.2 25.1 11.2 0.5 36.8 Trading income 2.9 4.3 7.5 14.7 3.4 4.3 2.1 9.8 Other income 0.4 0.5 0.1 1.0 0.2 0.3 -4.9 -4.4
Total operating income 82.2 74.7 3.7 160.6 82.8 76.2 0.1 159.1 Total operating expenses -88.6 -46.0 -1.6 -136.2 -91.3 -46.3 -1.2 -138.8 Credit loss allowance -4.7 -28.2 0.3 -32.6 7.1 1.1 0.4 8.6 Other 0.0 0.1 0.5 0.6 0.0 0.8 -0.1 0.7
Profit before tax -11.1 0.6 2.9 -7.6 -1.4 31.8 -0.8 29.6
€m FY 2020
Retail Corporate Other Total
Net interest and similar income 114.2 123.2 -10.5 226.9 Net fee and commission income 49.2 24.3 0.1 73.6 Trading income 6.1 8.0 13.6 27.7 Other income 0.9 0.9 -1.8 0.0
Total operating income 170.4 156.4 1.4 328.2 Total operating expenses -173.7 -96.1 -5.6 -275.4 Credit loss allowance 5.4 -24.0 1.0 -17.6 Other 0.1 0.1 0.4 0.6
Profit before tax 2.2 36.4 -2.8 35.8

46 Luminor Bank AS Interim Report to 30 June 2021
Total fee and commission income by segment
€m 2nd Quarter
2020 2021
Retail Corporate Other Total Retail Corporate Other Total
Cards 6.2 1.1 0.0 7.3 6.9 1.3 0.0 8.2 Credit products 0.2 1.1 0.0 1.3 0.1 1.3 0.0 1.4 Daily banking plans 3.2 0.1 0.0 3.3 3.8 0.1 0.0 3.9 Deposit products and cash management 1.9 1.8 0.1 3.8 2.1 1.9 0.4 4.4 Insurance 0.7 0.3 0.0 1.0 0.7 0.3 0.0 1.0 Investments 0.3 0.2 -0.1 0.4 1.0 0.3 0.2 1.5 Pensions 2.3 0.0 0.0 2.3 2.4 0.0 0.0 2.4 Trade finance 0.0 2.0 0.1 2.1 0.0 2.1 0.0 2.1 Other commission income 0.2 0.1 0.0 0.3 0.1 0.0 0.2 0.3
Total 15.0 6.7 0.1 21.8 17.1 7.3 0.8 25.2
€m 1st Half
2020 2021
Retail Corporate Other Total Retail Corporate Other Total
Cards 13.3 2.4 0.0 15.7 12.8 2.2 0.0 15.0 Credit products 0.6 2.3 0.1 3.0 0.2 2.0 0.2 2.4 Daily banking plans 6.5 0.1 0.0 6.6 7.7 0.2 -0.1 7.8 Deposit products and cash management 4.1 3.7 0.3 8.1 4.1 3.8 0.6 8.5 Insurance 1.4 0.6 0.1 2.1 1.7 0.2 0.0 1.9 Investments 0.8 0.5 0.0 1.3 1.6 0.5 0.5 2.6 Pensions 4.6 0.0 0.0 4.6 4.8 0.1 0.0 4.9 Trade finance 0.1 4.1 0.0 4.2 0.1 4.1 0.0 4.2 Other commission income 0.4 0.2 -0.1 0.5 0.2 0.1 0.1 0.4
Total 31.8 13.9 0.4 46.1 33.2 13.2 1.3 47.7
€m FY 2020
Retail Corporate Other Total
Cards 27.4 5.0 0.0 32.4 Credit products 0.9 4.6 -0.1 5.4 Daily banking plans 13.9 0.2 0.1 14.2 Deposit products and cash management 8.3 7.4 0.6 16.3 Insurance 2.9 1.2 0.1 4.2 Investments 1.9 1.1 0.9 3.9 Pensions 9.7 0.0 0.1 9.8 Trade finance 0.1 8.0 0.2 8.3 Other commission income 0.7 0.5 0.1 1.3
Total 65.8 28.0 2.0 95.8

Luminor Bank AS Interim Report to 30 June 2021 47
30 June 2020, €m Retail Corporate Other Total
Loans to customers1 5,361.8 4,442.5 20.9 9,825.2 Deposits from customers 5,356.6 4,962.9 25.1 10,344.6
31 December 2020, €m Retail Corporate Other Total
Loans to customers1 5,251.8 4,307.8 31.9 9,591.5 Deposits from customers 5,743.1 6,024.8 53.8 11,821.7
30 June 2021, €m Retail Corporate Other Total
Loans to customers1 5,290.6 4,481.7 11.3 9,783.6 Deposits from customers 5,790.1 4,803.6 38.8 10,632.5
1 Amounts in Segment reporting do not include allowances and accumulated interests.
The table below shows reconciliation between the total amount of loans and receivables presented under reportable segments above to the net carrying amount from Luminor’s Balance Sheet:
€m 30 June 2020
31 December 2020
30 June 2021
Total under segment reporting 9,825.2 9 591.5 9,783.6
Accrued interest 30.1 20.5 20.6
Allowance -191.6 -136.9 -114.9
Initial impairment -19.0 -18.7 -21.8
Amortized fee -28.0 -25.6 -26.5
Net carrying amount 9,616.7 9 430.8 9,641.0

48 Luminor Bank AS Interim Report to 30 June 2021
CONTACT DETAILS
Luminor Bank AS
Location and address Liivalaia 45
10145 Tallinn
Estonia
Registered country
Main activity:
Commercial Register code
Telephone
SWIFT/BIC
Investor relations
Balance sheet date
Reporting period
Reporting currency
The Republic of Estonia
Credit institution
11315936
+372 628 3300
RIKOEE22
30 June 2021
1 January to 30 June 2021
Euro
Cover image: Our Head office in Tallinn. Images of Tallinn, Riga and Vilnius appear on pages 6, 8 and 10, respectively.
AS PricewaterhouseCoopers Pärnu mnt 15, 10141 Tallinn, Estonia; License No. 6; Registry code: 10142876 T: +372 614 1800, F: +372 614 1900, www.pwc.ee
Independent Auditor’s Report on Review of Condensed Consolidated Interim Financial Statements To the Shareholder of Luminor Bank AS Introduction We have reviewed the accompanying condensed consolidated balance sheet of Luminor Bank AS and its subsidiaries as at 30 June 2021 and the related condensed consolidated statement of profit or loss and other comprehensive income for the three-month and six-month periods then ended, and condensed consolidated statements of changes in equity and cash flows for the six-month period then ended, and the related explanatory notes. Management Board is responsible for the preparation and presentation of these condensed consolidated interim financial statements in accordance with International Accounting Standard 34, 'Interim Financial Reporting', as adopted by the European Union. Our responsibility is to express a conclusion on these condensed consolidated interim financial statements based on our review. Scope of review We conducted our review in accordance with International Standard on Review Engagements (ISRE) (Estonia) 2410, 'Review of Interim Financial Information Performed by the Independent Auditor of the Entity'. A review of condensed consolidated interim financial statements consists of making inquiries, primarily of persons responsible for financial and accounting matters, and applying analytical and other review procedures. A review is substantially less in scope than an audit conducted in accordance with International Standards on Auditing and consequently does not enable us to obtain assurance that we would become aware of all significant matters that might be identified in an audit. Accordingly, we do not express an audit opinion. Conclusion Based on our review, nothing has come to our attention that causes us to believe that the accompanying condensed consolidated interim financial statements are not prepared, in all material respects, in accordance with International Accounting Standard 34, 'Interim Financial Reporting' as adopted by the European Union. AS PricewaterhouseCoopers Ago Vilu Auditor’s certificate no 325 17 August 2021 Tallinn, Estonia

50 Luminor Bank AS Interim Report to 30 June 2021