Embed Size (px)
Citation preview

LUMINESCENCE IN METEORITIC AND LUNAR SILICATES
by
G. Walker M.Sc. Tech.
Thesis submitted to the University
of Manchester for the degree of
Doctor of Philosophy.
January, 1971

ABSTRACT
Investigations of proton-excited luminescence spectra
of s ilica te mineral phases present in meteoritic and lunar
material have been carried out« Low energy proton excitation
was used, orig in a lly on account of the possible relevance of
such studies to possible luminescence of the lunar surface
excited by the solar wind. Powdered samples are irradiated by
protons from a small 10 - 120 KeV proton accelerator and the
resulting luminescence emission is scanned by a photoelectric
grating spectrophotometer. Improvements to the existing apparatus
are described along with a b rie f description of the accelerator
and spectrophotometer.
The design and construction of an all-metal low energy
( 2 - 8 KeV) proton/electron accelerator is described for the
study of integrated luminescence and radiation damage. A cryostat
which attaches to this accelerator has been constructed for the
purpose of thermoluminescence studies and a linear heating-rate
temperature controller has been designed and built for programming
the sample temperature. Preliminary comparisons of the 3I 0W
curves of meteoritic and synthetic enstatites have been made.
The luminescence spectra of over 20 stony meteorites
have been measured and found to be characteristic of the class
of meteorite. The mineral phases responsible for the luminescence
emission have been iden tified and the nature of the luminescence
centres in these minerals is discussed. The estimated luminescence
-2 -5effic ien c ies are, in general, in the range 10 to 10 , the most
e ff ic ien t luminescent meteorites being the enstatite achondrites
which are an order of magnitude more e ff ic ien t than any other
class o f meteorite. The luminescent mineral phase responsible is

enstatite which gives either a predominantly red or blue emission
depending on the manganese content. The red emission (peak at
6700 A) is due to Mn2+ substituting for Mg2+ in the M0 metal
cation s ite in the la tt ic e . 'Hie blue emission is thought to be
due to an unidentified la tt ic e defect. Enstatite is also the
major luminescent component in the enstatite chondrites.
The variations in luminescence spectra of synthetic
enstatites and fo rster ites with manganese and iron content have
also been investigated. I t is shown that the Mn2+ emission is
quenched to a greater degree than the blue emission when iron is
introduced into the la tt ic e . Large iron concentrations
Fe SiOg) result in very weak luminescence, the spectral distribution
of which is practically independent of manganese content. Factors
7+governing the intensity and position of the Mn' emission band
in enstatites and fo rs ter ites are discussed.
Plagioclase is found to be the major luminescent
component in bronzite and hypersthene chondrites and pyroxene-
plagioclase achondrites, although in the former group accessory
amounts o f apatite also contribute to the luminescence in a minor
way.
The e ffe c t of proton radiation damage on the spectra
and effic iency of meteorite samples and related synthetic phosphors
has been examined. I t is shown that some workers who have
reported that the luminescence e ffic ien c ies of sulphides and
s ilica tes under KeV electron and proton irradiation d iffe r by
orders of magnitude have not appreciated the rapid in itia l
deterioration in luminescence e ffic ien cy which can occur when
12 2using a proton flux > 10 particles/cm /sec.

The major luminescent component in lunar material
has been shown to be plagioclase which exhibits two emission
bands in the v is ib le region . The predominant yellow-green
emission band (peak at 5600 t) is shown to be probably due to
2+ 2+Mn substituting for Ca' . Comparison with te rres tria l plcgioclases
shows that an infra-red emission band which is often the most
intense emission in te r re s tr ia l samples is the least intense
emission band in lunar and meteoritic plagioclase. The luminescence
efficiency of lunar material is a function of the plagioclase
content and is very low ( < 10 ) for Apollo 11 fines but usually
higher for Apollo 12 fin es. Luminescence effic ien cies of rock
-5 -4samples are in the range 10 - 2 . 10 .

C O N T E N T S
Page
PREFACE
ACKNOWLEDGEMENTS
HISTORICAL FOREWARD
CHAPTER I - INTRODUCTION.
1. The composition and structure of s ilicates 1
1.1 General description 1
1.2 Pyroxenes 2
1.3 Plagioclases 3
2. C lassification of meteoritic stones 4
3. The theory of luminescence in solids
3.1 General considerations 6
3.2 Crystal fie ld theory 12
3.3 The Mn2+ ion 16
3.4 Cathodoluminescence and Ionoluminescence 19
3.5 Ion-radiation damage in luminescentmaterials 23
3.6 Thermoluminescence 26
4. Possible luminescence and radiation damage
of the lunar surface
4.1 Possible lunar luminescence 29
4.2 Radiation damage of the lunar surface 32
CHAPTER II - INSTRUMENTATION.
1. The 120 KeV proton accelerator system
1.1 General description 35
1.2 The proton source and accelerator tube 36

Page
1.3 Power supplies 37
1.4 The sample chamber 37
1.5 Modifications to vacuum system 38
1.6 The new pumping system 40
2. The photoelectric spectrophotometer
2.1 The monochromator and photomultipliers 43
2.2 The electronic recording system 45
2.3 Spectral response calibration 47
3. The new low energy proton accelerator system
3.1 Design and general description 48
3.2 The ion source and accelerating system 49
3.3 The sample chamber and vacuum system 53
3.4 The electronic recording system 54
4. Thermoluminescence instrumentation
4.1 The cryostat 55
4.2 The linear heating-rate controller 57
4.3 Temperature measurement and recording 61
CHAPTER I I I - LUMINESCENCE IN METF.ORITIC SILICATES
1. Previous work 63
2. The luminescence spectra of enstatiteachondrite meteorites 64
3. Luminescence of synthetic enstatites andforsterites
3.1 Preparation 68
3.2 Spectra of iron-free enstatites andforsterites 69
3»? Spectra of ferromagnesian pyroxenes andolivines 71

4, The luminescence o f other classes o f stonymeteorites 72
4.1 The enstatite chondrites 73
4.2 Bronzite and hypersthene chondrites 74
4.3 The pyroxene-plagioclase achondrit.es 78
4.4 The hypersthene achondrites 79
4.5 The olivine-pigeon ite achondrites 79
4.6 The o livine-p igeon ite and carbonaceouschondrites 80
5, The e ffec t of proton irradiation on luminescenceeffic iency 81
6 . Preliminary thermoluminescence measurements. 85
7. Discussion
2+7.1 The wavelength o f the Mn emission inenstatite and fo rsterite 38
7.2 Other factors a ffecting the luminescenceemission in enstatite 91
7.3 Comparative e ff ic ien c ie s of electron andproton-excited luminescence 92
COPTER IV - LUMINESCENCE IM LUNAR SILICATES.
1. The luminescence of lunar surface material.
1.1 Luminescence spectra of lunar fines 94
1.2 Luminescence spectra of lunar rocks andbreccias 98
2. Luminescence spectra o f terrestria l plagioclases 99
3. Discussion
3.1 The Mn + emission 101
3.2 The blue and in fra-red emission bands 1 ( »

Page
APPENDIX
1. The electrostatic getter-ion ("o rb itron ") pump.
1.1 Operating principles and design
1.2 Testing of a prototype
1.3 Materials and maintenance
1.4 Power supplies
3F.FERI-.XES
107
109
112
113

PREFACE
After graduation from Glasgow University in 1962
with a B.Sc. Honours Degree in Natural Philosophy, I undertook
research in the Faculty of Technology of this University* I
was awarded a D.S.I.R. research studentship in October, 1962
and was appointed Special Research Assistant in Physics in
January, 1964,
In December, 1965, I was awarded the degree of
M.Sc* Tech, for a thesis on "Variations of Fluorescence E fficiencies
and Energy Transfer in Organic Systems»" I was appointed Assistant
Lecturer in Physics in October, 1966 and in October, 1969 I was
appointed Lecturer in Physics*
None of the research work presented in this thesis has
been submitted in support of any degree at this or any other
University.
January, 1971
Relevant publications!- see references 6 - 1 1

ACKNOWLEDGEMENTS
F irstly , I wish to thank my Supervisor, Dr. J.E. Geake,
fo r his encouragement and guidance throughout this work. Thanks
are also due to Professor H. Lipson for the fa c ilit ie s offered by
the Physics Department.
I am grateful to my colleague, Dr. M.D. Lumb and former
colleague Mr. C.J. Derham fo r discussions regarding the design and
operation of the original equipment.
I would also like to express my gratitude to Mr. J. McConnell,
Mr. A. Manwaring and Mr. M. Gould for technical assistance at various
stages of the project.
I am also grateful to my associates in other Departments
in th is and other Universities who have either carried out analyses
on my behalf or prepared samples used in th is work or helped in any
way. They are gratefully acknowledged at the appropriate points
in the text.
In addition, I would like to thank Dr. C.H. Kemp for
help with some of the diagrams and Mr. M. Gould for help with the
photographs included in this thesis.
I also wish to convey my thanks to my wife, Susan, for
typing this thesis and for her forbearance whilst it was being written.
Finally, thanks are due to the United States A ir Force
and the Science Research Council who provided funds for much of the
equipment used, to the British Museum (Natural History) for the loan
of a large variety of samples of meteorltic stones and fo r helpful
advice on their selection, end to N.A.S.A. fo r the generous provision
of lunar samples returned by the Apollo 11 end 12 missions.

HISTORICAL FORWARD
The work described in this thesis is basically a
continuation o f a project which was orig in a lly embarked upon in
1959 by J.E. Geake and M.D. Lumb\ This project, which was formerly
financed by the U.S.A.F., aimed at the investigation o f the luminescence
o f mineral rock samples believed to be similar to those existing on
the lunar surface. The f i r s t four years were concerned with the design
2 3and construction of a photo-electric spectrophotometer * and a proton4
accelerator . The f ir s t results to emerge from this project were
published by C.J. Derham and J.E. Geake in 1964 giving the emission
spectra of enstatite achondrite meteorites under proton irradiation .
I t is from this point that the work w ill be described in
th is thesis.
During the years 1964-9, the main interest in the work
became centred around the luminescence properties of meteoritic stones^’^’
including an investigation of the spectra o f natural and synthetico
manganese activated magnesium metasilicates .
A second proton accelerator system with metal seals was
constructed in the years 1967-70 for the study of radiation damage
effects and thermoluminescence of silicate samples, and this system
and its associated instrumentation w ill be described in deta il.
During 1969 the original proton accelerator and associated
equipment were extensively overhauled and modified in readiness for
the lunar samples which were received later that year. In particular,
the vacuum system was modified and the punping equipment entirely
replaced in the interests of providing a contamination free environment

f o r th e lunar sam ples under in v e s t i g a t io n .
In 1969-70, following the successful Apollo 11 and 12
missions, luminescence studies were carried out on lunar dust and
rock chip sample


1.
1• The composition and structure o f s ilic a te s .
1.1 General Description.
The basic building block o f a l l s ilica tes is the
(SiO^)4 tetrahedron. This tetrahedron is practically a close-
packed structure o f four oxygen ions since the central silicon
12ion is very small by comparison . I t is generally assumed that
s ilica tes are predominantly ionic structures consisting of metal
cations and s ilic a tetrahedral anions with each oxygen carrying
some negative charge1
The simplest s ilica te structure is that o f the
orthosilicates in which the Si04 tetrahedra are regularly stacked
and linked by divalent metal ions which l ie between them. The
o liv in e group o f minerals, (Mg, Fe)2 Si04 , is an example of this
type of structure (see Fig. l ) 14a. The metal ions are in six-fo ld
co-ordination in two possible sites, and Mg, with slightly
15d iffe r in g symmetries and metal-oxygen distances •
Si04 tetrahedra may, however, share oxygen ions and
linear chains or rings o f tetrahedra are formed when two oxygens
are shared. The group o f minerals known as pyroxenes consist of
such linear chains of tetrahedra, the chains being linked together
by divalent metal ions, as in the mineral enstatite MgSiO^.
Chains o f tetrahedra may join together in pairs to form
double chain structures known as amphiboles. Furthermore, i f three
oxygens in a ll tetrahedra are shared then the tetrahedra form
continuous layers or sheets which are again linked by various
cations to give the necessary charge balance. This layered
structure is found in the mica group o f minerals.

2
I f a l l four oxygen Ions are shared between adjacent
tetrahedra then a three-dimensional framework structure results«
In this case no metal cations are necessary for charge balance
and thus pure s ilica minerals such as quartz have this type of
structure.
In almost a ll these types o f basic s ilica te structures
which occur naturally, the small silicon ion is often replaced
3+to some extent by A1 , which is only s ligh tly larger in size,
12to form the aluminous s ilica tes • This substitution obviously
leads to charge imbalance which is compensated fo r by the
introduction o f further metal ions into the structure. The
3+ 4^substitution o f A1 for Si in a framework structure leads to
the introduction o f metal ions where none existed previously.
In fact, the very important group of minerals known as feldspars
are formed in th is way. The plagioclase feldspars are aluminous
s ilica tes of calcium and sodium. Potassium feldspars (e .g . orthoclase
KAlSi^Og) are also important rock forming minerals but these w ill
not be discussed here. Of main interest here are the non-oluminous
pyroxenes, the plagioclases and to a lesser degree, the olivines.
Pyroxenes.
Pyroxenes are major constituents in many types of
igneous rocks. They occur in almost a ll stony meteorites and in
lunar rocks and fines. Investigations presented here are mainly
restricted to the enstatite MgSiO^ - ferrosilite FeSiO^ series,
which is to be found in meteoritic stones. This type of ferromagnesium
silicate is referred to as enstatite i f it contains less than 10$
iron silicate . In an equilibrated sample the iron is uniformly
distributed throughout the crystal. I f the iron content is between
10 and 20 mole $ then the mineral is referred to as bronzite. When
the iron content is greater than 20 mole $ the mineral is called

3
hypersthene. These crite ria are those of meteoric!sts1^8 and,
in fact, some mineralogists and petrologists have somewhat
d ifferen t boundary cr ite ria . However, the meteoricists boundary
values w ill be used here.
There are three possible crysta l structures fo r th is
series} two o f which are orthorhombic and one monoclinic. In
the case of enstatite, they are referred to as orthoenstatite,
protoenstatite and clinoenstatite, the last named being monoclinic.
Orthopyroxene is the most common type and its structure is shown
14bin Fig. 3 . The symmetries of the two possible cation s ites
and are also shown and the metal-oxygen distances quoted
are for a hypersthene with about 50 mole % iron . The M1 site
is approximately octahedral symmetry but the M2 s ite is considerably
distorted being non-centrosymmetriC and elongated along the
b - axis. Since i t has been shown that metal-oxygen distances
18increase sligh tly with an increase in iron content , the metal-
oxygen distances for orthoenstatite are lik e ly to be s ligh tly
less than those quoted in Fig. 3.
The two other types of structure are similar and occur
on accovxit of relative shifts of the chains of tetrahedra along
the c - axis. The present state of knowledge with regard to the
crystal chemistry of pyroxenes has recently been reviewed by
Zussman1 .
1.3 Plagioclases.
Plagioclase is found as a major constituent in most
igneous rocks, including lunar rocks and fines, and is present in
many stony meteorites. Plagioclases are named according to the
proportion of albite (Ab), NaAlSigOg, and anorthite (An),
CaAl2Si20g, in their composition as followst-

4
less than 1C?$ An - a lbite - more than 90?$ Ab
10-30?$ An - oligoclase - 70-90?$ Ab
30-50?$ An - andesine - 70-50?$ Ab
50-70?$ An - labradorlte - 50-30?$ Ab
70-90?$ An - bytownite - 30-10?$ Ab
over 90?$ An - anorthite - less than 10?$ Ab2+ +
Cations other than Ca or Na may, o f course, be present as small
impurities but in basic igneous rocks, plagioclase is often the
only mineral which is re la t iv e ly iron free. (The term "basic"
applied to igneous rocks means that the rock has a low s ilic a
content and the s ilica present is only found in the various s ilica te
phases and not in the free state)#
The structures o f a lbite and anorthite are both tr ic lin ic
20 21and have been determined in deta il ' • In a lb ite , one quarter
o f the silicon has been replaced by triva len t aluminium and
monovalent sodium provides charge compensation. In anorthite,
3+every alternate tetrahedra has an A1 core and thus exactly half
the silicon is replaced. Divalent calcium restores the charge
balance. In the anorthite structure the calcium is very irregularly
co-ordinated (see Fig. 2 ). There are four s ligh tly d ifferen t cation
s ites which are seven-fold co-ordinated i f metal-oxygen distances 0
up to 3A are counted. The average metal-oxygen distance is aboutO
2.5A which is somewhat larger than in orthopyroxenes and o liv ines
(2.1 - 2.2A).
2. C lassification o f meteoritic stones.
Stony meteorites consist essentia lly o f s ilica te material
with smaller amounts o f n ickel-iron, sulphides, and other minerals.
Except for some carbonaceous meteorites, the s ilic a te takes the form

of pyroxene, olivine or plagioclase. The generally accepted
classification of meteorites was firs t proposed by Prior in 1920
and is based mainly on mineralogical composition. The f ir s t major
division of stony meteorites is between chondrites and achondrites.
A chondrite contains spheroidal stones called chondrules usually
of olivine or pyroxene composition which are usually of the order
of a mm or so in diameter. Achondrites are characterized by the
absence of such chondrules. This division seems at firs t to be
one of texture rather than of mineralogy. However, there are
well-defined differences in mineralogy between say a hypersthene
chondrite and a hypersthene achondrite, the former containing
considerably more olivine than the latter.
Further division of the achondrites results in calcium-
rich achondrites and calcium-poor achondrites. The former usually
contain appreciable amounts of plagioclase or calcium-rich pyroxene;
the latter contain li t t le or no plagioclase and consist mainly of
non-calcic or calcium-poor pyroxenes.
Both chondrites and achondrites are named according to
the predominant or characteristic mineral phase or quite often
according to the two most predominant minerals e .g . the pyroxene-
plagioclase achondrites. The only exception to this rule is the
carbonaceous chondrites which are so called on account of the
presence of organic material although chemical analysis shows a carbon
content of less than 4#. A fu ll discussion of the classification of
meteorites has been given by Mason1 * and the classification of a
particular meteorite can be ascertained by reference to the Prior-
22Hey catalogue .
The peculiar names associated with meteorites are the
result of naming a particular meteorite according to the place name
of the location in which it f e l l or was found.
5 .

The olivine structure projected onto (100). The two possible
metel co-ordination sites and are shown and metal-oxygenO
distances for each site indicated in A on the left*
(A fter Bums 14* ) .
The anorthite structure* This is an inclintd projection on
(010) of parts of structure bounded by the planes y ■ 1 0.3*
Heavy lines indicate the upper part of layer shown*
(A fter Kempster et a l 2^ ).
T^B 8’fKVCTt'RK OK ANOHTHITK, C«AI/i,<>,

Fig. 3. Th» orthopyroxene structure. The upper part of the figure i *
the structure projected onto (100) showing clearly the elisini
of s ilica tetrahedra. The middle part of the figure shows the
structure projected onto (001), and the lower part shows the
two possible metal co-ordinations and M , projected onto
(100), with metal-oxygen distances indicsted in A.
(Modified from Bums ^ * * ) .

The theory of luminescence In solids.
General considerations»
Luminescent solids are generally electrical insulators
or semi-conductors. For a crystalline solid to show luminescence
there must be special sites in the lattice in which any absorbed
energy has a good probability of being radiatively emitted
rather than dissipated into lattice vibrations. These sites are
called luminescence centres. Such centres are usually provided
by either lattice imperfections (e .g . vacancies) or impurity ions
which are referred to as activators. However, not a ll such
imperfections or impurities w ill provide luminescence centres
and in fact such defects may give rise to "k ille r" centres which
quench luminescence.
Obvious possib ilities for impurity activators are
elements in which transitions of electrons in an incomplete electron
shell are shielded to some extent by outer bonding electrons.
Elements of the transition series are of this type and indeed many
ions from these series do act as luminescence centres in many solids.
The divalent manganese ion, which w ill be discussed in detail
la ter, is the most important activator in silicates and in many
other minerals (e .g . ca lc ite , spinels, apatites, e tc . ). Rare earth
ion activators often give rise to quite narrow band emission owing to
an optical electronic transition in the 4 f shell which is particularly
well-shielded.
i \ *The emission band usually occurs at longer wavelengths
than the corresponding absorption band (Stokes' law) and the
wavelength shift between absorption and emission is termed the
Stokes' sh ift. The reason fo r this shift is easy to see on a
configuration co-ordinate-energy diagram (see Fig. 4 ). In such

< id ■ 1 5
aM». o a It
lu. ' i . 1 ni \t e t ' l o -c. -I 1: . _
• „ 1 . . -■i •- ' I.!
nc doirlw n l e r i t i a l n i 1,1 i0 ‘ ed
yfllldedoi nr! voneri1
■ ’ nF,ti
bviiim« Yift'
91A 88^1®
beblvcnq yllcutu <'
r ' . ' ■ ‘ ' . • - * *
,
,1. r ■ td bail«-
i i i t i lab ile yd
ranine c r-r
-, .. . • -le lllJ l" «
ant an •) iV.’.tVi '{>
ib ■ ! ! ... 1 i
9 l tu ' i< ■ n
ynrt . I’<1 ' !. v : : ' '■■■■'
. Y?i i i.l ’t' - r. .
XI*J• i f l l.il,.; ; . 1..
t i l r- ; '
fulfil <•••: . .«■ ■ I
c j ,i.‘ n< i.! , .! ( i® hnud yk-t i
Iu: • -,i c. iitw i l ' d!’
ftriitfslavi w ispr i'I i f
erii bnr {,< 1
aril bam* .1■ ill noleai
tB ncinw
«•iij'ia ,(.li 10 Bfioiloal ',ml
i r efoeteb d;ne lor.1 ni bn*
• . ■.
J «. ; in - t i l* «'i ob < 2 < lain mo Xii
. *!t (K . . 1 •!..» lo . •!• . .’.
*• .¿II . Si r. • i. i »• • 1
, i . . . d
*». • r O f ftpj 1 ‘>Vi’ fl . 1 V IsV/.+ J' fK ' i
i ‘ n ! v> : " i n I ‘ . i .< O ft
. -
rttil nabi
(I; . ■ n
'S ■ > •
7
a diagram the potential energy is plotted as a function of the
distance of the activator ion from the surrounding la t t ic e ions for
d ifferen t electronic states. In general, the equilibrium position
( i . e . the minimum of the P.E. curve) is different for d ifferen t
electronic states. Absorption and emission take place in accordance
with the Franck-Condon princip le i . e . the electronic configuration
changes before the heavier ions have time to a lter th e ir positions.
Therefore, such transitions appear as vertical lines on the diagram.
Since at normal temperatures the ion is usually in the lowest
vibrational leve l o f the ground state, absorption resu lts in a
high vibrational level o f the electronic excited state. This excess
vibrational energy is , however, rapidly dissipated into the la ttic e
and emission takes place from the lowest vibrational le v e l of the
excited state to a high vibrational level of the ground state. The
Franck-Condon principle is not exact but, nevertheless, transitions
which conform to i t are more probable.
I f an activator centre is in an excited state then the
probability of a radiative e le c tr ic dipole transition to the
ground state depends on the e lec tr ic transition dipole moment
23a 2M|cn end is indeed proportional to|Mj{nJ
where - eJ - g r. ^ (1 .1 )
where is the position vector of the i th particle o f charge
z^e in the luminescence centre. I f k • n then M is simply the
dipole moment in state \jr» Since M)cn is a reel physical property
of the centre it must be invariant to symmetry operations* Thus
cannot change sign on account of such an operation. I f for
any pair of wave-functions the integral does change sign on account
of a symmetry operation, then i t must be zero and the transition
between these states is said to be forbidden.

8
The "allowedness" of a transition is usually indicated by
quoting the oscillator strength of the transition f kn.
« " • ” 'k„ ■ ,0” ' i k„ I !knl 2 « • «
««here V kn is the average wavenumber of the transition* The
oscillator strength is a ratio comparing the intensity of a given
transition with that of an allo««ed transition at the same frequency
for a three dimensional harmonic oscillator. For strongly allowed
transitions f is usually slightly less than unity* Alternatively
the radiative lifetime *^rad may be used as a measure of
forbiddennesst since ^ rad - (1 .3)
For f ■ 1 (strongly allowed) and y ■ 20,000 cm“1 (5000 A),
X rad is approximately 4.10“^ sec*
The radiative lifetime is the reciprocal of the radiative
transition probability for spontaneous emission
I S k n l 2 »•< >
I f the decay of the excited state of the activator is the only
rate determining step in the luminescence process, the luminescence
decay w ill be exponential . I f N is the number of emission
centres in the excited state at time t then the intensity of
emission I . “£ [ - (K ♦ K .) N (1.5)dt 1 1
Integration yields N ■ Noe" ^Kf + t
or I - ! V < *f \ * 0 '(1.6)
where XQ is the luminescence intensity at t ■ 0, when centres
are in the excited state* is the probability of non-radiative
de-activation* The actual observed lifetime of the emission
1Kf + Ki
which tends to i f is small compared

1- ni:‘ V; - » ' 7 ' • •>' f. ; V
l f •• (
«1«
II
t * x X
7 ?
. *ir
phí:«ÍY n< I
*xc
yj ; ■! ; . ' J.t
] bf*
o j c » i o
9
with K_. The efficiency of the luminescence process within a
Kfcentre i s *h » _ _ _ _ _ _ which obviously decreases as K.I Kf ♦ Kj
increases. Kj is temperature dependent but it Kf
the efficiency w ill be sensibly temperature independent. With
increasing temperature, however, Kj w ill increase until i t becomes
comparable with Kf and thus a reduction of efficiency w ill then
be apparent. Temperature quenching can be understood by
reference once again to the configuration co-ordinate diagram
(F ig. 4 ) . At the point E where the P.E. curves for ground state
and excited state closely approach each other, a non-radiative
transition from the excited state to the ground state is possible.
The activation energy W can be supplied thermally and the
probability of non-radiative de-activation w ill be given by
_ I»Kj ■ Ce where C is some constant. I f the point E occurs
very near the minimus of the excited state P.E. curve then it is
obvious that luminescence w ill be improbable unless the temperature
is lowered* I f the point E occurred at a position co-ordinate
between that for the minima for the ground state and excited state
23cthen luminescence would not be possible • In general, a large
displacement of equilibrium position between ground state and
excited state results in a high probability of non-radiative
transitions. Thus the shielding of inner unfilled electron shells
in transition metals is not necessarily the reason why luminescence
occurs at a given temperature, but i t is rather the position of
24the point E which appears to be the determining factor •
The luminescence decay may not be exponential i f the
transition probability within the centre is not the only rate -
determining step. I f the probability of emission also depends on

c j. i I
o Jti d. ' ' ' ' - *l 51 + vN
*; ;+ j, i i f< ] '• i;;V
tbnoqe! . Sf'U n'l . ' • V .
. t i . • 'Idivnoc od I I I » Y?n<j
set • ; i i '"'I' ‘ '■ 1 : .• ■ t i : U. • -> i, 1 X
of* f " : < i
nf’O ' nj • nuitqqs od
. ■ ■ , i . f '■ ' l i t -fin ‘ •. •' j iJ r . : « ' ' " Z-1 "•<>) 9Oil-VIrt91
‘ ’ r. * ■ *■ •' * * V.‘ :•>: hn •
• 20 O', ’ ’ ' ’ • 1 if.; o f n, j- ji j- o y j l [} x (i.t Port noi tlenbif
, 9rfi In. v iii* .«riJ be1J."; UP 0« nso V Y-.ii'in» m '.' •
yd navlg ed J.fiw nol ■ -
; : • : f it Z< i, >. i «** ■
. . tin but ;.,v ,,;t t is*n X’ltv
fill) j „ .+ • : .-¡i ' ' ' ■ 1,.... ... ;; ;w e:>f* i,i /'f J IK i VC <>
-a; n Jr «/O’1 t ■' , «Mit 11 a
( ;j ■ hot: nxe br:f c tr.i? hn’K•rt) c* ’J id sir.’ ni.m os it lot is i ■ i f-tiwied
S( % * old!*; •fKj -J ' .foil 1 J H. A OOfM ; . ■ rii ul
hi ']•? J i’-h • P‘ ouiod n : ■<» wiiLrul! ! .'(>• I*' t i D! ['■ ■ )
V s. XG6C' ■'v; rigid e nl atlursT at » i t bstlexe
■11* i < i ; -I b i l l ., u '' i n i •
t n ,,i • . V 'H IV ; i ‘ i ’I ' i Ylimi, r e ; n i ( r i ‘ i t n* • ’ . i 1J .u’
to nolttvoq erii ledisr ai i i ,
. . * j * b erit ed o ) steeqqs rlolriw '
eiit ’ll Ir i ti'on<x,xe od i f n y «m Y1 ofh ‘.«r uecs niii'iii e<r r
eiinec . n ' i>; riilw '; . f ■’ I h • r,« 1o nolil* isii
MO f Iv.'» ;?>l) cals nolai'lme to y f l • gnlnl»neit»h
10,
the number of available centres, then the kinetics would be o fOOW jij O
second order i .e . I * ’ — Qf N t It is easy to show
that on integration this leads to a decay which is hyperbolic*
In practice the decay of fluorescence may be complex involving
a mixture of different components of firs t or second order kinetics.
It i 8 necessary to distinguish between fluorescence and
phosphorescence. Phosphorescence is defined as that emission
which has occurred when the excited electron has resided for a
time after excitation in a metastable "trapping" state before
transferring to the emitting state. The term fluorescence is
reserved for emission which occurs without such prior "trapping"
of the excited electron. In general, the lifetime of phosphorescence
is longer than for fluorescence for a particular phosphor, but
very long fluorescence lifetimes can occur when the emission is
the result of a transition which is forbidden for electric dipole
radiation.
Models used to describe possible mechanisms of luminescence
in the so-called photoconducting phosphors invariably use the
23d 24well-known band theory of solids as a basis ’ , Luminescence
centres, quencher or "k ille r" centres and trapping centres are
assumed to give rise to localised levels between the valence and
conduction bands (see Fig, 6 ), An impurity or defect centre may
introduce an empty localised energy level below the conduction band
which hss a high probability of capturing an electron from the
conduction band but negligible probability of subsequently capturing
a hole from the valence band. Such a level is known as an electron
trap i f normally empty and as a donor level i f it is normally
occupied. Similarly, f i l le d localised levels lying above the valance

Fig. 4 .
Fig. 5»
Fig. 6.
Configuration co-ordinate - energy diagram for a luminescence
centre* AB is an absorption transition and CD an emission
transition* E is a close approach of ground state and excited
state P.E. curves and x represents the distance from the
24centre to nearest neighbour atoms. (After Garlick * ) .
Configuration co-ordinate - energy diagram for the Mn2* ion
in calcite. (A fte r Medlin25)»
Energy band theory model for a photoconducting phosphor*
Emission centre leve ls are indicated by A and trapping levels
by C* (A fter Garlick^*).

band which have a high probability o f capturing a hole from the
valence band are termed hole traps» or, i f such a level is normally
empty, an acceptor le ve l. The position o f the Fermi leve l governs
whether a particular localised leve l is normally occupied or not.
Intermediate energy leve ls which have comparable capture
probabilities for electrons and holes constitute recombination
centres. I f an electronic transition involved in the recombination
process is radiative then the centre is a luminescence centre. A
luminescence centre may involve more than one intermediate level
and may be formed by an associated pair o f donor and acceptor leve ls .
Whilst manganese activated phosphors are not usually
considered as photo-conducting phosphors, excitation of the
manganese centres without excitation o f electrons into the
conduction band may be d if f ic u lt on account of the forbiddenness
o f possible absorption transitions in the divalent manganese ion.
Certain transition metal ions (Fe2+, F e^ , Ni2+, Co2+)
¿o not usually act as luminescence centres in solids and in fact
often act as "k ille r " centres. The quenching mechanism of these
ions does not appear to be fu lly understood. Early attempts to
explain the k ille r effect of these ions assuned that they
introduced hole traps into the solid and that energy transfer was23e 25
by positive hole migration in the valence band ’ • More recently,
several workers have concluded that k i l le r ions give rise to deep
electron trapping levels which on account of their depth do not usually
give rise to phosphorescence or show up in thermoluminescence ’ #
However, such transition metal ions may function as emission centres
in a spectral region outside the visib le range. Since the absorption
transitions between ground state and the lower excited states
invariably occur in the infra-red for these ions in various lattices,

12
one might expect luminescence emission in the in fra-red.
24 2+Garlick has in fact shown that. Co gives r is e to infra-red
29emission in zinc sulphide and recently Reynolds and Garlick
2+have found infra-red emission due to Mi in various phosphors
at low temperatures. At higher temperatures non-radiative
de-octivation predominates.
3.2 Crystal Field Theory.
On account of the shielding e ffect o f the outer bonding
electrons on the un filled 3d shell of the f i r s t transition series
elements, the energy leve ls of such a transition-metal ion in a
la ttic e can be described as the energy levels o f the free ion which
are subject to a perturbation on account of the presence o f the
surrounding anions or ligands.
In predominantly ionically-bonded structures the transition-
metal ion is considered to be in a resultant e lec trosta tic f ie ld
due to the surrounding anions which, in the f ir s t approximation, are
considered to be point charges. This simple theory has met with
considerable success in qu alita tive ly explaining many aspects of
30transition-metal chemistry • The e ffe c t on the energy leve ls of
the transition-metal ion, which substitutes in a la tt ic e cation
position, depends on the symmetry and intensity o f the crysta lline
fie ld and therefore, in particular, on the type and position o f the
surrounding anions.
The d-orbitals o f an atom or ion are fiv e - fo ld degenerate
(neglecting spin) and can accommodate up to ten electrons. Each
orbita l has, in general, four lobes extending along two mutually
perpendicular axes. The sign of the wave-function for lobes
extending in opposite directions is the same and opposite to that

13.
for lobes extending in a perpendicular direction. With respect to
a set o f cartesian axes x, y, z along which the p-orbitals l i e ,
three o f the d-orbita ls designated d , d , d have lobesxy’ yz ' xz
projecting in directions making equal angles with the axes specified .
degeneracy and the subscript 2 indicates that the orb ita l does not
change sign on rotation about axes diagonal to the cartesian axes
x, y, z. The subscript g refers to inversion symmetry and w il l
be explained la te r. The remaining two d-orbitals, designated
o f these orbita ls as possible with parallel spins since this gives
lowest energy i f the electron interaction energy is greater than the
energy o f interaction with the crystal f ie ld . In a perfectly
spherical f ie ld the energy of the d-orbitals would simply be increased
but in a non-spherically symmetry environment the d-orbita l energy
levels are sp lit and at least some degeneracy is lo s t. In a simple
cubic, tetrahedral or octahedral co-ordination the leve ls sp lit
into two leve ls , the eo group forming one and the t? group the other.
In octahedral co-ordination with six identical anions or ligands
situated on the cartesian axes x, y, z, the lobes of the e^ orb ita ls
w ill be repelled to a greater extent than tp^ lobes since e^ lobes
are directed towards the ligands. Hence e orb ita ls w ill have higher
designated by a crystal f ie ld parameter A for octahedral co-ordination,o
These orb ita ls are designed tp o rb ita ls : t re fers to the three-fold
^x*._ y a.and ^za. » have lobes directed along the cartesian axes
and are described as e orb ita ls, e referring to the two-fold
degeneracy.
According to Hund's rule, electrons w ill occupy as many
In a tetrahedral or cubic co-ordination3
* - t 0 energy separation is

14
A t for cubic, etc» The sp lit levels obey a 'centre of g rav ity '
rule about the energy leve l that a ll d-orbitals would have i f
the intensity o f the crystal f ie ld was identical but spherically
symmetric, Tn octahedral co-ordination, therefore, the e levels3 . 9
are — above the leve l for the spherically symmetric case and2
the t 0 levels _ A below i t . Since the t „ levels are lower ¿g 5 o 2g
in energy they w ill be occupied before the e leve ls . Each electron
in a t^^ orbita l therefore stabilizes the transition-metal ion by
? A c whilst each electron in an e orbital de-stabilizes the ion
3 A 9by 5 . The nett stabilization energy of an ion in a particular
environment is called the crystal fie ld stabilization energy
(C.F.S.E.) and re la tive values o f this parameter for d ifferen t sites
give an indication as to what co-ordination a particular ion prefers.
However, transition-metal ions with the d configuration (h a lf-
f i l le d shell) such as Mn?+ or Fe^+ have zero C.F.S.E. in a l l
possible co-ordinations.
The crystal f ie ld sp litting parameter A is not the same
for a ll co-ordination s ites } in fact
A (octahedral) * A. (tetrahedral) A„ (cubic)c 4 t o C
The minus sign indicates reversal o f the order o f t ?rj and e^ groups.
I f the co-ordination is distorted from a simple symmetry,
as is often the case, further sp littin g of both the t j and e^
leve ls may occur and each d-orbita l energy level may become non
degenerate, neglecting spin degeneracy (see Fig. 8) .
2+Calculations o f the C.F.S.E. fo r Fe ions in M1 and
sites in orthopyroxenes have been made from the positions o f the
2+absorption bands which show that Fe ' has a slight preference fo r
the site in spite of the fact that A is estimated to be
l . r 3. r fo r ,h* “1 14C- H « .v . r , th . F .»* h, vln3 . d6

configuration gains additional C.F.S.E. in a distorted octahedral
site re la tive to an undistorted one since the sixth electron enters
the lowest t ^ leve l which has sp lit to an even lower energy. Thus4 A J
the s ite which is more distorted than the s ite is preferred •
17 *31X-ray d iffraction studies and MWssbauer measurements' on
orthopyroxenes have confirmed this s ite preference.
15.
The size of A for a transition-metal ion depends on
several factors. I t is larger for trivalent ions than for divalent
ions and its magnitude w ill also depend on the type o f ligand with
which it is co-ordinated. I t depends c r it ic a lly on the metal-ligand
distance R since A oC —c, 1 i f other variables mentioned remain R3
fixed, where Q is the charge on the ligands. F inally, the magnitude
o f the crystal f ie ld sp littin g parameter depends on the co-ordination
symmetry, as mentioned above, although for highly distorted sites
A loses some of its significance since many d ifferen t energy
separations w ill then ex is t.
In simple crystal fie ld theory it is assumed that there
is no overlap o f metal and ligand orbitals which is never absolutely
true for structures in which at least some degree o f covalent
bonding occurs. In fact, theoretically calculated values of the
crystal f ie ld sp littin g parameter using the simple e lec trosta tic
theory are invariably smaller than values derived experimentally
R2from absorption spectra • There is also evidence from electron
spin resonance measurements that even in fluorides such as MnFp some
delocalisation of d-electrons occur and 'd '-o rb ita ls may have 1 C$
33or more o f ligand orb ita l character' ’ . The modified theory which
takes account of such orb ita l overlap is referred to as ligand fie ld
theory’ • In this modified theory, A is taken as the sum of
ionic and covalent components and is an adjustable parameter to be
determined by experiment. For structures in which covalent bonding
J

16
is predominant a molecular orbital approach 5s used in which A
s t i l l represents the energy separation of t ^ orbita ls and
antibonding er, orbita ls ahd Is indicative o f the strength o f the
metal-ligand bonds#
3.3 Hie ion.
2+The Mn ion prefers the s ligh tly larger s ite in
14^pyroxenes rather than the site , but this is on account of
its larger s ize compared with Fe and Mg and not because o f
crystal f ie ld e ffec ts since it has zero C.F.S.E,
2+In it s ground state the Mn ion is in a high spin state
(sextet) since a ll five d-eloctrons have para lle l spins in
accordance with Hund's ru le, and since it has one electron in each
d-orbita l, i t is also spherically symmetric. Obviously, any single
electron excitation in the 3d shell is going to lead to a quartet
state necessitating a sp in -flip . In fact, the f ir s t excited state
4 34 5is a G state . The ground state o f a d configuration is not
sp lit to any significant extent by the crystal f ie ld . However, the 4G state is sp lit into four components as shown in Fig. 7j the lower
component approaches the ground state in energy as the crystal
fie ld sp littin g increases. The luminescence emission o* the Mn ion
in many la ttic es has been postulated therefore as being due to the4 g
transition which w ill tend to be o f lower energy
(longer wavelength) as the crystal f ie ld sp litting Increases. In
fact, the wavelength o f the emission peak varies from about 5200 A in Zn^SiO - Mn to about 6700 A in MgSiO - Mn.
I t is surprising that a strong emission occurs since
the transition involved is forbidden by the following selection
rules. F irs tly , i t is spin forbidden since i t involves a change

17
o f m u ltip lic ity . Nevertheless, transitions involving a spin
change are only s tr ic t ly forbidden when there is neglig ib le
spin-orbit coupling and th is is only true for atoms o f low atomic
number. In heavy atoms such as mercury, transitions involving
spin change give rise to strong emission lines (e .g . the 2537 A
Hg lin e ). In hydrocarbon molecules where spin forbidden transitions
have a very low probability, heavier halogen atoms are often
introduced to induce s in g le t- tr ip le t transitions.
2+The Mn emission is also forbidden by the Laporte rule
for an e lec tr ic dipole transition . I f in a particular state the
electronic wave-function is symmetric with respect to inversion
about a centre o f symmetry, i t is termed a g-state (gerade). On
the other hand i f the state is anti-symmetric with respect to
inversion in a centre o f symmetry i t is termed a u-state (ungerade).
The Laporte rule states that only transitions between u - and
g - states are allowed since transitions involving states o f
similar symmetry would mean that the transition dipole moment
integral would change sign on inversion and must, therefore, be
2+zero. However, i f the s ite in which the Mn ion is situated is
not s tr ic t ly centro-symmetric, the assymmetrical ligand f ie ld
perturbs the d-electron wave-function such that d-orbitals no
longer have s tr ic t ly g character and some p-orbital character is
introduced. Since a p d transition is strongly allowed such
mixing o f d - and p-orh itals causes some relaxation o f the
forbiddenness. Even in a centro-symmetric environment the
forbiddenness may be relaxed owing to vibronic coupling i . e . by an
appropriate combination o f electronic and vibrational wave-functions.
I f during a vibration the centre o f symmetry ceases to ex ist then
again the s tr ic t ly g-character o f the d-orbitals is lost«

13,
For allowed electric dipole transitions the lifetim e is
-*8of the order o f 10 secs (see Section 3,1) but i t is noteworthy
2+that the lifetim e o f the Mn excited state is seldom shorter_3
than about 10 secs and in a highly symmetric environment can be■ 2 4
as long as 0.1 sec (CaF^) . In this la tter case the emission is
thought to be o f magnetic dipole character. The osc illa to r strength_5
o f a magnetic dipole transition is o f the order o f 10 . I t is
important to note that for e lec tric rjuadrupole or magnetic dipole
radiation the Laporte rule is exactly the reverse o f the e lec tr ic
dipole case ( i . e . g ■<->• u forbidden instead o f g*-*-u allowed).
Fonda has reviewed the emission characteristics o f a
number of manganese-activated phosphors and found good correlation
2+between the wavelength of emission and ?ln' environment! the
more crowded the environment the longer is the wavelength o f 35
emission • The average metal-oxygen distance fo r the oxide was
quoted as being applicable to the s ilica te since such data was not
available for s ilic a te s at the time (1957).
However, although the Metal-oxygen distance way be the
■oat important factor governing the wavelength of sad. ss ion, there are
many other factore to be considered which affect the value of the
crystal fie ld sp litting parameter, as indicated in Soction 3.2.
Moreover, i f the Mn2+ environment is of low symmetry the degenerate
4T^g level w ill be sp lit into three components. Very recently,
Palumbo and Brown have found that the excitation spectrum of
ZnjSiO^ i Mn shows such splitting of the 4T ^ level
A discussion o f such factors w ill be given later with
reference to the wavelength of emission in the s ilic a te s under
investigation.

2 5Partial energy level diagram for the Mn ion (d configuration)
showning the variation in energy of excited states with the
crystal fie ld sp litting parameter A . Only quartet states
are shown and energies are measured from the ground state
(not shown) which is not split to any significant extent by
the crystal f ie ld . (A fter O rge l'* ;.
Energy level diagram for 3d orbitals of transition metal ions
in lattice sites of different symmetries.
(a ) octahedral) (b ) tetragonal (elongated along the tetrad
axis)) (c ) trigonal (compressed along triad axis)) (d ) monoclinic.
The metal-oxygen distances are assumed to be the same for each
site . (A fter Bums 14^),
<«) <»> W M

19
3.4 Cathodolumlnescence and Ionolumlnescence.
The mechanisms involved in particle-excited luminescence
are complex involving many possible stages. F irstly , considerable
backscattering of the incident particles (particu larly electrons)
usually occurs without loss in energy ( i . e . elastic scattering)
and this reduces the overall efficiency of the luminescence
37process • Once a particle has penetrated into the so lid , ionisation
w ill occur producing secondary electrons. Further losses may,
therefore, be involved by loss of some of the faster secondaries
from the surface. I f the incident particle is a heavy particle
(e .g . a proton), ionisation and excitation w ill be confined to a
narrow cylindrical channel along a reasonably straight path.
However, for an incident electron large angle scattering may occur
and the depth of penetration into the solid may bear l i t t le
resemblance to the actual length o f the electron path. Ehrenberg
and Franks have shown that the excitation volume is approximately
spherical fo r low energy electrons. For higher energy electrons
I MeV) the excitation volume is a cylindrical channel ending in
a nearly spherical volume of diffused electrons, both primary and
38secondary.
The term 'ionisation* applied to solids usually means
that an electron has been raised from the valence band to the
conduction band leaving a hole in the valence band. Garlick estimates
that this process in zinc sulphide takes a mean energy from the
37primary electron of approximately three times the band gap.
Radiative recombination of electrons and holes can then occur via
luminescence centres as in photoluminescence.
In organic phosphors, sulphides and alkali-halides
experimental evidence exists of the formation of bound eloctron-hole

20
pairs known as axcitons. These excitons are mobile and since
the electron is not completely dissociated from the hole, less
energy is expended in its formation than for excitation to the
conduction band» In pure defect-free crystals, exciton migration
can be a very effic ien t means of energy transfer without charge
transfer» However, an electron in the conduction band may become
associated with a hols in the valence band to form an exciton
which may then become trapped by a defect or luminescence centre*
Since conductivity is excited in this second mode of formation
i t is d iffic u lt to separate experimentally from a dissociated
electron-hole pair.
In manganese-activated phosphors, excitation of the
centre may occur directly or by capture of an exciton, or by
resonance transfer of the excitation energy from another centre
known as a sensitizer. Alternatively, the centre may be ionised
and la ter recombination of the ionised centre with an electron from
the conduction band may occur giving emission,
l - io oFor ions in the^KeV region the incident particle loses
energy by two processes on entering the so lid . Energy may be lost
by intsraction with the electrons of the solid or by slastlc
collisions with the lattice ions. The former process may give rise
to luminescence amission and the la tte r to phonon omission or
la ttice ion displacements* The recoiling ion may also cause
electronic excitation but th is process is probably not important
for incident protons*
The process of excitation o f luminescence by charged
particles has received much attention particularly with respect
to the detection of such p srtic lss using organic and alkali halide
sc in tilla to rs (See e*g* Birks39 and Garlick‘d ) . Of particular
concern is the efficiency o f the luminescence process for d iffe

20,
pairs known as sxcitons. These excitons are mobile and since
the electron is not completely dissociated from the hole, less
energy is expended in its formation than for excitation to the
conduction band* In pure defect-free crystals* exciton migration
can be a very effic ien t means of energy transfer without charge
transfer* However, an electron in the conduction band may become
associated with a hole in the valence band to form an exciton
which may then become trapped by a defect or luminescence centre*
Since conductivity is excited in this second mode of formation
i t is d ifficu lt to separate experimentally from a dissociated
electron-hole pair.
In manganese-activated phosphors, excitation of the
centre may occur directly or by capture of an exciton, or by
resonance transfer of the excitation energy from another centre
known as a sensitizer. Alternatively, the centre may be ionised
and later recombination of the ionised centre with an electron from
the conduction band may occur giving emission.
l - l o oFor ions in the^KeV region the incident particle loses
energy by two processes on entering the solid* Energy nay be lost
by interaction with the electrons o f the solid or by elastic
collisions with the lattice ions. The former process may give rise
to luminescence amission and the la tte r to phonon emission or
la ttice ion displacements* The recoiling ion may also cause
electronic excitation but this process is probably not important
for incident protons*
The process of excitation o f luminescence by charged
particles has received much attention particularly with respect
to the detection of such particles using organic and alkali halide
scin tillators (Sea e*g* Birke39 and Garlick3^ ). Of particular
concern is the efficiency of the luminescence process for different

21
particles of d iffarsnt energies* Silver-activated zinc sulphide
has a remarkably high efficiency for 20 KeV electrons (25#)40,
for oc -partic les ( ~ 2 0 * ) 239, and for 25 KeV - ions ( — 23g6)41.
Manganese-activated zinc s ilica te also appears to have similar
40luminescence effic iencies under irradiation by 20 KeV electrons
and 25 KeV H2+ ions41, although according to Hanle and Rau41 the
efficiency of both ZnS-Ag and Zn^SiO^ - Mn is considerably reduced
when much heavier ions (e *g . argon) are used for excitation.
Organic scin tillators» however» show a considerably
different luminescence efficiency for electrons» protons and
42oc-partic les of similar energy* Data collected by Brooks
for anthracene show relative luminescence yields for these particles
at different energies (lOKeV - 10MeV). For example» at a particle
energy of 100 KeV» electrons are about five times more e ffic ien t
in producing luminescence than protons and about seven times as
e ffic ien t as oc -partic les* These differences may be thought to
be a consequence o f the fact that the heavier the partic le the
greater the proportion of kinetic energy expended in nuclear
co llis ions rather than electronic excitation. However» for protons
and oc -partic les the proportion of the kinetic energy expended
in such collisions at energies above a few KeV is re lative ly small
and cannot explain the large differences in luminescence efficiency
compared with electron excitation* These differences are»
therefore» attributed to the different ionisation densities
prevailing and thus to the different values of the specific energy
loss . For low energy electrons or for heavier particles the dx
specific density of ionised or excited centres w ill be much higher
than fo r higher energy electrons and interaction between ionised
and excited centres w ill occur. Blrks has postulated that such

22
interaction give» rise to a quenching of the primary excitation .
Thallium-activated a lka li halides also have different
luminescence effic iencies for d ifferent particles of the same
energy, although unlike organic sc in tilla to rs a plot o f luminescence
efficiency against ^ usually exhibits a maxlain at a
particular • The f a l l in luminescence efficiency for high dx
specific energy losses is again thought to be an ionisation
37quenching effect .
However, for other phosphors it appears that ionisation
quenching is not an important process for protons or ©C -partic les
of energy greater than a few KeV. Van Wijngaarden at a l have
found that the luminescence efficiency of Zn2Si04 - Mn is
independent of energy in the range 3 - 1 0 0 KeV for proton excitation43.
For excitation by heavier lone (A *, Kr+ , N+) the lumineacence
efficiency which is lower than for proton excitation, increased
with energy in this range. These authors attribute this phenomenon
to the fact that the stopping cross-section for "nuclear" collisions
SR ( i . e . co llisions with lattice ions) is comparable with the
stopping cross-section for electronic excitation S# at lowor
energies for heavy ions. As tho energy increases SR fa l ls and S#
increases and thus a higher-proportion o f the kinetic energy of
the particle is available fo r electronic excitation. Using
theoretical values for S and S_ derived from the work of Lindhard
et a l44*49. Van Nijngaarden at a l aasune that the total luminescence
output L produced by one particle along its entire path is
proportional to the total energy lost to electrons and obtain the
expression
L ■ C
I
39

23
where the integration ie performed numerically and the constant C
is then chosen to give the best f i t with experimental data.
For heavier ions (A+ , N+ e tc .) they found that even with a
'best f i t ' value of C the experimental plot of log L against
log E had a s ligh tly larger gradient than the corresponding
theoretical curve. Moreover, i f the value of C evaluated to
give the best f i t for A+ ions is used for the theoretical curve
for protons i t is found to predict a lower luninescence efficiency
for proton excitation than is found by experiment. Thus i t
appears that some ionisation quenching may be operative for heavier
ions which produce a larger specific ionisation. This would have
the effect of making C dependent on energy and on the mass of the
particle. However, for excitation by lighter ions such as protons
it appears that the luminescence efficiency of Zn2Si04 - Mn may
approach that fo r electron excitation in the KeV energy range.
3.5 Ion-radiation damage in luminescent materials.
In general, when a luminescent material i s bombarded by
a large flux of ions the luminescence intensity under steady
excitation fa lls appreciably with time of irradiation . The decrease
of luminescence efficiency which is more rapid in it ia l ly and
decreases with time, is probably due to the introduction of defects
into the structure which act as quenching centres*
Even protons of KeV energy are capable o f producing
many vacancy-interstitial pairs in a lattice whereas the energy
threshold for incident electrons to produce such atomic displacements23h
is of the order of a few hundred KeV • According to Qirie
one H2+ ion of 1GKeV energy produces about 20 vacancy-interstitial
pairs in germanium. The production of vacancy-interstitial pairs
and possible aggregation of such defects are the major offsets of

24
ion-radiation damage in crystals4^.
The number of lattice displacements w ill increase as
the mass of the incident particle approaches that of the lattice
ion since a greater fraction of the particle momentum w ill then
be transferred to the lattice ion. In this case the knocked-on
lattice ion may i t s e l f produce further secondary defects. The
number of such secondary knock-ons is a function of the incident
particle mass and energy, being large for heavy high energy
particles. When the mean free path between displacement collisions
is comparable with the lattice spacing the aggregation of defects
is inevitable and a 'displacement spike' may occur47. However,
for protons th is process is unlikely to occur except perhaps near
the end of its path.
Hanle and Rau4 have studied the degradation o f
luminescence in ZnS t Ag, Zn2Si04 t Mn and MgW04 when irradiated by
25 KeV hydrogen and inert gas ions. They found that the heavier
the ion, the faster the phosphor deteriorated for a given rate of
incidence of ions per unit area. The variation of luminescence
intensity I with tota l number o f incident ions N was found to follow
the relation Z ■ ..--1 °.____ (1 .7 )1 ♦ CN
where ZQ is the in it ia l luminescence intensity and C is a constant,
known as the damage constant, fo r a given phosphor and incident
ion. The magnitude of this constant is a measure of the rate of
degradation of luminescence. The above relation was f i r s t derived
to describe the degradation of luminescence in anthracene crystals
48when irradiated by oC - particles .
G iIfrich has found the above relation to hold over
certain ranges of N for a variety of phosphors when irradiated by
10 KeV protons4* . The value of the damage constant C was found

25
to increase generally with type of phosphor in the following
order} a lkali-halides, oxygen-dominated phosphors (s ilic a te s ,
tungstates, e tc »), sulphides, organic phosphors» Values of C
ranged from 0.05 . 10~14 cm2 for NaCl t Ag to 2 0 0 .10"14 cm2 for
anthracene, and appear to be indicetive to some extent of the
relative strength of the chemical bonds in these materials* As
might be expected, the stronger the bonding, the more resistant
is the material to radiation damage* However, other factors also
influence the value of the damage constant since G ilfrich found
that the degradation of luminescence in ZnS t Mn was much slower
than in ZnS i Ag although varying the concentration of Ag in
ZnS t Ag had l i t t le e ffect on the value of C* Martin has shown
that the value of C is practically independent of incident particle
energy fo r Hg* ions in various phosphors in the renge 4 - 4 0 KeV
50although i t is marginally larger at lower energies • However,
more recently, Van Nigngaarden and Hastings have pointed out that
the values of the deterioration constant C determined by previous
workers are for Integrated light output over the ion energy range
from the incident particle energy to zero ' • These authors
have, therefore, determined values of the damage constant for
particular ion energies in ZnO i Zn. They find that for incident
protons, C, evaluated for particular energies, decreases with
increasing particle energy in a similar way to the predicted
variation of the cross-section for nuclear collisions S .n
The probability of s direct collision with a lattice ion
must be dependent on the direction of travel of the particle with
respect to the crystallographic axes* The phenomenon of proton
"tunnelling" along a path through the crystal where its probability
of direct collision is very small, i s now well-knoMt. However, for

26
randomly orientated microcrystalline powders, this effect is
not lik e ly to be important* The mean penetration depth of protons in
powdered phosphor material has been estimated in an ingenious way by
53Young . A phosphor screen was irradiated with a given quantity
of heavy ions and then a variable-energy electron beam used as a
probe to determine the degradation of luminescence and the depth
of such damage. The penetration depth of 20 KeV protons was
estimated to be about 0*1 microns (10**^ cm) and was shown to
increase approximately linearly with incident ion energy in the
range 5 - 2 5 KeV* Annealing the damaged phosphor by hesting to
a high enough temperature for the migration of defecta to become
appreciable restores the luminescence efficiency to some extent*
Young found that the luminescence efficiency of ZnS t Ag could be
completely resuscitated after damage by hydrogen ions by baking
at 450°C for several hours* Grosser end Scharmenn have uaed
Young's technique to investigate the deterioration of tungstates
54and phosphates with similar results •
3*6 Thermoluminescence«
Thermoluminescence, better termed 'thermslly stimulated
phosphorescence', occurs when a phosphor is hasted in the dark
after excitation at a low temperature. During this excitation
electron trapping states are f i l le d and during subsequent heating
the probability of trapped electrons being relessed is incressed
and emlasion is observed as released electrons undergo recombination
via luminescence centres* The rate determining step is the
probability P of release of s trapped electron according to a
Boltzmann type law, P - I ■ •• U ,B '
where X is the trap lifetiaw and s is a constant termed the
'frequency of attempted escape'• A plot of light output against

27
temperature yields a 'glow-curve' which is essentially an energy
spectrum of the depth of trapping states* The light output
at a given instant I ■dt
" E/kT (I* 9)
where n is the number of electrons s t i l l trapped at this instant*
Replacing dt by where f l is the heating rate and separatingf i '
the variables gives on integration
or
■ « / s exp ( - £J r kT
) £ (1.10)
ft
{ - fT' • < - I t >j )
(1.11)no #XP
where nQ is the in it ia l number of trapped electrons at temperature
Tq* Substitution for n in equation (1*9) yields
nQ s exp ( - j*T ) exp {- / • «■> <- It > f] "•1J)
A plot of this function yields a smooth curve climbing to a
maximum at some temperature Ta and fa llin g again approaching zero
as T becomes ^ T a * At the peak of amission £ ■ 0
andkT_
s exp ( - L ) m
(1*13)
Thus i f s is known, E can be calculated* This simple theory
in which only one trap depth is considered was f ir s t fom ilated
by Randall & Wilkins95 and later developed by Garlick & Gibson9*
who also considered the possibility o f retrspping of relessed
electrons* I f such rstrapping is considered to occur, the kinetics
becosM second order and the thermoluminescence intensity
dn _ - £ • ndt (N • n) t n
„2 2■ - n
N't- s exp ( • ) (1.14)
where N is the number of traps and n the number of electrons in

28
traps. Here i t is assumed that traps and centres have equal
cross-sections for electron capture* Completing the formalism
as for 1st order kinetics gives for 2nd order kinetics
The shape of this function is sim ilar to equation (1.12) but with
a longer ta il on the high temperature side. The position of Tm
is approximately the same as in (1 .12 ). Recent development of
the formalism of thermoluminescence mechanisms have considered
different values of a retrapping factor R which is the ratio of
57the cross-section for retrapping to that for radiative recombination
Simple theory with no retrapping is the special case when R ■ 0
whereas R ■ 1 is the special case of second order kinetics with
equal cross-sections fo r the two processes. For R 1, retrapping
predominates i f the number of traps is of the same order as the
number of recombination centres.
Methods of determining trap depths from glow curve data
are now numerous but usually fa l l into one of the following basicKQ
categories* (1 ) Quick approximation methods • (2 ) The 'in i t ia l -
r is e ' method^*. (3 ) Methods which use the emission peak shape^.
(4 ) Methods which use the variation of Ta with heating rate .
A ll methods assume the type of kinetics involved although method (2 )
is independent of type of kinetics provided the number of empty
recombination centres is much greater than the number of electrons
in traps. Brlunlich has shown that i f this provisor is not
fu lf i l le d then method (2 ) is only accurate for Rj{157. Booth's*0
method (4 ) as also used by Hoogenstraaten is useful since Ta
is not appreciably altered from that given by the simple Randall &
Wilkins formulation unless R ^ 1. Thus for several different
I - (1.15)

29
heating rates, a consideration of equation (1.13) shows that a
plot of log# A against _2_ w ill give a straight line ofm
Egradient - . The great advantage of methods (2 ) and (4 ) is the
elimination of s which otherwise has to be estimated.
However, in geological applications calculation of
trap depths is seldom attempted and thermoluminescence is used
either as a "finger-printing" technique or as a method of dating.
4. Possible luminescence and radiation damage of the lunar surface.
4.1 Possible lunar luminescence.
For some years now the question of whether measurable
luminescence occurs at the lunar surface has been a controversial
issue and many excitation mechanisms have been proposed which
might account for luminescence of the surface material. The crux
of th is controversy has been whether luminescence could be excited
by various components of the solar 'wind' or of solar flares
which would be bright enough to be measurable against the
background of reflected solar light. The lunar surface is , in
fact, a very poor re flector, reflecting only about T% of incident
ligh t. The remaining fraction is absorbed and converted into heat,
giving rise to in fra-red emission. Evidence for luminescence
emission comes from three sources*- (1 ) Transient 'events'
involving localised changes in colour or brightness of a particular
area on the lunar surface, (2 ) The brightness of the surface during
soam lunar eclipses, and (3 ) light emission other than reflected
light as revealed by measurement of Fraunhofer line depths.
Transient 'events ', whatever their origin, are certainly
not uncommon aince in 1966 Burley and Middlehurst listed soam 238
such reported occurences including about 50 in the period 1960-6^ •

Nearly half of a ll auch events concern the region of the crater
Ariatarchus but this nay be due partly to the fact that
Aristarchus has been observed much more than other areas* Many
mechanisms have been suggested in an attempt to explain such
events and these include volcanic activity , fluorescence of gaseous
emission, surface fluorescence excited by solar radiation and
tharmoluminescenes of the surface*
Many reports involve sightings of red glowing areas and
a well-authenticated sighting of this type was witnessed by
several astronomers in 1963 (Greenacre )• Kopal and Rackham
photographed through a red f i l t e r what they claimed to be red
glow near the crater Kepler, by comparison with a photograph taken
through a green filte r* They suggested that this glow could be
correlated with a solar fla re whioh occurred 8 hours previously*
The time lag was assumed to be the transit time of the solar
particles which i t is claimed produced red luminescence over a
large area of the surface* However, some doubt has been expressed
concerning their photographs and more recent systematic observations
using similar techniques fa iled to detect any such luminescence^4*
Moreover, Middlehurst^ found that soom 103 events up to 1964 were
not correlated with times of solar activity*
66Link was possibly the f ir s t to suggest that lunar
luminescence might be caused by particles trttich resulted from
solar activity* This suggestion was an attempt to explain the
anomalous brightness of the moon during some eclipses* According
to Link light refracted by the earth 's atmosphere is absorbed by67
ozone before i t can reach the eclipsed moon* However, Ney et a l
believe that bright eclipses are caused by such refracted light
and dark eclipses by the scattering of this light by dust particles

31
in the atmosphere such as would be experienced after volcanic
eruptions* Link presumably invokes the earth 's magnetic fie ld
to deflect charged particles from the sun onto the eclipsed
moon. In the latest contribution to this subject, Dubois and Link
invoke the UV and x - radiation from the outer corona as the
excitation*
The possib ility of detecting steady luminescence
excited by either short UV or quiet solar wind protons using
the Fraunhofer line depth method was orig inally suggested by
Link^ and several workers have obtained positive results by this
method * ^ 71* A Fraunhofer line p ro file is scanned viewing
the sun d irectly and then by viewing sunlight reflected at the
lunar surface* The difference in line depth is attributed to
light originating from the Moon's surface* This method has
the advantage that any luminescence emission can be measured in
the presence o f reflected sunlight and unlike observations on
eclipses and transient events, i t is not prone to atmospheric
interference* However, Grainger & Ring71 have found some peculiar
time fluctuations in the line depth and show that when instrumental
errors are eliminated the luminescence background is less than 3K
of the continuum.
By considerations of the energy available, Nash has
shown that transient 'events' such as described by Kopal & Rackham
cannot be ascribed to luminescence induced even by strong solar
72flare protons • More recently he has also shown that proton-
excited luminescence of lunar surface material of the type returned
by the Apollo 11 mission could not even be detected by the 'lin e
depth' method73* In fact, i t seems unlikely that luminescence
excited d irectly by solar ions can be responsible for any
measurable effect* There remains the possib ility of short UV or
68

32
X-ray excitation but again the energetics o f the process« although
■ore favorable than particle excitation« are s t i l l unlikely to
give enough luminescence intensity* Since thermoluminescence
involves an energy storage mechanism it has been suggested that
this process may be responsible for some transient events* Sidran
has discussed this possib ility and has pointed out that many
transient events are correlated with lunar dawn • However«
excitation mechanisms do not appear to be fu lly considered and some
mechanism must be found of f i l l in g traps when radiation from the
sun is not reaching the surface i*e* during lunar night* Moreover«
recent results on thermoluminescence of actual lunar surface
material are not encouraging although samples are as yet from only
two particular locations* Thermoluminescence of these samples
has proved to be of very low intensity and the traps responsible
have been shown to be 'leaky ' i.e * the stored energy decreases11,76,77
rapidly with time since excitation.
In conclusion, i t appears that many effects concerning
the luminosity of the lunar surface cannot be explained by
luminescence o f the surface material*
Nevertheless, the study o f the luminescence of minerals
can yield much valuable information and is of interest for it s
own sake, particularly when comparisons are made with synthetic
samples of carefully controlled composition*
4.2 Radiation damage of the lunar surfact.
Although, the lunar surface is not weathered in the way
the earth's surface is , i t is not shielded by an atmosphere from
meteors, or the solar wind* Thus the lunar surface w ill be
bombarded by micro-meteoritic particles as well as larger meteors*
Moreover, after many aeons of solar wind proton irradiation the

33
surface layer would be expected to be extensively radiation
damaged and» therefore» appreciable luminescence would not be
75expected* However, Geake has suggested that disturbances such
as the arriva l of a meteor may expose fresh undamaged material*
Since the energy of protons in the quiet solar wind is
of the order of 2 KeV or less7®’ 7^ the penetration depth w ill be
very small* For solar fla res , in which particles of a few MeV
may be present, the penetration depth w ill be much greater but
then the integrated flux is much smaller* Laboratory experiments
concerned with bombardment of rock samples by large doses of low
80 81 82energy protons have been carried out by Wehner et a l * , Hapke
83and Nash in order to ascertain the possible condition of the
lunar surface*
Wehner et al found that many powdered samples darkened
appreciably under simulated solar wind boabardment and suggested
that many of the unusual properties of the lunar surface such as its
low re flec tiv ity could be explained by the action of the solar
wind* Dollfus has measured the degree of polarisation o f moonlight
for d ifferent phase angles for several regions of the Moon using
84a Lyot polarimeter • He has shown that i t is very d i f f ic u lt to
match the moon's polarisation characteristics using te rre str ia l
rock samples* The closest match requires a fine dark coloured
85basaltic rock powder. However, Dollfus & Geake have made
polarisation measurements on a powdered enstatlte achondrite
meteorite sample which was lntansively proton irradiated by the
author and found that such treatment resulted in a very goot match
with the moon's polarisation characteristica* Hapke also found
that a number o f rock powders had polarisation versus phase angle
curves similar to the lunar surface after being irradiated by large

34.
doses of 2 KeV protons* In fact, Hapke concluded that the
composition of irradiated rock powders did not seem to be very
critica l in determining their photometric properties.
Nash, however, has shown that darkening of silicate
rock powders under proton irradiation is considerably reduced
i f precautions are taken to reduce various possible contaminants.
Carbon from irradiation-decomposed hydrocarbons and sputtered metal
from ion source components are suggested as the contaminants
responsible for the darkening e ffec t. He found that proton
darkening was appreciable only i f the proton flux was high enough
to produce a sample surface temperature of above 150°C. Nash,
therefore, concludes that the hypothesis of a solar-wind darkened
lunar surface is supported by experimente which are unrealistic
in reproducing the conditions of solar-wind bombardment of the
-__ - - --- ----
lunar surface


35
1. The 120 KeV proton accelerator system.
The accelerator, in it s original form, has been4
described in detail elsewhere and, therefore, a more brie f
description w ill be given here but fu ll deta ils of recent
modifications w ill be included*
1.1 General Description*
The general arrangement is shown in Figs. 9 and 10.
Spectro-grade X hydrogen (BOC) is leaked into the evacuated ion
bottle by means of a needle valve. Here i t is ionised by an
R.F. fie ld and the positive ions (mainly protons) pass through
a canal and are accelerated by the potential difference (usually
about 60 KV) between the canal and an earthed cylinder. In order
to reduce ion recombination, electrons are extracted from the
plasma by an electrode in the top of the ion bottle which is
held at a potential of a few hundred volts positive with respect
to the canal. After acceleration the protons coast along the
axis of the earthed cylinder and a further extension tube until
they h it the sample area which is approximately three feet from the
canal. At th is point the proton beam is about one inch in diameter.
This is not merely a shadow image of the canal as previously stated4
since a degree of focussing is attained by the electrode arrangement.
The whole system was orig inally evacuated via the sample
chamber by a 2" o il d iffusion pump (Edwards F 203) with liquid
nitrogen trap backed by a single stage 50 1/min rotary pump
(Edwards 15C50B). The ultimate pressure of the system was about
5. 10'6 torr and the working pressure with hydrogen leak about
5 • IQ“5 torr.

General arrangement of the 120 KeV proton accelerator
system after modifications*

Fig, 10. General view of the lower part of the 120 KeV proton accelerator
system after modifications*
H *
Ir
m

Fir]. 10. General view of the lower part of the 120 KeV proton accelerator
system after modifications.
>

Fig. 10A Close-up view of sample chamber and pumping system.
The comparison channel photomultiplier housing is seen
in the le ft foreground. The monochromator, which ie
on ra ils , has been moved away from the sample chamber
to enable a change of samples to be made. This
photograph was taken when the orbitron pump was
connected directly to the accelerator tube. I t is
now connected via a large bore valve.

Fig» 10A Close-up view of sample chamber and pumping system.
The comparison channel photomultiplier housing is seen
in the l e f t foreground. The monochromator, which is
on r a ils , has been moved away from the sample chamber
to enable a change of samples to be made. This
photograph was taken when the orbitron pump was
connected d irectly to the accelerator tube. I t is
now connected via a large bore valve.

Th* proton source of the 120 K*V *cc*l*r*tor.
(A fter Derham and Geak*4)*
The sample chamber in its original form. The sorption pump
line has now replaced the flex ib le coupling which previously
connected a diffusion pump to the chamber* The flap valve
has also now been modified (see text)* (A fter Derham and Geake'

1.2 The proton source. and scctlarstor tub«
The eource and associated electronic equipment is
enclosed in the top box the whole of which is , under operating
conditions, at a high positive potential (usually 60 KV) with
respect to earth« This box is supported by three ebonite legs
(about 1 f t . long) and an evacuated 6" diameter Quickfit Pyrex
glass tube (about 18" long)>which encloses the accelerating
electrodes, provides s fourth support (see Fig. 9 ) . For safety,
the box is caged o ff and a trap door in the mesh, which gives
access for servicing, is fitted with a micro-switch which is in
the mains supply to the H.T. power unit.
The proton source it s e lf is shown in F ig. 11. The
design of the ion bottle is due to Mr. K.R. Chapman of Birmingham
University. The bottle is of Pyrex glass and has a narrow neck
connecting the main part with the bulb at the top in which the
electron extractor electrode is situated. The narrow neck
minimises the possib ility of proton bombardment of this slectrode.
The aluminium plug in which the canal is d rilled
(V i g diameter, j * long) is protected from ion bombardment by a
ceramic shield. A canal by»pass pipe enables the ion bottle to be
evscuated more quickly than it could be through the canal and a
valve in this pipe is closed prior to switching on the H.T. and
opening the hydrogen-leak needle valve. The needle valve is
opersted remotely using nylon cords. The source of hydrogen is a
glass flask which in it ia lly contains 1 l i t r e of gss at atmospheric
pressure.
Acceleration of the protons takes plsee scross a 1" gap
between the top plate and the top end of an earthed stainless steel
cylinder. This gap is shielded from the (Xiickfit glass tube by a

37
cylindrical skirt attached to the top plate.
1.3 Power Supplies.
The H.T. power supply for the accelerator (Brandenburg
MR 120) consists of a high frequency oscillator followed by a
Cockroft and Walton m ultiplier stack and gives a variable
stabilized D.C. output of 10 - 120 KV with less than 0.1# ripple.
The polarity can be reversed by inverting the multiplier stack.
The accelerator top box contains a 25W R.F. osc illator
(ex - Air Ministry) and a 0 - 4 KV stabilized H.T. unit (Labgear).
The R.F. osc illator is tunable around 50 MHz and the output tank
circuit is connected to two co ils wound round the ion bottle .
The oscillator is tuned for maximum output as indicated on the
output meter. The output of the 0 - 4 KV H.T. unit which is
connected to the electron extractor electrode is adjusted for
maximum proton beam current.
Since both the R.F. osc ille to r and extractor H.T. unit
are mains operated and at a high potential when the accelerator is
in operation, power for these is derived from a self-exciting
alternator in the top box which is driven along a 1 ft long
ebonite shaft coupled by a flex ib le drive to a 1. H.P. single
phase induction motor at earth potential.
A ll adjustments to the electronic units in the top
box are carried out remotely by means o f nylon cords fastened
to the various switches. Meters are read by means of illuminated
mirrors.
1.4 The sample chamber.
The sample chamber is machined out of a solid block of
dural and has five ports. A detailed diagram is shown in Fig.12.

38
To on« port is connected the vacuum roughing line and to another
a Penning gauge head* The protons enter via the top port which
can be closed using a flap valve in order to le t the chamber
up to atmospheric pressure for sample changing whilst keeping the
accelerator section at a reasonable vacuum* The flap valve is
insulated e lectrica lly from the chamber and connected via a spot
microammeter to earth so that i t can be used to intercept the
proton beam and thus measure the beam current*
The spring strip arm of the flap valve proved unsatisfactory
and has now been replaced by a rig id arm and b a ll jo int.
The sample holder locates in the base of the chamber
with a bayonet fitting and luminescence from the sample is
reflected through the lower window in the chamber by a plane
aluminised mirror* A second plane mirror mounted outside the
chamber re flects the light into the entrance s l i t of the monochromator*
The upper window fac ilita tes visual observation of the
sample and can be replaced by a re-entrant window which allows
part of the sample to be viewed using a microscope with a long
focal length objective*
In order to interchange samples without breaking the
vacuum, a sample holder has been made incorporating a rotatable
turret which holds four samples in 4* diameter stainless steel trays
(see Fig. 15). This has made the comparison of luminescence
efficiencies of various samples much easier*
Modifications to the vacuum system.
Common to a l l accelerator systems which are pumped by
o il diffusion and rotary pumps there is a danger that cracked
organic material may be deposited on the sample by the bombarding

39
particles« This is a well-known phenomena in electron microscopes«
Moreover, extensive proton bombardment of meteorite samples hasQC
led to pronounced darkening of grain surfaces and i t is
suspected that such deposition could have at least contributed
to the darkening. It is d if f ic u lt to determine how much of this
darkening is due to deposition and how much to genuine radiation
damage of the sample.
It was, therefore, thought desirable that for
investigations on actual lunar samples that organic vapours be
eradicated as far as possible from the vacuum system. The
existing pumping system was, therefore, replaced by an ion pump
for high vacuum pumping and sorption pumps for roughing.
Furthermore, a l l the existing seals in the system were of n itr ile
rubber and as an added precaution these were replaced by elastomer
"viton" seals which have a much lower vapour pressure. This
necessitated a complete dismantling and rebuilding o f the
accelerator vacuum system.
The dural plate at the base of the Quickfit pyrex tube
section and the original copper extension tube between this plate
and the sample chamber were replaced by a 1 f t diameter stainless
steel flange welded to a 2J-" bore stainless steel tube. This
new tube section incorporates a side-arm also of bore to which
the getter«ion pump is connected via a 2^" bore isolation valve
using copper gasket seals (see Fig. 9 ). The ion-pumping line is
thus placed above the flap valve so that the accelerator men be
pumped even when the sample chamber is at atmospheric pressure.
The sorption pump roughing line is connected to the
sample chamber using the port of the former connection to the
diffusion pump. The roughing line is a horizontal 'T* of 1" bore

40,
stainless steel tube« two ends of which are connected via isolation
valves to two sorption pumps using copper gasket seals. A ll valves
both in the roughing line and ion-pump line are of the bellows
type sealing onto a viton ’O' ring (Vacuum Generators L td .).
The pressure in the original system before modifications
was monitored by two Penning gauge heads (Edwards MH5). One
head was connected to the sample chamber and the other monitored
the pressure at the base of the Quickfit glass tube. These
Penning gauges« however, cannot measure accurately pressures below
-6about 10 torr, and since pressures below 10"° torr were
anticipated using the new pumping system, another type of gauge
was required.
The Penning gauge on the sample chamber was retained
but the gauge monitoring the pressure in the accelerator tube was
replaced by a Bayard-Alpert type ionisation gauge head (Veeco RG 17).
This gauge head has a non-burnout filament (lanthanum) and can be
used to measure pressure in the range 10~2 - 10~10 torr. A TC 5 (VG)
ionisation gauge control unit supplies the necessary voltages for
this gauge head and amplifies the collector eurrent.
1.6 The new pumping system.
Sorption pumps have the advantages over mechanical rotary
pumps of cleanliness and freedom from vibration since there are no
moving parte* Even when operated with a fora-line trap, rotary pumps
are s t i l l a possible source o f o il vapour contamination.
Sorption pumps do, however, have certain disadvantages
compared with a gas-ballast rotary pumpi certain gases (particu larly
hydrogen) are not pumped very effic ien tly and water vapour soon
saturates the sieve material. The sieve material can, however, be
resuscitated by baking the pump at 200 - 300°C using heating tape*

41
Porous sodium aluminium silicate pellets (BDH type 13X)
are used as sieve material in the sorption pumps which are of
multi-ttibular design (Applied Research & Engineering L td .). The
pellets have a very large surface area ( ^ 500 m2/g) on which
gas is adsorbed when the pump is cooled. Liquid nitrogen is used
as coolant and is contained in expanded polystyrene tubs which
act as dewars.
A pump is pre-cooled for 5 - 1 0 minutes before being
introduced to the system and a pressure of around 10 torr can be
achieved starting from atmospheric pressure in about a further
10 minutes. I f th is pump is then isolated and a second pre-cooled
pump is connected to the system a vacuum better than 10-3 torr can
be achieved in a further 10 - 15 minutes. This procedure is
•4referred to as sequential pumping. A pressure of 2 • 10 torr
has been achieved merely by sorption pumping using freshly ,baked-out
pumps.
After a pump is isolated from the system, the coolant is
removed from around the pump which then is allowed to warm up to
room temperature. I f the pump hafc hdsorbed a considerable quantity
of gas, pressure w ill build up inside the pump as it warms. This
is released by allowing the gas to blow out a chained rubber bung
which seals a side tube*
The ion pump used for high vacuum pumping is an
electrostatic getter-ion ("orbitron") pump (Applied Research &
Engineering Ltd*)* This pump could s t i l l be described aa being
developmental in design. Like a l l ion pumps i t does not require
"basking", as a diffusion pump does, once it is in operation. It
was considered ideal fo r our needs since i t gives a large pumping
speed for it s compact size, does not have large associated magnets,

42
and was cheaper to obtain than a magnetic type ion pump of
comparable pumping speed. Since a considerable amount of testing
of this type of pump was carried out, a complete description and
appraisal of this pump and an ea rlie r prototype, together with
constructional details and power supply requirements w ill be
given in the Appendix. The pump used here is a 2¿" diameter
triode pump and is water cooled. I t is normally kept under high
vacuum when not in use and is put into operation before being
introduced to the system. It w ill then pump the system from a
-3pressure of around 10 torr down to eventually an ultimate of_7
about 5 • 10 torr, which is an order of magnitude better than
that attained previously using a diffusion pump. This ultimate
is restricted not by the pump but by the outgassing of the walls
of the system particularly from the dural which unfortunately
cannot be reduced appreciably by baking and then cooling to
ambient temperature as can outgassing from materials such as
stainless steel and glass.
Pump down time is variable and depends on many factors
such as dryness of the samples, the length of time the sample
chamber was at atmospheric pressure, the length of time since the
chamber was at atmospheric pressure, etc ., and, of course, the
condition of the pump. In optimum conditions, the getter-ion pump
-6 -3w ill pump the system down to around 10 torr (from 10 torr) in
less then sn hour, elthough usually in conditions less than-5
optimum i t obviously tskes longer. A pressure of 10 torr can
sometimes be attained in 5 - 10 minutes. The hydrogen leak is not
opened until the pressure is less than 2 . 10 ^ torr and operating
pressure with the optimum hydrogen leek rate is about 2 • 10 ® to rr.

43.
In a l l . the performance of this pump ia superior to a
2" diffusion pump using "convalex 10" o il (CVC) and a liquid
nitrogen trap. However, greater care is needed in it s operation
whilst i t also requires more maintenance.
2. The Photoelectric Spectrophotometer.
Full details of the construction, calibration and
performance of this instrument have been given by Lumb and2
Geake & Lumb • Only a b rie f description w i l l , therefore, be given
here but including details of recent minor modifications. An
improved spectral calibration technique w ill also be described.
2.1 The monochromator and photomultipliers.
An optical diagram of the monochromator is shown in
Fig. 13. This is of the Ebert type and has as the dispersive
element a 5" x 4” Bausch & Lomb reflection grating (1200 lines/mm)O
blazed at 7000A in the f ir s t order. A 14" concave mirror of 72"
radius of curvature both renders undispersed light from the entrance
s l it para lle l and focuses dispersed light on the exit s l i t . The
system has f/9 optics and the reciprocal linear dispersion in
firs t order is 8 A/mm. Interchangeable fixed s lit s are available
but for most purposes where high resolution is not required but
rather a high light-gathering power, 3 mm s lit s are used giving a
static bandwidth of 24A. Light passing through the exit s l i t is
monitored by a photomultiplier, the output of which is amplified
and recorded. A s ilica disc reflects a small proportion of
undispersed light onto the photocathode of a second photomultiplier
(see Fig. 13), the output of which is used to compensate for time
variations in the total luminescence output of the sample.
_________ _ .

A spectrum is scanned across the exit s l i t by tilting
the grating via a sine drive using a synchronous motor. The
scanning speed can be changed by altering the gear ratio between
the motor and the drive shaft. A micrometer on the drive shaft
is calibrated against wavelength, and the wavelength range can be
altered by changing the length of the stub at the end of the arm
which t i l t s the grating. Usually only one range is used, namelyO
3000 - 8000A but recently measurements have been extended to the
infra-red and a longer stub used to give a wavelength range
5500 - 10.000A.
In the v is ib le region, EMI 9558B photomultipliers are
used. These have a 2" diameter t r i-a lk a li S20 cathode
Sb(NaK)Cs }w ith a pyrex window. Although having higher dark
current and noise characteristics than the usual S11 (CsSbO)
cathode, they have a much higher sensitivity in the red extending
beyond 7500A.
For infra-red scans a Mullard 150 CVP photomultiplier
with an S1 cathode (AgOCs) is used for monitoring dispersed light.
(This was kindly loaned to us by Prof. Garllck of Hull University).
This type of photomultiplier has to be cooled to around - 50°C in
order to reduce the dark current to a tolerable level and obtain
an optimum signal-to-noise ra tio . The cooling is achieved by
passing cold dry nitrogen gas through the housing of the
photomultiplier tube. In order to avoid frosting the housing is
thermally insulated with expanded polystyrene sheet and foam rubber.
Light from the exit s l i t passes through an evacuated double silica
window (spectrosil) in the housing to reach the photocathode.

13« Optical diagram of the monochromator; PM1 and PM2 are
photomultipliers for spectral scanning and compensation
respectively. (A fter Geake and Lunb2) .
Fi2«__1£. Block diagram of the electronic system.
(A fter Geake and Lumb2) .
UOMT FROM WIT KIT
--------------*
UHDllftflUnUOMT
-------------►
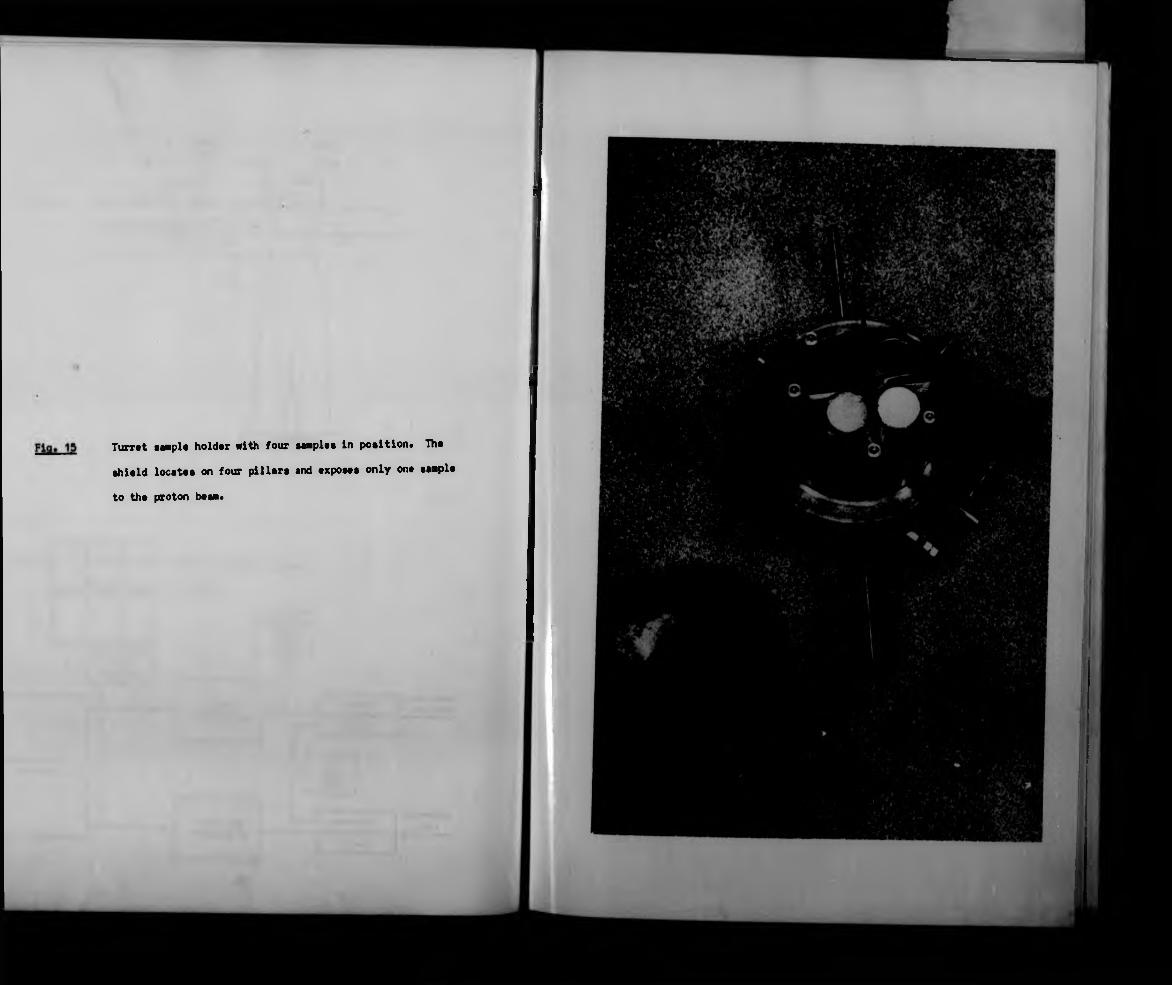
Turret sample holder with four samples in position* The
shield locates on four p illa rs and exposes only one sample
to the proton beam.

Turret sample holder with four samples in position,
shield locates on four p illa rs and exposes only one
to the proton beam.
The
sample
> V t
M r r > r , ,*fi • <■>/ • K -
f e i i t e

Fig. 16 Vi*** of th* 2$-" diameter triode electrostatic
getter-ion pump. Not* th* water jacket for cooling*
»

View of the 2?" diameter triode electrostatic
getter-ion pump. Note the water jacket for cooling.
Fin, 16
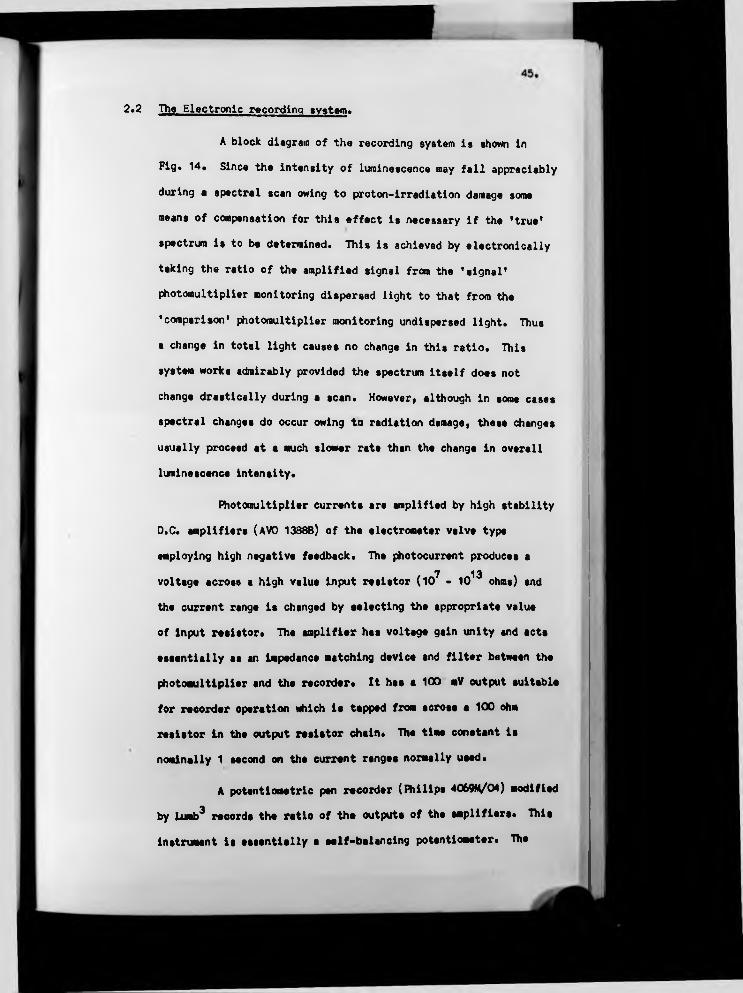
2.2 The Electronic recording system.
A block diagram of the recording system is shown in
Fig. 14. Since the intensity o f luminescence may f a l l appreciably
during a spectral scan owing to proton-irradiation damage some
means of compensation for this e ffect is necessary i f the ’ true'
spectrum is to be determined. This is achieved by electronically
taking the ratio o f the amplified signal from the 's ign a l'
photomultiplier monitoring dispersed light to that from the
'comparison' photomultiplier monitoring undispersed ligh t. Thus
a change in total light causes no change in this ra t io . This
system works admirably provided the spectrum its e lf does not
change drastically during a scan. However, although in some cases
spectral changes do occur owing to radiation damage, these changes
usually proceed at a much slower rate than the change in overall
luminescence intensity.
Photomultiplier currents are amplified by high stability
D.C. amplifiers (AVO 1388B) of the electrometer valve type
employing high negative feedback. The photocurrent produces a
7 13voltage across a high value input resistor (10 - 10 ohms) and
the current range is changed by selecting the appropriate value
of input resistor. The amplifier has voltage gain unity and acts
essentially as an impedance matching device and f i l t e r between the
photomultiplier and the recorder* It has a 100 mV output suitable
for recorder operation which is tapped from across a 100 ohm
resistor in the output resistor chain. The time constant is
nominally 1 second on the current ranges normally used.
A potentiometric pen recorder (Philips 4069M/04) modified
by Lumb3 records the ratio of tha outputs of the amplifiers. This
instrument is essentially a self-balancing potentiometer. The

46
output from tht 'comparison' amplifier is fad across the slide
wire of the recorder instead of the usual internal stabilized
voltage supply. The output of the 's ign a l' amplifier is then
applied between one end of the slide wire and the pen carriage
in the usual way and the servo-system then finds the 'n u l l '
position such that th is applied voltage is equal to the voltage
existing between the end of the slide wire and the position of the
pen carriage on the slide wire. The response time of the servo
mechanism is nominally 1 sec for fu l l scale movement. The pen
carriage also travels along a para lle l 's lave ' slide wire which
was supplied by an independent constant voltage so that the
recorder trace could be repeated on one channel of a three channel
recording milliammeter (E & V).
The mains supplies to the recorder chart drive motor
and the monochromator scan motor pass through a master switch so
that they can be started synchronously.
The outputs of the amplifiers were also connected via
buffer amplifiers to two channels of the recording milliammeter
so that these could be separately monitored. However, operation of
this rather old instrument has late ly been unreliable and i t has
now been repleced by a two-channel potentiometric recorder
(Rikadenki B241). Buffer amplifiers are, therefore, no longer
necessary.
A backing-off voltage is available for backing o f f a
steady dark current arising from tha 's ign a l' photomultiplier when
used for monitoring very low light levels. A high impedance current
source is derived from a photocell run at a low anode-cathode
voltage (9 v .) which monitors light from a small bulb supplied by
a variabla but stabilized voltage source.

47,
2.3 Spectral Response Calibration.
The recorder trace gives the luminescence spectrum of
the sample as modified by the spectral response characteristics
of the monochromator and the photomultiplier monitoring dispersed
light. Thus the spectral response curve for the instrument as a
whole must be determined so that the necessary correction factors
can be applied.
The instrumental spectral response profile is determined
by shining a tungsten lamp of known colour temperature onto a
magnesium oxide coated sample tray which is located in the usual
sample position, and it s spectrum scanned. The 12V, 36W tungsten
lamp was standardised by G.E.C. Research Laboratories who give the
colour temperature as 2854°K when run at a current of 2.90 amps.
The energy spectrum of a black body radiating at
2854°K is determined from tables. The required spectral response
profile can thus be found by dividing the recorded spectrum by
the calculated 'true ' spectrum. D ifficu lties were experienced
during this calibration procedure owing to grating anomalies, common
to a ll grating instruments, which manifest themselves ss kinks in
the spectral response curve. The shape and size of these kinks3
depend very much on the polarisation of incident light • I t is
assumed that luminescence from randomly orientated micro-crystalline
powders w ill be unpolarised. However, i f light scattered from the
magnesium oxide powder used for calibrotion is not completely
unpolerised, the spectrel response curve w ill not be correct in
the region of the anomalies. Such a situation results in the
sppearance of spurious features at the same wavelengths for a l l
corrected spectra. This problem was overcome by inserting e piece
of Polaroid before the entrance s l i t to ensure that both luminescence

48
and tha scattered light used for calibration are equally
polarised. I f the plane of polarisation of the light admitted
to the monochromator is made parallel to the grating rulings»
the kinks in the spectral response curve are also practically
eliminated. The only disadvantage of th is procedure is that
necessarily more than half the incident light is lost.
Both spectral response calibration and luminescence
spectral scans were carried out for the v is ib le region using a
Wratten 2B f i l t e r which absorbs light below 4000A in order to avoid
any possible U.V. in the second order from making a contribution
to the measured intensity of red light in 1st order. For example»
2nd order of wavelength 3500A may be registered along with 1st0
order 7OOOA in the absence of such a f i lt e r * However» fo r theO o
spectral range below 4000A (down to around 3500A) no f i l t e r or
Polaroid is used.
For infra-red scans a Wratten 25 f i lt e r is used to
avoid ambiguity which would arise owing to 2nd order v is ib le light*
3. The new low energy proton accelerator system.
3.1 Design and general description.
This system» which has recently been completed and tested,
was o rig ina lly intended simply to irradiate various rock samples
with protons to produce radiation damage similar to that which
the lunar surface was supposed to have had owing to aeons of solar
wind bombardment.
This project was originally planned as e Joint venture
with Dr. G. Fielder and Dr. L. Wilson of London Observatory who
were also interested in proton damage e ffects on lava samples
produced in their laboratory, but later another accelerator system
was bu ilt in their laboratory. Originally, Dr. L. Wilson was

49
responsible for the R.F. oscillator and ion source whilst the
author was responsible fo r vacuum system design and construction
and anc illia ry instrumentation.
In order to try to eliminate the contamination problem
during irradiation as described earlier the system was designed
to be evacuated by sorption pumps and a prototype electrostatic
getter-ion pump which is described in the appendix. A ll vacuum
seals are metal wire seals of indium or gold and the system is
entirely free from organic material.
The accelerator voltage was kept low ( < 10KV) for
several reasons. F irstly , the energy of protons in the 'qu iet'
solar wind is now known to be about 2 KeV . Secondly, insulation
and power supply problems are very much less i f the voltage is less
than about 10 KV. Furthermore, i f the proton current was to be
considerably higher than that of the original accelerator, as was
anticipated, then the energy of the particles should not be such
as to produce characteristic line X-radiation from the elements
under bombardment otherwise careful radiation shielding would be
required. Although the protons in the original 100KV accelerator
do produce characteristic X-radiation the flux is very low. However,
in the new accelerator the flux is rather higher but the low energy
'white' X-radiation produced is mostly absorbed by the walls of
the system.
The new system wss elso designed so that a cryostat for
thermoluainescence studies could be incorporated.
3.2 The ion source and accelerating system.
Diagrams of the system sre given in Figs. 17 and 18.
The design of the pyrex ion bottle and the extractor plates sre
due to A .E.R.E., Harwell who donated to us the extractor plates

50.
which are machined from dural. The ion bottle, which is about 2"
in diameter, has a silica disc mounted at its upper end to prevent
electron bombardment of the pyrex caused by the acceleration of
electrons in the reverse direction. The ion bottle is connected
to the accelerating region between the extractor plates by a
diameter hole in the high voltage extractor plate. Another
s ilica disc with a central hole of -J" diameter prevents ion
bombardment of this plate. The ion bottle is clamped onto the
top extractor plate using a viton *0’ ring holding the edge of
the bottle onto an indium seal. Acceleration is across a W
gap between upper and lower extractor plates and the accelerated
particles pass through a canal ( 3>/32 diameter, -J" long) in the
lower plate which is at earth potential. The extractor plates
are specially machined into smooth shapes to give the desired
fie ld distribution between them. Although the separation in the
accelerating region is quite small, the separation at the outer
rim is about 1". The insulating ring is of glass and is 1H in
depth and i " thick. It is ground f la t on both edges and sealed
by indium seals to both top and botton plates. The original
Harwell design used rubber 'O' rings recessed into grooves in a
perspex insulating ring, to which both top and bottom plates were
fastened using screws tapped into the perspex ring. In the present
design, the top and bottom plates were originally compressed
together by tapping bolts into insulating p illa rs outside the glass
ring. However, this method proved unsatisfactory since to get
enough compression of the indium to form two adequate seals the
bolts had to be tightened very hard resulting in either stripping
of the thread in nylon p illa rs or fracture of the p illa r it s e lf
when perspex p illa rs were used* Therefore, steel nuts and bolts
had to be used to clamp the plates together onto the glass ring.

These bolts are at earth potential and insulated from the top
plate by nylon sleeves and washers.
Hydrogen (BOC grade X) is leaked into the system via a
fine bore in the lower extractor plate from a small cylindrical
reservoir using a needle valve. Hydrogen is contained in this
reservoir at a pressure not exceeding 2 atmospheres ( i . e .
1 atmosphere w .r .t outside). This reservoir is replenished
periodically via a fine adjustment valve by gas from a small
cylinder. These cylinders are supplied at a gas pressure of about
14 atmospheres (200 lbs/sq.n) . Nitrogen can also be leaked into
the system from a somewhat larger reservoir in order to raise the
system to atmospheric pressure without admitting dirty or damp a ir.
Ionisation of the hydrogen is accomplished by an R.F.
c o il around the bottle which is the centre-tapped inductance of a
conventional Hartley osc illa to r. This oscillator was constructed
by Or. L. Wilson around a large tetrode valve (type 813) the anode
potential of which can be up to 2KV. The maximum power output of
th is oscillator is about 100W and is varied by adjustment of the
valve anode potential. The frequency is around 30 MHi and the
circu it has been pre-tuned for max. plasma density by adjusting the
spacing of a simple paralle l plate condenser connected across the
R.F. coil*
In order to concentrate the ions in the region of the
canal to obtain a larger proton current and to try to provide some
degree of focussing, co ils of D.C.C. copper-wire wouAd on insulating
fonaers are positioned around the base of the ion bottle around the
extractor plates and around the tubuletlon immediately below the
lower extractor plate. A D.C. current of up to 6 amps can be used
giving over a thousand ampere-turns. Whilst these coils have been
51.

52
successful in producing a much higher proton beam current, the
focussing e ffect on protons is only marginal*
One advantage of this type of extraction and acceleration
of the ions is that by simply reversing the polarity of the H.T.,
an electron beam can be obtained* The focussing e ffect of the
coils on electrons is reasonably good, since the e^a ratio is
considerably larger than for protons, and a spot of a few mms
diameter can be achieved at a distance of some 10" from the canal*
The accelerator H.T. is provided by a 0 - 15KV stabilized
D.C. supply (Brandenburg 705) which employs a Cockroft & Walton
stack fed by a high frequency oscillator. Ion beam current
measurement is achieved by intercepting the beam by a diameter
copper cup located about 1" from the canal. This cup is supported
by a copper wire which passes through a ceramic-insulated vacuum
lead-through in the centre of a stainless steel disc (see Fig. 17).
This disc is connected to the system by a stainless steel bellows
section which allows the copper cup to be moved into and out of
the ion beam. The proton current is monitored by allowing the
charge collected by the cup to flow to earth through a spot
microammeter* This bellows device was incorporated instead of a
simple 'O ' ring sealed mechanical feed-through in order to eliminate
the use of rubber or elastomer seals* Edge-welded bellows are used
(Palatine Precision Ltd.) since they have a greater extension and
compression per unit length than the usual folded bellows* The
spring rate was chosen so that the bellows just compress fu lly under
a pressure difference of one atmosphere and the natural length
of the bellows chosen so that the compression stroke was Just under
i " . The arrangement is such that when the syetem is under vacuum
the cup is in the ion beam intercepting position* In order to move

53,
the cup out of the ion beam, the bellows are stretched to their
natural length and held by inserting a metal U - c lip between the
stainless steel end disc and the wall of the system» The movement
of the bellows is constrained by two guide rods which pass through
brass bushes in the end disc»
3.3 The sample chamber and vacuua system.
The sample chamber is fabricated from thick stainless
steel tubing. It has several ports fitted with Mullard-type f la t
flanges suitable fo r gold-wire sealing. The chamber is 5" in
diameter and has a 1" diameter observation window through which the
central area of the base plate may be viewed. The stainless steel
base plate can be completely removed allowing access to the chamber.
It can also be replaced by a cryostat which w ill be described in the
next section. A nude Bayard-Alpert ionisation gauge head (Leybold)
is inserted in a 2" diameter port of the chamber fo r pressure
measurement. The electrostatic getter-ion pump is connected to
another 2" port via a 2" bore all-m etal, bellows-type valve
(Vacuum Generators L td .). The roughing vacuum line is connected to
a £" diameter port and can be isolated by a bore all-metal valve
(Mullard L td .). These valves seal by passing a gold or copper padA
connected to a bellows movement onto a circular stainless steel
knife edge. Originally two single tube sorption pumps were used for
roughing but were found inadequate to deal with the outgsssing of
the gauge head a fter the gauge had been at atmospheric pressure.
One of them has, therefore, been replaced by s larger multi-tubular
pump of similar design to the sorption pumps now fitted to the
120 KV proton accelerator system. The small single tube pump is
now used to evacuate the system from atmospheric pressure to around
10"1 to 10*2 torr and is then isolated. The multi-tubular pump is
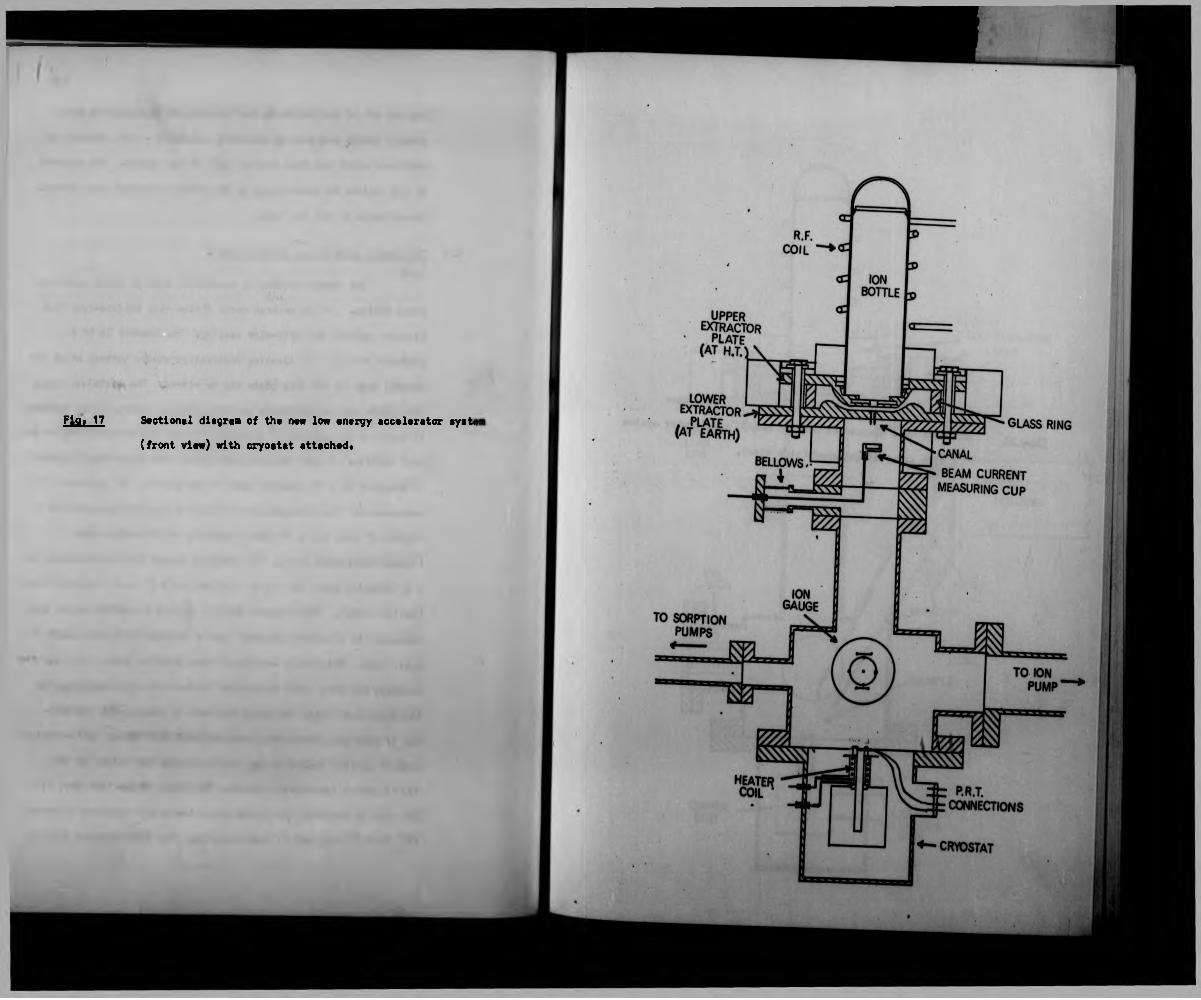
f ia » 17 Sectional diagram of the new low energy accelerator syet<
(front view) with cryoetat attached*
IONB O TTLE
.UPPEREXTRACTOR, p l a t e(A T H . T . V \
LOWER
(A T E A R TH ) ' tG LA SS RING
CANAL
BEAM C U R R EN T
m e a s u r i n g c u p
b e l l o w s
T O SO RPTIO N PUM PS
PR TCO N N ECTIO N S
C R YO S TA T

Sectional diagram of new law energy accelerator ayatea
with cryoatat attached (aide view)*
D.C. F O C U S IN G - COILS
HYDROGENLEAKLINE
m ir r o r
p h o t o m u l t i p l i e r
H O USING
IONGAUGE
SAM PLE
COPPERROD LIQ UID
NITROGENTAN K


Flq. 20 Clow up vi#w of low «ntrgy acc#l*r«tor and iw p l* ch««b«r
with cryo»t»tt
ItliAilr i t i f i l i
•I •' I!'If
>« — » *

Fin. 20 Close up view of low energy accelerator and sample chamber
with cryostat.

View showing the ’ orbitron' pump with water cooling coil#
The cryostat is on the le ft and the hydrogen reservoir with
pressure gauge can be seen in the top right of the picture.
The cryostat#
The sample holder haa since been modified to reduce thermal
time lag between heater and eenaor# The heater shielding hae also
been improved#

F in . 21
F i n . 22
View showing the 'orbitron ' pump with water cooling c o il.
The cryostat is on the le f t and the hydrogen reservoir with
pressure gauge can be seen in the top right of the picture.
The cryostat.
The sample holder has since been modified to reduce thermal
time lag between heater and sensor. The heater shielding has also
been improved.

I
54.
then introduced to the system and pumps down to about 10“J torr.
At th is point the roughing line is isolated by the all-metal valve
and the getter-ion pump, which has been started whilst isolated
from the system, is introduced. The ultimate pressure of themn
system is around 5 . 10 torr (a t room temperature) and is again
limited to some extent by the dural in the system. However, whenIf
liquid nitrogen is pumped into the cryostat, i t is fitted to theA
system, the cooled surfaces of the liquid nitrogen tank adsorb
residual gas and sosm degree of cryopumping takes place resulting
in an ultimate of 10~7 torr or better. This effect is not eery
beneficia l, however, since subsequent heating causes adsorbed gas
to be released slowly at f i r s t and then quite rapidly in the
temperature region around 150 - 200°C indicating that the gas is
probably mainly water vapour. This rapid outgassing may cause
the pressure to r ise to almost 10*"4 torr. Above 200°C, however,
such outgassing is reduced and the pressure fa l ls again.
3*4 The Electronic recording system.
Integrated luminescence intensities of samples, mounted
at the level of the base plate, in the proton or electron beam,
can be measured by a photomultiplier (EMI 9558B, S20 cathode)
which ie attached to the viewing port. Various f i lt e r s can be
placed ever the window and luminescence from the sample paaaea
through the window and f i l t e r and is reflected by a plane mirror
onto tho photocathode (see F ig. 18).
A high stab ility H.T. unit (Brandenburg 471R) supplies
the dynode-biasing resistor chain of the photomultiplier and
the output of this photomultiplier ie fed to an electrometer
valve D.C. amplifier (Keithley picoammeter 416). This amplifier

• i ■ >i < ■ 1 i . . i . .
• v liv ni.' y • i I ‘- . ’ i " ' i .It .* . . i '. l i.\
. .• i »' J i J ■ . i , fi> - •: nI
<• i . . . . . , . .. .
r:i ' n . . i ■< . i r.i*. y
L . 7 I . . ni I< . . 1. 'V
... • , y . ..' i . '... : ir.-iJ
■i 1. . . . . , t
;>iJfIU081 . :> .I*¿ .;»:U. Í ..:i;;l. U' 0Y~. Í0 *i A «.«.•: 06 «r.r JU.UblaOt
. 7 ' ' . 1 • I!. . '
!•• . I . . ' , . ,
erii n l ylblqei eiiup nerti bn* in-iit Js ylwol« i.eii*! n >>U ci
1 1 tag wrU ieii> ( A ^ w l - i w n nolpe? siuisieqmei
1 •(
, _ .7 ' i f . I ■ i .
. ' ' 1 : i a i ■ . i': 1:
. _ _ _ _ _ .....________
i ■ , ' ' . 1 1 ' b
t Il ,'c it; , * j . ■ 1. i v< Í Ji
4-: , . , ' ' i ' . ■. " i. .
• ■ ' ' ' ' . llivV'iv . i .Vi . i *
«•«esq eiqmss «ill »..< xl eones< enlnui boa wobnlw aiit revo beosiq
1 f i lm r.i 1 y* b e io e l t s ? i l bfu x .11 i'. ! ns M ibni' «n l li.iuou ti
♦ . 1 . I '«'<* , litK-'!.« .• i IÍ J l’
• • i I t'M J (•' r v n-t‘- ) ■ ! ru . . \ 1 il 1 ill 1
boa isliqliJumoJ'riq erii \a nlsrio 10i»l*n i*ii?*ld-ebonyb erii
reiiNso-xioele n» oi bel al leUqlilumoioriq «M í to íuqíuo «di
i ' i ; i . 11 • ■ ' . ■ i y*j i i .'. :> .. . . ovisv
haa a faat raaponaa (laaa than 1 n illisec on aoaa currant rangaa)
and» tharafora» a fa ir ly broad bandwidth. On the lower currant•8
rangaa (10 aaipa and below)» however, a variable daaiping control
ia operative which can lengthen the rise tiae up to a maximum of
3 sacs. The rise time can thua be optiaiaed to give the fastest
response compatible with an acceptable aignal-to-noiae ratio . The
current range ia determined by selecting the input resistor value.
Unlike the AVO amplifiers used previously this amplifier haa
appreciable voltage gain since the input resistor values are auch
lower for a given current range in order to make tha tiae constant
of the input circuit considerably shorter. The output for recorder
operation ia 3V maximum with an output impedance of about 1 K jl.
An XY recorder (Hewlett-Packard Moseley 703SB) is
available for recording luminescence intensity as a function of
any other parameter (e .g . temperature) and a plug-in variable
tism-base (Moseley 17106M) enables variations of luminescence
intensity with time to be recorded.
Thffaolyminf«9fnce InstrumentsIon.
Tfrt CTY9tW»
The requirement ia for the sample to be heated in vacuo
from around - t90°C to about 400°C. Seme type of dawar arrangement
ia necessary to contain the coolant* While the sample must be in
good thermal contact with the coolant, i t must bo reasonably
thermally insulated from the surroundings* Host losses or gains
by the cample holder are Inevitable without complex design* However
such heat flows can be reduced to a tolerable level by simple design
Conduction losaos or gains are reduced by making the conduction path
as long as peaaiblo and as small in ereoa-aectional area as peaaible
The material In the conduction path should, of course, be of lew

• *
(•e ‘i,*x JnfiTxrr aooa no oe«.lJHr. f nc.ii.' e iu i) «art* |S a? Jest a S6ii
Jo . I . . hi (I I . , « . . . ,
1 J , ! I T V , V*) . ,
1t> i o i u tx...' a/ i i r j rise iisi n 9 ho' v. <v.ljnv;o t l
iet >v ’ > < i . .
»1 IT .o il«* ! ealon-oi-iengi* ns nil'» «idlisqmoo eanoqas'X
. M
sari la lH I ¡w« ?lrf.t \Ieocilv9iq ‘>9^0 a T t li i l : . !> • eili exlinL.'
u . 'i . r. h: i.i a ... < v ic 2;
itu isnc'S .. ii ii J o.i x»bi ni » m>x iuai-i. a ‘•>vis? to I Ttmol
. < .• . .< . 1 : .. j ‘> ! I ..
n V£ al rx-lirieq©
. i (| o OV V I&l '• - iw ' 0- 1 V. n' tto 1U i . \ i . j . i >&oi o' r.ii • r<>'x -< i ui ■ I ic.vr
‘ tXuBiifv - bm (a n . . .
ia irs n lr v l ■ >i. i- v ?«I . t - '
.bebioa i *d o i A)l ■ \ ller.»)n l
, .................. ! '__
v. . .ji... **'
ou9i*v ni hsii 9fi «id o i ■ J i .It o> *1 inwnaiio t erfT
:t i :•». f •<■./' o • ■' > - ' I - Sfl . «»-, t
I I II . I . : . I ; I 1.1. .‘l.( . • - 90911 tlyl< i.i •' . t in , n.Jooo : it» 2'. Jcrinro J.n tariJ «noy
ii. . M. . ; . I . . " \ 1 \. •'••d.'
19 Vr* I til l " I X Jqi . Olttln J •. i In.Joi. *t\f Y«i
n- l»:eb oiqmi i y<! level - c. oi beoube-i it r.so i « i t Jat>rf riant
li iq noiioi -noo mti nixtn vd b<ioii<>ai *1» « nlri* to »•«;>;© 1 noiJoubnoD
*I< !.■»»*«< ¡i* no-i» lem lie - him :o ni IX..i« as bn .oq t t pn<I «•
moI to ad «aaiuoa to ,biuoita itteq noliaubnoo adi ni itiia Ja a aifT
I
conductivity. Convaction lossaa ara reduced by having the apecinen
and heater in a good vacuum and radiation loaaaa by having poliahad
surfaces of low emisaivity. The design of the cryostat used hare
is an axtanaivaly aodiflad version of a design which Dr. M.L. Reynolds,
formerly of Hull University, used soma years ago. The sample is
placed on the and of a i " diameter copper rod which it brazed
through the top of a polished stainless steal cylindrical tank.
Thia tank is 2" in diaiaettr, 2" deep, and of wall thickness.t '
The copper rod protrudes 1-J* into the tank which can be f i l le d with
liquid nitrogen via a bora stainless steal tuba uhieh enters the
tank horizontally near its top (aaa F ig. 18). The tank la contained
in a 4" diameter stainless steal cylindrical vassal and is
supported only by the nitrogen f i l l in g tuba ahlch pasaaa through
the outer cylindrical wall. The outer cylindrical vassal has a large
flange which mates with the baaa-plata flange of the sample chamber
and is normally aaalad to it using an indium wire seal. Thus the0
apace around the liquid nitrogen tank forms part of the vacuum
aystarn.
Mounted on the copper rod batwaan the sample and the
top of the tank i t a 100W heater* The heater co il (20 S.N.G. nichrome)
is wound on a a llie s alaova and the whole haatar assembly la
sheathed by stainless ataal tub* to prevent light from the haatar
raaohlng the photomultiplier. The haatar la operated at a law A.C*
voltage ( <^*10V max) and the currant supply (10 A max) paaaaa through
twin oeramio vacuum leadthroughs In the outer wall*
The temperature of tha sample is monitored by a miniature
platinum rasiatanea element (Roamaount Engineering Co* Ltd*) whioh ia
positioned In a groove at tha and of tha eappar rod and paaaaa
through tha sample-retaining copper annulus* Before insertion i t was
■ <'■ ' I lv : : I': ‘ v • .
. ;ilv r! yd ::•* o l rioi.tf2t.Ki i,r.i mi :.»v » n i isim ri Los
• i . ’ i ' . i . : ;
, i.f . . . I . • • V ' i . \ . . . ■:✓
' ■■ . ■ , < ‘ ' , j': ' ■ . . j .• :>f ::i '« 'i <; i : i . If : iq
■ . i J i . I .'( \ ' I ' . ,
. J i , ' ' ,
ili 1 ‘x. i.i : .. ' iw J ii> 1 "• f ■" ' .. ■< j c •• 'mVhi..' « T sine rfol it* edt*3 :.i-‘ J|.* jk fif'd " ; » 2v ri <-ri tn M upii
' . ■ . i <:>n i ‘>r w I : ’ I if ' 'r* ! .+ . .' : i? j -r "A t n i
riçiioifli Bo.,SiKj flr'.r.. edui >i:lJlit n*. *> \ • 2fi rli y M i t » , ¡us
0 .K I B - : i ' / ■ ■«j V i . ' . I ' .1 .J
f’r.t'i I • ,i } if. r. .J * : » - .... •• J. i : i<r>: . i . J‘t
fil !) ' , ' I « . 1 < li •2 Imo
n: r. r.v n i lo ii/.q ..i-fol jIiikj ft « U in lu i l «12 t an t» eoixq»
.. .
erii hfie slqnr.» srli noowitKi 601 teqqos *rii no beinuoM
/ } i ; . ! .. .. • • ■ ■ '
:: Y f 3 fi ' If it. VV"'|J i : ' . ' fit ri"
t 3< m .3 m t i l l ' l l ififVi'T o i »n r i Jeeia . f i i I f . » « y b»ni*r«fta
• . I i ' . - » (I • .1 lu. r j|r, • . ' t j ....■ t
ri unil.t t-oerpq (xsr A DT) yJv.im in r t -o “ d i bon (xrri V' f ^ ; egeiiov
• i'.* 1 2 ?d n u b f J mm ; fv oli ni>-i
' ■ Jvini* • yd bfnoiinriv «1 ojqniij» *di to i e i #if"
i i '• *c - 1 . • i.•*i ' ' ’ ii i • 1 s ?.î'iihX : •.* m fr .iii. lq
■ »»e sq bn» b o i teq< < 0 »ifii to bno e d i 2» »v o o ip • n i b e n c iils o q
MW i i n o liis tr l e-roleT . n » teqqoo p n l n i s i r t -a iq m » « »H i rtguonli
%57.
painted lavishly with colloidal ailvar paint to anavira good thanaal
contact with both tho copper rod and the »ample. The element l t M l f
ia encapsulated in a ceramic rod V 16" in diameter and $" long
although the element only occupies i Ns the rest is a sheath for the
silver lead connections* The platinum resistance thermometer leada
are connected via a glass multiple vacuus leadthrough in the outer
wall.
A platinum resistance element is used in preference
to a thermocouple on account of reasonably good linearity over the
entire temperature range.
4.2 Thf l i n e huU.nfl-J.ltf S°«feo,lle.r.
This controlling system was devised so that a specimen
could be heated at a linear rata from about -150°C to 400°C for
the purpose of obtaining thermolumineseence 'glow ' curves. A
linear heating rata is desirable i f 'glow' curves obtained by
different workers are to be compared and also fac ilita tes calculation
of trap depths.
Most ways o f producing a lin ea r heating rata use one of
two basic approaches. The f i r s t approaoh is to programme the supply
o f heat to the specimen holder so that a lin e a r rata o f temperature
r is e i s produced. This i s done em pirically by t r ia l and e rro r
u n til the correct programme i s determined. Often the required
programme can be achieved quite simply, sametimes even manual
operation o f a Variae in the heater supply may su ff ic e . A common
method ia to use a Variae driven by a meter v ia a earn which le out
te a shape which has been found w i l l g ive a lin h a f heating ra te ** .
The second approach ia to control the temperature by
a aervo-ayatem in which the camper icon standard o f resistance
(o r vo ltage ) la increased in such a may as te fe llo w with time the

pMrifcitt i< ( > sau^nc of Jnlsq i v.f la ibhiolioo riiiw ylriei/< I bvfnl*>q
. r.i ■ C i. < i .. . . .1 .1
rml ";. bus 7 -..‘ .«if.il nl "¿fV fx.-i oh-a.'tt't s ni h-4 i iu iq o n i $1/
»lit ”io'i rfieerie n »1 t%vi erii j"- . yino iii-.m«!» eitt <; *uciiils
.•.;•! T -iei, * *«(k ; ' \ <'/i ’
l»fuo *iii n l i. w'.trtibef*! IW'-joiv J. it'- IK ««f Jy 6 t J;v l <f:x*mKO o .
• -
. r.i been el in meJ- eon Jvl.-or rmnlltlc; A
•rll 'it'Vo yfl-ice rJI boog yIdsnoeaei H fnuooos ik. »Iqur:.cfnerl.f s of
. . ..................
nw,iiyt»ia u . . rtt <e bofiveb ew ««¿eye t : 1j ' ( 'ii<v c eiiiT
0*'u/ o. Z< < if— •• *:• i.<" -J . t i - • ■■ ... • bim d
• i.'. V ...0 1 C.1 ’ ’ ton ; • r l u ! ( . «*. .*
yi bt:ili.h:o covtUv * •*»r. J • i i- I i t . r.- . t . r.il
nolfsluslso aeiofJtllosl oel* biu beuqmoo ad of n » eiaiiow ¿nuietlib
.¡MU . jy qt iJ H
1o »no oru e i* i t>nJtis*fi i&enll t> pniouu.-iq \c eye** feoM
ylqqua k U SMHS'XCOiq Ot «1 f.CJfO'iq'ie J e l l ) sifT .« f t1; < .4
» iiiiBiwjfliAl )c> u4«t icenli » farff o< ¡ubloti newloeqe erii o.t feed lo
«»*• I t - j ' X J v ’ . ! * ¡f'- it t , . < • ■. 21
I tv I'l -.1 f .. tl 'Jb' .* . I .)! Min ( t 1 ' . . , . 1
Iitu.ii t nevt " i: in< ? ,yJqv i.* .- . '.ut, bsvelitea o . i.*o ec**..-*: *sq
i m m A .ea lllu e ysai yiqqua -xsiasil erli nl s i ln V a io rtolleieqo
iuo 1 1 riolitw neo r, slv 7 oit.f b yd neviib cmlitiV s sen of el boiliom
dB• ®1b i ^nlleori iB®nli b • vlg iilw bnuol need esd rblitw «qsila e oi
yd ®'tuiB7 9 C»<iiiiJ Bril loiinoo c>4 #1 ifoeotqqB bn«-0 Ba eriT
t u M ie i.!« lo nabneli nt..il'i*'iifOo »til ttolir.f ni r.'BiBye-ovta« s
•rti o^ii dJiw woiio. ol a* yew n i1:>ue nl iviBBBMonl el (#[u.liov io )
58.
resistance (o r voltage) tanperatura curve of the senaor. I f
this curve is nearly linear the experlMntal technique is very much
simplified. Some type of proportional controller is required since
simple on-off devices tend to produce over-correction particularly
in systems «here there is an appreciable thermal time lag between
heater and aenaor. The temperature range of a proportional
controller in which the current ia varied from zero to some maximum
is referred to as the temperature bandwidth. The required
temperature which the controller is trying to sustain is usually
situated about the middle of th is band. This second method of
producing a linear heating rate ia more frought with d ifficu lt ie s
owing to possible over-correction by the eervo-system on account
of the time lag involved between temperature measurement and the
Implementation of the correction. Howevert it does have certain
advantages over the f i r s t msthod. F irstly , i t la much leas
empirical and hence more flex ib le in that i t is easily adaptable to
differing conditions. Secondly, since i t uses a temperature
controller, the temperature can be held accurately at any value
above the ambient. In fact, this method i s the basis of the linear
heating rate device used here.
A miniature precision platinum resistance element
(resistance 90«/2.at 0 °C ) is used as ssnser and is osnnscted in one
arm e f a simple D.C. Mheatstone bridge . The reference resistance, a
lin ea rly wound, 15 tu rn , 0 - 1 5 0 ohms, h e lic a l potentiometer
(Golvem L td .) I s connected in the balancing arm and two high
tolerance, high s t a b i l i t y 100 ohm re s is to rs ^rq connected in the
two remaining arms (s e e P ig . 23 ). Since the resistance/tempersture
curve fe r the platinum resistance thermometer (P .R .T .) i s not
exactly linear over the complete temperature range, the h e lic a l
potentiometer is shunted between tappings a t 50 J l , 100 JL end 1 3 0 J I.

. f
1 . ; T '. i ;t nv •; ■ \ 1 ;t . ' < v <>, . ". ■
(bin V7 v .‘ .¡.bei I s ir r.H vj- i v - . ?lrti
orq To eqY* a«o2 »b‘- : I ir '
Yf 7f. Juriiieq n olfoenoe-; v- iu.i;'x>Tq o i bnei esolvab lio-no ftiqtula
no».J‘^ ■>§] -.I'ili I i - fIJ ■ I « : •£■"<¡6 fii 1 tr-irb rx«itw n t ' i i e y ? n l
J. • j ■ ■ r V u •; ■. i ■!
m> ‘ii < i i »••¿»s «<• o I • .v al n .J . , i i./ IoTii o
i. . I .. .... ;v ... ; J , . 1
\JIuLieu al t , l a i a n a o i yn lyri »1 . >oo adi ridliiw STUlBiaqaiei
i- ’ •< : no: . ' i aJ ii j • •
» • i l l ualTTlb rtilv» iit m ni o f n e i a t * : Tnftnll ■ {.»riioul•< -tq
ioio* ik i -'V. t> ft.i.l y ' * . i. <’ i •
i«L‘ : mi ir. i >tlk:cm? ■•■ciifc'xaqi: aJ i bevlevr.l 9*1 m i i »ril To %
i I. ) , ;V 1 . : .•<■: .... u .*
eiel ffn*. »1 11 ,v.r. . nh i t i l t *rW T*ve «eyeinavba
cl •i tiqi.b« yJlaco al i l i i d t nl a ld lxal l •to« aonatt bns isolilqmo
J : • ;«• ! » c m u i t h . , . . :1b
» hI bv yn* 1b y l * i * i u i c -6 b l.•(! tod n.o •‘XuJsTeqaei Mil ,T9iIt>iino:>
ison11 ertf To aland adi al bo dinar cldl ,las^ nl .qneldma *dl evodc
.• . -u >ri
I r i I • l « i '• nn. ' ijq m l.s rn a r i i a l n l n ;
ono ni b*isonnoo »1 bns lo.nea a n b o a t ) a l ( D °0 t n A j O C a o n a t a l a a i )
a ,*on e ia l«e i »o n c t i ln ortT l li.i ^nclclsAdd .D.Ci oJqmla • to ms
Tsldoollntloq leallftd ,a«rio O C t - 0 ,nrul t t ,b«K>w yl7is»nil
M owl bna a n a cnlanniad a r t i n l b a i o a n n o o a l (.b iJ rrmvioO)
• ill nl bolatrinoa »*tc a i o l a l t a t md< O f y l l l io » ? « «U id ,»ancT io l
•TulBT*q«*l\»anBl»lc»T Bdl oanlE . (C£ .r id a o a ) a a n a n n l n l a m o i o w i
. . . i u i.. m i i jrlta’i 14)1,H i Jq ...1; ,-f^ «v:ua
1 ..IJrd *dt , I . ft-i .J••Tft ;i •»! •isiqrc'O « . iJ i >vo n.im il y l i v a x a
t IC 1U f , \j OC Is a (.niqqol n»owl»d baliuidc s i T«ls«r>llnBloq
k
A 1.2K til resistor connsctad bstwesn ths iOJl and 100Jt tappings
raducas tha raaistanca interval to 48 jland a 470 J t raaiator batman
tha 100 JL and 150 «/L tappings raducas this 50 J7, interval to
45 JL • This ensures that tha teaperature/tiae curve ganarstad
is a good reproduction of the rasistance/teaperature curve of tha
P.R.T. Tha helical potentiomter is motor driven vis a aulti-speed
gear box to give a range of d ifferent hasting rates*
I f tha resistance of tha P.R.T. is different fro « tha
resistance of tha he lica l potentiosMter, an out~of-belsnce voltage
w ill appear across tha input of a contact-aodulator type D.C.
amplifier (Pye). Tha output of th is anplifiar is than fad via a
biasing circuit to a thyristor firin g module (Neston Engineering
Co. L td .) which generates voltage pulses synchronous with the aains
at 100 Hz ( i . e . one per half cycle) but at a phase angle, with
reference to the mains, from 0 * 180° depending on the input voltage.
Them pulses are applied to the gate of a triac connected in the
heater supply. (A triac is a two way silicon-controlled re c t ifie r
which «r i l l conduct on both halves of the cycle from tha instant a
voltage pulse is applied to the gate until the end of that half
cycle. I t is equivalent to two thyristors In inverse p a ra lle l).
The A.C. current to the heater i s , therefore, contro lled by the
proportion o f a h a lf cycle which the t r ia c conducts. Zere f ir in g
angle g ives maximum current w h ilst a f i r in g angle c f 180° gives
sere current. A t r ie s hae the advantage that i t responds much
fa ste r than a serve motor. The time response o f th is e lectron ic
serve-ays tea depends mainly on the time constant o f the am plifier
which in th is ease io 1 sec max. '
The D.C. am plifie r used here mechanically chops the
input vo ltage , am plifies i t and woes phase sensitive re c t ific a t io n
to give a D.C. output o f -10V to +10V maximal depending an the
5 9 .

i V .: . ; '
nwtolec ;i i. i * ' * ¡.-no v „ o J X*v- i/ i pon-ialeri erii i’K uf •j i
ot IsvxsXnl i\» K! elrU *0Dubn epniqqnd JV OCT bn« .V.OOf ertt
■ ■. .. ; t bill 1 ¡. ..: s............ • an V . • .
arid 10 9vu <3 « ‘ititiW iiiifriV ; ut-.it l * * i erii io n«iiMii<on,-9i boor s i
»-'..Jill v'.l '-i ' ■ I.' . . .
.. . . . .
■!-.J , . . : i 1
■ - c: 1 :o i' : i . t. t » ¡q* iliw
■ efv bei nerti «J ¡in« a irii jo iuqiuo ariT .(ey fl) isltilqm s
1-f • I J. ■ ' I.. ‘ . : f ' 1' i * Cj Jl & 'Ill - ■
iu;.'. -i 1 ■ ;'.j - . .i* * . ir; • V . 1 ■ ' : / tw .
: > ! , ’ il *' J • J ■ ’ r: ’ .• 1 j.-.
. leqeb 0Otr - 0 wort trnlsir aili oj eoneietet
n.\ y r l 100 0. Irti 6 V ' til i'.eliqq; * r 1 co*J;i offT
■lelllJoe'i beilo iJ - 111« y*w owd « al o s l l i .*
& .!noJ.nnl erti r » i t eloyo * iil to aovi .. n> i ; /i nto lit* rblrlw
.Iff! if.ifi In 1 .no 11 i I l ia : • J,; • ■ 1!., «. - A ;• ir: r l jaluq o f.Jiov
. 'I ill: f.j r v 1 1 . . «- S ‘ b . '.ryo
>:'.t Y 1 ,• ■ 1 • . ' - . . . .
p n ix lt o ra l t t i o v (moo a s l' i i »fli nairt* «Joys iJrri r 10 .. i
i 'lv l > % T to ol m. ni tit « io llilw ii"*'. 1.1111 Ixsfi « tv i •Uni«
llpl'l .: t iICk . ’ 0 1 J ... ... .. 7i « ■' *61. a. i 1J • • T i l l ' ; . o ia r
: ’ n't J . io 1 i .t V . »!'(•' o~' . mi ; 1 if , t j h > v . e s runJ •:<.Ja»1
1 - 11 iJ;;m« e i l i 10 IntJari. . si U e i i i n- y l n lm « tiv *b mwJaya-ovi**
. . 1 t ei »;>•? ei,!! r l .toiilW
■ " * 1 !. . 1 ■ : 1 ■ 1 •> 1J .: * • if
1. * r» 1 •; t.v!.;i »1 in« *r-rt j< o >ik . St a a llliq tu ( ?»*lcv Juqrl
•rii no pnltMoqob mmtxam V0f4 c j VOf- to ioqiuo *9«Q « avlp o i
polarity of th« Input. Voltaga gain« of 102 to 105 ara
available in decado «taps. The input impedance is 3.3K ohms.
The biasing circuit simply converts the voltage range
-10V to +10V into approximately 0 to 1V (see Fig. 23). Adjustment
of variable resistances allows a voltage range less than this to
be converted into 0 - 1V i f desired and also allows for zero output
from the amplifier to be converted into other than ¿V. A ze'ner diode
restricts the maximum voltage supplied to the thyristor firing
module input to ju st over 1V, thereby protecting the triac from
large amplitude pulses which may destroy it*
The temperature bandwidth of proportionality for the
control system can be varied by changing the amplifier gain, by
adjusting the variable resistance in series with the amplifier
input and to a lesser extent by adjusting the biasing circuit
resistances. The control system is , therefore, versatile and can
cope adequately with a range o f d iffering conditions including
quite large thermal time lags between heater and sensor.
■ten used in conjunction with the previously described
cryostat accurately linear heating rates were obtained in the.
temperature range above ambient temperature but in i t ia l ly some
deviations from lin e a r ity were experienced at low temperatures.
These were due to two e ffe c ts . One was a thermal time lag e ffe c t
oaused by switching on the heater and con tro lle r together which
resu lted in in i t ia l over-eerreotien . This a ffeo t could be
elim inated, however, by switching on the ^ea^ap f i r s t and waiting
fo r a few seconds before switching on the h e lie a l potentiometer
motor d rive . The other o ffse t was due to the be llin g o f f o f liqu id
nitrogen . Mien the lev e l o f liq u id nitrogen dropped below the end
e f the eepper red a major source o f heat le a s , namely the latent

B IA S C IR C U IT

Fig, 24 View of the electronic recording equipnent* The linear
heating rate controller ia aeen in the lower le ft of the picture.

View o f the electronic recording equipment. The linear
heating rate controller is seen in the lower le f t of the picture.
• »
mi

heat of vaporisation, was suddenly lost causing the temperature
to rise very quickly, and this again caused some overshoot«
However, this problem was overcome by pumping o ff most of the
liquid nitrogen prior to heating. The specimen holder is
sufficiently well insulated from the outside to hold its
temperature reasonably well for a few minutes.
4,3 Temperature measurement and recording.
Originally two P.R.T. elements were used« one for
temperature control and the other for temperature measurement.
After minor modifications to the specimen holder, made in order
to reduce the thermal lag, i t was found that temperature control
was so good that measurement and control could be Achieved using
only one P.R.T. element without appreciable error. It is possible
to keep the error voltage across the bridge to less than 0.2 mV
below ambient and less than 1 mV up to 350°C when controlling the
temperature using the P.R.T. in contact with the sample. Thus a
direct measurement of the voltage across the P.R.T. using the
X-axis of a high impedance XY recorder y ie lds a temperature
measurement which is accurate to better than 4# at low temperatures
and better than 3ft at high temperatures. Previously, temperature
measurement whilst somewhat more accurate ( ^ 2ft) required an
additional constant current supply.
The precision P.R.T. elements used obey the Callander-
Van Dusen equation relating resistance with temperature which
is accurately linear over temperature ranges of the order of
100C deg. but s t i l l ressonably linear over much longer temperature
ranges. The manufacturers quota raaistance values at 10 C deg
intervals with tolerances and the type used here (2050S) has a
resistance at 0°C of 50 - 0.00 ohms. Accurate meaeurement of lta
61.

62
resistance gives a temperature tolerance of Í 0.1 C deg at
-100°C, and Î 1.4 C deg. at 400°C. Thermal time response to
a 100 C deg. temperature step is of the order of a second.

CHAPTER I I I
UJMINE9CENCE IN METEORITIC SILICATES

63
1. Previous work«
Very l i t t le evidence o f studies of luminescence in
meteorites existed prior to 1964 and what l i t t le work had been done
was concerned mainly with thermoluminescence95' 96' 97. However,
the possible relevance of such studies to the lunar surface
stimulated further interest, particu larly a fte r the publication of
the luminescence spectra of enstatite achondrites in 19645’6.98 99
Reid et a l ’ were interested in the difference between red and
blue luminescent enstatite and o rig in a lly suggested that the
difference might be an order-disorder phenomenon, but later confirmed
the conclusions presented here as did Grflgler and Liener .
Houtermans & Liener101 and Liener et a l100' 102 determined the
natural and a r t i f ic ia l 'glow' curves for a large number of meteoritic
samples up to 400°C but only above room temperature* Sun & Gonzales,
however, determined the 'glow ' curves for enstatite achondrites in
the temperature range -150 to 250°C, for both blue and red emission
103bands separately using f i lte rs .
Using 10 KeV proton excitation, Nash has measured the
luminescence spectra and efficiency of a number of minerals and
72finda the efficiency, in general, very low •
104The use of cathodoluminescence as a petrological tool ’
105,106 ravi vtd interest in the nature of luminescence centres
in nsturally occurring minerals* However, most studies to date
have been phenomenological in approach and l i t t le or no discussion
of the nature of the luminescence centres has been attempted. This
is not surprising since the systems involved ere very complex both2+
in composition end structure* One exception has been the Mn7
emission in iron-free enststltes which was orig inally suspected
as a result of s comparison with synthetic MgSiO^ t Mn107*

64
Manganese-activated magnesium metasilicate is a well-known108
phosphor of known spectral emission and cathodoluminescence
efficiency4^.
Previous studies of the luminescence of plagioclases
have been limited mainly to thermoluminescence properties since
feldspars are probably responsible for thermoluminescence in most 109
igneous rocks • Detailed studies of the luminescence spectra
of plagioclases have only been attempted very recently when this
mineral was found to be the major luminescent component in lunar
surface m ateria l^*^»^3,110^
2. The Luminescence spectra of enstatlte achondrite meteorites.
The luminescence spectra of these meteorites consist of
a red emission band with a peak at about 6700A and a broad blueO
emission band of much lower intensity with a peak at about 4100A.
The proton-excited luminescence spectra of average samples of five
meteorites of this class are shown on the le ft of F ig.27. Variations
in the ratio of red to blue peak height occur between different
samples of the same meteorite as well as between different meteorites.
However, it is evident that average samples of Pesysnoe show a
larger red to blue peak height ratio and, of Bishopville a smaller
red to blue peak height ratio than the others.
*Following the original publication of the proton-excited
luminescence spectre of three specimens of th is class of meteorite,
Gerlick suggested that the red emission wee probably due to manganese
centres in the enstatite107. He showed that the position and shape of
the red emission peak of the meteorite Khor Temiki was almost
identical to the eathodoluminascenes spectrum of synthetic MgSi03
with 0.19 mole per cent manganese. It was not known at that time

what mineral phase was responsible for the blue emission.
In order to determine what mineral phases were
responsible for the two emission bands, a crushed sample of the
Bustee meteorite was separated by visual appearance under a
microscope into its different mineral constituents. This was
possible only on account of the coarse-grained texture of specimens
of this class of meteorite. White crystalline enstatite appeared
to be the major constituent. Gray crystals were identified, with
the help of Prof. MacKenzie of the Geology Department, as Diopside
(CaMgSigOg) which is a monoclinic pyroxene. This mineral, however,
usually showed ex-solution lamellae of enstatite and was, therefore,
d ifficu lt to obtain enstatite free . Brown crystals of oldhamite (CaS)
were present and rare minute golden octahedral crystals of osbornite
(TiN) were identified.
Proton-excited luminescence spectra of a l l these
separated fractions were determined with the exception of osbornite
which was non-luminescent. The emission spectrum of enstatite
was very similar to the emission spectrum of the meteorite as a
whole and was of similar luminescence efficiency. The luminescence
spectrum of diopaide, however, appeared to be similar but of lower
efficiency. It waa, therefore, concluded that this luminescence was
due to enstatite contamination. Oldhamite also appeared to be
sim ilarly contaminated but its luminescsnce spectrum showed an
additional paak at about 5800X, However, since this mineral is
present only in small amounts and is also more susceptible to
radiation damage than enstatite, this peak is not usually evident
in the spectrum of the meteorite as a »tools. The luminescence
spectrum of a laboratory sample of CaS was found to have a similar
yellow peak, and the luminescence efficiency was also found to

66
deteriorate rapidly*
It is concluded) therefor«) that the enstatite is
responsible for a l l the observed luminescence including the blue
emission*
By viewing the proton-excited luminescence of separated
enstatite grains under a low-power microscope it was noted that
some grains visually appeared to luminesce distinctly red and
others d istinctly blue whilst some appeared bluish redf or purple*
The d istinctly blue and red luminescent grains were separated out
and their luminescence spectra determined* The luminescence
spectrum of a visually red luminescent enstatite grain was found to
be sim ilar to the spectrum of an average sample of the meteorite
as a whole but with a s ligh tly reduced blue peak*
The luminescence spectrum of a visually blue luminescent
enstatite grain from the Bustee meteorite is shown in Fig* 26*
Although the blue emission band is now predominant) the red emission
peak is « t i l l present and the blue to red peak height ratio is
about 1*5* X-ray powder analysis has shown both red and blue
luminescent grains to be orthoenstatite*
Observations on a thin section of the Bustee meteorite
under proton irradiation revealed that a region of enstatite showed
mainly red luminescence with a small zone of predominantly blue
luminescence* Studies of the optical properties of this zone
under a mioroscope did not reveal any consistent differences from
the properties of the surrounding enstatite*
Grains of enstatite from the Khor Temikl meteorite
separated according to the colour of luminescence by the above
procedure were subjected to neutron activation analysis* Using the
"rabbit" fa c ility on the Universities Research Reactor at Rlsleyf

67
these samples were irradiated with thermal neutrons by
Mr« G. Hemingway. ]£-ray spectroscopy was then carried out on
the irradiated samples« Other samples were also subjected to
this type of analysis including a sample of the phosphor
MgSiOg - Mn supplied by Prof. Garlick; a synthetic clinoenstatite
(with no added Mn) supplied by Dr« Pollack; a blue luminescent
grain of the shallowater meteorite also supplied by Dr. Pollack;
and two samples of terrestria l enstatite which had been found
to have a very low luminescence efficiency under proton irradiation.
Table I l is t s the manganese content of these samples as obtained
by this analysis. The uncertainties listed in the values of
manganese content re fer to the statistics of £-ray spectroscopy.
The actual values depend on the analysis of the MgSiO^-Mn phosphor
carried out by Prof. Garlick and Dr. Steigmann using E.S.R. and
X-ray fluorescence analysis. The uncertainty in this value may
be as much as 2Q$. This uncertainty applies to absolute values but
not to relative values of manganese content. It is evident that
there is a definite correlation between manganese content and the
99"redness" of the luminescence. More recently, Raid & Cohen , and
GrBgler & Liener100 have also found such a correlation between
"redness" of luminescence and manganese content in anstatite
from anstatite achondrites using electron microprobe techniques.
The colour of luminescence in pure iron-free enstatite
is e measure of the reletive amount of manganese present (as Mn )
in magnesium lattice sites. The variations of colour of luminescence
in some crystals show that the manganese is very heterogeneously
distributed whilst in other crystals» uniformity of colour indicates
a homogenous manganese distribution. The luminescence efficiencies
of te rrestria l samples of enstatite are very low in spite of a high

68
manganese concentration* However, since enstatite may contain an
appreciable amount of iron, it is probable that the luminescence
in these samples is quenched on this account* Terrestria l sources
of enstatite are seldom iron-free, whereas Reid and Cohen" estimate
that enstatite in enstatite achondrites normally contains less
than 500 ppm iron.
By comparison with standard phosphors (ZnS I Ag, Cl and
Zn2Si04 i Mn) the luminescence efficiency of the enstatite
achondrites under proton excitation was estimated to be o f the
order of 1$. Luminescence efficiency is here taken as the ratio
of luminous energy emitted to the incident energy. Estimates of
efficiency have been based on the absolute measurements o f Bril
40and Klasens for 20 KeV electron excitation* Whether the luminescence
efficiency under proton excitation is similar to that under electron
excitation has been questioned” ' ^ and a discussion o f this
point w ill be given later. Nevertheless, the luminescence
efficiencies under proton and electron excitation are here assumed
to be similar on the basis of the evidence presented in Chapter I ,
section 3*4*
3. Luminescence of synthetic enstatites and forsterites*
3*1 Preparation.
The mineralogy of enstatite achondrite meteorites gives
evidence that the formation must have been in a highly reducing
environment* Any iron present is either in the metallic state
or in the sulphide phase ( t r o i l i t e ) ^ 0* In order to prepare
synthetic enstatita in similar conditions, Dr. James, formerly of
the Geology Department, heated prepared gels in a carbon crucible
using a radio frequency heater to a temperature of ebout 1700°C
and small crystals of anstatite were formed from the melt on cooling*

69
X-ray powder analysis showed the enstatite to be clinoenstatite.
It was found that rapid cooling resulted in forsterite (Mg2Si04)
crystallizing out, particularly when manganese was present. In
order to produce a pure orthoenstatite hydrothermal techniques
had to be used. This was a lengthy procedure involving heating
for up to 20 days at around 800°C at high pressure. On account
of the time involved in producing orthoenstatite, investigations
were carried out using clinoenstatite. Clinoenstatites were
prepared with nominally zero, 100, 300 and 1000 ppm Mn by weight.
Iron bearing clinoenstatites to which 1000 ppm manganese had been
added, were also prepared in this manner. The resulting compositions
nominally contained 1, 3 and 10 weight per cent FeSiO^. A sample
with nominally 10 weight per cent FeSiO^ was also prepared without
added manganese.
Forsterite was also prepared in the above manner with
no added manganese and with 1000 ppm manganese. Preparation of
olivines with 1000 ppm manganese and nominally 10, 20 and 30 weight
per cent Fe2Si04 was attempted by the above method but this proved
unsatisfactory since a ll the iron was reduced to the metal phase.
Compositions were then tried at subsolidus temperatures by heating
in a carbon crucible at red heat for one or more hours. The
compositions produced formed mixtures of olivine plus iron oxide
and the resulting composition of the olivines were estimated by
112X-ray d iffraction using the method described by Yoder and Sahama •
A ll preparations and X-ray analysis were carried out by Dr. James.
3.2 Spectra of iron -free enstatites and fo rsterltes.
The proton-excited luminescence spectra of synthetic
clinoenstatites are shown in Figs. 29 and 30. Pure iron-free
enstatite prepared with as l i t t le manganese as possible ( ~ 20 ppm)

70,
appears visually blue under proton irradiation. However, the
spectrum obtained showed that the characteristic red emission peak
2+of the Mn ion was s t i l l contributing to the luminescence, and the
red to blue peak height ratio was about 0.9. The blue emission
appears to be a property of pure enstatite it s e lf and the
luminescence centres are probably due to imperfections (e .g . vacancies)
in the la tt ice . As w ill become evident throughout this work,
iron-free s ilicates in general usually exhibit a blue emission band
o«fin addition to Mn or other activator bands. Reduced s ilica also
113shows a strong blue emission band which suggests that the centre
may be an oxygen vacancy. The sub&tution of Al3* for silicon has
also been suggested as giving r ise to a blue emission114. Such a
substitution would make oxygen vacancies more probable owing to
charge compensation effects.
The efficiency of the intrinsic blue luminescence does
not vary drastica lly with manganese concentration! the blue peak
height of a sample containing 20 ppm Mn was about twice the blue
peak height of a sample containing 1000 ppm Mn. However, the red
peak height for the latter sample was some forty times that for
the sample with minimal Mn.
Fig. 33 shows the variation of efficiency of red
luminescence of synthetic clinoenstatite with Mn concentration.
The proportion of the added manganese which substitutes for
magnesium probably depends on the method of preparation and, in
particular, on the degree of reduction attained. It appears that
for a given manganese content the luminescence of synthetic enstatite
is in general "redder" than meteoritic enstatite thus suggesting
that a greater proportion of manganese has substituted in cation
sites.

71
The luminescence of clino and orthoenstatite d iffe r
mainly in the position of the blue peak. For clinoenstatite the
blue peak is shifted about 200X to longer wavelengths with respect
to orthoenstatite. This fact is demonstrated c learly in Fig. 32
which shows uncorrected spectral profiles of the blue emission of
synthetic clino- and orthoenstatite along with that of Khor Temiki.
The blue emission peak for Khor Temiki occurs close to that of
synthetic orthoenstatite showing that the enstatite present is
mainly orthoenstatite with possibly a l i t t le clinoenstatite, which
agrees well with mineralogical determinations. The position of
the red emission peak appears to be similar for both polymorphs but
with the emission peak for clinoenstatite at possibly slightly
longer wavelengths ( ^ 5 0 - 100A).
Synthetic forsterite shows similar luminescence propertiesO.
to synthetic enstatite (see Fig. 31). The Mn emission occurs
at shorter wavelength (peak at about 6400A) but there is a similar
dependence of red peak height on manganese concentration. The
blue emission occurs at longer wavelength than fo r clinoenstatite
with a peak at around 4600A. There is also a pronounced difference
in radiation damage properties in that the intensity of the red
emission of synthetic forsterite f a l l s much more rapidly with
respect to the blue emission during proton irradiation than i t does
in synthetic enstatites.
3.3 Spectra of ferromagneslan pyroxenes and o liv ine».
The isomorphous substitution of iron fo r magnesium in
these silicetes has an important effect on their luminescence
even when only s small proportion of magnesium is thus replaced.
As might be expected the luminescence efficiency is reduced es a

72
result o f the quenching e ffect of iron (presumably Fe2+) .
2+However, the red Mn emission is quenched to a greater degree
than the blue emission thus changing the shape of the spectral
profile in a manner similar to that caused by reducing the
manganese content (see Fig. 30). In addition, the substitution
of a small amount of iron causes a sh ift in the position of the
blue peak for clinoenstatite from about 4300A to about 4600A.
Fig. 31 shows the effect on the spectrum of forsterite of partial
substitution of iron for magnesium.
Relative effic iencies of blue and red emission for
synthetic pyroxenes and olivines with different iron contents
are shown in table II where they are compared with meteorite samples.
The fact emerges that pyroxenes and olivines In which nominally
10# or more of the magnesium has been replaced by iron have
exceedingly low luminescence e ffic iencies. Moreover, the
concentration of manganese is no longer an important factor either
in determining the efficiency or colour of the very weak emission.
4. The luminescence of other classes of stony meteorites.
No type of meteorite examined has a luminescence
efficiency that is as high as that of the enstatite achondrites.
In fact, a l l other stony meteorites have a luminescence efficiency
under proton excitation which is at least an order of magnitude
lower and often two orders of magnitude lower. For most types
of stony meteorites, the proton-excited luminescence spectrum
changes shape to some extent under prolonged irradiation. The way in
which i t changes also appears to be characteristic of the class of
meteorite. The luminescence properties of various classes of stony
meteorites w ill now be described.

Fig, 25
Fig. 26
Block diagram of electronic recording system for
thermoluminescence measurements»
Proton-excited emission spectrum of a blue
luminescent grain from the Bustee meteorite*
TABLE I
wavelength (A)
Mn content(p/M by at.) luminescencu approx, red/blue
•ampin f-------- colour peek ratiosynthetic elinoeiiHtatito < 10 ± blue 0 «Shallowater 8A 10 blue 1
blue, 2 grains / I7U Irtl isor. ior 1 blue 0-fl to 2
Khor Tcmiki blue/not 425 10 blus/rod —
red, 2 grains 1 770 40l 11450 301
rod « t o 10
terrestrial »nutet ite; Moravia 1020 20 nil —
H. Carnlinn 1970 20 nil —
Mg8iO,-Mn 4500 »0 rod 00

I
Fig. 25 Block diagram of electronic recording system for
thermoluminescence measurements*
Proton-excited emission spectrum of a blue
luminescent grain from the Bustee meteorite*
TABLE I
Mn content (p/M by a t . ) lunumaeanoo approx, rml/blue
•ampin -----------«---------- colour pivik ratio
•ynthotia alinonnHtatita < 10 ± blun 0-5ShallowutJT 85 10 bliin 1
blue, 2 grain«(170 151 1305 lO f
1 blue 0 5 to 2
Khor TVcniki blue/red 425 10 blun/rcd —
mH, 2 grain*( 770 40l 11450 30)
rod • to 10
tornntriiil »nutatito: Moravia 1520 20 nil —H. Camlinn 1070 20 nil —
MgSiO.-Mn 4500 »0 rml 00

Proton-excited luminescence spectre of echondrite meteorites*
The fu ll curves are for relatively undemaged samples and the
dashed curves« where shown, ere spectra after subsequent
irradietion damage* The ordinates represent intensity on scales
which are arbitrary but linear with the zero on the wavelength
ax is , which is graduated in thousands of A units* The spectra of
damaged samples have been scaled to be below those of the undamaged
samples but the actual intensity scales are unrelated* The
instrumental bandwidth is in a ll cases about 3QA*
Johnstown Hypersthene Ach.
i— r
t — t— t— *

Khairpur Laka LabyrinthEnatatila Ch. Hyparathana Ch.
à.

I
Fig» 29 Luminescence spectra o f i -
1* Khor Temiki (enstetite achondrite)
2. Synthetic clinoenstatite t 316 ppm Mn
3. Synthetic clinoenstatite t 18 ppm Mn.
The linear intensity scales of these curves are arbitrary
and unrelated.
F io. 30 Luminescence spectra o f i -
1. Synthetic clinoenstatite i 1000 ppm Mn|
3 mole per cent FeSiOg
2. Synthetic clinoenstatite i 1000 ppm Mnj
10 mole per cent FeSiO^
The linear intensity scales are arbitrary and unrelated.
FIq . 31 Luminescence spectra o f i -
1. Synthetic forsterite i 1000 ppm Mn.
2. Synthetic olivine I 1000 ppm Mn|
4 mole per cent Fe2Si04
3. Synthetic clinoenstatite.
The linear intensity scales are arbitrary and unrelated.

Fig, 32 Uncorrected spectra of the blue emission o f« -
1, Synthetic orthoenstatite
2* Synthetic clinoenstatite
3, Khor Temiki (enstatite achondrite)
Fla* 33 Relationship between red peak height and manganese content
for synthetic clinoenstatite

TABLE I I
Fe x 100* Intensity of
red emission
at 6600A
Intensity of
blue emission
at 4300A
Sample (Fe + Mg)
in s ilicate
pyroxene 0 (<100 ppm)Fe
1
1000 + 15(Mg,Fe)Si03 250 5
+ 1000 ppm Mn 3 11 0.3 (0 .8*)
10 0.9 0.4 (0 .7*)
pyroxene 0 24 30
+ 20 ppm Mn 10 - 0.5
olivine 0 1200 13 (40»)
(Mg,Fe)2Si04 4 14 0.5 (1 .5*)
+ 1000 ppm Mn 10 0.3 < 0 .5
Meteorites (composition of samoleis variable)
Khor Temiki 0 ( < 0.05) 230 - 300 13 - 25(enatatite
chondrite)
Holbrook '>20 1 - 1.5 3 - 4(hyperethane
chondrite)
Khairpur ? ( < 3 ) 12 - 13 3 - 4(enstatite
chondrite)
f taking th ia arbitrary valua (abaoluta efficiency-\$0
and measuring other valuaa ralativa to thia*
* at 4600A

73,
4.1 The Enstatite Chondrites.
Proton-excited spectra of three specimens of this class
of meteorite are shown at the top le ft of Fig. 28. Khairpur and
2+Daniels Kuil show quite distinctly the Mn emission from the
enstatite, which constitutes about 50# of these meteorites, whilst
in the emission spectrum of Abee the Mn emission peak is very weak.
As in the case of the enstatite achondrites, the luminescence
efficiency is higher when the red to blue peak height ratio is
larger. The spectrum of Indarch has also been determined and found
to be similar to Daniels Kuil but with a slightly lower red/blue
peak ratio . Comparisons of the in it ia l luminescence efficiency
of the red and blue emissions of various samples of Khairpur have
been made with the corresponding emissions of Khor Temiki ( an
enstatite achondrite), and these show that the luminescence
efficiency of Khairpur is of the order of 0.06$. The comparative
figures are given in table I I . These comparative figures are in
good agreement with those more recently determined by B lair and
115Edgington using 146 MeV proton irradiation . Comparisons of
estimates of absolute efficiencies with those estimated by these
workers are d if f ic u lt on account of the grossly different proton
energies and fluxes involved.
This class of mstsorite is also characterized by a high
degree of reduction. MnS has been reported in Abee so that i t is
possible that the manganese concentration is very low in the s ilicate
phases of this meteorite. However» the luminescence efficiency of
the blue emission in enststite chondrites is considerably less
than that for enstatite achondrites. This fact suggests that the
snstatits is not ss pure in the chondrites as i t is in the achondritee.
This contention is supported by very recent work by Greer1 A

74
small amount of iron in the enstatite would, in addition to
reducing the overall luminescence efficiency, also reduce the
red to blue peak height ratio with respect to iron-free enstatite
with a similar manganese concentration, as shown in the last
section* Thus we have a qualitative explanation of why the red to blu«
peak height ratios are lower in the enstatite chondrites than in
the achondrites* However, proton irradiation damage effects in
enstatite chondrites lead to a very noticeable difference in the
rates of deterioration of blue and red luminescence. The intensity
2+of the red Mn emission deteriorates much faster than that of
the blue emission although the blue emission peak also sh ifts to
longer wavelengths* Excepting Bishopville which shows a similar
effect, enstatite achondrites and synthetic enstatites do not show
such a pronounced d ifferentia l deterioration of the two luminescence
emissions* The reason for this difference in luminescence properties
between enstatite from the chondrites and synthetic enstatites with
a small proportion of added iron is not yet clear* It is possible
that other re lative ly iron-free mineral phases, which are present
in small amounts, may be contributing to the luminescence* The
most likely is plagioclase usually present in amounts up to 1CJ6
and of oligoclase composition*
4,2 Bronzlte and Hypersthene chondrites*
These are by far the most common types of stony meteorites*
The Prior-Hay catalogue lis t s about 250 of them and according to
Mason many of the unclassified meteoritic stones probably belong
to this group1 *
The proton-oxcited luminescence spectra of several
specimens of these types of meteorites are shown in Fig* 28* The

75
overall colour of luminescence could be described as bluish-white
or pale blue» These meteorites consist mainly of pyroxene and
olivine with usually more of the latter. Plagioclase of
oligoclase composition is usually present in amounts up to about
1($. The pyroxene contains more than 14 mole per cent FeSi03 in
the bronzite chondrites and more than 20 mole per cent in the
hypersthene chondrites; the olivine contains a similar proportion
of iron. Therefore, provided the pyroxenes and olivines present
are equilibrated ( i . e . the distribution of iron fa ir ly uniform)
then l i t t le or no luminescence would be expected from either of
these minerals according to the results of section 3.3. The
efficiency of luminescence in these meteorites is of the order of_4
10 but even this is considerably higher than the efficiency of
synthetic enstatites and olivines containing nominally 10 mole
per cent iron silicate (see table I I ) . The spectral p ro file usually
shows a maximum at around 4500^ in it ia lly but the peak becomes less
pronounced and moves to longer wavelengths on prolonged exposure
to proton irradiation; the overall luminescence efficiency decreases
115in the usual fashion. B lair and Edgington suggest that the
ferromagnesian minerals in these meteorites are responsible for
the luminescence emission but according to the results presented
here, this seems unlikely. Moreover, studies of thermoluminescence
of these meteorites by Liener and Houtermans have shown that
there is a correlation between the intensity of thermoluminescence
and calcium content. Since most of the calcium w ill be in the
feldspar they conclude that the feldspar ia responsible fo r the
observed thermoluminescence. In order to determine whether the
proton-excited luminescence was due to the feldspar (plagioclase)
component, mineral separation was attampted on Holbrook, a
hypersthene chondrite,using the fa c ilit ie s kindly provided by

76
Prof. McKenzie of the Geology Department. The technique used
was the usual one of separation by density using heavy organic
liquids of d ifferent densities. Plagioclase is considerably less
dense than the ferromagnesian minerals and w ill tend to float in a
liquid of intermediate density. Repeated separation of the light
fraction was carried out and the refractive index of the grains
thus separated estimated by immersing in liquids of known refractive
index on a microscope stage and then observing the Becke effect.
This separation technique proved very lengthy and did not yield
very pure separated minerals, owing to the existence of composite
grains. Further grinding to a smaller grain size was, therefore,
required but separation with very fine grains proved d iffic u lt
owing to surface tension and suspension effects. However, the
luminescence intensity of the light and heavy separated mineral
fractions from Holbrook were compared. It was found that although
the heavy fraction s t i l l showed some luminescence (possibly due to
unseparated plagioclase) the emission from the light feldspar
fraction was about two or three times brighter. Viewing the
luminescence of these grains through a low power microscope revealed
a fa ir ly large grain showing an orange coloured luminescence.
Dr. M ills of Leicester University has produced colour
photo-micrographs of a section of the Barwell meteorite under
electron bombardment. These show areas of blue luminescence and
occasional small areas of yellow-red or orange emission with large
areas showing negligible luminescence.
The recognition of minerals is much easier in thin
section and simultaneous analysis of the mineral phase and
observation of i t s luminescence is possible, using an electron
microprobe analyser. Therefore, with the helpful cooperation of
Mr. P. Suddaby of the Geology Department, Imperial College of London,
sections of the equilibrated hypersthene chondrites Appley Bridge

77
and Mangwendi were studied using an electron microprobe analyser.
An interesting area of the section was selected and
the scanning electron beam fa c ility used. This fa c ility allows
a fine electron beam to raster across the selected area. The
resulting luminescence emission can either be photographed in
colour or visually observed. Colour photography, however, requires
very long exposures of the order of an hour or more. The X-ray
emission from the area under bombardment is monitored using an
X-ray crystal spectrometer and geiger tubes. The spectrometer was
set on the K — line for a particular element and the output of
the scaler used to modulate the intensity of the electron beam
of a C.R.O. The C.R.O. electron beam was rastered in synchronism
with the microprobe electron beam and the resulting pattern
photographed. This pattern showed the distribution of the
particular element over the area of the section under bombardment.
Element distribution photographs were obtained for several elements
including iron, aluminium, calcium and magnesium. A definite
correlation was observed between areas of low iron count and areas
of luminescence. Areas of low iron density usually coincided with
areas of appreciable aluminium density indicating that these areas
were plagioclase. One small area of a section of Appley Bridge
showed the yellow-orange luminescence mentioned previously. This
area had a very low iron and aluminium count but a very high
calcium count. Mineralogical analyses of these meteorites show
that they often contain accessory amounts (about 1$) of apatite,
which is a calcium halophosphate. An X-ray picture of the
phosphorus distribution confirmed that the orange luminescence
was an area of apatite. The colour of this luminescence is
reminiscent of manganese-activated calcium halophosphate. Areas
of high megnesiiaa and iron count were usually associated with non-

78
luminescent areas and, therefore, it appears that the plagioclase
present is responsible for almost a l l the observed luminescence
with a small contribution from the minor amounts of apatite.
4,3 The Pyroxene - Plaoioclase achondrites.
These meteorites are the commonest type of achondrites
and there are now more than 40 recorded. They are characterized
by a re lative ly large proportion (usually of plagioclase
which is near anorthite in composition. This class of meteorites
is usually subdivided into eucrites and howardites according to
the nature of the pyroxene. In the howardites i t is mainly
hypersthene and in the eucrites i t is mainly pigeonite which is
a clinopyroxene containing a small amount of calcium. Both the
hypersthene and the pigeonite contain more than 20 mbit per cent
iron silicate and would not, therefore, be expected to contribute
much to the luminescence of these meteorites. The proton-excited
luminescence spectra of a typical howardite and eucrite are shown
in Fig, 27. Both show a prominent peak at about 560oX which
becomes less prominent after prolonged irradiation. This peak is
almost certainly the same as that which occurs in the luminescence
spectrum of lunar plagioclases as w ill be discussed in the next
chapter. A number of terrestria l samples of plagioclase have also
been found to exhibit the same peak in the proton-excited
luminescence spectra. Moreover, there is also a hint of this
emission peak in the spectrum of some bronzite and hypersthene
chondrites (see Fig. 28). A discussion of the possible origins of
plagioclase luminescence is deferred until the next chspter.
The efficiency of luminescence in Juvinas (a eucrite)
and Kapoeta (a howardite) is somewhat higher than for hypersthene
and bronzite chondrites but of the same order of magnitude ( ~ 1 0 “4) .

79
4.4 The Hypersthene achondrites.
These meteorites, which are small in number, consist
almost entirely of hypersthene with only small amounts of other
minerals such as olivine and plagioclase. Of the three meteorites
of th is class which were examined, only Johnstown exhibited
any measurable luminescence, Shalka and Tatahouine had luminescence
-5efficiencies of less than 10 . The proton-excited luminescence
spectrum of Johnstown is shown in Fig. 27 and it is probable that
this luminescence originates mainly from the small amount of
plagioclase present which is bytownite in composition* The
luminescence efficiency of Johnstown is rather lower than that
of a typical hypersthene chondrite, but of the same order of
magnitude ( about 10 ) ,
4.5 The Olivine - Pigeonlte achondrites.
There are only three known specimens of this rare class
of meteorite and only two of any appreciable size. Of these
two, one Novo-Urei is kept in the U.S.S.R, and so only Goalpara
was available fo r study. An analysis of Novo-Urei has been made
117by Ringwood who did not detect any feldspar. These meteorites
consist of olivine and clinopyroxene (pigeonite) in a matrix of
carbonaceous material. Very small diamonds have been found in
Goalpara and Novo-Urei. Ringwood measured the refractive indices
of the olivine and pigeonite and deduced that they contained more
than 20 mole per cent iron silicate . In view of the mineralogical
composition of these meteorites i t might be predicted that no
luminescence would be observed. However, Goslpara shows a red
luminescence under proton (or electron) excitation and the
proton-excited luminescence spectrum is shown in Fig. 27, Moreover,
the efficiency o f luminescence is compsrable with that of the

80,
-4 -3enstatite chondrites i .e . in the range 10 to 10 . The
emission is almost to ta lly confined to the orange-red region
of the spectrum and the peak occurs about 6400A. The origin
of this emission remains an unsolved problem. Neither of the
major constituent minerals would be expected to show luminescence
with so much iron present, particularly i f the emission is due to
2+Mn . Moreover, the lack of any appreciable blue emission is
also unusual. It is possible, however, that the olivine and the
pigeonite are unequilibrated and that small regions of low iron
content occur which may coincide with regions of high manganese
content. Both iron and manganese have a preference for the same
lattice site (M2) in o livines and pyroxenes. This possib ility is
suggested by the fact that very recently, red emission has been
118observed in an unequilibrated hypersthene chondrite . However,
such an explanation can only be very tentative without further
information.
4.6 The Ollvlne-Pigeonlte and Carbonaceous Chondrites.
Several meteorites of these types were examined
(Karoonda, Kaba* Orgueil and Cold Bokkeweld) and none showed
any appreciable luminescence) i .e . luminescence efficiencies
-5were les6 than about 10 • Olivine-pigeonite chondrites often
contain up to 1Q6 plagioclase but either this must have an
appreciable iron impurity content or else most of the luminescence
is absorbed by other mineral phases. These meteorites are almost
black in colour, and consist mainly of olivine with more than
30 mole per cent faya lite (Fe2Si04) . The s ilica te in the
carbonaceous chondrites is usually hydrated and sometimes amorphous.
It is stated that some carbonaceous chondrites contain chondrules
16eof forsterite or enstatite which would show some luminescence,
but such chondrules were not evident in the samples examined.

81
5. The effect of proton irradiation on luminescence effic iency«
As discussed in Chapter I (section 3 , 5 ) , proton
irradiation of phosphors using high flux densities leads to a
rapid decrease in luminescence efficiency* Measurement o f the
in it ia l intrinsic luminescence efficiency of the undamaged phosphor
must, therefore, be made before enough particles have been incident
to cause a noticeable deterioration. When fa ir ly high flux
densities ( ^ > 10^2 particles cm“2 sec"*) are used, the measurement
must be carried out in the f i r s t fraction of a second of exposure.
Failure to do this may result in large errors in the estimation
of intrinsic luminescence efficiency, particularly for phosphors
which show the quickest deterioration such as organic phosphors
and sulphides. The usual type of recording system involves a time
response of the order of a second which is determined either by
the amplifier time constant or the response time of a pen recorder.
12 -2 -1For proton flux densities higher than about 10 cm sec a time
response of the order of a second or more could lead to serious
error in estimating the intrinsic luminescence efficiency*
Comparisons of efficiencies were, therefore, made using as small
a proton flux density as possible. The smallest workable beam
current density was about 0.04 ^A cm“2 which corresponds to around
2 . 1011 protons cm“2 sec“^.
12According to G ilfrich about 2 . 10 incident protons«2
dm result in the luminescence efficiency of ZnS - Ag (hexagonal)
fa llin g to half its in it ia l value**. In order to examine the in it ia l
rate of deterioration of luminescence under the conditions of
irradiation in the present accelerator the luminescence decay of
ZnS - Ag with time was recorded using a fast response recording
system. This system used a Keithley high speed picoammeter

82
type 416 which is an electrometer D.C. amplifier having a
minimum rise time of the order of a millisecond» The output
was then fed to a C.R.O, (Hewlett-Packard 140A) which was set to
trigger a single time base sweep on the incoming pulse» The
resulting trace could then be photographed using a Polaroid 'scope
camera with the shutter held open» The results are shown in
Fig. 34, The 'scope trigger was armed for a single sweep at
either 0.1 or 1 sec/cm and the flap valve, which was intercepting
the proton beam, quickly moved away to expose the sample* The
luminescence was monitored in a particular wavelength band by a
photomultiplier and the signal from this triggered the 'scope
time base. The major limitation of this method is the speed with
which the flap valve can be moved out of the proton beam. This
takes about a ^ 20th to V-|oth of a second. Measurements of the
change ( i f any) in the luminescence efficiency in the f ir s t V^qq th
of a second of exposure to irradiation would be possible using a
photographic shutter in the proton beam. However, the ultimate
limitation is one of signs1-to-noise ratio when using large
bandwidth amplifiers. Results obtained here for ZnS t Ag are in
reasonable agreement with those obtained by G ilfrich .
72However, Nash claims that the luminescence effic iency
of ZnS i Ag under 5 KeV proton irradiation is some 300 times less
than the luminescence efficiency under 20 KeV electron excitation
as measured by B r il & Klasens4®. In view of the measurements of
Henle & Rau41 and the feet that th is phosphor is often used fo r
the detection of heavy particles this result seems anomalous*
However, Nash quotes this efficiency as that measured after one
second of exposure to the irradiation. Since the proton current
density is around 10jih/cn , the efficiency quoted is likely to be

83
considerably lower than the in it ia l intrinsic efficiency. In
fact, assuming that the formula I ■ *o is applicable1 + CN
at such a current density where C has a sim ilar value to that
obtained by G ilfr ich and by the author, then the intensity after
one second of exposure would have fa llen by a factor of the order
of 50 - 100. Nash's figures for luminescence efficiency of
ZnS i Ag after various times of exposure show that the above
formula appears to be applicable to his resu lts but with a value
of C which is about 100 times smaller than that determined by
either G ilfrich or the author. It would, therefore, appear that
C may be dose rate dependent particularly fo r high dose rates.
However, experiments carried out by the author indicate that C
changes very l i t t le fo r an order of magnitude change in dose rate
but i t has not been possible so fa r to carry out measurements at
proton current densities similar to those used by Nash.
111Schütten & Van Dijk have also claimed that an
appreciable difference in luminescence efficiency occurs between
electron and proton excitation. Their measurements were carried
out on willemite (Zn2Si04 t Mn) and suggest a factor of 103( I )
for the ratio of e ffic iencies under electron and proton bombardment.
However, it has since been ascertained that proton current densities
of the order of 50 «A/cm were used and it is not known just how
long a fte r in it ia l exposure these measurements were made. It
seems reasonable, therefore, to discount such measurements as
invalid .
It is found that the deterioration of the luminescence
efficiency of enstatite is considerably slower than that of
ZnS i Ag. This is consistent with the findings of previous
workers4* ’ regarding the higher stab ility of silicatea.
A comparison of the in it ia l deterioration of luminescence
intensity of ZnS t Ag with MgSiOg t Mn under 40 KeV proton
irradiation is shown in Fig, 34.
The deterioration of luminescence over several minutes
of proton irradiation was monitored using the usual recording
system (time constant sec) and the results for ZnS i Ag and
the meteorite Khor Temiki are plotted in Fig. 35 and 36. I f
the formula I ■ — is applicable, a plot of 2 /N yields1 + CN I
C 1a straight line of gradient ___ and intercept 1 on the*o I 0
1 axis. From Fig. 35, the damage constant C was found to be
-14 2 2+about 1.5 . 10 cm. sec.for the Mn emission of the meteorite
Khor Temiki. On account of the rapid deterioration of the
luminescence intensity of ZnS i Ag under proton irradiation, the
measurements for this phosphor are best plotted logarithmically
(F ig, 36). A plot of log 2 against log N yields a straight
line of gradient unity when CN 5 1, i f the formula given above
is applicable. When CN o»1, the plot yields a curve but by
extending the straight line until the value of 2 on this line
is 'iia lf the actual value on the curve we find the value of N when
-14CN ■ 1. This procedure gives a value for C of about 140 . 102
cm . sec. for ZnS 1 Ag. This is rather higher than the value
obtained by G ilfrich but of similar order o f magnitude.
Recovery of the luminescence efficiency of enstatite
has been obtained by heating for an hour at a temperature of hbout
800°C. A degree of recovery at lower temperatures was achieved by
heating for longer periods but very l i t t le recovery was evident
after heating for several days at temperatures below about 350°C.

I
/
Fig. 34 Oscilloscope traces of the in it ia l fa l l of luminescence
intensity on f ir s t exposure to 40 KeV proton irradiation#
(a ) ZnS t Ag, sweep speeds 0*1 sec/cm.2
proton current density« 0.15 ^A/cm .
(b ) ZnS s Ag, sweep speeds 1 sec/cm.2
proton current densitys 0.04 ^A/cm .
(c ) MgSiOg s Mn (1000 ppm)
sweep speeds 1 sec/cm.2
proton current densitys O .M p A / c m •
'
( a )
( b )

I
Fig» 35 Graph showing the deterioration of luminescence intensity,, o
I , with total number of incident protons /cm , N, for
ZnS i Ag and for the red emission of the meteorite
Khor Temiki (K .T.)
F ig, 36 A logarithmic plot of the reciprocal of luminescence
intensity, I , against total number of incident
2protons /cm , N, for ZnS t Ag. The gradient is
approximately unity except in the region where CN « 1,

85
Such heating was carried out in a tube furnace through which
a continuous stream of 'white-spot' nitrogen was passing. Great
care had to be taken to avoid jostling the powder grains on
transfer from the accelerator to the furnace and back since a
disturbance of the grains would give rise to an apparent recovery
of luminescence efficiency owing to undamaged material being
exposed*
Very recently some preliminary direct comparisons of
the in it ia l luminescence efficiency of ZnS t Ag and MgSiO^ i Mn
under 5 KeV protons and electrons have been attempted using the
recently completed low energy accelerator. However, identical
conditions of focussing and beam current density are d iffic u lt to
achieve. Preliminary results suggest that the luminescence
efficiency of ZnS i Ag and MgSi03 t Mn under 5 KeV proton
excitation is about a factor of 5 lower than for 5 KeV electron
excitation after corrections have been made for radiation damage
effects. However, further investigations are necessary particularly
with regard to the accurate measurement of beam current density.
Extensive proton irradiation of a sample of MgSiO^ i Mn
has been carried out in the new accelerator to determine whether
any radiation darkening affects occur. Irradiation with 5 KeV2
protons for an hour at a beam currant denaity of about 5 p A/cm
did not induce any viaually distinguishable differences in
re flectiv ity or colour between the area of the sample irradiated
and the surrounding unirradiated area. \ '
6. Preliminary, thermo lu m in e s c e mef^urementf.
Thermoluminescence 'glow ' curves have been measured for
enstatite achondrlte meteorites and synthetic enstatltes in the

B
r pci ;e >: ■
i nloi Islreiiim b*r>funfcbou of
V i ... .-iv •! ; :o 2 yjf r in Jtaiq epos -
a
o«*
firJOCjX®
nt-, t .O i;». hm- •> . •’ n ; ( » .1 : ■< ; ■. ( fV
eftt ;>nlan 1-s.tqwsli b flftOtl !>V6u 1 iK.'iloei* ..iu- poet* i'i Ve . c ?*bnu
, • * ' ( ■ ' ■ t 1 JOi 00 YJ C '
. f ' ! 'D ili,'1 ‘>"f y*' Uni> dm f i . i f j bftOO
. C.il tJ J •Hit h a s • 'V< ’fir e
, f. - iV* AroitFiq Ve > 'ibhnu n. i • •!. 0-H bn* !ph i c'n to i/OI 1 T 9
I 'liueJ*' Vp.\ ■ l flf ¡1$ ' • *1 no2 j J
9i ■<, i i in. 1 ji'ibei .< . r !»< •v • ■; i , ' .! t * 1 >¿¿0X9
•it Juri iTtii; ; >■ s-o i- f’<
,
nM i _ U K c-: ' l o » J q n f.e
. • .tfc'i. • ; . i t . .: -• ‘it i'.i -
»sill noioiq pvien-iix:
.»n orft ni fix tr,J i«a nee'i i ni
, • . : . ' ■ f ‘ . • ;C« A i . . t j-i.M-.iB lo f '.’i b Jnerxuo *M K i 1 #• l x rt nr io t $r\"tcn<\
ipriierlv» «niii’i&Jsi» o) tc
VeX C rlflw (u U slbs 'n
noVu \
ni seoneietftb »IdrrUiugnititlb (H rurIv yne eoubni ion bib
Imirll'* | ri r.*I<ir ■ »i.j *.*wj‘. fii' io;, r- Y#lv; Jooltyi
. i
• .li- ' i
••I l h<< L1 ' r ' ■: f ! • ‘ Vl. • l 1 ' ' . ' .|J
erii n l x e i l f s f a n s oJtor ilnY« bn* e * f h tlitmoridi
86
temperature range -190 to 400°C after excitation at liquid
nitrogen temperature using 7 KeV electrons. Previous measurements
by other workers have not extended over the complete temperature
range (see section 1 of this chapter). Sun S. Gonzales used
different heating rates for measurements below and above room
temperature, whilst the published results of B lair & Edgington
are qualitative in nature although they are the only previous
measurements carried out with the sample in vacuo. Only the
measurements of Liener et al extend above 200°C. Excitation was
achieved by 2 MeV electrons (S & C ) } MeV electrons from Sr (L )
and 150 MeV protons (B & E ). Sun & Gonzales state that
thermoluminescence from enstatite achondrites shows vivid flashes
of blue and red when observed visually . However, during the
measurements presented here no visually detectable emission was
observed. This is probably because of the low electron energy
used for excitation which gives only a small volume of excitation
on account of low penetrating power. Also, since the photomultiplier
had of necessity to be a considerable distance from the sample
( * v 7 tt) , the solid angle of light collected was small. Some
d ifficu lty was also experienced in adequately shielding the heater
so that v is ib le or near infra-red light did not reach the
photocathode. A stainless steel tube was, therefore, used to 'pipe*
light from the sample and shield the photocathode from extraneous
sources (see Pig. 18). The thermoluminescence intensity recorded
is now adequate for a ll but the weakest of thermoluminescent samples -
such as lunar samples. Heating rates up 4o‘ SO cdeg/min can be
used and most measurements have been made using this heating rate.
The recording system is shown in Fig. 25. The XY recorder plots
intensity against temperature but as a check on the lineanty of
heating rate the temperature is also monitored as a function of
time by a separate recorder (not shown in Pig. 25).

• '
bin ' ! *0 .~ CX ' - c> - »(/nsi ewdsisqciei
•j IUM • :«•' ' 0BfS Vs V (W ;p«i m u ;• if)' i st report.'.n
met e.i 9ftj isvc bebnejxe Join %V5fi/ a ■ •Jt- r w rerl to yd
beeU 7*r/' rw a to f m01 to9, 99* ) speer
4 m< l »vcdf- rib woleri 8tnw»MU'iSWi *10\ ¡nlissd tr .»r« lllb
nC' + ,,nj llr .I 10 tilur 91 beriellonq eni j r c
6uoiv I nr edi e'tb yer!J rtpuodJIe sTuJsn nl e vlie flltu p eia
•fit . 1I el'-maa srW tttlw JLK fail
esw nci J evods brioixi. 1* is n* i <• in i •> npf.n:
( j 'it l< 9 VsM f (.: • . jm <- VsM 2 yd bevslrlos
JGflj e + ifo J. c, c a; “ ; . i . n •'q Ve Oc!f bn6
■ ,n i•xviv i ,c’ *,(' cp «.* *leje: no'x t ■ • i: :i
sr!J 4 « vv •< • . ■' v xk) n«r.' •' ;-x r siilr l fi
. / i ' itatilr# ■ .!. f Jo*Jeh yllsuelv on etei i he.+r'-•e»n ' einivneruassHi
yr 1 *30: looi« wni art .i ui iKO - '!■ • . ■ 7 C I
no i 11C -■ :jXS lo sr iriov Ji : ■ Jnr r »vi >irfw rwiltailoxe rol beau
it i <■ it; Bi •0 ' ,• « ' c tr Jr-uoccs no
o- < Oi li .1 i h no; > r.- C > ■ ■; . 't<.
r ( .1.11ft» sew h>eJo*JIoo til"11 " «-.1 [in. , , "V . )
rl edt t-nii /!«1J, i»i.»• ‘'I nl been ■y; y.9 ( ; .. 'uo 't'-::.
C| * •mm < 1 Iv Jrrit oa
■ • i.. .V , ■<•.(> . ■ Tf.' J , < • slnlati » - > cr.'r i>
V ( .1 |neif X® M ■ < .11-.; n i l ; ! i ns oiqi trlpll
DSn/'lli Ofi'X ' <r. J i : .1 •••' ..I. ♦ ■ ■ . / ■■■ ’ C ?
leiqmr.* fn-o. ■ i i.'ulrnnerii to treslse».' srit Jud lie toI eiau]>ebs won al
ed nlm\ tibo OC <>t qu ae.tsi pnltasH . . vt.-nul re. rioua
a grl Jaeri «lilt i nlau st.wri nee« BVe.i aJnaaieru i. oc Jr i i ii beau
tio Iq 1 ehioost VX erfT , • r ‘ al me orl"
yinleenli eilf to >1:x lc - ■ tu«l e-ii N nqraJ ianlspa ytlenelnl
lo ml s as heir:>Jlnrm oela *1 stiliareqnteJ erit etsi pnlJseri
. . ( r l nwoda ion) ret.roast eJmsqea a emit
87
Prior to cooling and excitation a ll samples were
heated to 400°C to remove adsorbed gas, and after the glow
curve had been recorded, samples were again cooled and
subsequently heated without excitation to determine the level
of background radiation.
Glow curves for enstatite achondrites and synthetic
enstatites are shown in Figs. 37 and 38. The curves were
recorded using either a red f i l t e r (Wratten 25) or a blue f i l t e r
(Wratten 38A) to separate the two emission bands. It was found
that blue thermoluminescence in meteoritic samples was more than
an order of magnitude lower in intensity than red thermoluminescence.
The main characteristics of the thermoluminescence of meteoritic
enstatite are a well-defined peak (red emission) near 0°C and
considerable emission above about 150°C where the peaks are less
well-defined. In many cases defin ite peaks are not discernable
in the high temperature region. The peaks in the glow curve of
Cumberland Falls at 122°C, 190°C, 250°C and about 360°C are in
N 100accord with the results of Liener & Grogler although less
well-defined, whilst the low temperature peaks at -30°C and
-5°C are in agreement with the resu lta of Sun 8. Gonzales10"*.
The glow curve of blue thermoluminescence of Cumberland Falls
is also in good agreement with Sun & Gonzales although these
authors have Incorrectly poaitioned the loweat temperature peak
on account of atarting the glow curve at too high a temperature.
Comparison with synthetic enstatites shows that there
\ ' ‘is a similar trap distribution in synthetic orthoenstatite but
the trap distribution in synthetic clinoenstatites is quite
different (see Fig. 38). Moreover, the glow curve (not shown)
of a sample of the phosphor MgSiOg t Mn (300 ppm) supplied

»an*-'
.V'
pn *v* 8*Ic!i> ti} l l . poifadloxe 'n
■ ■ f ,
bn» i iXooo mV.gs »isw 8eX<j
J»V‘iJ »ri,t eni;.tei ah of nolfhtti'Xv
\ilooo o f toirfl
>v*if*w o f 0°0O* Of b*fs»ri
, i ./
'tifi* fc?*ir>»ri
.
>14 ju m o
ic 1 et-viuo woXC
it t « f l i f t e r »
tit)o i nieu boljiosM
■ :■ ( f (Aff nettai*)
oi;t*r!in\r i-n —* ■! — b■ ■' O'
• •
»uXd * -ic ( if n».t.ts*tV ) is iX H
. w 1
nr.r i »•»<'•( t r t e«vj ;• . i ti i ■ ■ ni t o -o ••..ni' •»fc t ’ ••■•'.♦ :>X- t,..v
oeenlmuioniarii bar r n ' x y i ln o ir i .-.l i«v.t-I : njlnrrf V »»Irs» nr
OÌ f . IP '\1 f*i T f - Ol . . ' ■ ! 11. . " ' * : , 0 ; i . i l ” j : 1 :i . i P f i "
( * ( f ! me •• : - - ‘ • ene
»a**J tr ■ •>; «rii •.).!•)• ' ' i •■• • p p 1 r- .' •< • >
• o • : -
c. ' • ' ' '
■ ; ‘ ■ '•< , , ; •' ioo r M
eael ri . 'lOriiis -lelgoiO A leneli io ttluàs'x «rii riJXw bioooe
1 ■ < -
cor oa. j , ■ r ~
e l i t i bnsXm wuO " eonsot ‘ rin-iiioi “(»rii euXd to eviuo **ig *rfT
s.it il-1-c riir * sei» ut * i i ritiw in ti» ■•XI, hoc, ni oeXu i t»ec, n u i t teqr.ti itmvc.I Hi.- -n< iiisoq yltttm oonl »vsri aioriius
, : , r ' . )«
eierij itr ii eworti* « » i l tarane oiiftriinyt riiiw noeltegmoO
iuri etiistaneorid-io oXiPriinY8 n* nciioriliicib quii i tA l ie l t a «X
•iluf) al »»tiiaienennllo oiiariiny* ni noliuriXiiplh qaii »rii
, . . *'r-*’ in- -
beilqque (nrf) OOC) nM t .QlJJgM **» rfcji*o:irj »di to «Xqricc s to
by Prof. Garlick is different to both the above enatatites.
I t shows a small peak at -70°C and a broad intense peak at
about 210°C. These differences are probably indicative of the
different preparation methods. Orthoenstatite was prepared
using hydrothermal techniques whilst the clinoenstatite
crystallized out from the melt in a reducing environment at
atmospheric pressure. The MgSiOg phosphor was prepared at
atmospheric pressure but without melting. I t may be possible
to use the glow curve technique to distinguish between ortho -
and clinoenstatite, since the production of orthoenstatite usually
requires high pressure.
Excitation of thermoluminescence was attempted with
7 KeV protons since this mode of excitation has been invoked
to predict thermoluminescence e ffects on the Moon's surface.
However, i t was found that the thermoluminescence intensity
after such excitation was about an order of magnitude weaker
than that induced by an equal number of 7 KeV electrons. There
are two possible reasons why this is so. Proton damage effects
may cause trapping of secondary electrons which are not released
during heating. Alternatively, since 7 KeV protons have a very
low penetrating power, the volume o f excitation is extremely
small. In any case, excitation of measurable lunar
thermoluminescence by low energy protons appears to be very
unlikely.

Fig« 37. Thermoluminescence 'glow' curves of enstatite achondrite
meteorites*
1« Red thermoluminescence of Cumberland Falls.
2. Blue thermoluminescence of Cumberland Falls.
3. Red thermoluminescence of Norton County.
Intensity scaling factors and the level of thermal
background are shown.
A ll heating rates are 50 C deg/min*
Exaltation: (a l l aanples) ? .10^ electrons (7 KeV),
F lg. 38. Thermoluminescence 'glow* curves of aynthetic enstatites.
1. Red thermolumineseence of orthoenetatite.
(1000 ppm Mn)
2. Blue thermoluminesoence of orthoenetatite.
(30 ppn Mn)
3. Red thermoluminescence of clinoenstetite.
(150 ppm Mn)
Inteneity scallng factora and thè level of thermal
background are shown.
All heating ratea are 50 C deg/min.
-200 -100 0 . 100 200 300 „^400
88
7. Discussion.
2+7.1 The wavelength of the Mn emission In forsterite and enstatlte.
It is interesting to compare the Mn emissions from
forsterite and enstatite since the environment of the manganese
ion is similar but with specific minor differences. It is known
that in both these structures the Mn ion prefers the larger M2
sites. The symmetry of these sites was shown in F igs. 1 & 3. The
average metal-oxygen distance for these sites is very nearly the
same being marginally larger for the enstatite M2 s ite which is
also more distorted from octahedral symmetry than the forsterite
M2 s ite . However, the M2 site in forsterite is co-ordinated by
six equivalent oxygens each linked to one silicon atom only,
whereas in the enstatite M2 site there are two types of oxygen
ligandst four are attached to one silicon atom only and two attached
to two silicon atoms which on the ionically-bonded model are,
14f Atherefore, 'neutral' • In fact, the value of A estimated foro
2+Fe ions in M2 sites from absorption spectra is greater for the
14cforsterite M2 site than for the corresponding enstatite site .
2+It would, therefore, appear that the Mn emission in
fo rsterite would be expected to be at longer wavelength than that
for enstatita whereas the reverse has been shown to be true.
S trictly speaking, i t i s the wavelength of the corresponding absorption
transitions A1gT„ which should be compared otherwise i t is
"9
assumed that the Stokes shift is the same for these two cases*
However, i t seams unlikely that the difference in Stokes shift for
the two cases would be as large as 40Q& which is about the minimum
which would be required to explain the discrepancy noted above*

Nevertheless, this point cannot be proved without the determination
of absorption spectra which is experimentally very d if f ic u lt
owing to the forbiddenness of the transitions involved and the low
manganese concentration* Absorption measurements on manganese
s ilicates are not applicable since the crystal structure of
magnesium metasilicate (the pyroxene enstatite) is rather different
from manganese metasilicate which is a pyroxenoid*
4The T level of the divalent manganese ion has
electronic configuration (tggJ^Og and since this level is trip ly
degenerate further splitting w ill occur in sites of low symmetry*
I f the octahedron is trigonally distorted as in the forsterite M2
s it * then the T level w ill sp lit into two levels; a doubly
degenerate one and a singly degenerate one. This can be worked
out using Fig* 8. I f , however, the octahedron is distorted so as
to be of monoclinic symmetry, the degeneracy is completely removed.
The magnitude of the splitting w ill depend on the degree of
distortion from octahedral symmetry* Absorption spectra of the
2+Fe ion in the pyroxene site suggest that the splitting of the
14c A3d electron states t_ and e are quite large for this ion • ¿A 2g g o
fo r this site is estimated at 6,800 cm-1 although the splitting
of the e level causes the lower e_ component to be decreased in 9 9
energy by 2,800 cm~\ The energy of the lowest sp lit t2g level is
reduced by about 1,400 cm"\ Since the t2g levels are sp lit
according to a 'centre of gravity' ru le about the octahedrel level,
the net energy of the three electrons occupying these levels w ill
not change* I f , therefore, for the moment, it is assumed that the
sp littin g of the 3d levels of Mn + i s similar to that in Fe^+ , then
the lowest sp lit level of the T ^ level of the manganese ion in the

90,
pyroxene would be about 4,200 cm’ 1 below that for the pure
octahedral case with the same AQ* I f it is further assumed
2+that the Mn emission w ill take place from the lower sp lit level
4of the former level, i t is obvious that this emission is
shifted to longer wavelength* A similar exercise using date, for
2+Fe in the fo rsterite site shows that the lowest sp lit level
2+ 4 - 1of the Mn T4_ level would be about 1,250 cm below that for 1g
the pure octahedral case* This is considerably less than the
reduction in energy of the sp lit level for enstatite* Therefore,
although the assumption that the splitting of the 3d levels of
2+ 2*Mn is similar to that in Fe is probably not quantitatively
valid i t is expected to be qualitatively correct and thus the4
splitting of the lower component of the manganese T,jg level w ill
be considerably greater in enstatite than in forsterite*
In conclusion, therefore, i t is tentatively suggested
that the emission peak in enstatite occurs at longer wavelength
than in forsterite possibly on account of the d iffe ren tia l splitting
of ths 4T1g level although the possib ility of s difference in
Stokes sh ift cannot be ruled out* It is hoped that future attempts
at measuring excitation or absorption spectra may elucidate this
problem* Failing the above explanations) the remaining possibility
would seem to be that the manganese ion is able to cause a larger
local distortion o f the structure in forsterite than in enstatite
thereby making much more room for it s e lf in the former structure*
This would render the comparison of known data for the corresponding
M2 sites Invalid

91
In Fig. 33, the intensity of the Mn + emission in
iron-free synthetic clinoenstatite was shown as a function of
manganese concentration. A point is reached where the addition
of more manganese does not sign ifican tly increase the luminescence
intensity. In fa c t, samples of the phosphor MgSi03 « Mn with
high manganese concentrations (up to 1$0 supplied by Prof. Garlick,
2+show that the intensity of the Mn emission decreases to some
extent with increasing manganese content beyond a certain optimum
concentration (~ 0 .1 $ ) . This behaviour is similar to the
dependence of the thermoluminescence intensity of the 470°K
'glow ' peak upon manganese concentration for manganese-activated
synthetic calcites as found by Medlin * . The explanation
given was as follows. For very low manganese concentrations the
e ffec t of doubling the manganese concentration w ill be to
approximately double the number of isolated emission centres and
hence to give an almost two-fold increase in luminescence intensity.
2+However, at higher manganese concentrations, Mn ions may tend
to cluster and i t has been suggested that the emission may be\ 2+
quenched when another Mn centre is located within a certain radius
which is of the order of a few la ttice units. Thus increasing the
2+manganese concentration, whilst producing more Mn centres, w ill
2+also increase the probability of Mn centres being located close
together in the lattice . When, eventually, more quenching clusters
are produced than new isolated centres the addition of more
manganese w ill decrease the luminescence efficiency.
This model seems to explain adequately the dependence
2+of luminescence intensity of the Mn emission upon manganese
concentration in enststite.
7.2 Other f a c t o r s a f f e c t i n g the luminescence em iss ion in e n s t a t i l e .

92
The introduction of Fe into metal cation positions
in clinoenstatite causes d ifferen tia l quenching of the blue and
red emissions. I f there is no energy transfer between ’b lue'
2+centres and Mn centres, then at least some of the quenching
2+of the Mn' emission must occur by energy transfer (probablyo, 9.
resonance transfer) from to to Fe since direct competition
for the excitation energy between the luminescence centres and
2+Fe alone would lead to equal quenching rates for the blue and
red emissions. On the other hand, i f energy transfer does occur
between 'b lue ' and 'red* centres, although there is no evidence
that it does, then the kinetics are complex and it is d iffic u lt
to generalise about quenching mechanisms.
7.3 Comparative efficiencies of electron and proton-excited luminescence.
In Chapter I , Section 3.4, evidence from the literature
was presented to show that one might expect that the luminescence
efficiency of sulphides and silicates under proton excitation
would approach that for electron excitation of similar incident
energy. Results presented in Section 5 of this chapter show that
previous workers who have suggested that comparative efficiencies
for these two types of excitation d iffe r by orders of magnitude
have not corrected for the rapid in it ia l deterioration of
luminescence efficiency under proton excitation when large proton
fluxes are used. However, possible differences in efficiency are
s t i l l apparent at low energies after correction for radiation
damage effects. There are two possible causes. At low energies
a considerable fraction of the incident proton energy is dissipated
in collisions with lattice ions, or the ionisation density is such
as to drastically increase non-radiative recombinations (ionisation
2+

quenching). Theory suggests that for proton-energies above 1 KeV
the cross-section fo r nuclear co llis ions is an order of magnitude
smaller than the cross-section for electronic excitation . Thus
we are le f t with the poss ib ility of ionisation quenching. I f
ionisation quenching increases at lower energies and thereby causes
a reduction in luminescence e ffic ien cy then the luminescence
intensity w il l not be a linear function of incident proton energy.
However, usually a linear relationship is observed experimentally
suggesting that the luminescence effic ien cy is independent o f proton
energy in the KeV range. I f the absolute e ffic iency measurements 41
of Hanle & Rau are reasonably correct then these suggest that
25 KeV hydrogen ions are as e ff ic ie n t as 20 KeV electrons in
producing luminescence in ZnS j Ag and Zn^SiO : Mn. According to
43 120the results o f Van Wijngaarden et al and Eve 8. Duckworth ,
5 KeV protons should be almost as e ff ic ie n t as 25 KeV protons in
producing luminescence in these phosphors. Thus one would expect
very l i t t l e d ifference in luminescence e ffic ien c ies for 5 KeV proton
and electron excitation . Therefore, either the absolute e ffic iency
measurements o f Hanle & Rau are too high by a factor of ^ 5 or
there are appreciable errors in the determination o f the particle
flux densities in the preliminary comparative measurements presented
here.
I f 60 KeV protons were less e ff ic ien t than 60 KeV electrons
in producing luminescence by a similar factor then the effic ien cy
estimates quoted for various samples would have to be reduced by
this factor


94 .
Dust and rock samples returned by the Apollo 11 and 12
missions have been investigated. Proton-excited luminescence
spectra of such samples have been measured in the v is ib le and
near infra-red region o f the spectrum.
1.1 Luminescence spectra of lunar fin es.
Fresh samples o f Apollo 11 lunar fines (10084-6) were
found to luminesce very weakly under 60 KeV proton excitation.
The luminescence e ffic ien cy was estimated to be not more than
10 i . e . about an order of magnitude lower than most meteorite
dust samples. On account of the extremely low luminescence
e ffic ien cy o f these samples, the spectrometer s l i t s were removed
en tire ly in order to improve the signal-to-noise ra tio and,
therefore, the static bandwidth was increased to about 200A.
The luminescence spectrum of a typical fines sample is shown
in F ig . 39 . The emission is nearly white but the spectrum
shows two discernable peaks at about 4500& and 5600A, the la tte r
being s ligh tly more prominent.
For comparison, the proton-excited luminescence spectrum
of a typical terrestria l basalt powder (U.S. geological survey
121standard BCR 1 ) was determined. The emission from this sample
showed the same two peaks but with the blue peak slightly more
prominent (see Fig. 41 )• Towards the end of the scan there
was evidence of another more intense emission band which subsequent
spectral scans in the near infra-red region showed to have a
peak around 7300A. The luminescence efficiency of this basalt
is considerably higher than that of lunar fines and is estimated
to be about 4 * 10”4.
1. 'Hie lum inescence o f lunar s u r fa c e m a t e r i a l .
Although lunar fines do show some emission in the
in fra-red no prominently discernable emission peak has been

94
Dust and rock samples returned by the Apollo 11 and 12
missions have been investigated* Proton-excited luminescence
spectra of such samples have been measured in the v is ib le and
near infra-red region of the spectrum.
1.1 Luminescence spectra of lunar fin es .
Fresh samples o f Apollo 11 lunar fines (10084-6) were
found to luminesce very weakly under 60 KeV proton excitation .
The luminescence e ffic ien cy was estimated to be not more than
10 i . e . about an order of magnitude lower than most meteorite
dust samples. On account of the extremely low luminescence
e ffic ien cy of these samples, the spectrometer s l it s were removed
en tirely in order to improve the signal-to-nolse ra tio and,
therefore, the static bandwidth was increased to about 200A.
The luminescence spectrum of a typ ica l fines sample is shown
in Fig. 39 . The emission is nearly white but the spectrum
shows two discernable peaks at about 4500& and 5600A, the la tter
being s ligh tly more prominent.
For comparison, the proton-excited luminescence spectrum
of a typical terrestria l basalt powder (U.S. geological survey
standard BCR 1 ) was determined. The emission from th is sample
showed the same two peaks but with the blue peak sligh tly more
prominent (see Fig. 41 ) . Towards the end of the scan there
was evidence of another more intense emission band which subsequent
spectral scans in the near in fra-red region showed to have a
peak around 7300A. The luminescence efficiency of this basalt
is considerably higher than that of lunar fines and is estimated
to be about 4 . 10“4.
1. The luminescence o f lun a r s u r fa c e m a t e r i a l «
Although lunar fines do show some emission in the
infra-red no prominently discernable emission peak has been feund

95
in this spectral region.
Since plagioclase is the only major, re lative ly iron-
free, mineral phase common to both, i t was probable that this
mineral was the major contributor to the luminescence, as it
has been shown to be so for the majority of stony meteorites.
Both lunar fines and basalt BCR 1 contain appreciable
amounts o f plagioclase near anorthite in composition (10064-6,
~ 15# j BCR 1, ~ 7 5 # ). In both cases, the other major mineral
component is an iron-rich pyroxene (probably augite) which is
not expected to show any appreciable luminescence. The main
difference in mineralogy is that of the presence of the opaque
mineral ilmenite ( ~ 9 # ) , a ferrous titanate, in the lunar fines.
This mineral contributes to the dark colour of lunar fines.
However, both the intricate microstructure of the fines as
revealed by scanning electron microscope photographs11 and the
possib ility of an opaque coating of the grains as suggested by
122Hapke et a l may also be contributory factors. The albedo of
fresh lunar fines (10084-6) was found to be about 7# of that of
a fresh MgO screen when a tungsten lamp operating at a colour
temperature of 2850°K was used as a source and a tr ia lk a li
photomultiplier (EMI 9558B) used as detector. The angles of
incidence end observation were both 45° but in mutually perpendicular
planes. The albedo of basalt BCR 1 was about 4Q# under these
conditions*
Although the proportion of plagioclase in basalt BCR 1
is some f iv e times higher than that in lunar fines 10084-6, the
luminescence efficiency of the former is considerably more than
five times that of the latter. This discrepancy may be accounted
for by the difference in a lbedos-

96.
i . e . a considerable degree of self-absorption of the luminescence
probably occurs in lunar fines. However, differences in the
concentration of ’ k i l le r ' centres in the plagioclase may also
exist.
Garlick and Lamb^’ ^ have found that heating lunar
fines to a temperature of 760°C in argon caused a change in
colour from dark grey to brown. Dr. Steigmann has ascribed the
change to a chemical dissociation of ilmenite into haematite and
ru t ile on the evidence of X-ray powder photographs. However, such
a reaction requires a supply of oxygen and it is not yet certain
whether this occurs as an impurity in the argon or is supplied
by the s ilica te environment.
The luminescence spectrum of such a heat treated sample
is shown in Fig* 39 • The luminescence efficiency is more than
doubled and the 5600l emission peak is shifted to longer wavelength.
It is noteworthy that the albedo of th is sample is also nearly
doubled with respect to the virgin sample. Therefore, both the
increase in efficiency and the spectral shift may simply be due to
changes in the self-absorption and the absorption spectrum of the
material* In fact, the changes in luminescence properties are
consistent with the change in the d iffuse reflectiv ity spectrum as
determined by Garlick and Lamb. Heating the altered sample to
higher temperatures (960°C) causes the colour to become darker again*
Garlick and Lamb noted that the diffuse re flectiv ity spectrum tended
to become more nearly like that of the in it ia l virgin sample and
that it s overall re flectiv ity or albedo was also reduced* Again
we have a correlation with the luminescence efficiency and spectrum
since the efficiency of a sample heated to 960°C is intermediate

97
between that of the virgin sample and the 760°C heated sample
and the 560C)X emission peak is shifted back towards its o rig ina l
position (see Fig. 39 )• Thus i t does not appear necessary to
invoke a change in the luminescence properties of the plagioclase.
Two sets of fines from the core tube 10004 were
availablet each set consisting of 5 x 25 mg samples from d ifferen t
depths (top to 13 cm below the surface). It was thought that
the luminescence efficiency may increase with depth i f the layers
nearer the surface had been radiation damaged to a greater degree
than those at deeper levels. However, no consistent variation was
found, and the slight differences between various samples were
probably due to variation in the plagioclase content particu larly
in view of the small sample size. Thus, i t is concluded that
radiation damage, i f present, is roughly the same at a l l depths
down to about 13 cm. The decrease of luminescence efficiency
with time of irradiation for lunar fines was, in general, s ligh tly
less rapid than for basalt BCR 1 samples and although i t is tempting
to use this fact as evidence for previous radiation damage of lunar
fines, it may equally well simply reflect the fact that the
plagioclases are somewhat different.
Lunar fines obtained by the Apollo 12 mission show a
greater variety than those returned by the previous mission.
However, the proton-excited luminescence spectra are remarkably
similar (see F ig . 42 ) . Sample 12070 is only marginally lighter
in colour than 10064-6 samples and it s luminescence efficiency is
very similar* Nevertheless, samplss 12032 and 12033 are considerably
lighter in colour than Apollo 11 fines and although these show a
similar luminescence spectrum to 10064-6 samples, the luminescence
efficiency is considerably greater. Once more, a correlation ex ists
98.
between luminescence efficiency and sample albedo. Sample
12033 which has the highest albedo also has the highest
luminescence efficiency which is an order of magnitude higher
than 10084-6 samples. It is , of course, true that the reason
for the higher albedo is an increase in the proportion of
plagioclase present ( ^ 7 5 % for 12033) and, possibly a reduction
in the proportion of ilmenite. However, whilst the plagioclase
content of 12033 is higher by a factor of five as compared with
Apollo 11 fines the luminescence efficiency is higher by a factor
of ten. No prominent infra-red emission peak has been found for
any of the Apollo 12 fines.
1.2 Luminescence spectra of lunar rocks and breccias.
The proton-excited emission spectra of two rock chips
(10058-37 and 10057-54) have been determined and are shown in
Fig. 40 • The former sample was a coarse-grained gabbro-like
rock with large chunks of plagioclase in a matrix of pyroxene
and ilmenite. The 5600X peak was more prominent fo r this sample
than for the fines and the luminescence efficiency was considerably
higher than for 10064 fines. Sample 10067-54 showed appreciable
emission only from it s small white inclusions. The 5600& peak
was less pronounced fo r this sample and the luminescence efficiency
and spectrum as a whole was more nearly like that of the 10064
fines. Some breccias contained small inclusions of cristobalite
(a form of s i l ic a ) which also gave a bluish white luminescence.
The most interesting sample was a separated light
fraction ( 9306 plagioclase) from rock 10044-43 which was kindly
loaned to us by Prof. Zussman. The proton-excited luminescence
spectrum of this sample showed a strong 5600A peak and the

99
efficiency was estimated to be of the order of 10 . Infra-red
scans of this sample revealed that although there was no strong
I.R» emission peak, a weak I.R . emission band was apparent with a
discernable maximum intensity at about 7700 A (see Fig. 43 ) ,
Sippel and Spencer have fa iled to detect an I.R . emission peak in
lunar plagioclases although they found that a set of 20 te rrestria l
plagioclases a ll exhibited such an emission band110.
In conclusion, therefore, it appears that although lunar
plagioclases do not exhibit the strong infra-red emission band
characteristic of most terrestria l samples, I.R . emission is present
but much less intense than the blue and green emissions.
2. Luminescence spectra of terrestria l plagioclases.
For comparison with lunar plagioclase, the luminescence
spectra o f a number of terrestria l samples of pure plagioclase
were determined. These samples were kindly supplied by
Prof. G .F.J. Garlick of Hull University and Dr. J . Esson of the
Geology Department of Manchester University. The emission spectra
were determined both in the visib le and near infra-red region of
the spectrum and are shown in Figs. 4 l , 4 3 * 4 4 •
OA ll samples show a prominent peak at around 5600 A besides
showing some emission in the blue region. Most samples exhibit an
infra-red emission band which is often the most intense of the
three emission bands. However, the absence of a prominent I.R .
emission peak is not peculiar to lunar plagioclases as was suggested
by Sippel and Spencer110. A sample of labrsdorite/bytownite©
(F ig . 43 ) does not show a discernable I.R . peak although the 5600 A
peak has a shoulder on the long wavelength side and is considerably
broadened. It is also noteworthy that the luminescence spectra of
•3

100,
meteorites in which plagioclase is the major luminescent
component ( i . e . bronzite and hypersthene chondrites and pyroxene-
plagioclase achondrites) do not show a strong I.R . emission peak.
The spectrum of Juvinas (a pyroxene-plagioclase achondrite) shows
no discernable I.R . emission peak (see Fig. 43) although the 5600 A
emission peak is again prominent. Occasionally, as in the
te rres tr ia l o ligoclase sample examined, the I.R . emission band and
the 5600 A band are of similar in tensities (see F ig . 41),
X-ray fluorescence analysis of a number o f plagiocleses
carried out by Dr. J. Esson in the Geology Department showed that
a ll plagioclases examined contained more than 100 ppm Mn. The
separated plagioclase from lunar rock 10044-43 had an estimated
Mn content of about 200 ppm which was about the average fo r the
te rres tr ia l samples investigated. The actual manganese contents
of particular samples where determined are given in the captions to
Figs. 41 and 43. Whilst there was some evidence both experimental
and theoretica l (as w il l be discussed la ter) which suggested that
the 5600 A emission peak might be due to Mn substituting in a
metal cation s ite , i t was not conclusive. In order to test this
p oss ib ility , a natural sample of a typical plagioclase ( labradorit.e)
was, therefore, doped with manganese in Prof, G arlick 's laboratory
by heating the sample to 1050°C fo r 30 mins in argon with 0.1#
hydrated manganese sulphate. A sim ilar undoped sample was given
the same heat treatment in order to chetk whether the luminescence
spectrum was affected by heat treatment alonf. The proton-
excited luminescence spectra of these treated samples are shown
in F ig. 44. I t is evident that the addition of manganese enhances
the green-yellow emission band considerably whilst at the same
time reducing the intensity of the blue and infra-red emission

Fig» 39 Proton-excited luminescence spectra of lunar fines
10004-6 before and after heat treatment»
1• Virgin sample»
2» After heating to 760°C in argon»
3. After heating to 960°C in argon.
The intensity scale is the same for a ll three curves*
Fig» 40 Luminescence spectra of lunar rocks» 10058.37
(coarse-grained with large plagioclase crystals)»
and 10057.54 (fine-grained with only occasional
plagioclase crystals).
The intensity scale for 10058.37 is about 50 x
that for 10057.54.
Fig. 41 Luminescence spectra of a pure sample of oligoclaaa
(Mn content 140 ppm)» and of a typical sample of
basalt BCR.1*
The intensity scale for oligoclaae is about 3 x
that for the basalt.
rela
tive
in
tens
ity

Fig« 42 Comparison of proton-excited luminescence spectra
of lunar fines from Apollo 11 and 12 missions*
Fig* 43 Luminescence spectra of a separated plagioclase
fraction from lunar rock 10044-43 (Mn content 200 ppm),
of a terrestria l labradorite bytownite (Mn content
500 ppm) and of the meteorite Juvines (a plagioclase-
pyroxene achondrite).
Fig* 44 The luminescence spectrum of a labradorite!
1* Natural sample*
2* After doping with 0.1# Mn.re
lati
ve
inte
nsi
ty
4 9

101.
bands. Heating the labradorite to 1050°C without added manganese
does not a ffect the emission spectrum appreciably, although such
heating probably causes a structural change from the low temperature
anorthite form to the high temperature form. In the la tter form
'•U- 4+the structure becomes less ordered and the A1 and Si ions no
longer occur in alternate tetrahedra as in the low temperature form
described in Ch. 1 Section 1.3.
I t might be expected that the intensity of the green-
yellow emission band would give a measure of manganese content in
plagioclases. However, the emission spectra of the natural plagioclases
examined do not show a simple correlation between the intensity of
2+the Mn' emission and manganese content as measured by X-ray
fluorescence analysis. However, this type of analysis measures total
manganese and not the amount of manganese in metal cation sites which
is what is important. Moreover, d ifferen t plagioclases contain
d ifferin g amounts o f "k il le r s " such as iron which probably a ffec t
2+the intensity of the Mn emission. In this context i t is worth
2+ 2+recalling the e f fe c t of small amounts of ^e on the Mn emission
in enstatites and fo rs te r ites (Ch. 3 Section 3.3 ).
2+The peak of the Mn emission band varies a l i t t le in
position from sample to sample but usually lie s in the range 5550 -
5650 A. The band has a half-width of about 1000 A but is not
symmetrical! the intensity fa l ls less steeply on the long wavelength
side.of the peak (c f Zn2Si04 t Mn).
9
3. Discussion.
2+3.1 The Mn ' emission.
Almost a l l plagioclases exhibit a green-yellow emission band
110although Sippel and Spencer have noted that pure albitee do not

102
appear to show such an emission peak. These authors, therefore,
conclude that this emission peak is caused by a divalent activator
substituting for Ca in the la tt ic e . Results presented in the
previous section seem consistent with Mn being the divalent
activator responsible for the green-yellow emission band. On account
of the charge compensation and ionic size i t might be expected that
Mn2+ would replace Ca2+ in the la ttic e as i t does in CaF2 t Mn123,
124 125 25CaO t Mn , CaSiO^ i Mn , CaCO J Mn' and the manganese-activated
calcium halophosphates"'2^. The colour of the Mn2+ emission in
these phosphors varies from green to orange-red.
In the low temperature form of anorthite ('low* anorthite)
there are four possible calcium sites of s ligh tly d ifferin g symmetry
and average metal-oxygen distances as mentioned in Ch. 1 Section 1,3.
A ll four are seven-fold co-ordinated i f metal-oxygen distances up to 0
3.1 A are counted although one approximates to six-fold co-ordination.
127More recently, Megaw et al have determined the structure of
bytownite and found that the calcium environment is changed very l i t t l e
by the introduction of a certain amount of sodium into the structure.
2+The environment of Ca in the anorthite structure w ill , therefore,
be discussed as being applicable to calcium-rich plagioclases in
21general. Bond lengths are given by Kempster et al who describe
the site symmetries as distorted cubes with one corner missing (o r
two corners missing for the approximately s ix -fo ld co-ordinated s ite )i
four of the bonds approximate closely to cube-corner directions
although the sites are, in general, of low symmetry. The range of
Ca - 0 bond lengths in A for the four sites are as followai-
C1 l 2.28 - 3.09 t average 2.54
(s ix -fo ld approx. 2.28 - 2.62 i average 2.45)
C2 l 2.32 - 2.81 i average 2.54

Cg t 2.35 - 2.72 s average 2.50
i 2.34 - 2.82 i average 2.50
2+I t is not clear whether Mn w ill have a preference fo r any
2+particular s ite since Mn has zero CFSE and a ll s ites are more
than big enough to accommodate th is ion. Since the magnitude o f A has not been determined fo r any transition metal substituting in a
calcium s ite , i t is d if f ic u lt to predict the wavelength of emission
of Mn2+ in these s ites. A might be expected to be somewhat
smaller than fo r a cubic co-ordination with a sim ilar average
metal-oxygen distance and, therefore, possibly 20 - 3<$ smaller than
for the corresponding octahedral case.
In it ia l ly , a comparison o f the wavelength of emission
and average metal-oxygen distance w il l be made with CaO t Mn and
CaSiOg i Mn. In CaO t Mn the wavelength o f the emission peak is
about 5900 X, and its structure is o f the NaCl type ( i . e simple face-
2+centred cubic). The Ca ion is , therefore, in octahedral co-ordination
and the Ca - 0 bond length is 2.40 X128. It might, therefore, ba
expected that the wavelength of emission in anorthite would be
considerably less than 5900 A. In the pyroxenoid ^l-CaSiOg t Mn
( |2>-wollastonite) the wavelength of the emission peak is about 6200 A
*129and the average metal-oxygen distance is 2.39 A • There are three
slightly d ifferent calcium sites of distorted octahedral symmetry13<'>l131 •
In * -CaSi03 i Mn (pseudo-or-oC - wollastonite) the wavelength of
emission is about 5600 A, which suggests a much reduced crystal f ie ld ,
but unfortunately a detailed structure with bond lengths has not yet4
been determined. In (b -wollastonite a splitting of the T level
would be expected owing to the distortion from octahedral symmetry
2+and this factor may be the reason why the Mn emission occurs at
longer wavelength than in CaO i Mn (c f . Mn24 in forsterite and
103.

104
enstatite Ch. 3 Section 7.1) although differences in Stokes shift
may also occur.
2 *Since the possible Mn sites in anorthite are of low
symmetry, considerable sp litting of the 4T1g level is again likely .
Thus we have the factors of large average metal-oxygen distance and
a crystal fie ld of lower intensity than for cubic co-ordination,
tending to suggest a low value of A and, therefore, short
wavelength (possibly green) emission whereas the splitting of the4
level is tending to sh ift the emission wavelength towards the
red. In view of these factors it seems reasonable to expect the
emission somewhere in the region 5500 - 6000 A.
Apart from possible differences in Stokes shift between
the emissions in the phosphors compared, differences in the nature
of the ligands have not been considered. Whilst a l l ligands are
oxygens they are not a ll equivalent and this factor can appreciably
affect the value of A as noted earlier (Ch. 3. Section 7 .1 ).
The study of the absorption and emission bands due to
2+Mn in various silicates warrant» further attention particularly
now that many refined structural analyses are available giving
detailed descriptions of the metal cation environments. An interesting
possibility for further detailed study is the monoclinic pyroxene,
132 2+diopside, CaMgSijOg. According to E.S.R. measurements , Mn ions
substitute in both calcium and magnesium sites with a slight
preference for the calcium site , thus two d ifferent emission bands
2+due to Mn ions should be evident.

105
3.2 The blue and infra-red emission bands.
A ll plagioclases show at least some blue emission as
do iron-free enstatites, forsterites and many other s ilicates .
The emission band is broad and somewhat variable in the position
of the peak. I t is likely that such emission bands have a
similar origin in most relative ly iron-free silicates and, as
indicated ea r lie r , probably arise from a particular type of lattice
defect. Sippel and Spencer have found that some heavily shocked
plagioclases and s ilica mineral phases show an enhanced blue
emission, which again suggests that lattice defects may be
responsible for th is emission. However, the precise nature of the
centre cannot be ascertained without further detailed investigation.
Most plagioclases show a prominent emission band in the
near infra-red although lunar and meteoritic plagioclases do not
show such a pronounced band. Indeed, in some plagioclases this
emission band is either very weak or absent altogether (see Fig. 43).
The position of the emission peak is variable ranging from about
7300 l to 7700 A and is usually quite broad, being generally much
2+broader than the Mn emission band. The I.R. band is often the
dominant one as in the labradorite examined, and it does not appear
to be associated with manganese since the addition of manganese
reduces its intensity. I f this emission is due to an impurity
activator then it should be possible by selective doping with
suspected activators to determine the nature of the impurity. The
activator should be present naturally in amounts not less than
about 100 ppm. Since most plagioclases contain iron as an impurity
in quantities up to 1# and since Fe often gives rise to absorption
bands in the near infra-red in s ilicates , this ion might be thought
to be a possible activator, although Fe more usually constitutes

a ' k i l l e r * c e n tr e when p re s e n t in s i l i c a t e s
Preliminary investigation of the spectrum of
labradorite, after heating to 1050°C in argon with 0.1% hydrated
ferrous sulfílate, did not reveal any enhancement of the infra-red
emission band re lative to the natural sample. In fact, there
appeared to be a slight reduction in intensity of this emission.
There remains, therefore, much more work to be done on selective
doping and comparison of analyses of different plagioclases before
any conclusions can be reached concerning the nature of the
infra-red emission centre.


107
1. The Electrostatic Getter-Ion ("Orbitron") Pump»
1.1 Operating principles and design.
Sputter-Ion pumps of various types have been commercially
available (AEI, Mullard, Ferranti, etc .) fo r several years and
fu ll descriptions of the structure and action of these pumps can
be found in recent books on UHV (e .g . Redhead et a l87 and Power88) .
The advantages of such pumps over conventional diffusion pumps
are many. Pressures of less than 10”^ torr are easily attainable
without trapping and pressures of less than 10" ^ torr are
achievable in good UHV systems. Backing pumps are not required
once the ion pump is operative and the pumping system does not
employ either o i l or mercury and, therefore, the vacuum system is
free from contamination by such materials.
However, sputter-ion pumps do have certain disadvantages.
The confinement of the ions is usually by a magnetic fie ld and thus
fo r large pumps large magnets are required and hence such pumps
may not be suitable for use on particle accelerators, electron
microscopes or any application where stray magnetic fie ld s are
undesirable. Pumping speeds fo r inert gases are also low compared
with speeds for active gases. In order to achieve high pumping
speeds, m ulti-cellu lar devices must be used and the overall size
and weight of the pump becomes large. Sputter-ion pumps also suffer
from "memory” effects on account of the fact that pumping occurs on
the same surface on trtiieh sputtering occurs.
Many o f these disadvantages are overcome by the
89 90electrostatic getter-ion pump ' • The structure is basically
very simple (see Fig. 45 ) and by using electrostatic instead of
magnetic confinement comparatively largo pumping speeds can be
obtained with compact size - e .g . an "orbitron" pump of 2” diameter
108.
has a pumping speed fo r nitrogen of the order of 100 1/sec*
The pump operates by the injection of electrons from
a tungsten filament into the electrostatic fie ld between two
co-axial cylinders. The outer cylinder is the wall of the tube;
the inner is a ^16 " diameter tungsten rod which is the anode.
Anode potential is usually a few kilovolts positive with respect
to the pump wall for pumps up to about 4" diameter. The electrons
91go into orbits known as Kingdon orbits about the central anode
producing ionisation of the residual gas. Eventually the electrons
bombard a cylindrical titanium slug of about diameter which is
carried on the anode. This causes the titanium to become white
hot and sublime onto the walls of the pump thereby "gettering"
the active gases. Inert gases are pumped by ionisation and
physical burial of the inert gas ions on the wall of the pump by
titanium. The inert gas pumping speed is determined by the amount
of ionisation caused by orbiting electrons and by the "sticking
probability" of the inert gas ions with respect to the wall of the
92pump. Kornelsen has shown that the sticking probability of inert
gas ions on tungsten is in the range 0.2 - 0.6 for incident energies
of around 1 KeV. However, sticking probabilities fa l l drastically
at lower energies - e .g . argon ions have a sticking probability on
-3tungsten of about 10 at 100 eV. Navertheless, it appears that
the sticking probability of inert gee ions on stainless steel
approach unity at energies sligh tly less than 1 KeV. Now in the
"orbitron" pump, inert gas ions which are not produced cloae to
the anode w ill have re lative ly low energy on reaching the wall of
the pump and are unlikely to stick to i t . Therefore, in order
that a ll inert gas ions reach the wall with energies not less than
about 1 KeV, Croas^3 has suggested that a grid at a potential of

109
about 1 KeV be placed close to the w all* This simple modification
was found to increase the argon pumping speed considerably.
94B ills has suggested a m ulti-ce llu lar design of
electrostatic getter-ion pump which separates the ionisation
function of the electrons from the heating of the titaniun. The
latter function is replaced by resistive heating leaving the
electrons merely to provide ionisation. This means that the anode
does not carry a titanium slug and, therefore, the electrons w ill
traverse a longer path before reaching the anode thus increasing
ionisation. Four "orbitron" ce lls of anode, grid and filament
are arranged around a central evaporator of resistive ly heated
titanium. The cylindrical grids around each anode are maintained
at a potential of a few hundred volts with respect to the pump wall
(cathode) so that the sticking probability of inert gas ions on
the wall is near unity. Improved performance is , therefore,
obtained at the expense of simplicity in design. An additional
advantage of the B ills pump is that when pumping at low pressures
i t is possible to decrease the titanium sublimation rate without
decreasing the ionisation rate upon which the inert gas pumping
speed depends. Thus i t is more economical on titanium.
1»2 Testing of a prototype.
89Using the experience of Herb et a l , a 2" diameter
orbitron pump was designed with the help o f Dr. J. Cross, formerly
of this Department, and made by a local engineering firm (P .S .I . L td .).
The simplest possible design was used in order to be tested as a
prototype. A right angle bend was incorporated in the pump body
between the pump its e lf and i t s flange in order to prevent titanium
reaching the system being pumped and also to reduce the amount of

110.
light entering the system from the pump. O riginally, the pump was
air-cooled using a fan but later the pumping efficiency was found
to be increased by using water cooling.
The optimum filament position has been found experimentally
89by Herb et al • Herb suggested that the filament support be
placed between the anode and the filament in order to reduce the
number of electrons travelling d irectly to the anode. Straight
filaments of .006" diameter and about in length were used
paralle l to the anode and positioned about £ " from the anode.
The pump has two such filaments although only one is used during
( operation^ the other is a standby in case the filament should break
or burn out unexpectedly during pumping. A hairpin filament support
wire of stainless steel was used. The tungsten anode was about 4"
in length (measured from the filament position) and carried a
diameter, £" long titanium slug positioned about half-way along its
length.
In order to start the pump for the f ir s t time the pressure
-3had to be reduced to less than 10 to rr by the roughing pumps and
1 the emission current of electrons from the filament kept low. Using
a large emission current (above about 5 mA) in it ia lly caused the
anode to be rapidly heated causing rapid out-gassing and thereby
raising the pressure in the system. A balance had to be achieved
within the pump so that eventually the rate of pumping exceeded the
/ ofrate'the out-gassing. This, in adverse circumstances, took a few
hours to achieve. Once the pump had been in fu ll operation and
( thoroughly outgassed by increasing the emission current in stages
it proved advisable to keep the pump under a good vacuum when not
in operation. This was achieved by an isolation valve of bore equal
to the pump throat diameter between the pump and the system.

111.
Allowing the pump to be let us to atmospheric pressure along
with the system meant that at least some outgassing of the anode
would again be necessary before the pump became fu lly operative.
Accidental flooding of the pump with gas whilst in operation also
had a very deleterious effect on its performance and several hours
of careful outgassing would then be necessary to nurse the pump
back to maximum performance. However, i f the pump had been kept
at high vacuum when not in operation, i t could be switched on whilst
s t i l l isolated from the system and then introduced when the pressure
-3of the system reached about 5 . 10 to rr. The orbitron pump
would then immediately pump the system and the roughing pumps could
be isolated.
It was also noticed that the orbitron pump would continue
to pump for some time after it s power supplies had been switched o ff .
This effect is presumably due to adsorption of residual gas by the*
anode on cooling, particularly by the titanium.
89 90From the work of Herb et a l and Douglas et al the
pumping speed for active gases varies approximately as the square
of the pump diameter ( i . e . it is proportional to throat conductance),
-5and varies l i t t le with pressure below 10 torr. Therefore, for a
2" pump a pumping speed for nitrogen of around 100 1/sec would be
expected. From tests carried out the present pump appears to have
a pumping speed of this order. Tests were also carried out on a
2^" diameter triode pump in which the grid was mounted from
the pump wall. This pump was designed by Dr. Croat for Applied
Research & Engineering Ltd. using the experience gained by Dr. Croat
and the author in testing prototypes. It haa a considerably
improved argon pumping speed compared with the diode pump but
otherwise its characteristics are similar.

*
Fig» 45 Cross-sectional diagram of the electrostatic
getter-ion ('o rb itron ') pump tested and used in this
work»
Fig* 46 Power supply circuit for the above pump with adjustable
latching relay trip and voltage bias fa c ilit ie s for
filament and grid*

112.
1.3 Materials and Maintenance.
The l i fe of a tungsten filament is rather unpredictable
but depends on such factors as the temperature at which i t is run.
Filaments almost invariably break in the centre where the possibility
of heat dissipation to the support i s a minimum and often blow as
the current is switched on. Mechanical shock may also cause rupture
since tungsten becomes very b rittle a fte r being heated to white
heat. Filament l i fe can be improved by using tungsten-rhenium
wire instead of pure tungsten. The filaments are spot-welded to
their supports and are easily replaced on removal of the pump head
although this means that the pump has to be opened to the a ir .
The l i fe of the anode obviously depends on how quickly
the titanium is evaporated and, therefore, on the level of emission
current used. Strictly speaking, i t depends on the power absorbed
by the titanium. I f the pump was used continuously to keep a
reasonably leak-free system under high vacuum, a fa ir ly low emission
current would suffice and the anode would probably last for several
weeks. I f , however, the pump is used fo r frequent re-evacuation
as is usual its pumping l i fe w ill be considerably less. For the
application fo r which the pump was used here, i .e . frequent
re-evacuation plus pumping on a hydrogen leak for long periods, its
pumping l i fe may be no more than about a hundred hours.
The tungsten anode, like the filaments, becomes very
b ritt le and i f the filaments should need replacement before the
anode, it would almost certainly shatter on removal of the pump
head. This problem can be overcome by using a tungsten-molybdenum
alloy anode which does not become so b r it t le on heating. Pure
molybdenum anodes were also tried but were unsatisfactory owing to

113.
violent spasmodic outgassing during the outgassing procedure which
caused flash-over between the anode and the filament supports. An
anode rod cannot normally be re-used since remnants of the titanium
slug remain welded to i t .
A fter two or three anode slugs have been evaporated onto
the pump wall a layer of titanium has built up on the wall which may
begin to flake causing a noticeable deterioration in performance.
The most successful way of removing this layer is by submerging the
pump body in a bath of 5# hydrofluoric acid in dilute n itric acid
and then thoroughly washing in water. Great care is necessary in
the use of hydrofluoric acid which should never come into contact
with the skin. The operation should be carried out in a fume chamber.
1.4 Power Supplies.
The basic requirement for a 2" or 2^" diameter pump is a
D.C. supply of about 3 to 5 KV capable of giving a current of up to
40 mA. Good smoothing and stabilization are not essential and|
therefore, the c ircu it can be simple. A voltage doubling circuit
was used as shown in Fig. 46 . An auxiliary A.C. supply is
necessary for the filament which requires a current of up to 4 amps.
This is provided by a 0 - 6V variable supply (unstabilized ). The
total ion current is controlled by the emission from the filament
which of course depends on its temperature. The temperature is in
turn a function of the current passing through i t and is , therefore,
controlled by the voltage across the filament.
I f the pressure in the pump accidentally rises to greater
than 10 '2 torr a gas plasma may strike and the ion current would
then rise alarmingly. A current trip in the H.T. supply is , therefore,
essential. A thermal trip can be used but operation is rather slow
and, therefore, a latching relay trip is preferred.

114
A voltage bias fo r the grid of a triode pump is
obtained by allowing the anode current to pass through a high
wattage resistor to earth. A smaller adjustable voltage bias
( 100V) for the filament and termination plate is obtained in a
similar fashion. The position on the titanium slug or anode
which becomes hottest due to electron bombardment can be adjusted
to some extent by putting such a voltage bias on the filament.

REFERENCES
1. Geake, J .E ., Llpson, H» and Lumb, M.D., Proc. IAU Symposium
14 (1960).
2« Geake, J.E. and Lumb, M.D., Technical note No.1 USAF contract
AF61 (052) - 379 (1963).
3. Lumb, M.D., PhD thesis, University of Manchester (1964),
4. Derham, C.J. and Geake, J.E ., Technical note No.2 USAF contract
AF61 (052) - 379 (1963).
5. Derham, C .J ., and Geake, J.E ., Nature 201. 62 (1964).
6. Derham, C .J ., Geake, J.E. and Walker, G ., Nature 203, 134 (1964).
7. Geake, J.E. and Walker, G ., Proc. Roy. Soc. 296, 337 (1967).
(Discussion meeting on "Physics of the Moon", June 1965)
8. Geake, J.E. and Walker, G ., Geochim. Cosmochim. Acta 30, 929
(1966)
9. Geake, J .E ., James, R. and Walker, G ., Geochim. Cosmochim. Acta,
to be published.
10. Geake, J .E ., Dollfus, A., Carlick, G .F .J ., Lamb, W., Walker, G .,
Steigmann, G .A ., and Titulaer, C ., Science 167. 717 (1970).
11. Geake, J .E ., Dollfus, A», Garlick, G .F .J ., Lamb, W., Walker, G .,
Steigmann, G .A ., and Titulaer, C., Geochim. Cosmochim. Acta,
Supplement I , 2127 (1970). (Proceedings of the Apollo 11 Lunar
Science Conference).
12. Read, H.H., Rutley's Elements of Mineralogy, 25th edition,
Murby, (1962) Ch. 4.
13. Verhoogen, J . , Amer. Mineral. 43, 532.
14. Burns, R.G., Mineralogical Applications of Crystal Field Theory.
C.U.P. (1970) (a ) p. 82 (b ) p. 90 (c ) p. 92
(d ) p. 120 (e ) p. 117 ( f ) p. 122.
13. Hanke, K., Beitr. Mineral. Petrol. 533 (1965).
16. Mason, B., Meteorites, Wiley (1962). (a ) p. 72 (b ) Ch. 4
(c ) p. 108 (d ) p. 91
17. Ghose, S ., Zeit. Krist. 122, 81 (1965).
18. Burnham, C.W., Ann. Rept. Geophys. Lab. Yearbook 65, 285 (1966)
19. Zussman, J ,, Earth-Sci. Rev. 4, 39 (1968).
20. Ferguson, R.B., T ra ill , R.J. and Taylor, W.H., Acta Cryst. 11_,
331 (1958).
21. Kempster, C .J .E ., Megaw, Helen, D., and Radoslovich, E.W.,
Acta Cryst. 15, 1017 (1962).
22. Hey, M.H., and Prior, G .T., Catalogue of Meteorites, 3rd edition,
British Museum (1966).
23. Curie, D., Luminescence in Crystals, Methuen (1963)
(a ) Ch. 1 (b ) p. 148 (c ) p. 204
(d ) p. 129 (e ) p. 227 (g ) p. 302
(h ) p. 310
24. Garlick, G .F .J ., Sci. Prog. 52, 3 (1964).
25. Medlin, W.L., Thermoluminescence of Geological Materials,
(ed . McDougall), Ch. 4.1, Academic Press (1968).
26. Wise, M.E., and Klasens, H.A., J. Opt. Soc. Am. 38, 226 (1948).
27. Hoogenstraaten, W., J. Electrochem. Soc. 100, 356 (1953).
28. Hoogenstraaten, W., Philips Res. Rep. 1_3, 513 (1958).
29. Reynolds, M.L. and Garlick, G .F.J., I.R. Phys. 7, 151 (1967).
30. Orgel, L ., Introduction to Transition-Metal Chemistry: Ligand
Field Theory, 2nd edition, Methuen (1966).
31. Bancroft, G.M., Burns, R.G., and Howie, R.A., Nature 213.
1221 (1967).
32. Owen, J ., and Thornley, J.H.M., Rep. Prog. Phys. XXIX, 675 (1966).
33. Cotton, F.A., Chemical Applications of Group Theory, Ch. 8,
Interscience (1963).
34. McClure, D .S., Solid State Phye. 2: 399 (1959).

35. Fonda, G.R., J. Opt. Soc. Am. 47, 877 (1957),
36. Palumbo, D.T. and Brown, J .J ., J. Electrochem. Soc. 117.
1184 (1970).
37. Garlick, G .F .J ., Luminescence of Inorganic Solids (ed. Goldberg)
Ch. 12, Academie Press (1966).
38. Ehrenberg, W., and Franks, J ., Proc. Phys. Soc. B66, 1057 (1953).
39. Birks, J .B ., Theory and Practice of Scintillation Counting,
Ch. 6 and 11, Pergamon Press (1964),
40. B ril, A., and Klasens, H .A., Philips Res. Rep. 7, 401 (1952).
41. Hanle, W. and Rau, K.H., Z. Physik 133, 297 (1952).
42. Brooks, F .D., Prog. Nucl. Phys. 5, 284 (1956).
43. Van Wijngaarden, A., Bradley, D.J. and Finney, N.M.A.,
Can. J. Phys. 43, 2180 (1965).
44. Lindhard, J. and Scharff, M., Phys. Rev. 124. 128 (1961).
45. Lindhard, J ., Nielsen, V,, Scharff, M. and Thomsen, P .V .,
Kgl. Danske. Videnskab. Selskab. Mat. - Fys. Medd. 33,
10 (1963).
46. Martin, D.G., Sci. Prog. 54, 209 (1966).
47. Brinkman, J .A ., J. App. Phys. 25, 961 (1964),
48. Birks, J.B. and Black, F.A., Proc. Phys. Soc. A64, 511 (1951).
49. G ilfr ich , H.P., Z. Physik 145, 241 (1956).
50. Martin, W., Z. Physik 147, 582 (1957).
51. Van Wijngaarden, A. and Hastings, L., Can. J. Phys. 45, 3803
(1967).
52. Hastings, L. and Van Wijngaarden, A., Can. J. Phys. 45, 4039
(1967).
53. Young, J.R., J. App. Phys. 26, 1302 (1955).
54. Grassèr, R. and Scharmann, A., Z . Naturforsch. 16a, 10 (1961).
• Randall, J.T. and Wilkins, M.H.F., Proc. Roy. Soc. A184, 366
(1945).
55

56. Garlick, G.F.J. and Gibaon, A.F#, Proc. Phya. Soc. 60, 574
(1948).
57. Bräunlich, P ., Thermoluminescence of Geological Materiale
(ed . McDougall), Ch. 2.5 Academie Press (1968)
58. Unger, K., Abh. Deutsch. Akad. Wiss., 7, 170 (i960 ).
59. Grossweiner, L .J ., J. App. Phys. 24, 1306 (1953).
60. Booth, A.H., Can. J. Chem. 32, 214 (1954).
61. Middlehurst, B.M. and Burley, J.M., NASA Rep. X - 641-66-178
(1966).
62. Greenacre, J .A ., Sky & Telescope 26, 316 (1963).
63. Kopal, Z. and Rackham, T.W., Icarus 2, 481 (1963)., and
Nature 201, 239 (1964).
64. Righini, A., and R igutti, M., Icarus 5, 258 (1966).
65. Middlehurst, B.M., Nature, 209, 602 (1966).
66. Link, F ., C.R. Acad. Sei. (P a ris ) 223, 976 (1946)., and
Bull. Centr. Astron. Insts. Czech, 2, 131 (1951)
67. Ney, E .P., Woolf, N.J. and Collins, R .J., J. Geophys. Res. 71.
1787 (1966).
68. Dubois, J. and Link, F ., The Moon 85 (1969).
69. Dubois, J ., L 'Astron., 70, 297 (1956).
70. Kozyrev, N.A., Pub. Crimean Astrophys. Obs. 16, 148 (1956).
71. Grainger, J.F. and Ring, J ., Physics and Astronomy of the Moon
(ed . Kopal) Ch. 10. Academic Press (1962)
72. Nash, D.B., J. Geophys. Res. 71, 2517 (1966).
73. Nash, D.B., and Greer, R.T., Geochim. CosaocMm. Acta.
Supplement I , 2413 (1970).
74. Sidrsn, M., J. Geophys. Res. 16, 5195 (1968).
75. Geake, J .E ., Nature, 204, 866 (1964).

76. Hoyt, H.P., Kardos, J .L ., Miyajima, M., Seitz, M.G., Sun, S.S.,
Walker, R.M«, and Wittels, M.C«, Geochim. Cosmochim. Acta
Supp. I . , 2269 (1970).
77. Dalrymple, G.B., and Doell, R.R., Geochim. Cosmochim. Acta,
Supp. I . , 2081 (1970).
78. Neugebauer, M. and Snyder, C.W., Science 138, 1095 (1962).
79. Beard, D.B., Rep. Prog. Phys. XXX, 409 (1967).
80. Rosenberg, D .L., and Wehner, G.K., J. Geophys. Res. 69, 3307
(1964).
81. Kenknight, C.E., Rosenberg, D.L., and 'Wehner, G.K., J . Geophys.
Res. 72, 3105 (1967).
82. Hapke, B.W., Ann. N.Y. Acad. Sei. 123, 711 (1965).
83. Nash, D.B., J. Geophys. Res. 72, 3089 (1967).
84. Dollfus, A., Physics and Astronomy of the Moon (ed. Kopal)
P. 429, Academic Press (1962).
85. Dollfus, A., and Geake, J.E., C.R. Acad. Sei. Paris 260, 4921
(1965).
86. B on fig lio li, G ., Thermoluminescence of Geological Materials
(td . McDougall). Ch. 3.8. Academic Press (1968).
87. Redhead, P.A., Hobson, J.P. and Kornelsen, E.V., The Physical
Basis of Ultrahigh Vacuum, Chapman & Hall (1968).
88. Power, B.D., High Vacuum Pumping Equipment, Chapman & Hall (1966).
89. Maliakal, J .C ., Limon, P .J ., Arden, E.E. and Herb, R .G ., J. Vac.
Sei. Tech. 1., 54 (1964).
90. Douglas, R.A., Zabritski, J ., and Harb, R.G., Rev. S e i. Instr.
36, 1 (1965).
91. Hooverman, R.H., J. App. Phys. 34, 3505 (1963).
92. Korne1sen, E.V., Can. J. Phys. 4$, 364 (1964).
93. Cross, J ., private communication.

94. B i l ls , D.G., J. Vac. Sci. Tech. 4, 149 (1967).
95. Buddhue, J.D., Am. J. Sci. 239, 839 (1941).
96. Houtermans, F .G., Jaeger, E. Schoen, M. and Stauffer, H.,
Ann. Phys. 20, 283 (1957).
97. Komovsky, G .F., Meteoritika USSR 21, 64 (1961).
98. Reid, A.M., Bunch, T .E ., Cohen, A .J ., and Pollack, S .S .,
Nature 204, 1292 (1964).
99. Reid, A.M., and Cohen, A .J., Geochim. Cosmochim. Acta 31, 661
(1967).
100. Grogler, N., and Liener, A., Thermoluminescence of Geological
Materials (ed. McDougall) Ch. 11.2. Academie Press (1968).
101. Houtermans, F.G. and Liener, A., J. Geophys. Res. jM, 3387 (1966).
102. Liener, A. and Geiss, J ., Thermoluminescence of Geological
Materials (ed. McDougall) Ch. 11.1. Academie Press (1968).
103. Sun, K.H. and Gonzales, J .L ., Nature 212, 23 (1966).
104. Smith, J .V . and Stenstrom, R.C., J. Geol. 73, 627 (1965).
105. Long, J.V .P . and Agrell, S.O., Min. Mag. 34, 318 (1965).
106. Sippel, R.F. and Glover, E.D., Science 150, 1283 (1965).
107. Garlick, G .F .J ., Nature 202, 171 (1964).
106. Fonda, G.R. and Froehlich, H.C., Solid Luminescent Materials,
385, Wiley N,Y, (1948).
109. McDougall, D.J., Thermoluminescence of Geological Materials
(ed. McDougall) Ch. 10.1. Academie Press (1968).
110. Sippel, R.F. and Spencer, A.B., Geochim. Cosmochim. Acta,
Supp. I , 2413 (1970).
111. Schutten, J. and Van Dijk, Th., Nature 2V1.» 470 (1966).
112. Yoder, H.S. and Sahama, Th. G ., Amer. Minerai. 4g, 475 (1957).
113. Garlick, G .F .J ., Handbuch der Physik, 28, Springer (1958),
114. Garlick, G .F .J ., private communication.

115. B la ir , I.M. and Edgington, J .A ., Nature 2T7, 157 (1968).
116. Greer, R.T., Space Science Applications of Solid State
Luminescence Phenomena, Pennsylvania State
University MRL Special Pub. 70 - 101. 49 (1970),
117. Ringwood, A.E., Geochim. Cosmochim. Acta, 20, 1 (i960 ).
118. Herzog, L.F., Marshall, D.J., and Babione, R.F., Space Science
Applications of Solid State Luminescence Phenomena,
Penn. State Univ. MRL Special Pub. 70 - 101, 79
(1970).119. Medlin, W.L., J. Chem. Phys. 32, 943 (1960.
120. Eve, C.F., and Duckworth, H.E., Can. J. Phys. 36, 104 (1958).
121. Flanagan, F .J., Geochim. Cosmochim. Acta 31, 289 (1967).
122. Hapke, B.W., Cohen, A.J., Cassidy, W.A., and Wells, E.N.,
Geochim. Cosmochim. Acta Supp. I , 2199 (1970).
123. Ginther, R .J., J. Electrochem. Soc. 101, 248 (1954),
124. Johnson, P.D., Luminescence of Inorganic Solids (Ed. Goldberg).
Ch. 5 ., Academic Press (1966).
125. Lange, H., and Kressin, G., 2. Physik 142, 380 (1955),
126. Doherty, M. and Harrison, W., B rit. J. App. Phys. Supp. 4,
11 (1954),
127. Megaw, Helen D ., Chandrasekhar, S ., and Fleet, S.G., Acta.
Cryst. 21, 782 (1966).
128. Davey, W.P., Phys. Rev. 21, 213 (1923).
129. Prewitt, C.T., and Peacor, D.R., Am. Mineral. 49, 1527 (1964).
130. Mamedov, Kh. S», and Belov, N.V. Dokl. Akad. Nauk. SSSR 107.
463 (1956).
131. Tolliday, J ., Nature 182, 1013 (1958).
132. Vinokurov, V.M., Zaripov, M.M., and Stepanov, V.G., Soviet Phys.
Solid State (English Trans.) 6, 870 (1964).