Embed Size (px)
Citation preview
Bolzano, Italy
The most advanced
multi-energy station
New Section
GVR in Brussels
The 12th IANGV event
NGV2010 RomaCreating a Revolution in Transport’ was a success
for the industry
Volume 9 #5
Number 102
July 2010


NGV2010 Roma
Info from the International NGV Association
NGVA Europe July Report
Italy: Official opening of the most advanced multi-energy station
News, Products, Technology
Worldwide NGV statistics
4
16
18
21
22
24
26
27
29
31
Pictures from NGV2010 Roma
NGV’s statistics balance
Clean cars are at the core of the EU transport strategy
The Monthly Column of Peter Boisen
July 2010 Gas Vehicles Report2
BRAZILAv. Rio Branco, 131 Sala 1.701CEP: 20040-006 ■ Rio de Janeiro - RJTel: +55 21 8572-1086 / [email protected] ■ www.folhadognv.com
KOREA300-5 ■ Changchon-Ri ■ Namsan-MyunChuncheon-Si ■ Kangwon-Do ■ 200-911 KOREATel. +82 33 260 3419 Fax: +82 33 260 3459E-mail: [email protected]
ARGENTINAUspallata 711 ■ CP 1268 ■ Capital Federal ■ ArgentinaTel./Fax: +54 11 43074559 /5201/ 43006137 E-mail: [email protected]
Visit: www.ngvguide.com - www.ngvgroup.comSubscriptions: [email protected]
Printed: Rigraph S.R.L.• Constitución 4, 28.511 Madrid - España• Tilcara 3.146, Buenos Aires
The GVR: 2010 Journalistic timetable and NGV events
The Gas Ve hi cles Re port is a pu bli ca tion of NGV Com mu ni ca tionsGroup, pu blis hing hou se and fairs-con fe ren ces or ga ni zer:www.ngv group .com. In Eu ro pe, it al so pro du ces the In ter na tio nalNGV Gui de. In Ko rea, Asian NGV Com mu ni ca tions. In Ar gen ti na, theGroup pu blis hes Pren sa Ve hi cu lar, Ar gen ti ne CNG Gui de, maps,books and bro chu res. In Bra zil, it pu blis hes Fol ha do GNV,Bra zi lian NGV Gui de, maps, pos ters, among ot hers. Sig ned ar ti clesare ex clu si ve res pon si bi lity of the aut hors, as well as ad ver ti singcom pa nies and agen cies are res pon si ble for the pu blis hed ads.
PERUAv. Brasil 3222 Oficina 403A Magdalena del MarCP: Lima [email protected]
Member of
Edition Month Deadline Special report Non-European market-placeanalysis
Events with copies massivedistribution
96 January 16 December LNG Argentina – Korea
97 February 15 January Updates of OEM NGVs made in Europe Brazil – Thailand
98 March 12 February Italy: the 1st European marketplace Peru – Indonesia
99 April 12 March Cylinder and vehicle conversion equipment Venezuela – Pakistan
100 May 12 April Celebrating GVR 100 consecutive editions Colombia – China NGV China 2010, May 13-15
101 June 07-may Special edition, NGV2010 Roma, Official Media Partner Global NGV Analysis and Outlook NGV2010, 8-10 June, Rome
102 July 15 June Balance of NGV2010 Roma Exhibition and Conference Ecuador - Armenia
103 August 9 July Outline of the bus market in Europe Dominican Rep. - Malaysia
104 September 13 August The EU and Natural Gas Vehicle Chile - Bangladesh
105 October 13 Sept. Europe: Marketplace and the industry Trinidad&Tobago - UAE
106 November 15 October Gas for transport sector in 2011 according to compressor Bolivia – India NGV India 2010, 24-26 Nov.
107 December 15 November Your marketing tool: 2010 NGV statistics balance Uruguay - Egypt

We have a goal: helping make the world go round in
the right direction.
We lead the way in technologies for environmentally
friendly mobility, producing vehicle components for
alternative fuels, LPG and natural gas.
In more than 50 years in the business our technologies
have helped make LPG and natural gas fuelled vehicles
increasingly popular. Today we continue to open up
new horizons with research into ways of using new
fuels such as hydrogen.
We do all this in 50 countries on all 5 continents,
working with the world’s biggest automotive companies.
We want to maintain our position of prominence on
a rapidly growing market, responding to the
increasingly urgent demand for sustainable
development.
WE MAKE THE WORLD GO ROUND
LANDI RENZO. A KEY PLAYER IN THE WORLD OF SUSTAINABLE MOBILITY.
Alternative mobility
July 2010 Gas Vehicles Report4
English
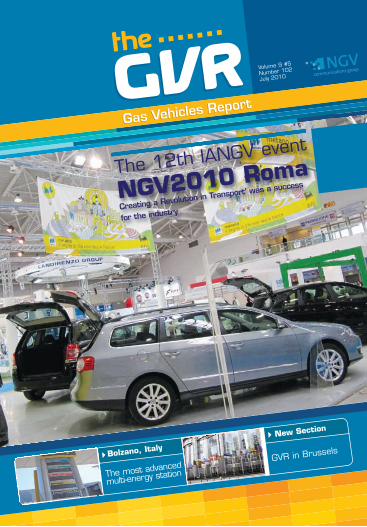
After three days of conferences, poster sessions andexhibitions at the New Rome Fair, the event of the yeardelivered an excellent outcome. Speakers, delegates,exhibitors and visitors from all over the world decided tobe part of this international meeting.
Under the theme “Creating a Revolution in Transport”,NGV2010 Roma, the 12th Conference and Exhibition ofthe IANGV gathered 260 registered delegates and 104companies from 29 different countries, such as Italy,United States, Argentina, Germany, China, Korea, Turkey,among many others.
The three-day IANGV biennial event hosted 2,500 visitors approximately, who walked through the expo hallsof the Nuova Fiera di Roma -it is worth mentioning theirprofessional profile.
On the other hand, the conferences got together top-level speakers and attracted many people at the sessions. They involved 97 presentations, including 72 papers, 13 poster sessions, 7 speaker ceremonies,plus the Italian market sessions.
Regarding the special activities, 400 people among conference delegates and partners' program participants, as well as sponsors and several selectedexhibitors, attended a memorable gala dinner at Castel
Sant’Angelo, as well as 30 people were present at thetechnical tour in the CNG service station Tor Pagnottafrom Atac-Roma.
The event showed a strong international presence, significantly from China, India and Asia-Pacific –whichreflects their respective growth- and Africa, showing itsearly but solid interest in Natural Gas Vehicle.
The next international event in the Old Continent is the2nd NGVA Europe International Show&Workshops, to beheld in Berlin next 7-9 June 2011.More info: [email protected]
NGV2010 Roma
a Gilbarco Veeder-Root, Crompton Close, Basildon, Essex, SS14 3BA, UK p +44 (0)1268 533090 e [email protected] w www.gilbarco.eu/cng
To find out more, contact a Gilbarco Veeder-Root representative:
SK700-II CNG Dispensers
SafeReliable Thanks for
your visit at the IANGV show
Alternative Fuels
The full force of multi-product dispensing!
As a standalone dispenser with single or double column, or uniquely fully integrated with other fuel grades, the new SK700-II CNG is designed for the highest safety and performance.
llseuFFuevveiivttianrrnettelltA slls r visir visit athe IANG
Thanks for
Nsh
anks forour visiyour visit atthe IANGV
SK700-II CNG
The full force of multi-
As a standalone dispenserl f ll
G Dispensers
-product dispensing!
r with single or double column,d h h f l d h
NshowhowoNGV
a peederGilbarco Vp +44 (0)1268 533090 e gi
-Root, Cromp
o find out more, contact a GilTTo
or uniquely fully integratenew SK700-II CNG is desigand performance.
p , ,lb l [email protected] w .g
pton Close, Basildon, Essex, SS14 3BAwwww
-Root representative:eederbarco V
ed with other fuel grades, thegned for the highest safety
lbilbarco.eu/cngA, UK

5July 2010 Gas Vehicles Reportw
ww
.brc
fuel
mak
er.it
Compressors for CNG refuelling

July 2010 Gas Vehicles Report6
NGV2010 RomaItalian
Dopo tre giorni di conferenze, sessioni cartellone edesposizioni alla Nuova Fiera di Roma, i risultati dell'eventodell'anno sono eccellenti. Relatori, delegati, espositori evisitatori provenienti da tutto il mondo hanno deciso diessere parte di questo incontro internazionale.
Sotto il tema “Verso la rivoluzione nel trasporto”,NGV2010 Roma, il 12° congresso ed esposizione dellaIANGV, ha riunito 260 delegati registrati e 104 aziendeprovenienti da 29 paesi diversi, tra cui Italia, Stati Unitid'America, Argentina, Germania, Cina, Corea, Turchia.La biennale di tre giorni della IANGV ha accolto all'incirca2500 visitatori, che hanno visitato in lungo e in largo lahall espositiva della Nuova Fiera di Roma: vale la penasottolineare il loro profilo professionale.
D'altro canto, le conferenze hanno riunito relatori di altolivello e attratto numerosi partecipanti alle sessioni, checomprendevano 97 presentazioni, tra cui 72 paper, 13sessioni cartellone, 7 cerimonie, oltre alle sessioni dedicate al mercato italiano.
Per quanto riguarda le attività speciali, 400 persone tra idelegati e i partecipanti al programma per accompagnatori, nonché gli sponsor e numerosi espositori scelti, hanno partecipato alla memorabile cenadi gala tenutasi al Castel Sant'Angelo. Una trentina dipersone ha inoltre partecipato al tour tecnico presso lastazione di servizio CNG Tor Pagnotta della Atac Roma.
L'evento ha mostrato una forte presenza internazionale,in modo significativo da Cina, India e Asia-Pacifico, datoche riflette la rispettiva crescita di questi paesi, ma puredall'Africa, dimostrando il solido interesse nei confrontidel gas naturale per autotrazione.
Il prossimo evento internazionale in Europa sarà costituito dalla 2a Esposizione e Workshop internazionalidella NGVA Europe, che si terrà a Berlino i prossimi 7-9gugno 2011.Maggiori informazioni: [email protected]

Fornovo Gas S.r.l.Registered Office
Via P.M. Curie, 14
42122 - Reggio Emilia - Italy
Head Office
Via Carbognani, 5
43029 - Traversetolo (PR) - Italy
Tel. +39.0521.842506
Fax +39.0522.550112
stu
dio
com
un
ico
.co
mo
mu
nu
dio
cst
July 2010 Gas Vehicles Report8
German
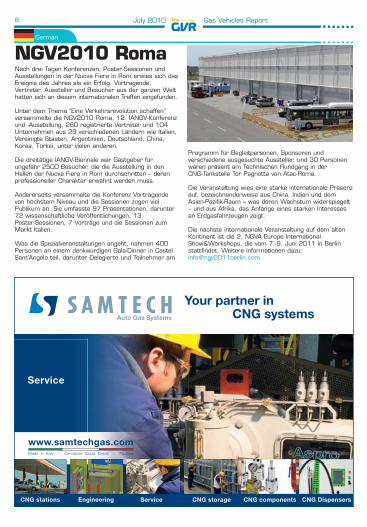
NGV2010 RomaNach drei Tagen Konferenzen, Poster-Sessionen undAusstellungen in der Nuova Fiera in Rom erwies sich dasEreignis des Jahres als ein Erfolg. Vortragende,Vertreter, Aussteller und Besucher aus der ganzen Welthatten sich an diesem internationalen Treffen eingefunden.
Unter dem Thema “Eine Verkehrsrevolution schaffen” versammelte die NGV2010 Roma, 12. IANGV-Konferenzund -Ausstellung, 260 registrierte Vertreter und 104Unternehmen aus 29 verschiedenen Ländern wie Italien,Vereinigte Staaten, Argentinien, Deutschland, China,Korea, Türkei, unter vielen anderen.
Die dreitätige IANGV-Biennale war Gastgeber für ungefähr 2500 Besucher, die die Ausstellung in denHallen der Nuova Fiera in Rom durchschritten – derenprofessioneller Charakter erwähnt werden muss.
Andererseits versammelte die Konferenz Vortragendevon höchstem Niveau und die Sessionen zogen vielPublikum an. Sie umfasste 97 Präsentationen, darunter72 wissenschaftliche Veröffentlichungen, 13 Poster-Sessionen, 7 Vorträge und die Sessionen zumMarkt Italien.
Was die Spezialveranstaltungen angeht, nahmen 400Personen an einem denkwürdigen Gala-Dinner in CastelSant’Angelo teil, darunter Delegierte und Teilnehmer am
Programm für Begleitpersonen, Sponsoren und verschiedene ausgesuchte Aussteller, und 30 Personenwaren präsent am Technischen Rundgang in der CNG-Tankstelle Tor Pagnotta von Atac-Roma.
Die Veranstaltung wies eine starke internationale Präsenzauf, bezeichnenderweise aus China, Indien und demAsien-Pazifik-Raum – was deren Wachstum widerspiegelt– und aus Afrika, das Anfänge eines starken Interessesan Erdgasfahrzeugen zeigt.
Die nächste internationale Veranstaltung auf dem altenKontinent ist die 2. NGVA Europe InternationalShow&Workshops, die vom 7.-9. Juni 2011 in Berlinstattfindet. Weitere Informationen dazu:[email protected]
Your partner in CNG systemsYYYYYY
CNG stations Engineering Service CNG storage CNG components CNG Dispensers
Service
www.samtechgas.comMade in Italy - Cervarese Santa Croce - Padova

9July 2010 Gas Vehicles Report
10 Gas Vehicles Report
NGV2010 RomeFrench
July 2010
Après trois jours de conférences, de posters sessions etd’expositions à la Foire Nouvelle de Rome, l’événementde l’année a fourni une excellente impression. Orateurs,délégués et exposants du monde entier décidèrent defaire partie intégrante de cette réunion internationale.
Sous le thème ‘’Créons une révolution dans le transport’’,NGV2010 Rome, la 12ème Conférence et Expositionsous l’égide de l’IANGV a réuni 250 délégués enregistréset 104 sociétés issus de 29 contrées différentes, telsque l’Italie, les Etats-Unis, l’Argentine, l’Allemagne, laChine, la Corée, la Turquie, parmi beaucoup d’autres.
L’événement bisannuel de l’IANGV de trois jours a accueilliapproximativement 2500 visiteurs qui ont déambulés dansles différents halls d’expositions de la Nuova Fiera di Roma–il est difficile de mentionner leur profile professionnel.
Par ailleurs, les conférences ont été données par desconférenciers de haut niveau et ont attiré beaucoup demonde aux différentes sessions. Elles représentaient 97présentations incluant 72 rapports, 13 posters sessions, 7 orateurs au cours des cérémonies officiellesainsi que les sessions du marché italien.
En ce qui concernent les activités spéciales, 400 personnes parmi les délégués et les participants au programme des conjoints, ainsi que les sponsors etquelques exposants sélectionnés ont pris part au
mémorable diner de gala qui s’est tenu au CastelSant’Angelo. Trente personnes ont visité la station service de Tor Pagnotta, délivrant du CNG et appartenantà Atac-Roma, au cours du tour technique organisé.
L’événement a montré une forte présence internationaleet plus particulièrement celle de la Chine, de l’Inde et del’Asie-Pacifique- ce qui reflète leur expansion- ainsi quecelle de l’Afrique montrant leur solide intérêt naissantpour les véhicules au gaz naturel.
Le prochain événement international sur le VieuxContinent sera la 2ème NGVA Europe InternationalShow&Workshops qui se tiendra à Berlin les 7 et 9 juin2011. Plus d’informations sur le [email protected]
Leading type 4 cylinder technology
and complete storage systems
• Transit busses, trucks and passenger cars
• Gas transportation and stationary storage
• CNG and hydrogen
COMPOSITES MOVE MORE GAS
www.rafs.no

11July 2010 Gas Vehicles Report

July 2010 Gas Vehicles Report12
Spanish
NGV2010 RomaLuego de 3 días de conferencias,sesiones de poster y exposición en laNueva Fiera de Roma, el evento delaño produjo un excelente resultado.Oradores, delegados, expositores yvisitantes de todo el mundo decidieron tomar parte de esteencuentro internacional.
Bajo el lema “Creando unaRevolución en el Transporte”,NGV2010 Roma, la 12° Conferenciay Exhibición de la IANGV, reunió a260 delegados registrados y 104empresas de 29 países de todo elglobo, como Italia, Estados Unidos,Argentina, Alemania, China, Corea yTurquía entre muchos otros.El encuentro bienal de la IANGVrecibió unos 2.500 visitantes con unclaro perfil profesional, que recorrieron exhaustivamente elpabellón expositivo del sitio de eventos de Roma.
Las conferencias, brindadas pororadores de alto nivel, atrajeronbuena cantidad de personas a lasdistintas sesiones. Las reuniones contaron con 97 presentaciones,72 ‘papers’, 13 sesiones de póster,7 oradores en diferentes ceremonias y, además, las sesionesdedicadas al mercado italiano.
En cuanto a las actividades especiales,400 personas, entre delegados a laconferencia y asistentes al programade acompañantes así como patrocinadores y expositores selectos, asistieron a la cena de galaen el Castel Sant’Angelo.
Treinta fueron los participantes delTour Técnico, desarrollado en laestación de carga de buses ametano Tor Pagnotta, de la empresade transporte público Atac-Roma.
Hubo una fuerte presencia internacional, significativa de China,India y el Asia Pacífico –lo cual reflejasu crecimiento- y de Africa, quemuestra su temprano pero sólidointerés en el GNV.
El próximo evento internacional en el Viejo continente es la 2nd NGVAEurope InternationalShow&Workshops, a celebrarse del7 al 9 de junio de 2011 en Berlín.Mayor información:[email protected]
Italian Industry for natural gas vehicles
[email protected] - www.ngvsystem.com
The role of the italian natural gas Industry
for a sustainable mobility

13July 2010 Gas Vehicles Report

July 2010 Gas Vehicles Report14
Dutch
Na drie dagen van conferenties, poster sessies en tentoonstellingen op de Nieuwe Rome Jaarmarkt, zorgdehet evenement van het jaar voor uitstekende resultaten. Sprekers, delegaties, exposanten en bezoekers uit dehele wereld besloten aan deze internationale ontmoetingdeel te nemen.
Onder het thema: “Creating a Revolution in Transport”,trok de NGV2010 Roma, de 12de. Conferentie enTentoonstelling van de IANGV 260 geregistreerde delegaties en 104 maatschappijen uit 29 verschillendelanden, zoals Italië, Verenigde Staten, Argentinië,Duitsland, China, Korea, Turkije en nog vele anderen.
De drie-daagse IANGV die tweejaarlijks gehouden wordtverleende gastvrijheid aan ongeveer 2.500 bezoekers diede expo-hallen van de Nuova Fiera di Roma bezochten diezich professioneel profileerden.
De conferenties werden verzorgd door top-level sprekersen trokken ook veel publiek naar de sessies. Dat hield in:97 presentaties, inclusief 72 documenten, 13 postersessies, 7 sprekersplechtigheden plus de sessies betreffende de Italiaanse markt.
Kijken we naar de speciale activiteiten, er waren 400mensen van conferentiedelegaties en hun partners, programmadeelnemers zowel als sponsors en
NGV2010 Roma
verschillende geselecteerde exposanten bezochten eengedenkwaardig gala-diner op het kasteel Sant ’Angelo,ook waren er 30 mensen present bij de technische tourbij het CNG service station Tor Pagnotta van Atac-Roma.Het evenement liet een sterke internationale vertegenwoordiging zien, speciaal uit China, India enPacific Azië, hetgeen hun respectievelijke groei laat zienen Afrika, die zijn jonge maar solide belangstelling laatzien in Natural Gas Vehicle.
Het volgende internationale evenement op het oudeContinent is de 2de. NGVA Europa International Show enWorkshops, die wordt gehouden in Berlijn op 7-9 juni2011. Meer info: [email protected]

15July 2010 Gas Vehicles Report
S E R V I C E E X P E R I E N C E I N N O V A T I O N T E C H N O L O G Y
RAIL S.p.A.Via A. Grandi , 10 - 42030 Vezzano sul Crostolo (RE) Italy - P.IVA e C.F. 02207560356
tel +39 0522 603801 - fax +39 0522 602145 - www.railspa.net - [email protected]
RAIL gets the world moving
while helping the environment
in jectorsinjectorss
Portuguese
Após três dias de conferências,sessões de posters e exposição naNueva Fiera de Roma, o evento doano produziu um excelente resulta-do. Oradores, delegados, expositorese visitantes de todo o mundo decidi-ram fazer parte deste encontrointernacional.
Sob o lema “Criando uma Revoluçãono Transporte”, NGV2010 Roma, a12º Conferência e Exposição daIANGV, reuniu 260 delegados reg-istrados e 104 empresas de 29países de todo o globo, como Itália,Estados Unidos, Argentina,Alemanha, China, Coréia e Turquiaentre muitos outros.
O encontro bienal da IANGV recebeucerca de 2.500 visitantes com umclaro perfil profissional, que percor-reram exaustivamente o pavilhãoexpositivo do sitio de eventos deRoma.
As conferências, brindadas pororadores de alto nível, atraíram boaquantidade de pessoas às distintassessões. As reuniões contaram com97 apresentações, 72 ‘papers’, 13sessões de posters, 7 oradores emdiferentes cerimônias e, além dassessões dedicadas ao mercado ital-iano.
Com relação as atividades especiais,400 pessoas, entre delegados daconferência e participantes do pro-grama de acompanhantes assimcomo patrocinadores e seletosexpositores, assistiram ao jantar degala no Castel Sant’Angelo. Trinta foram os participantes doTour Técnico, realizado no posto deabastecimento de ônibus a metanoTor Pagnotta, da empresa de trans-porte público Atac-Roma.
Houve uma forte presença interna-cional, significativa de China, Índia eÁsia Pacífico –o qual reflete seucrescimiento- e da Africa, quemostra seu precoce mas sólidointeresse no GNV.
O próximo evento internacional noVelho continente é a 2nd NGVAEurope InternationalShow&Workshops, que será realiza-do de 7 a 9 de junho de 2011 emBerlim. Maiores informações:[email protected]
NGV2010 Roma

July 2010 Gas Vehicles Report16
Info from the InternationalAssociation for Natural Gas Vehicles
Brett Jarman
IANGVExecutive Director
As well gathering for our conference in Rome last month tocelebrate the revolution in transport (see pictures on thesepages for highlights), IANGV members also assembled for ourusual round of members and in-house meetings to continueanother internal revolution ofsorts. This particular set of meetings was more significantthan usual as it completed an 18month process of review of thestructure of the association.
This review culminated in severalmajor changes being approved bymembers to better position us aswe move into what is likely to bethe most exciting decade the NGVindustry will ever see.
These changes include a newbrand for the association, a widerrange of options for members,more options for national orregional associations wanting tojoin our network, the establish-ment of a Board of Directors, andalso a General Assembly, where allmembers can have a voice andinfluence the strategic direction ofthe association.
New MembershipStructure
Another key change we’ve intro-duced is varying the range andnumber of membership options.Members will now have a choiceof joining us directly as ‘CorporateMembers’ or via one of ourAffiliated National or RegionalAssociations as ‘Corporate
Associate Members’. AssociateMembers will be entitled to most ofthe benefits available to corporatemembers as outlined below.
This level will suit most industrymembers but for those who wantthe extra benefits, such as increasedvoting rights, Board of Directors eligibility or enhanced listings in ourbusiness directory, they will be welcome to join us directly.
We still strongly encourage Nationalor Regional Association membershipthough and provide incentives (feediscounts) for those that do.
We have also introduced a newclass of Sponsoring Members toacknowledge industry leaders takingpart in our sponsorship program.
In recognition of their significantfinancial commitment to theAssociation, these leaders receiveadditional benefits including automatic Board of Directors entitlements. Companies interestedin taking up a leadership position andjoining those currently displayed onthis page, should contact me directlyat [email protected] or phone +61 2 6608 0011.
More Options for Nationaland Regional Associations
One of the weaknesses of the association, the low participationrate of National and Regional NGVAssociations, has been addressed bylowering the entry level for associationswishing to join our network.
Currently less than half of the national or regional NGVAssociations operating around theworld are members of NGV Globalwith cost reportedly being the mainbarrier. Under our new structure,associations can become an AlliedAssociation for one third of the pricepreviously charged.
Associations can also take a higherlevel of membership (Affiliation)under which their members willbecome Corporate AssociateMembers of NGV Global.
The entry price for this has also lowered and structured in a way thatgives NGV Global a more equitablereturn based on numbers of members.
We have also formalized our relationship with the International
IANGV Undergoes Its Own Revolution
Originally approved in October lastyear (at our Council meeting inDonghae), we have now publiclyannounced and launched our newbrand NGV Global. Our formal name for the association will continue to beInternational Association forNatural Gas Vehicles Inc, but aswe are no longer the only international association, due tothe formation of several regionalassociations, we have adoptedNGV Global, as it better definesour ‘territory’. Of course, it’s also
New Brand – NGV Global
easier to say and is an improvement on the IANGVacronym, which doesn’t roll off thetongue so easily.
Our weekly newsletter of the samename, has now been renamedNGV Global News.
As you can see, the brand alsoincludes a new logo. We’ll beusing the globe for a range ofapplications so keep an eye outfor it in its various forms.

17July 2010 Gas Vehicles Report
Gas Union (IGU), giving them automatic membership entitlementwithin our rules, and a position onour Board of Directors. This isindicative of the importance of thisrelationship to our association.
The Revolution in Action
As mentioned earlier, all of thesechanges are designed to strengthenthe association as we move towards2020. Our projections indicategrowth to as many as 65 millionNGVs on the road by that time sowe need to be in a strong position tocontribute to that advance. Issuesthat we will face will be much largerin scale and more critical to addressas an industry body.
Specific outcomes of the changeswill be:
® Broader representation of theindustry by NGV Global
® Increased participation in our international network by National andRegional NGV Associations
® Improved financial stability for theassociation
®Improved participation by membersin NGV Global’s strategic directionthrough our General Assembly andits associated subcommittees.
®Increased staffing and resourcesfor NGV Global
®Improved decision making withinthe association through clearer definition of the decision making bodies.
®Our next step as an association isto complete and adopt a StrategicPlan for NGV Global, a processwhich commenced last year but wasput on hold while we resolved theunderlying structural issues of theassociation. I look forward to reporting more on this plan later this year.
Join the Club
The critical question industry members should ask themselves is;how can I be a part of this andwhere does our business or organization fit in? Membership isthe first and most obvious step.
If your country has a national NGVassociation, then that would be thebest place to start.
As the national, regional and global associations all have different functions and areas of focus, youmight find it appropriate to join one,two or even all three.
It’s a complex set of options butdon’t let that be an excuse for avoiding participation.
Discuss your options with each ofthose relating to your area – (you can find our affiliated and allied associations listed on ourwww.ngvglobal.org website) – and ofcourse, we welcome your enquiriesto join NGV Global directly.
Please contact me [email protected] or phone + 61 26008 0011.
IANGV Sponsors
New President
Also in Rome, Gabriele Gozziwas appointed as our newChairman for a two year period.
Born in 1968, Gabriele hassince 1993 been theCommercial Director andmember of the BoD of IdroMeccanica, a compressormanufacturer known worldwide and CNG /hydrogenfilling station provider active inthe field since 1966.
He has been Counselor forNGV System Italia, the ItalianNGV Association since 2000,and was Marketing andCommunication CommitteeChairman of ENGVA, the former European NGVAssociation.
He has been recently confirmed as Coordinator ofWorking Group: SuccessfulMarketing Initiatives at NGVAEurope, the new EuropeanNGV Association.

July 2010 Gas Vehicles Report18
NGV2010 Roma

19July 2010 Gas Vehicles Report
NGV2010 Roma

July 2010 Gas Vehicles Report20
NGV2010 Roma

21July 2010 Gas Vehicles Report
Replacing oil derived fuels in transport is a core theme of the EU2020 Strategy COM (2010-2020)and of the White Paper on CommonTransport Policy 2010–2020,presently under preparation.
The long-term perspective for transport in Europe has been laidout in the CommissionCommunication on the Future ofTransport of 2009, being supportedby the Commission Communicationon a European strategy on cleanenergy efficient vehicles COM(2010)186 final, which reveals that"the Commission will determine andcompare the environmental and carbon footprint of vehicles (internalcombustion engine, electric, gasfuelled vehicles and hydrogen) basedon a life cycle approach". TheCommission therefore stresses atechnological neutral perspective, inorder to reach the 2020 transportgoals. NGVA Europe was contributingto the debate on the future of transport as a stakeholder by participating in various stakeholdermeetings, specifically also on thisissue of clean and energy efficientvehicles.
The Commission Communication onfuture steps in bio-waste management in the European UnionCOM (2010)235 final now accentuates “that improved management of bio-waste in the EUholds an untapped potential for significant environmental and economic benefits”. “About one-thirdof the EU's 2020 target for renewable energy in transport couldbe met by using biogas producedfrom bio-waste, while around 2% of
NGVA Europe increases its activity in Brussels
the EU's overall renewable energytarget could be met if all bio-wastewas turned into energy”. However,bio-waste covers only a small portionof the total biomethane potential.The EU definition of bio-waste doese.g. not include manure based biomethane (provides the highestGHG avoidance up to 148%) or gasmade from other agriculturalresources, sewage sludge or forestwaste.
The objective of the Community onCO2 emissions is an overall reduction by 80% by 2050.The next 10 years are crucial forthis 2050 vision. The White Paperwill outline a transport action programme until 2020. It will definethe overall framework for actions inthe next ten years in the fields oftransport infrastructure, internalmarket legislation, technology fortraffic management and decarbonisation of transport throughclean fuels and vehicles.
NGVA Europe, the European association for natural gas and
biomethane vehicles, currently participates as the unique stakeholder representing the NGVrelated interests in the Expert Groupon Future Transport Fuels (organizedby DG MOVE).
This expert group aims at the preparation of the White Paper,which will advise the EuropeanCommission on the development of acomprehensive fuel strategy and concrete measures, leading todecarbonisation of transport andsubstituting fossil oil as transportfuel.
NGVA Europe represents more than110 members from more than 30countries already and we are proudto announce that we will open abranch office in Brussels inSeptember 2010. NG/biomethanevehicles in Europe are on the moveand NGVA Europe will continue tomeet the challenge on behalf of theEuropean NGV related industry!
For more information on NGVAEurope visit www.ngvaeurope.eu!
Manuel Lage
NGVA EuropeGeneral Manager
European Association July Report
Natural Gas Vehicle Association Europe

July 2010 Gas Vehicles Report22
On last June was officially inaugurated the ultra-modern stationof the company Alpengas in Bolzano,Italy. The station is located at theA22 highway –Munich-Modena-- exitBolzano South and thus well situatedfor the highway users as well as forthe local residents/ customers.
The project entailed a € 6M investmentand covers 9,000 m2 of land.The natural gas delivered by thisAgip station is provided by ENI.When entering the station, usersfind double 6 multi-dispensers to provide their vehicles with all types ofgasoline, diesel (including AD) andCNG, the customer also being ableto operate in self-service mode.
The methane, which will soon be biogas produced in Bolzano, is compressed by employing twoDresser Wayne compressors of700Nm3/h each, which store thegaseous fuel in a 600Nm3/h cascade and then supply the refuelling points. Moreover, through an agreementwith the Fiat Research Center, interested in the project, there willbe Hydrogen blends available.
On the other hand, there are twospecial points to serve trucks (4 at atime may refill 150 litres/diesel perminute each), restaurant, wi-fiInternet, among other things.The station is also ready to offerE85 gasoline and LNG for trucks ...
For what concerns hydrogen, thesystem is fed by a 300 cm capacitystorage, but in the future the systemwill be supplied by an A22-IIT plant.
Biogas is stored at present into a300 cm tank. In the future it will besupplied by a collecting networkwhich will be built on purpose.
In Summary, the refuelling stalls havegot: Heavy duty vehicle area: 2 dispensers with 2 connectorseach for diesel high flow rate refuelling: 130lt/min •1 dispenserwith 2 connectors for Urea AdBlueLight duty vehicle area: 2 self-servicedispensers each with 2 connectorsfor gasoline 95 RON; 2 connectors
Bio-methane •1 attended dispenserwith 2 connectors for gasoline 95RON; 2 connectors for E85; 2 connectors for diesel; 2 connectorsfor Biodiesel; 2 connectors for H2/CNG blends.The dispensers are the most innovative parts of the system,because the CNG section is integrated in the same dispenserwhich can also deliver gasoline anddiesel oil. It is an original product,which simplifies and eases the refuelling operation.
for gasoline 98 RON; 2 connectorsfor diesel; 2 connectors for dieseltec; 2 connectors for CNG•2 attended dispensers, each onewith 2 connectors for benzina 95RON; 2 connectors for gasoline 98RON; 2 connectors for diesel; 2 connectors for dieseltec; 2 connectors for CNG• 1 attended dispenser, with 2 connectors for gasoline 95 RON; 2connectors for E85; 2 connectorsfor diesel; 2 connectors forBiodiesel; 2 connectors for
Official opening of the mostadvanced multi-energy station

June 7 - 9, 2011Berlin, Germany
7.-9. Juni 2011
2nd NGVA Europe International Show & Workshops2. Internationaler NGVA Europe Kongress & Workshops
Natural Gas Vehicles - Biomethane - CNG - LNG - Hydrogen blendsErdgasfahrzeuge - Bio-Erdgas - CNG - LNG - Wasserstoff Mischungen
:: An event of :: Hosted by :: Organized by
Contact: [email protected]

July 2010 Gas Vehicles Report24
By CristinaMarconi
GVR correspondentin Brussels
L'Unione europea punta sui veicolipuliti ed efficienti per raggiungere gliobiettivi di riduzione delle emissioni digas serra e dare nuovo respiro alsettore dell'auto. In linea con le indicazioni del programma Europa2020 e in vista della pubblicazioneimminente del 'Libro bianco sulla politica europea dei trasporti', il commissario per l'Industria, AntonioTajani, ha sottolineato in una comunicazione al Parlamento europeo, come “l'importanza dei carburanti e delle tecnologie di propulsione alternativi sia destinata acrescere in futuro” e ha fissato alcune delle priorità che intende perseguire, incentivando la ricerca,fissando standard comuni in tuttaEuropa e sviluppando l'infrastrutturanecessaria per favorire "la transizione verso un'economia efficiente sotto il profilo delle risorsee a basse emissioni di carbonio”.
Oltre alle auto elettriche, che laSpagna ha messo in cima alla suaagenda durante il semestre di presidenza, anche i veicoli a gasnaturale fanno parte delle prioritàdella Commissione, che vuole assumere un ruolo di guida per far sì che venga potenziata, a livello nazionale e regionale, l'infrastrutturadi ricarica e di rifornimento, studiando con la Banca europea pergli investimenti, Bei, le possibiliforme di finanziamento per stimolaregli investimenti destinati a migliorarei servizi per i veicoli. Bruxelles hamesso in chiaro di voler mantenereun atteggiamento di 'neutralità tecnologica' rispetto ai vari settoriindustriali e ha annunciato la pubblicazione delle linee guida per gliincentivi finanziari destinati all'acquisto delle auto 'verdi', che
A partire da questa edizione, i lettori di GVR troveranno ogni mese un articolo della nostracorrispondente da Bruxelles, la giornalista specializzata Cristina Marconi, sull'Unione europeae i veicoli a gas naturale
restano oggi ancora troppo care peri consumatori.
Il commissario al Clima, ConnieHedegaard, da parte sua ha promesso una proposta legislativaper la riduzione delle emissioni deiveicoli pesanti, che rappresentano da
soli il 5% delle emissioni di gas serranell'Ue, ossia ben più che l'aviazionee il trasporto marittimo messi insieme. Ma l'interesse di Bruxellesper l'auto a gas si fa ancora più vivose si guarda allo sviluppo delle potenzialità del biogas.
La Commissione sta infatti mettendoa punto particolari iniziative di sostegno, partendo dalla considerazione che circa “un terzodell'obiettivo che si è fissato l'UEper il 2020 in materia di energierinnovabili nei trasporti potrebbeessere raggiunto utilizzando il biogas ricavato dai rifiuti organici,mentre circa il 2% dell'obiettivo globale fissato dall'UE in materia dienergie rinnovabili potrebbe essereottenuto se tutti i rifiuti organicifossero trasformati in energia.
Si tratterebbe di un risultato notevole, soprattutto se associato aivantaggi conseguiti sul fronte dellosmaltimento dei rifiuti. Ma viste lerapide evoluzioni tecnologiche nelsettore, la Commissione europea si ripromette di rivedere la sua strategia sui veicoli efficienti già nel2014.
Bruxelless
Veicoli efficienti al centro dellastrategia europea sui trasporti
Antonio Tajani, Vice-President of theEuropean Commission, responsible forIndustry and Entrepreneurship
Connie Hedegaard, European Commissioner for Climate Action

25July 2010 Gas Vehicles Report
By CristinaMarconi
GVR correspondentin Brussels
Clean and efficient cars are at thecore of the European Union's strategy to reach the targets ofreduction of the emission ofgreenhouse gases and give newmomentum to the automotive industry.
In line with the objectives of theEurope 2020 program and with theforthcoming publication of the 'Whitebook of european transport policy',Antonio Tajani, commissioner forIndustry, has indicated in a communication to the EuropeanParliament that “the importance ofalternative fuels and of new propulsion technologies is going togrow in the future”.
Tajani has listed some of the priorities he wants to pursue in thenear future: foster research, establish common standards inEurope and develop necessary infrastructures to favour a “transitiontowards an economy which is efficient from the point of view ofresources and with a low greenhouse emissions rate”.
Besides electric cars, which havebeen on the top of the agenda ofSpain's semester of EU presidency,natural gas vehicles are among themain interests of the EUCommission, which is willing to assume a leading role in reinforcingthe infrastructures to recharge andrefuel. To this end, Brussels isstudying with the EuropeanInvestment Bank, EIB, possible financing instruments to improve theservices for the 'alternative' vehicles,making clear that it is necessary tokeep a 'technological neutrality'towards different industrial sectors.
Since this edition, GVR readers will monthly find a note about the European Union and naturalgas vehicle from our correspondent in Brussels, the specialized journalist Cristina Marconi.
One of the weaknesses of 'alternative'cars is that they are still too expensive for consumers. For thatreason in the next months theCommission will issue some guidelines for financial incentives.
The commissioner responsible forClimate Action, Connie Hedegaard,has announced that she will presenta legislative proposal concerningtrucks, which alone represent 5% ofgreenhouse emissions in the EU, i.e.much more than aviation and maritime transport combined.
But Brussels’ interest in natural gasvehicles is even more vivid if onelooks at the development of the biogas potential.
In this field the EuropeanCommission is preparing specificsupport initiatives, starting from theidea that “about one-third of the2020 EU target to use renewableenergy in transport could be metby using biogas produced from bio-waste as vehicle fuel and around2% of the overall renewable energytarget could be met if all bio-wasteis turned into energy”.
It would be a remarkable achievement, even more so if relatedto the advantages it would bring tothe management of waste. But giventhe very quick technological evolutionof the transport sector, the EUCommission has decided to reviewits strategy in 2014.
Brussels
Clean cars are at the core of the EUtransport strategy

July 2010 Gas Vehicles Report26
With a worldwide NGV populationwhich over the last decade hasincreased from a few million to 12million vehicles, with an increasingshare of OEM supplied vehicles, andwith the use spreading from cars,trucks and buses both to smallervehicles (three-wheelers) and tomuch larger “vehicles” (ships andtrains), I believe the industry needs toconsider whether the promotionalconcepts used so far are still thebest way to support continued strongmarket growth.
In the wake of the economic recession exhibitions and conferences are generally sufferingfrom reduced attendance and bookedexhibitor space. Our industry is noexception.
The alternative fuel theme is also ingeneral less “revolutionary” than adecade ago. Whether the exhibition/conference concept usedsince the 90’s is the best way of supporting future NGV market developments is an open question.
People in the NGV industry still havea need to get together, to build networks, and to exchange ideas inworkshops focusing on different subjects, but these workshops maynot be the best way of reaching all ofthe real customers.
I believe that the NGV industry mustthink hard about the best way ofattracting the real customers. To kick off this process we have todefine different customer groups, different product offers, and differentsuppliers.
® Completely new passenger caroffers are usually communicated at afew major international car exhibitions (Geneva, Frankfurt, Paris,Tokyo, Detroit) which in sequence areaddressing three different targetgroups – media, car industry people,and finally car enthusiasts in general.
® Current passenger car offers
usually communicated at national carshows. It takes an effort to benoticed. Just exhibiting a car is notalways good enough. Success stories need to be communicated, e.g. racing achievements demonstrating highperformance capability, or high penetration of certain segments, e.g. taxi cars.
® Special events for fleet owners(e.g. taxi companies), including testdriving as well as product exhibition,could often offer more direct sales opportunities than large public exhibitions.
® Offers of all kinds of commercialvehicles, including NGVs, are bestcommunicated at national trade fairsevents.
® Offers of NG powered buses could with advantage be communicated at regional bus exhibitions (Europe, Asia, LatinAmerica, North America etc).
® Offers of components of interestto the NGV industry could be splitinto three categories – vehicle components, filling station components, and biomethane production and upgrading equipment.
Interested parties would be OEMauto makers, CNG/ LNG distributors, and municipal authorities. It is not very likely thatwe could create events which simultaneously appeal to all three ofthese categories. At the moment wemainly attract CNG and LNG distributors, not the OEMs, and notthe municipal authorities.
In summary I believe that we in thefuture, concerning NGV exhibitions,need to shift the focus from international to regional or nationalevents, to avoid the shotgunapproach, and instead arrange clearly target oriented meetingsbetween prospective buyers and suppliers.
We also need to highlight any reallysuccessful NGV marketing efforts –talking about mediocre performanceswill not create enthusiasm. We also need to recognize differences in market maturity.
NGV promotionMonthly column
Peter Boisen
In countries which are in the veryearly phase of NGV market introduction the first efforts wouldusually be focused on the introduction of urban fleets of public transportation vehicles including conversions of standardpassenger cars used as taxi cabs.
The main drivers are usuallyimproved air quality and reducedfuelling costs. In well developedeconomies the focus is often shiftingto required emissions of greenhousegases and it will be very interestingto follow how NGVs sales can benefitfrom rapidly sharpened legaldemands concerning tailpipe CO2emissions.
Transportation of heavy goods usingtrucks, non electrified trains, andships is a sector which until now hasrelied on diesel or fuel oil, but wheremethane in the form of liquefied natural gas or liquefied biomethanehas huge volume potentials.
Large truck fleets can via the use ofLNG/LBG contribute to very significant reductions of CO2 emissions and one single ship willconsume as much fuel as thousandsof cars. Legislation both concerningair pollution and CO2 emissions willbe a strong driving force, and themarket success will depend on theability of the industry to provide anadequate refueling structure, ofcourse also future offers of high efficiency engines mainly fueled bymethane.
Instead of re-gasifying all LNGreceived into seaboard terminalssome of the LNG should be transferred to LNG or L-CNG vehiclefilling stations and to ship bunkeringfacilities (mainly bunkering barges).
The potential customers which ourindustry has so far failed to providewith interesting presentations of thepossibilities offered via the combination of natural gas and biomethane are the municipal decision makers. I believe that weneed to develop show cases demonstrating how we in differentparts of the world can step by stepreplace fossil fuels with biomethanemade from domestic renewableresources.

27July 2010 Gas Vehicles Report
News,News, Products,Products, TechnologyTechnology
CRYOSTAR has been the leader in radial inflow turbinetechnology for more than 35 years and is now using itsexpertise to answer the rising demand for cleanerenergy, through its CRYOSTAR Clean Energy BusinessUnit created 6 years ago.
In today’s global context of climate change and worldwide political emphasis on preserving the environment, CRYOSTAR Clean Energy has developedsolutions to produce CO2-free energy from renewablesources such as geothermal, solar, biomass, marineenergies, waste heat recovery and geo-pressure.Briefly: natural gas comes out of the ground at a veryhigh pressure, called geopressure.
It is this pressure that moves the gas through thepipelines of the gas transportation & distribution networks. However, the gas at this pressure (between100-800 bars) cannot be used safely by end-users. To be suitable for domestic use (a gas stove forinstance), the gas goes through several “pressure reduction stations” at different stages of the network,where its pressure is lowered by simply expanding itthrough a valve. Expanding the gas releases energywhich is lost when simply using a valve. However, it is possible to recover it by installing aTurboExpander-Generator system in these pressurereduction stations.
A HUGE potential of CO2-free energy generation existsand this is what CRYOSTAR aims to show during thisconference through case studies, workshops andpresentations from the different stakeholders involvedthroughout the supply chain.
RENGE is the FIRST event that brings together international experts from all over the world toexchange their knowledge and ideas about energyrecovery from natural gas expansion. It will take place at the Dollfus&Noack Hall, inSausheim, France, on next 23-25 November
Ever since the first international conference on climate change held in Geneva in 1979, the Rio treatiesin 1992, the Kyoto protocol in 1997 and more recently,Copenhagen 2009, ever increasing emphasis has beenplaced on the need to reduce greenhouse effect gasemissions. Energy recovery from pressure let down cancontribute to reducing these greenhouse effect gas emissions through recovering the energy of the expansion process. With the worldwide natural gas consumptionamounting to 3000 billion cubic meters in 2008 (BP statistical review of world energy), the potential to recover gigawatts of energy is colossal.
Cryostar invites you to share your experience and know-how with prominent players in natural gas industry.Don’t miss the natural gas industry’s newest event!
For more details, connect to: www.conference-renge.comor contact: [email protected].
Cryostar is organizing RENGE, 1st International Conference onRecovered Energy from Natural Gas Expansion

July 2010 Gas Vehicles Report28
All in one – WEH refuelling sets for natural gas
News,News, Products,Products, TechnologyTechnology
WEH can now offer complete refuelling assemblies consisting of a fuelling nozzle,hose and breakaway coupling readyfor installation at fuelling stations forbuses trucks and cars.
The sets can be assembled to customerspecification, for example various lengths of fillinghose, fuelling nozzles for various applications and breakaway couplings.
The breakaway couplings can be assembled for installation directly tothe dispenser or as an 'inline' part of the hose assembly.
The individual refuelling components feature high flow rates, short filling times and aremade from high-grade materials.
WEH sets are designed for CNG fast filling of vehicles at self-serve fuelling stations and meet the requirements of the Pressure Equipment Directive PED97/23/EC.
TK17 CNG set:Nozzle with hoseand breakawaycoupling
Mark your agenda!
2nd NGVA Europe International Show & Workshops2. Internationaler NGVA Europe Kongress & Workshops
June 7 - 9, 2011 - Berlín, GermanyBerlin, 7.-9. Juni 2011
[email protected] · [email protected]
Natural Gas Vehicles - Biomethane - CNG - LNG - Hydrogen blendsErdgasfahrzeuge - Bio-Erdgas - CNG - LNG - Wasserstoff Mischungen
III ExpoGNV Peru, “Una ciudad a GNV, ejemplo para el mundo”Centro de Exposiciones Jockey
III ExpoGNV Peru - "A city on NGV, an example to the world"Jockey Exhibition Center
Lima, septiembre 2011 · Lima, September 2011
[email protected] · [email protected]
Organizer
January 2011M T W T F S S
1 23 4 5 6 7 8 9
10 11 12 13 14 15 1617 18 19 20 21 22 2324 25 26 27 28 29 3031
February 2011M T W T F S S 1 2 3 4 5 67 8 9 10 11 12 13
14 15 16 17 18 19 2021 22 23 24 25 26 2728
March 2011M T W T F S S 1 2 3 4 5 67 8 9 10 11 12 13
14 15 16 17 18 19 2021 22 23 24 25 26 2728 29 30 31
April 2011M T W T F S S 1 2 34 5 6 7 8 9 1011 12 13 14 15 16 1718 19 20 21 22 23 2425 26 27 28 29 30
May 2011M T W T F S S 12 3 4 5 6 7 89 10 11 12 13 14 15
16 17 18 19 20 21 2223 24 25 26 27 28 2930 31
June 2011M T W T F S S 1 2 3 4 56 7 8 9 10 11 12
13 14 15 16 17 18 1920 21 22 23 24 25 2627 28 29 30
July 2011M T W T F S S 1 2 34 5 6 7 8 9 1011 12 13 14 15 16 1718 19 20 21 22 23 2425 26 27 28 29 30 31
August 2011M T W T F S S1 2 3 4 5 6 78 9 10 11 12 13 14
15 16 17 18 19 20 2122 23 24 25 26 27 2829 30 31
September 2011M T W T F S S 1 2 3 45 6 7 8 9 10 1112 13 14 15 16 17 1819 20 21 22 23 24 2526 27 28 29 30
October 2011M T W T F S S 1 23 4 5 6 7 8 910 11 12 13 14 15 1617 18 19 20 21 22 2324 25 26 27 28 29 3031
November 2011M T W T F S S 1 2 3 4 5 67 8 9 10 11 12 13
14 15 16 17 18 19 2021 22 23 24 25 26 2728 29 30
December 2011M T W T F S S
1 2 3 45 6 7 8 9 10 11
12 13 14 15 16 17 1819 20 21 22 23 24 2526 27 28 29 30 31

7
29July 2010 Gas Vehicles Report
Worldwide NGV statisticsCountry
Natural Gas Vehicles NGV Refuelling stations
VRA
Monthly gas consumption (M Nm3)
Last updateTotal Cars/LDVs MD/HD
BusesMD/HDTrucks Others
% of totalNGVs inthe world
Total Public Private Planned% of total
fuelling sta-tions in the
world
Average con-sumption
(actual report)
The consump-tion in theory
Reportedconsumption
Pakistan 2.500.100 2.450.000 100 50.000 21,44% 3.300 3.300 18,59% 443,80 0,0% June 2010Argentina 1.826.845 1.826.845 15,66% 1.858 1.858 10,47% 32 213,52 328,83 64,9% January 2010Iran 1.825.255 1.818.243 7.000 12 15,65% 1.305 1.255 50 779 7,35% 189,00 348,29 54,3% May 2010Brazil 1.639.705 1.639.705 1.782 1.782 7 168,59295,15 57,1% May 2010 March 2010India 700.000 680.380 12.000 715 6.905 6,00% 500 181 319 2,82% 52,00 159,39 32,6% April 2009Italy 676.850 673.350 2.300 1.200 5,80% 770 725 45 70 4,34% 199 62,03 129,06 48,1% December 2009China 500.000 320.000 150.000 30.000 4,29% 1.652 1.453 199 232 9,31% 9 531,60 0,0% January 2010Colombia 304.823 281.363 13.800 9.660 2,61% 601 601 3,39% 3 45,00 99,77 45,1% February 2010Ukraine 200.019 10.000 120.000 70.000 19 1,72% 283 91 192 40 1,59% 8 83,00 417,80 19,9% November 2009Bangladesh 200.000 168.412 3.233 8.355 20.000 1,71% 500 500 2,82% 13 91,55 47,70 191,9% January 2010Thailand 173.480 140.050 11.720 20.030 1.680 1,49% 404 379 25 36 2,28% 0 95,60 76,48 125,0% March 2010Bolivia 122.812 122.812 1,05% 128 128 0,72% 46 26,28 22,11 118,9% May 2009Egypt 128.754 126.080 1.217 712 745 1,10% 124 120 4 19 0,70% 38,00 26,95 141,0% March 2010Russia 100.020 57.000 8.000 35.000 20 0,86% 249 202 47 1,40% 12 27,71 62,26 44,5% December 2009Armenia 101.352 69.971 9.831 19.626 1.924 0,87% 275 9 266 14 1,55% 28,50 57,88 49,2% September 2009USA 100.000 86.500 11.000 2.500 0,86% 816 816 4,60% 4.747 55,00 50,57 108,8% September 2008Germany 85.000 79650 1550 3650 150 0,73% 863 776 87 150 4,86% 804 14,60 21,91 66,6% December 2009Peru 85.966 85.955 11 0,74% 105 105 0,59% 10,04 15,50 64,8% March 2010Bulgaria 60.236 60.000 216 20 0,52% 81 80 1 13 0,46% 13,00 11,46 113,4% April 2010Uzbekistan 47.000 47.000 0,40% 63 63 0,35% 8,83 8,46 104,3% September 2009Malaysia 42.631 42.105 466 14 46 0,37% 137 135 2 0,77% 10 8,99 0,0% January 2010Japan 38.861 14.940 1.489 20.952 1.480 0,33% 342 292 50 1,93% 614 23,99 0,0% March 2010Myanmar 22.821 4.527 18.290 4 0,20% 37 37 0,21% 55,69 0,0% October 2008Korea 25.744 1.470 23.475 798 1 0,22% 157 157 5 0,88% 13 81,68 71,33 114,5% March 2010Sweden 23.125 21.749 963 412 1 0,20% 134 104 30 55 0,75% 21 6,77 7,13 94,8% December 2009Venezuela 20.000 20.000 0,17% 143 143 0,81% 8,15 3,60 226,4% December 2009France 12.450 9.500 2.100 850 0,11% 125 15 110 0,70% 1.290 8,69 0,0% December 2008Canada 12.140 9.500 240 0 2.400 0,10% 96 80 16 0,54% 3.789 2,55 0,0% April 2010Tajikistan 10.600 10.600 0,09% 53 53 0,30% 4,13 1,91 216,5% December 2007Chile 8.064 8.055 9 0,07% 15 15 0,08% 1 3,20 1,48 216,7% December 2007Switzerland 8.599 8.348 135 56 60 0,07% 122 119 3 7 0,69% 117 1,14 1,96 58,0% December 2009Kyrgyzstan 6.000 6.000 0,05% 6 6 0,03% 0,60 1,08 55,6% December 2007Belarus 5.500 5.500 0,05% 25 25 0,14% 3,00 0,99 303,0% December 2007Moldova 5.000 5.000 0,04% 14 14 0,08% 1,00 0,90 111,1% December 2007Austria 4.983 4.936 41 6 0,04% 208 160 48 15 1,17% 12 0,50 1,02 49,2% January 2010Singapore 4.578 4.533 30 15 0,04% 5 5 0,03% 0,92 0,0% December 2009Trinidad & Tobago 3.500 3.500 0,03% 13 12 1 0,07% 0,80 0,63 127,0% December 2006Turkey 3.339 1.850 1.489 0,03% 14 8 6 0,08% 35 0,40 4,80 8,3% April 2010Mexico 3.037 3.037 0,03% 8 8 0,05% 22 0,02 0,55 3,7% November 2008Georgia 3.000 3.000 0,03% 42 42 0,24% 0,54 0,0% January 2008Indonesia 2.550 1.755 335 210 250 0,02% 9 9 0,05% 1,50 0,0% December 2009Australia 2.825 100 1.700 275 750 0,02% 47 4 43 39 0,26% 130 5,38 0,0% November 2009Netherlands 2.032 1.350 542 140 0,02% 51 35 16 32 0,29% 558 1,98 0,0% November 2009Poland 2.106 1.502 300 4 300 0,02% 33 32 1 0,19% 49 1,19 0,0% August 2009Spain 1.863 213 847 760 43 0,02% 42 1 41 0,24% 21 3,52 3,19 110,5% December 2008Czech Republic 2.000 1.665 270 20 45 0,02% 38 25 13 0,21% 4 0,67 1,13 59,7% March 2010Slovakia 622 287 308 27 0,01% 8 6 2 4 0,05% 0,91 1,00 91,1% February 2010Latvia 500 30 10 187 273 0,00% 4 4 0,02% 11 0,23 0,0% December 2007Greece 520 0 414 106 0,00% 2 2 1 0,01% 1,33 0,0% August 2009Portugal 504 46 354 54 50 0,00% 5 1 4 3 0,03% 1,11 1,12 99,6% December 2009Finland 769 650 95 8 16 0,01% 18 17 1 5 0,10% 10 0,45 0,41 110,0% February 2010Serbia 326 320 6 0,00% 5 4 1 0,03% 0,015 0,08 19,8% April 2009United Arab Emirates 350 350 0 0 0,00% 2 1 1 16 0,01% 1 0,06 0,0% May 2009United Kingdom 294 4 217 73 0,00% 33 12 21 0,19% 115 0,40 0,18 224,8% December 2008New Zealand 283 180 66 37 0,00% 14 14 0,08% 0,23 0,0% March 2007Norway 376 212 138 10 16 0,00% 10 6 4 2 0,06% 4,55 0,46 987,1% January 2010Luxembourg 215 174 41 0,00% 7 5 2 0,04% 2 0,06 0,15 35,9% December 2009Belgium 143 143 0,00% 9 4 5 0,05% 60 0,03 0,0% December 2008Lithuania 150 50 100 0,00% 3 1 2 3 0,02% 1 0,200 0,31 64,7% January 2010Croatia 130 92 30 8 0,00% 1 1 0,01% 0,013 0,04 31,7% April 2009Algeria 125 125 0,00% 3 3 0,02% 0,02 0,0% October 2004Iceland 120 101 2 17 0,00% 2 2 1 0,01% 0,04 0,04 103,2% September 2009Lichtenstein 104 72 31 1 0,00% 3 3 0,02% 0,11 0,0% December 2009Mozambique 200 183 3 14 0,00% 2 2 0,01% 0,05 0,0% May 2010Hungary 72 30 42 0,00% 4 1 3 0,02% 12 0,13 0,13 95,1% December 2008Nigeria 60 60 0,00% 2 2 0,01% 0,01 0,0% June 2009Macedonia 50 7 43 0,00% 1 1 0,01% 0,02 0,13 15,4% March 2007Philippines 36 11 25 0,00% 3 1 2 0,02% 0,08 0,0% February 2006Tunesia 34 32 2 0,00% 1 1 0,01% 0,01 0,0% October 2007Ecuador 40 40 0,00% 1 1 0,01 0,0% May 2009Panama 15 15 0,00% 0,00% November 2008Bosnia & Herzegovina 7 7 0,00% 3 0 3 0,02% 2 0,00 0,0% December 2007Montenegro 0,00% 1 1 0,01% 0,00 0,0% March 2006Estonia 4 4 0,00% 1 1 0,01% 0,00 0,0% December 2008Tanzania 10 10 0,00% 3 0,00% 0,00 0,0% January 2010Vietnam 1.002 1.000 2 0,01% 12 11 1 0,07% December 2009Ireland 2 2 0,00% 1 1 0,01% 1 0,00 0,0% October 2008Kazakhstan 10 10 0,06% September 2009Dominican Republic 1 1 0,00% 2 2 0,01% 0,00 0,0% November 2009Turkmenistan 1 1 0,01% November 2009Total 11.662.629 10.942.289 406.381 226.667 87.292 17.749 14.280 1.687 1.551 13.069 1.177,69 3.079,16 38,2% June 2010

July 2010 Gas Vehicles Report30
Cities with CNG refuelling stations
Europe Worlwide
www.ngvgroup.com • Visit the biggest NGV portal in the world
Country's share of the world's total NGVs and fuelling stations
1.423
CountryNatural Gas Vehicles Refuelling stations
Last updateTotal
% of total NGVsin the world
Total% of total fuelling
stations in the world
Country Number of cities Last updateArgentina 330 Jan. '10
Armenia 37 Mar. '08
Australia 3 Nov. '09
Austria 118 Jan. '10
Bangladesh 8 Nov. '05
Bolivia 6 May '09
Brazil 295 May. '10
Bulgaria 36 Sep. '09
Chile 5 Dec. '07
China 74 Sept. '04
Colombia 79 Feb. '10
Croatia 1 Jan. '09
Czech Republic 19 Mar. '10
Egypt 16 Apr '06
Finland 14 Feb. '10
France 26 Aug. '02
Germany 735 Dec. '09
Greeece 1 Sept. 08
Hungary 2 Aug. '02
Iceland 2 Sept. '09
India 8 Oct.' 06
Indonesia 2 Sept. '08
Iran 611 Dec. '09
Ireland 1 Oct. '08
Italy 150 Dec. '06
Korea 34 May. '05
Liechtenstein 1 Sept. '04
Lithuania 2 Jan. '10
Luxembourg 2 Jan. '06
Macedonia 1 Jan. '05
Malaysia 6 Oct. '06
Mexico 2 Jun. '05
Netherlands 16 Dec. '08
Norway 4 Jan. '10
Pakistan 50 Apr. '08
Peru 2 Oct. '09
Philippines 1 Oct.'05
Portugal 5 Dec. '09
Russia 172 Aug. '07
Serbia 5 Dec. '07
Singapore 1 Jul. '05
Slovakia 8 Feb. '10
Spain 13 Jan. '06
Sweden 63 Jun. '09
Switzerland 21 Dec. '09
Taiwan 1 Apr'. 05
Thailand 39 Aug '08
Trinidad & Tobago 11 Dec. '07
Turkey 2 Aug. '04
United Arab Emirates 2 Oct. '06
United Kingdom 5 Nov. '04
Venezuela 26 Nov. '08
2.704
Pakistan 2.500.100 21,44% 3.300 18,59% June 2010Argentina 1.826.845 15,66% 1.858 10,47% January 2010Iran 1.825.255 15,65% 1.305 7,35% May 2010Brazil 1.639.705 1.782 1.782 168,59 March 2010India 700.000 6,00% 500 2,82% April 2009Italy 676.850 5,80% 770 4,34% December 2009China 500.000 4,29% 1.652 9,31% January 2010Colombia 304.823 2,61% 601 3,39% February 2010Ukraine 200.019 1,72% 283 1,59% November 2009Bangladesh 200.000 1,71% 500 2,82% January 2010Thailand 173.480 1,49% 404 2,28% March 2010Bolivia 122.812 1,05% 128 0,72% May 2009Egypt 128.754 1,10% 124 0,70% March 2010Russia 100.020 0,86% 249 1,40% December 2009Armenia 101.352 0,87% 275 1,55% September 2009USA 100.000 0,86% 816 4,60% September 2008Germany 85.000 0,73% 863 4,86% December 2009Peru 85.966 0,74% 105 0,59% March 2010Bulgaria 60.236 0,52% 81 0,46% April 2010Uzbekistan 47.000 0,40% 63 0,35% September 2009Malaysia 42.631 0,37% 137 0,77% January 2010Japan 38.861 0,33% 342 1,93% March 2010Myanmar 22.821 0,20% 37 0,21% October 2008Korea 25.744 0,22% 157 0,88% March 2010Sweden 23.125 0,20% 134 0,75% December 2009Venezuela 20.000 0,17% 143 0,81% December 2009France 12.450 0,11% 125 0,70% December 2008Canada 12.140 0,10% 96 0,54% April 2010Tajikistan 10.600 0,09% 53 0,30% December 2007Chile 8.064 0,07% 15 0,08% December 2007Switzerland 8.599 0,07% 122 0,69% December 2009Kyrgyzstan 6.000 0,05% 6 0,03% December 2007Belarus 5.500 0,05% 25 0,14% December 2007Moldova 5.000 0,04% 14 0,08% December 2007Austria 4.983 0,04% 208 1,17% January 2010Singapore 4.578 0,04% 5 0,03% December 2009Trinidad & Tobago 3.500 0,03% 13 0,07% December 2006Turkey 3.339 0,03% 14 0,08% April 2010Mexico 3.037 0,03% 8 0,05% November 2008Georgia 3.000 0,03% 42 0,24% January 2008Indonesia 2.550 0,02% 9 0,05% December 2009Australia 2.825 0,02% 47 0,26% November 2009Netherlands 2.032 0,02% 51 0,29% November 2009Poland 2.106 0,02% 33 0,19% August 2009Spain 1.863 0,02% 42 0,24% December 2008Czech Republic 2.000 0,02% 38 0,21% March 2010Slovakia 622 0,01% 8 0,05% February 2010Latvia 500 0,00% 4 0,02% December 2007Greece 520 0,00% 2 0,01% August 2009Portugal 504 0,00% 5 0,03% December 2009Finland 769 0,01% 18 0,10% February 2010Serbia 326 0,00% 5 0,03% April 2009United Arab Emirates 350 0,00% 2 0,01% May 2009United Kingdom 294 0,00% 33 0,19% December 2008New Zealand 283 0,00% 14 0,08% March 2007Norway 376 0,00% 10 0,06% January 2010Luxembourg 215 0,00% 7 0,04% December 2009Belgium 143 0,00% 9 0,05% December 2008Lithuania 150 0,00% 3 0,02% January 2010Croatia 130 0,00% 1 0,01% April 2009Algeria 125 0,00% 3 0,02% October 2004Iceland 120 0,00% 2 0,01% September 2009Lichtenstein 104 0,00% 3 0,02% December 2009Mozambique 200 0,00% 2 0,01% May 2010Hungary 72 0,00% 4 0,02% December 2008Nigeria 60 0,00% 2 0,01% June 2009Macedonia 50 0,00% 1 0,01% March 2007Philippines 36 0,00% 3 0,02% February 2006Tunesia 34 0,00% 1 0,01% October 2007Ecuador 40 0,00% 1 May 2009Panama 15 0,00% 0,00% November 2008Bosnia & Herzegovina 7 0,00% 3 0,02% December 2007Montenegro 0,00% 1 0,01% March 2006Estonia 4 0,00% 1 0,01% December 2008Tanzania 10 0,00% 0,00% January 2010Vietnam 1.002 0,01% 12 0,07% December 2009Ireland 2 0,00% 1 0,01% October 2008Kazakhstan 10 0,06% September 2009Dominican Republic 1 0,00% 2 0,01% November 2009Turkmenistan 1 0,01% November 2009Total 11.662.629 17.749 June 2010

31July 2010 Gas Vehicles Report
NGV’s statistics balanceBest growth in NGV population by number
Best growth in fuelling station population by number
NGV x 1.000Round up figures
Best growth in NGV population by % Best growth in fuelling station population by %
www.ngvgroup.com • Visit the biggest NGV portal in the world
Last twelve years evolution
Argentina 1996 1997 1998 1999 2000 2001 2002 2003 2004 2005 2006 2007NGVs 365.591 418.916 480.764 544.748 630.548 755.671 879.587 1.164.839 1.348.126 1.459.236 1.429.973 1.678.230Stations 515 570 646 770 871 982 1.049 1.152 1.330 1.494 1.636 1.744CNG sold (MNm3) 1.092 1.270 1.412 1.508 1.681 1.851 2.041 2.649 3.062 3.186 3.061 2.940Brazil 1996 1997 1998 1999 2000 2001 2002 2003 2004 2005 2006 2007NGVs ... ... ... ... ... 284.751 380.515 642.844 826.364 1.052.295 1.325.823 1.467.219Stations ... ... ... ... ... 265 506 667 905 1.206 1.411 1.575CNG sold (MNm3) ... ... ... ... 251 635 959 1.340 1.573 1.937 2.305 2.580Germany 1997 1998 1999 2000 2001 2002 2003 2004 2005 2006 2007NGV 1.059 2.040 3.245 (*) 6.829 10.509 14.420 19.105 27.175 38.933 54.772Stations 30 50 120 130 250 350 400 500 630 720CNG sold in MWh 132.472 165.127 239.871 325.546 424.697 527.314 685.836 963.204 1.400.000Italy 1996 1997 1998 1999 2000 2001 2002 2003 2004 2005 2006 2007NGV (LDVs) 260.000 260.000 260.000 263.119 296.358 327.643 344.306 335.205 326.104 358.488 410.000 432.900Stations 262 276 281 298 323 344 402 456 498 535 589 609CNG sold (MNm3) 310 330 335 340 400 448 448 442 442 468 520 588Sweden 1996 1997 1998 1999 2000 2001 2002 2003 2004 2005 2006 2007NGVs 204 657 1.079 1.374 1.725 2.000 3.309 4.248 5.298 7.897 12.119 14.536Stations 8 14 19 22 26 31 39 48 65 85 97 115CNG and CBG sold (Nm3x1000) 4.308 7.137 9.862 11.335 13.950 16.678 20.125 25.434 28.872 35.450 43.856 53.636Switzerland 1996 1997 1998 1999 2000 2001 2002 2003 2004 2005 2006 2007NGVs 20 30 60 80 100 150 350 650 1.250 1.965 3.313 5.830Stations 3 3 7 13 14 20 26 37 50 64 78 97CNG and CBG sold (Nm3x1000) 220 451 840 994 1.575 1.859 2.281 3.054 4.422 658
World’s top 10 NGV countries

European NGV statistics
July 2010 Gas Vehicles Report32
www.ngvgroup.com • Visit the biggest NGV portal in the world
Fuel prices in Europe
All data shown on this work sheet is result of a work conducted by The GVR and NGVA Europe.
All data shown on this work sheet is result of a work conducted by The GVR and NGVA Europe.
Country
Natural Gas Vehicles Refuelling stations
VRA Monthly gas consumption (M Nm3) Last updateTotal Cars/LDVs MD/HD
BusesMD/HDTrucks Others Total Public Private Planned
CountryPremiumGasoline
(Euro/litre)
RegularGasoline
(Euro/litre)
Diesel(Euro/litre)
CNG(Euro/Nm³)
CNG priceequivalent perlitre gasoline
CNG priceequivalent per
litre diesel
Armenia 0,67 0,63 0,61 0,32 0,29 0,33Austria 1,36 1,29 1,19 0,61 0,55 0,63Belgium 1,32 1,01 0,73 0,65 0,75Bulgaria 0,96 0,92 0,76 0,72 0,80Croatia 0,84 0,83 0,86 0,45 0,40 0,46Czech Republic 1,19 1,15 0,63 0,56 0,65Finland 1,31 1,05 1,07 0,96 1,10France 1,35 1,09 0,87 0,78 0,89Germany 1,11 1,15 0,90 0,54 0,92Greece 1,19 1,04 0,65 0,58 0,67Iceland 1,58 1,46 1,42 0,79 0,71 0,81Italy 1,05 1,16 0,53 0,50 0,55Lithuania 1,12 1,10 0,96 0,75 0,67 0,77Luxembourg 1,11 0,92 0,63 0,56 0,65Netherlands 1,44 1,08 0,56 0,50 0,58Norway 1,61 1,57 1,45 0,69 0,62 0,71Poland 1,08 0,00 0,51 0,46 0,52Portugal 1,35 1,11 0,45 0,40 0,46Russia 0,57 0,48 0,41 0,19 0,17 0,19Serbia 0,91 0,82 0,65 0,58 0,67Slovakia 1,21 1,01 0,61 0,55 0,63Spain 1,10 1,00 0,73 0,57 0,64
Italy 676.850 673.350 2.300 1.200 770 725 45 70 199 62,03 129,06 48,1% December 2009Ukraine 200.019 10.000120.000 70.000 19 283 91 192 40 8 83,00 417,80 19,9% November 2009Armenia 101.352 69.971 9.831 19.626 1.924 275 9 266 14 28,50 57,88 49,2% September 2009Russia 100.020 57.000 8.000 35.000 20 249 202 47 12 27,71 62,26 44,5% December 2009Germany 85.000 79650 1550 3650 150 863 776 87 150 804 14,60 21,91 66,6% December 2009Bulgaria 60.236 60.000 216 20 81 80 1 13 13,00 11,46 113,4% April 2010Sweden 23.125 21.749 963 412 1 134 104 30 55 21 6,77 7,13 94,8% December 2009France 12.450 9.500 2.100 850 125 15 110 1.290 8,69 0,0% December 2008Switzerland 8.599 8.348 135 56 60 122 119 3 7 117 1,14 1,96 58,0% December 2009Belarus 5.500 5.500 25 25 3,00 0,99 303,0% December 2007Moldova 5.000 5.000 14 14 1,00 0,90 111,1% December 2007Austria 4.983 4.936 41 6 208 160 48 15 12 0,50 1,02 49,2% January 2010Turkey 3.339 1.850 1.489 14 8 6 35 0,40 4,80 8,3% April 2010Georgia 3.000 3.000 42 42 0,54 0,0% January 2008Poland 2.106 1.502 300 4 300 33 32 1 49 1,19 0,0% August 2009Netherlands 2.032 1.350 542 140 51 35 16 32 558 1,98 0,0% November 2009Czech Republic 2.000 1.665 270 20 45 38 25 13 4 0,67 1,13 59,7% March 2010Spain 1.863 213 847 760 43 42 1 41 21 3,52 3,19 110,5% December 2008Finland 769 650 95 8 16 18 17 1 5 10 0,45 0,41 110,0% February 2010Slovakia 622 287 308 27 8 6 2 4 0,91 1,00 91,1% February 2010Greece 520 0 414 106 2 2 1 1,33 0,0% August 2009Portugal 504 46 354 54 50 5 1 4 3 1,11 1,12 99,6% December 2009Latvia 500 30 10 187 273 4 4 11 0,23 0,0% December 2007Norway 376 212 138 10 16 10 6 4 2 4,55 0,46 987,1% January 2010Serbia 326 320 6 5 4 1 0,015 0,08 19,8% April 2009United Kingdom 294 4 217 73 33 12 21 115 0,40 0,18 224,8% December 2008Luxembourg 215 174 41 7 5 2 2 0,06 0,15 35,9% December 2009Lithuania 150 50 100 3 1 2 3 1 0,200 0,31 64,7% January 2010Belgium 143 143 9 4 5 60 0,03 0,0% December 2008Croatia 130 92 30 8 1 1 0,013 0,04 31,7% April 2009Iceland 120 101 2 17 2 2 1 0,04 0,04 103,2% September 2009Lichtenstein 104 72 31 1 3 3 0,11 0,0% December 2009Hungary 72 30 42 4 1 3 12 0,13 0,13 95,1% December 2008Macedonia 50 7 43 1 1 0,02 0,13 15,4% March 2007Bosnia & Herzegovina 7 7 3 0 3 2 0,00 0,0% December 2007Estonia 4 4 1 1 0,00 0,0% December 2008Ireland 2 2 1 1 1 0,00 0,0% October 2008Montenegro 1 1 0,00 0,0% March 2006Total 1.302.382 1.016.815 150.168 132.401 2.998 3.490 2.531 959 415 3.344 253,72 739,64 34,3% June 2010

ISO 15500
BUREAU VERITAS
Certification
ISO 9000
Nº 224008 / Nº 105507

Take care of tomorrow’s environment... ...today
HEADQUARTERS:
Via dei Lapidari, 3 40129 Bologna ItalyPhone: (+39) 051 4171911Fax: (+39) 051 4171990E-mail: [email protected]
ELECTRONICS & ENGINEERING Div.
Via A. Olivetti, 2410040 Volvera (TO) Italy Phone: (+39) 011 999211 Fax: (+39) 011 9992138E-mail: [email protected]
METATRON ASIA PACIFIC:
Suite 1112, Silver Tower 933Zhongshan (w) Rd Changning District200051 Shanghai - P.R.ChinaPhone: (+86) 021 51113835 / 3935 Fax: (+86) 021 51113677 E-mail: [email protected]
www.metatron.it
Safety is a must in the automotive industry.Metatron constantly implements the systematic and extensive monitoring of each production step. This guarantees the utmost reliability of its final products and components, in full compliance with European Quality Standards
ECE R 110 and R10.
Along with key certifications, Metatron Quality Policy Assurance is underpinned by:
with customers feedback
providing the right quality work and service
Quality and Certifications:Not just a word