Embed Size (px)
Citation preview
Luis del RíoNorth Dakota State University
Developing a Sclerotinia stem rot warning system for canola in
North Dakota
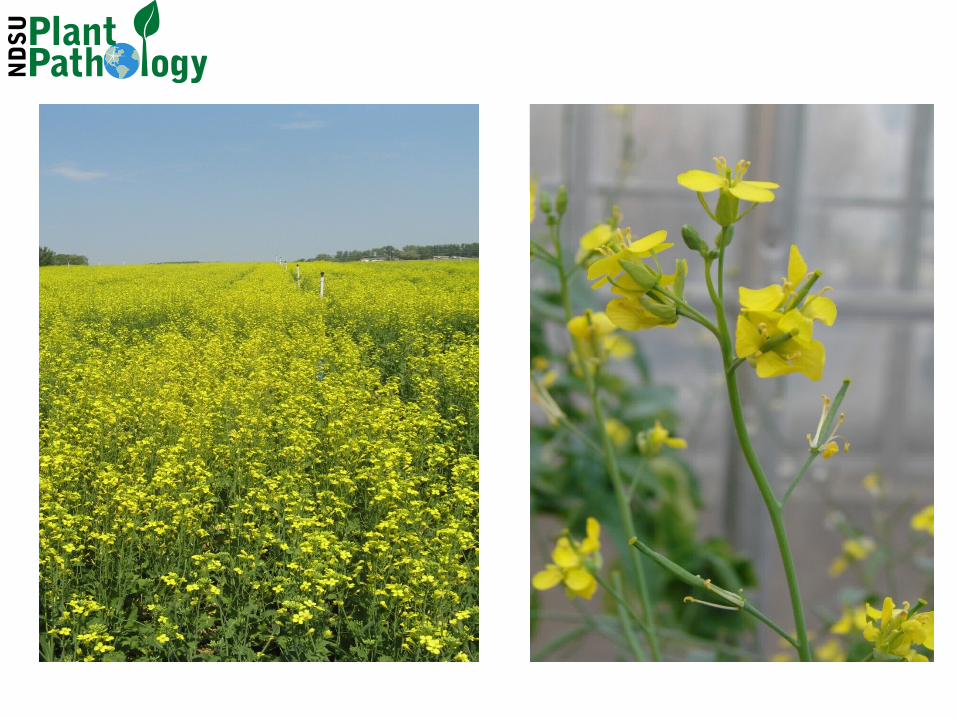
Photo: www.canolacouncil.org
Photo: www.canolacouncil.org
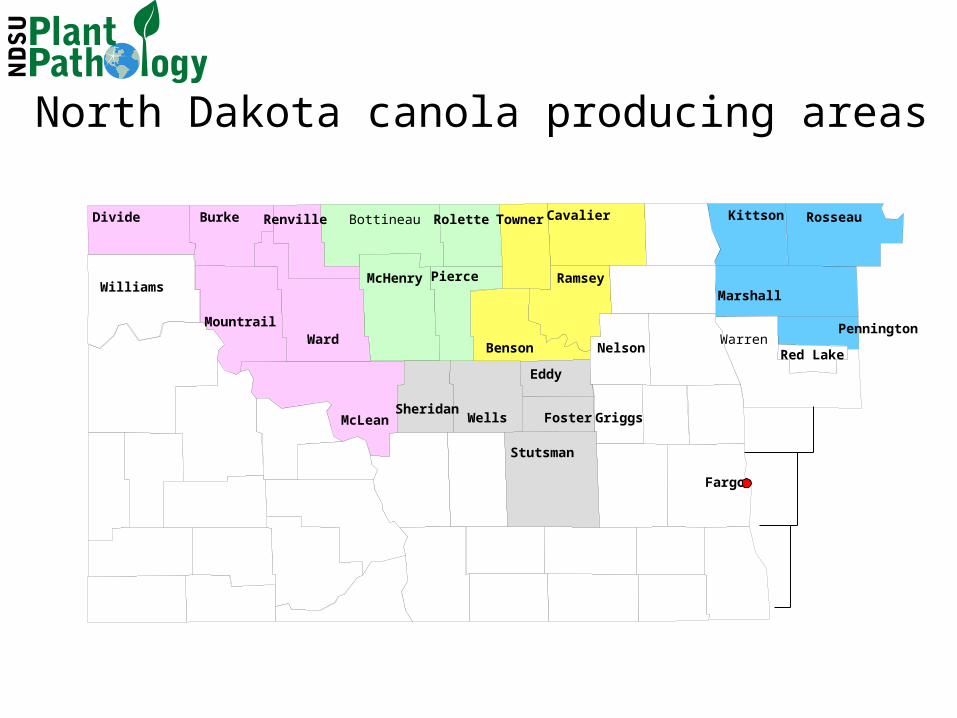
North Dakota canola producing areas
Divide Burke Renville Rolette Towner Cavalier
Mountrail
Williams
Ward
McHenry Pierce
Benson
Ramsey
Wells Foster
Eddy
Stutsman
GriggsMcLean
Bottineau RosseauKittson
Marshall
PenningtonWarren
Red Lake
Sheridan
Nelson
Fargo
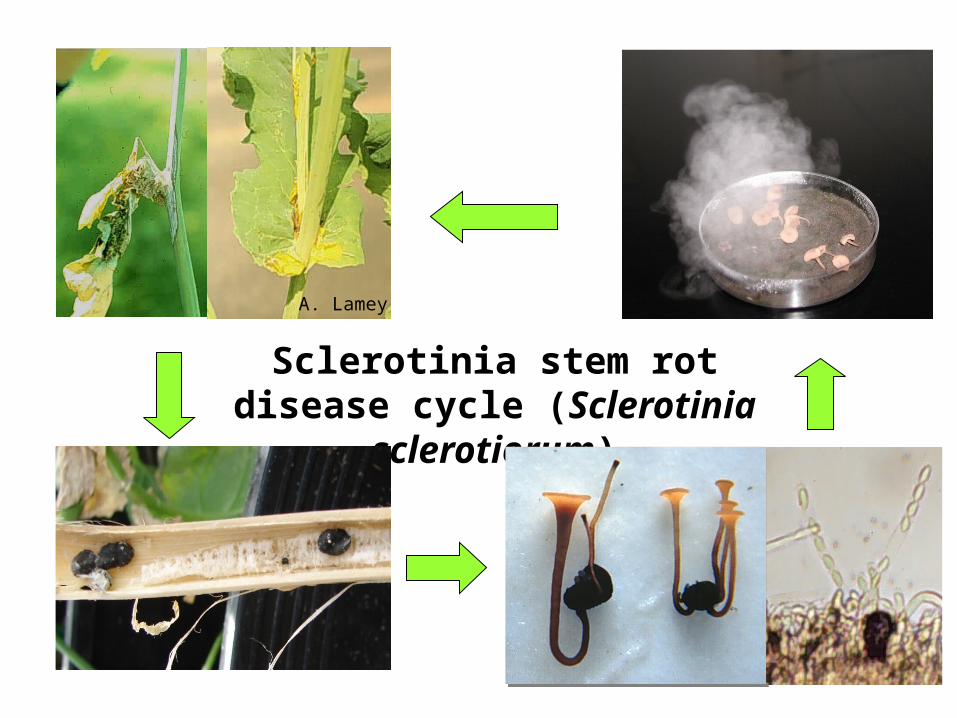
Sclerotinia stem rot disease cycle (Sclerotinia sclerotiorum)
A. Lamey
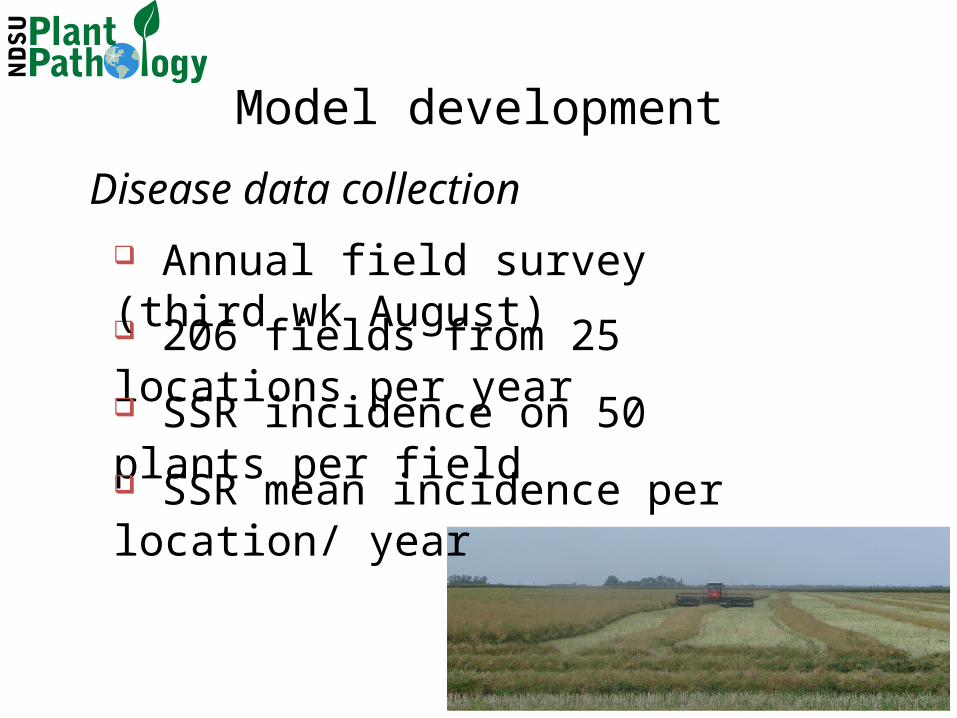
Model development
206 fields from 25 locations per year
SSR incidence on 50 plants per field
Annual field survey (third wk August)
Disease data collection
SSR mean incidence per location/ year
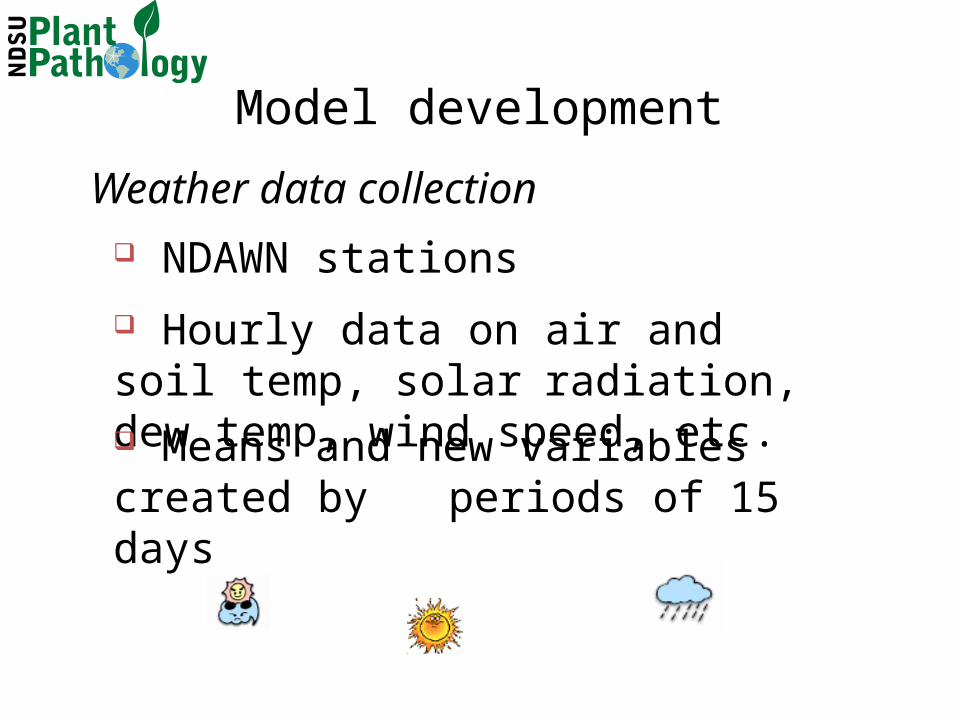
NDAWN stations Hourly data on air and soil temp, solar
radiation, dew temp, wind speed, etc. Means and new variables created by
periods of 15 days
Weather data collection
Model development
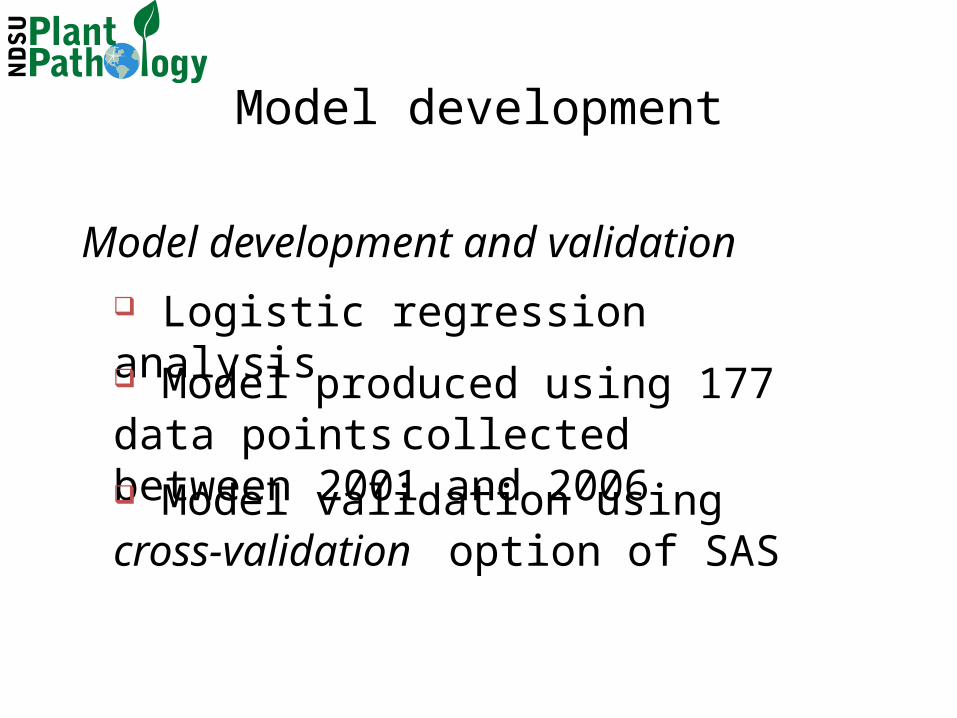
Logistic regression analysis Model produced using 177 data points
collected between 2001 and 2006 Model validation using cross-validation
option of SAS
Model development and validation
Model development
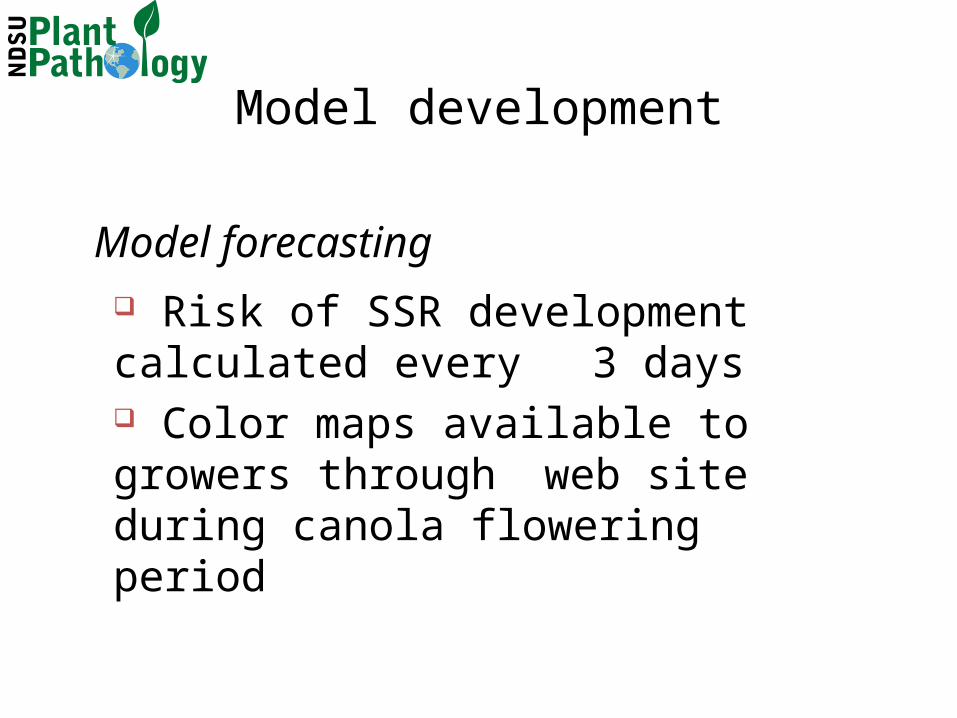
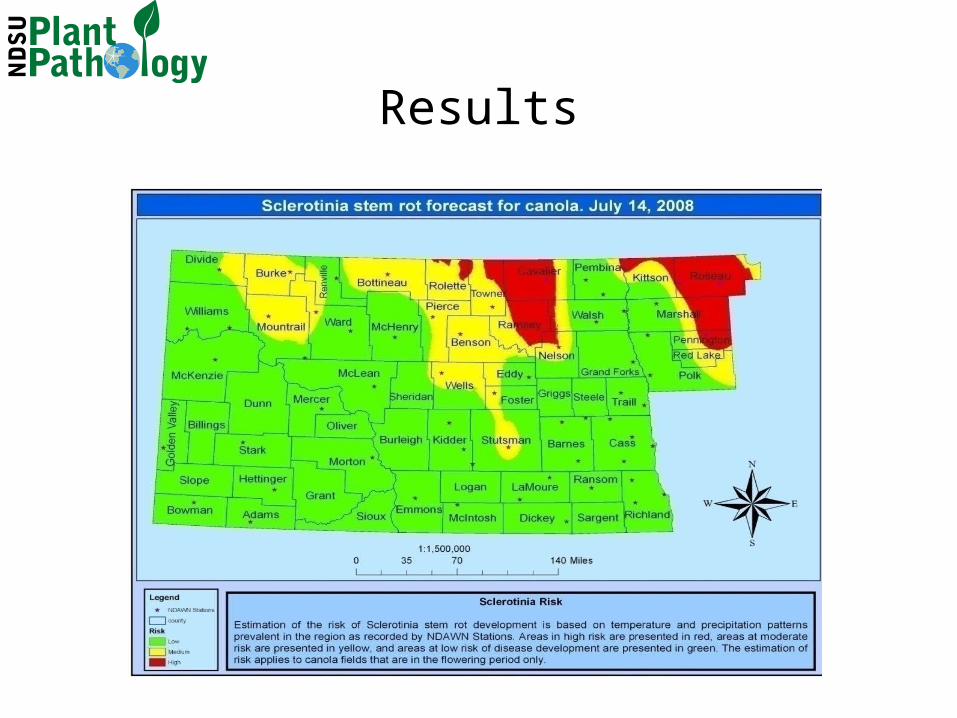
Risk of SSR development calculated every 3 days
Color maps available to growers through web site during canola flowering period
Model forecasting
Model development

Incidence of Sclerotinia stem rot of canola in North Dakota between 1995 and 2008
'95
'96
'97
'98
'99
'00
'01
'02
'03
'04
'05
'06
'07
'08
02468
1012141618
Inci
denc
e (%
)
Years
Results
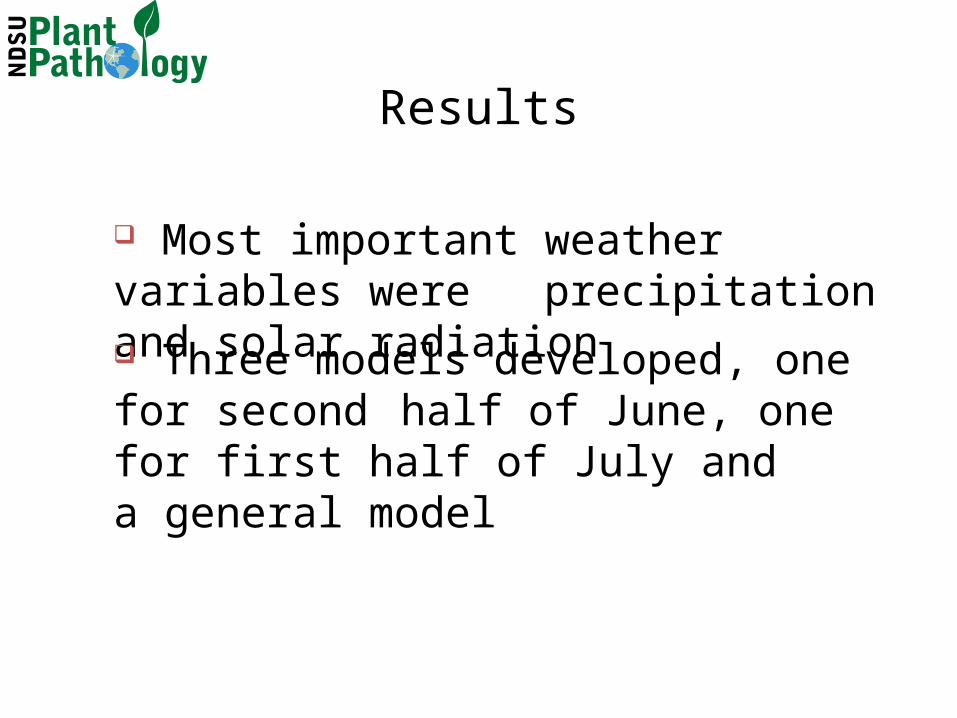
Most important weather variables were precipitation and solar radiation
Three models developed, one for second half of June, one for first half of July and a general model
Results
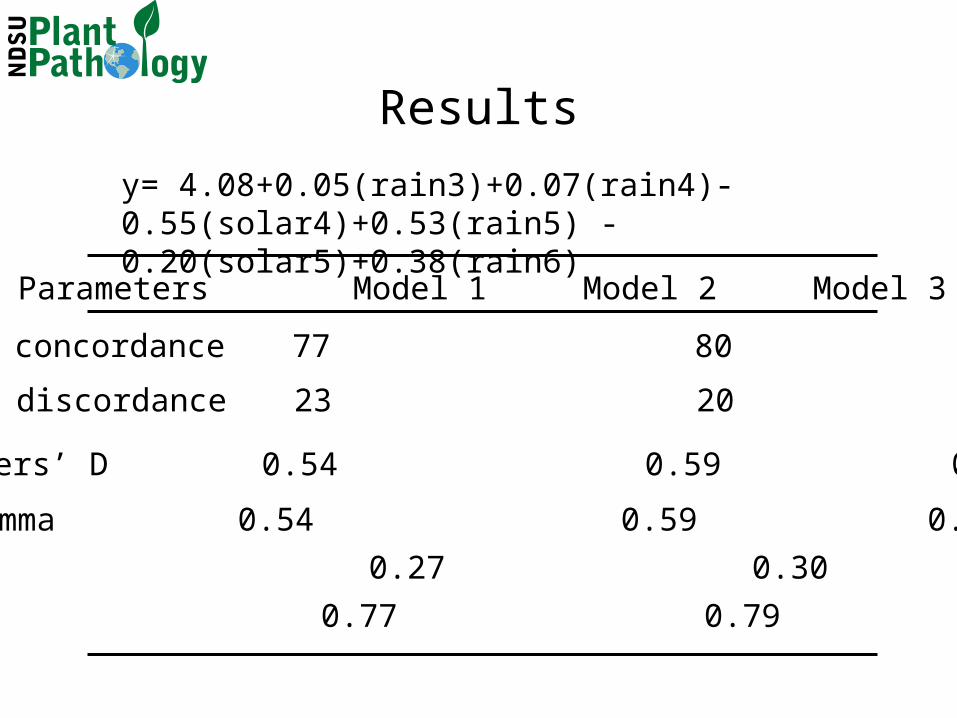
Percent concordance 77 80 83
Percent discordance 23 20 17
Somers’ D 0.54 0.59 0.66
Gamma 0.54 0.59 0.66
Parameters Model 1 Model 2 Model 3
Tau- a 0.27 0.30 0.33c 0.77 0.79 0.83
Resultsy= 4.08+0.05(rain3)+0.07(rain4)-0.55(solar4)+0.53(rain5)
-0.20(solar5)+0.38(rain6)
Results
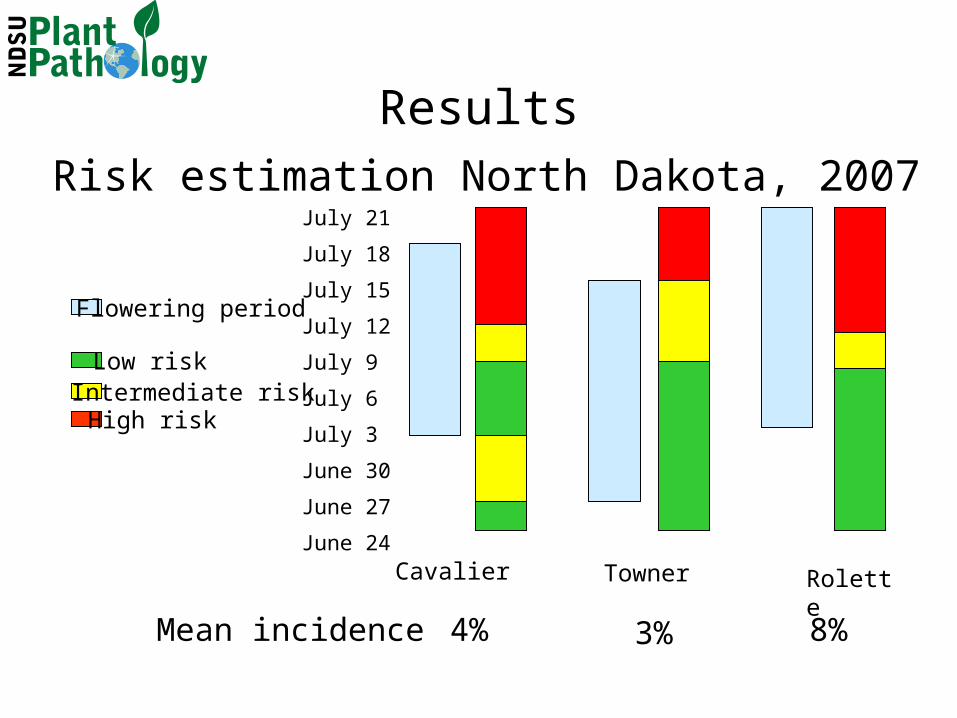
Risk estimation North Dakota, 2007
Flowering period
Low riskIntermediate riskHigh risk
July 21
July 18
July 15
July 12
July 9
July 6
July 3
June 30
June 27
June 24Cavalier Towner Rolette
3% 8%4%Mean incidence
Results
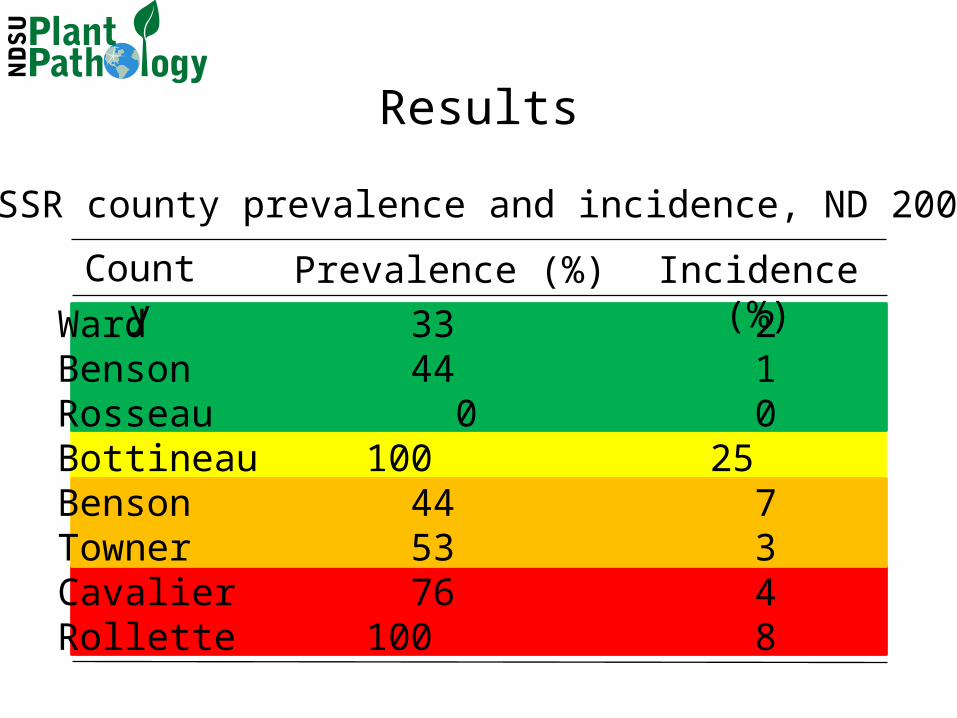
WardBensonRosseauBottineauBensonTownerCavalierRollette
33 44 0100 44 53 76100
2 1 025 7 3 4 8
Prevalence (%) Incidence (%)County
SSR county prevalence and incidence, ND 2007
Results
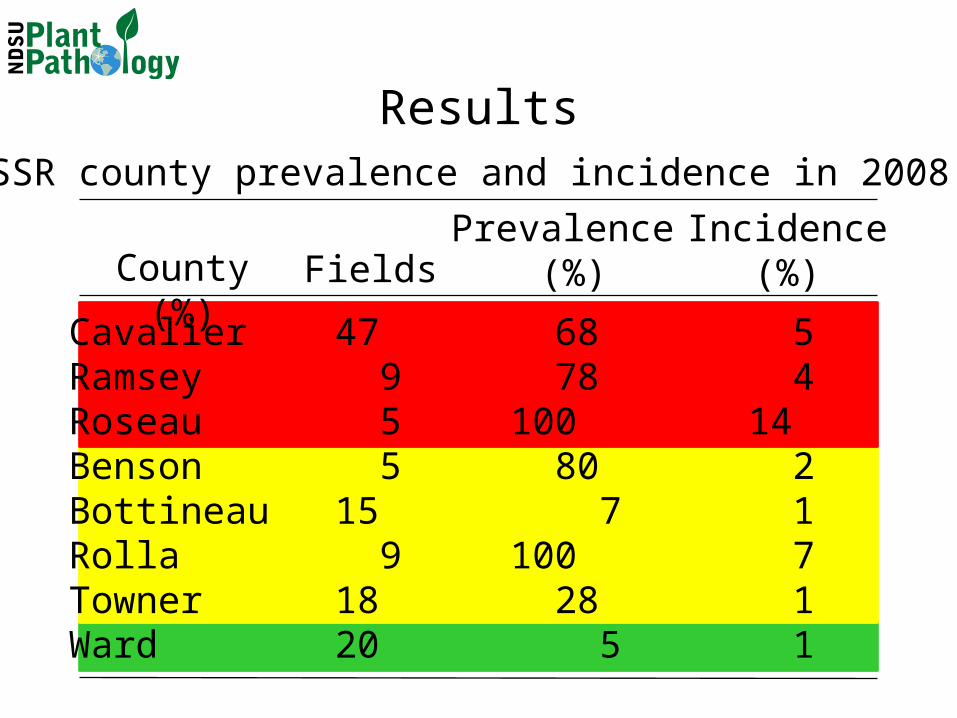
CavalierRamseyRoseauBensonBottineauRollaTownerWard
68 78100 80 7100 28 5
5 414 2 1 7 1 1
Prevalence (%)
Incidence(%)County (%)
SSR county prevalence and incidence in 2008
47 9 5 515 91820
Fields
Results
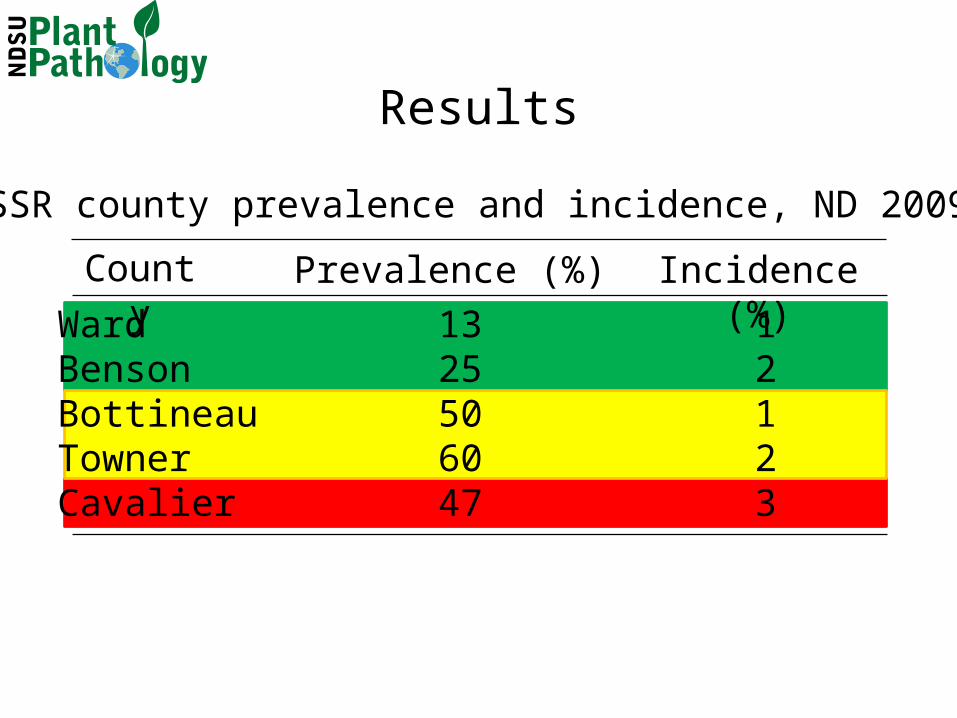
WardBensonBottineauTownerCavalier
13 25 50 60 47
1 2 1 2 3
Prevalence (%) Incidence (%)County
SSR county prevalence and incidence, ND 2009
Results
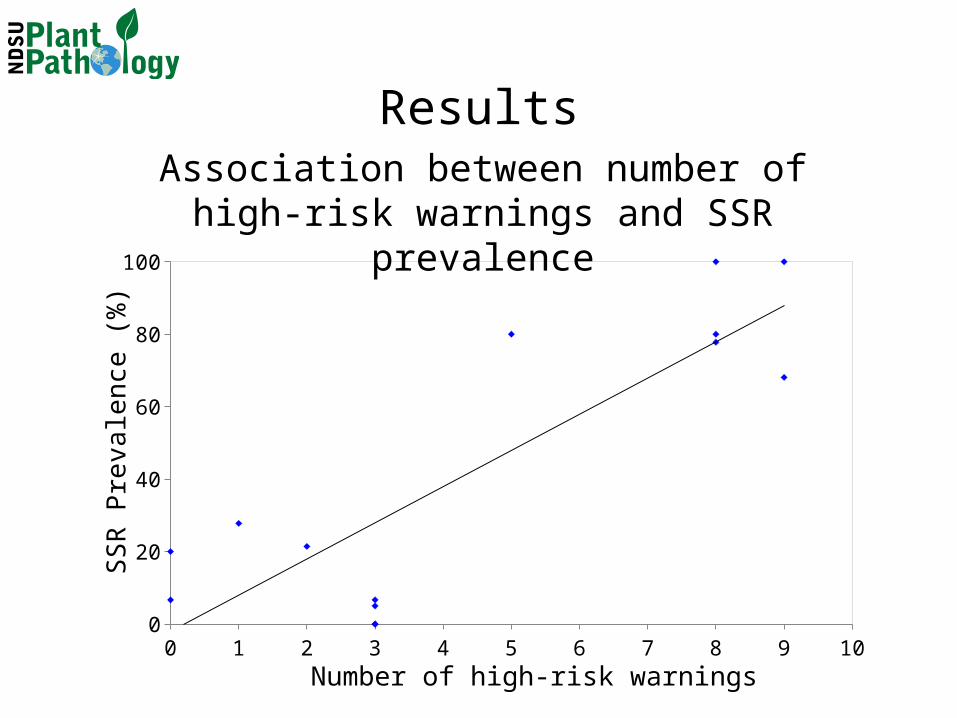
SS
R P
reva
len
ce (
%)
Number of high-risk warnings0 1 2 3 4 5 6 7 8 9 10
0
20
40
60
80
100
Association between number of high-risk warnings and SSR prevalence
Results
Summary
Empirical model developed using weather data
Overall accuracy of model is approximately 75%
Prevalence of high risk warnings associated with higher SSR prevalence
Model improvement is needed Areas were collaboration is sought:
- Modeling leaf wetness duration- Use of Doppler radar data- Quantification of risk of apothecia
formation
Summary
Acknowledgements
Curt Doetkott, ITS NDSU scouts and county
agents USDA-ARS/Sclerotinia
Initiative North Dakota Canola
Growers Association