Embed Size (px)
Citation preview
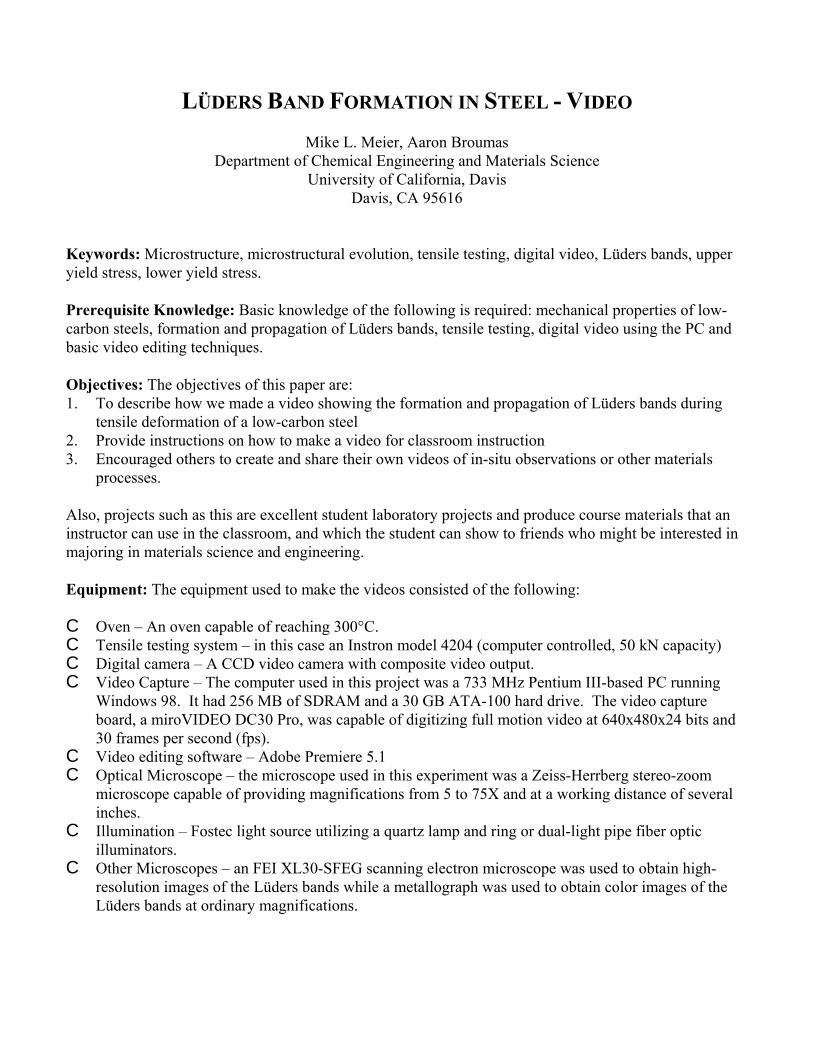
LÜDERS BAND FORMATION IN STEEL - VIDEO
Mike L. Meier, Aaron BroumasDepartment of Chemical Engineering and Materials Science
University of California, DavisDavis, CA 95616
Keywords: Microstructure, microstructural evolution, tensile testing, digital video, Lüders bands, upperyield stress, lower yield stress.
Prerequisite Knowledge: Basic knowledge of the following is required: mechanical properties of low-carbon steels, formation and propagation of Lüders bands, tensile testing, digital video using the PC andbasic video editing techniques.
Objectives: The objectives of this paper are:1. To describe how we made a video showing the formation and propagation of Lüders bands during
tensile deformation of a low-carbon steel 2. Provide instructions on how to make a video for classroom instruction3. Encouraged others to create and share their own videos of in-situ observations or other materials
processes.
Also, projects such as this are excellent student laboratory projects and produce course materials that aninstructor can use in the classroom, and which the student can show to friends who might be interested inmajoring in materials science and engineering.
Equipment: The equipment used to make the videos consisted of the following:
C Oven – An oven capable of reaching 300°C.C Tensile testing system – in this case an Instron model 4204 (computer controlled, 50 kN capacity)C Digital camera – A CCD video camera with composite video output.C Video Capture – The computer used in this project was a 733 MHz Pentium III-based PC running
Windows 98. It had 256 MB of SDRAM and a 30 GB ATA-100 hard drive. The video captureboard, a miroVIDEO DC30 Pro, was capable of digitizing full motion video at 640x480x24 bits and30 frames per second (fps).
C Video editing software – Adobe Premiere 5.1C Optical Microscope – the microscope used in this experiment was a Zeiss-Herrberg stereo-zoom
microscope capable of providing magnifications from 5 to 75X and at a working distance of severalinches.
C Illumination – Fostec light source utilizing a quartz lamp and ring or dual-light pipe fiber opticilluminators.
C Other Microscopes – an FEI XL30-SFEG scanning electron microscope was used to obtain high-resolution images of the Lüders bands while a metallograph was used to obtain color images of theLüders bands at ordinary magnifications.
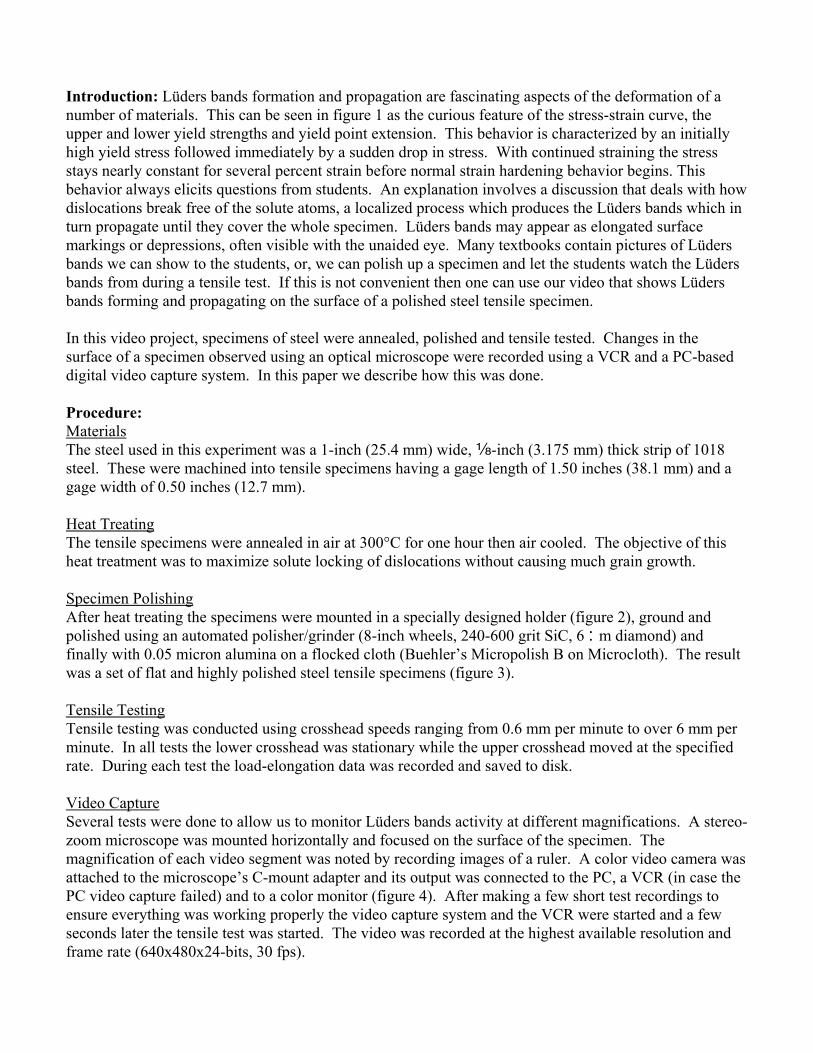
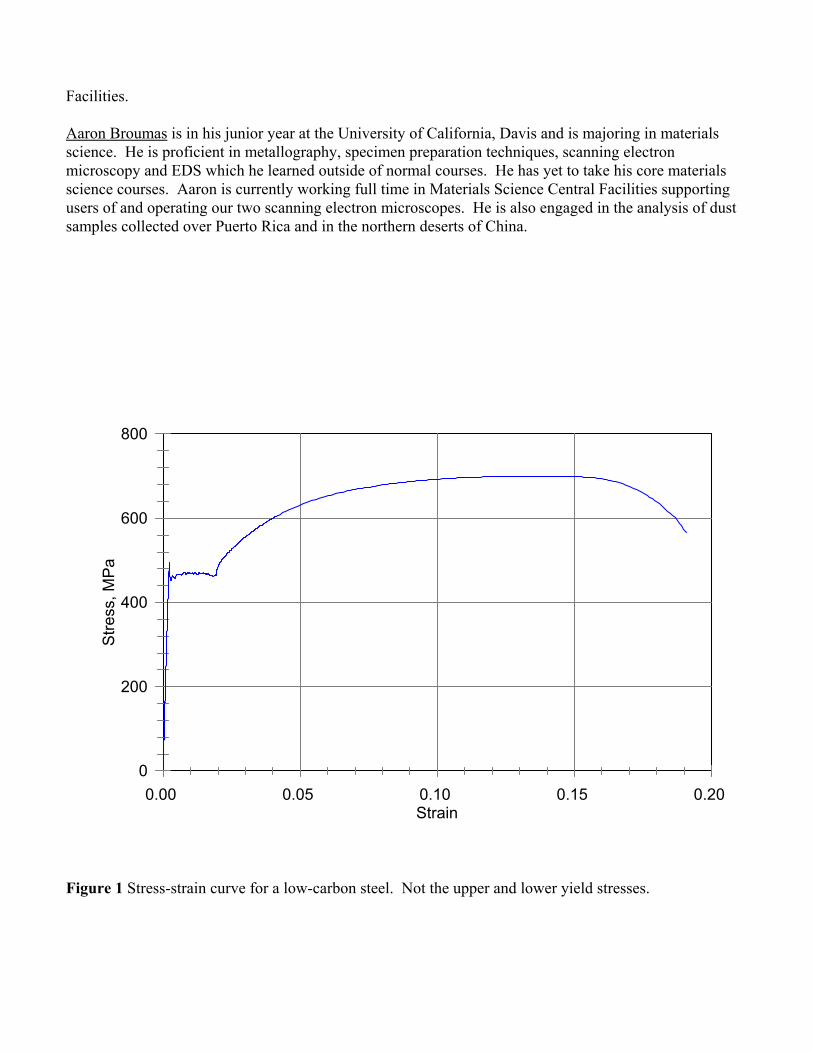
Introduction: Lüders bands formation and propagation are fascinating aspects of the deformation of anumber of materials. This can be seen in figure 1 as the curious feature of the stress-strain curve, theupper and lower yield strengths and yield point extension. This behavior is characterized by an initiallyhigh yield stress followed immediately by a sudden drop in stress. With continued straining the stressstays nearly constant for several percent strain before normal strain hardening behavior begins. Thisbehavior always elicits questions from students. An explanation involves a discussion that deals with howdislocations break free of the solute atoms, a localized process which produces the Lüders bands which inturn propagate until they cover the whole specimen. Lüders bands may appear as elongated surfacemarkings or depressions, often visible with the unaided eye. Many textbooks contain pictures of Lüdersbands we can show to the students, or, we can polish up a specimen and let the students watch the Lüdersbands from during a tensile test. If this is not convenient then one can use our video that shows Lüdersbands forming and propagating on the surface of a polished steel tensile specimen.
In this video project, specimens of steel were annealed, polished and tensile tested. Changes in thesurface of a specimen observed using an optical microscope were recorded using a VCR and a PC-baseddigital video capture system. In this paper we describe how this was done.
Procedure:MaterialsThe steel used in this experiment was a 1-inch (25.4 mm) wide, c-inch (3.175 mm) thick strip of 1018steel. These were machined into tensile specimens having a gage length of 1.50 inches (38.1 mm) and agage width of 0.50 inches (12.7 mm).
Heat TreatingThe tensile specimens were annealed in air at 300°C for one hour then air cooled. The objective of thisheat treatment was to maximize solute locking of dislocations without causing much grain growth.
Specimen PolishingAfter heat treating the specimens were mounted in a specially designed holder (figure 2), ground andpolished using an automated polisher/grinder (8-inch wheels, 240-600 grit SiC, 6 :m diamond) andfinally with 0.05 micron alumina on a flocked cloth (Buehler’s Micropolish B on Microcloth). The resultwas a set of flat and highly polished steel tensile specimens (figure 3).
Tensile TestingTensile testing was conducted using crosshead speeds ranging from 0.6 mm per minute to over 6 mm perminute. In all tests the lower crosshead was stationary while the upper crosshead moved at the specifiedrate. During each test the load-elongation data was recorded and saved to disk.
Video CaptureSeveral tests were done to allow us to monitor Lüders bands activity at different magnifications. A stereo-zoom microscope was mounted horizontally and focused on the surface of the specimen. Themagnification of each video segment was noted by recording images of a ruler. A color video camera was attached to the microscope’s C-mount adapter and its output was connected to the PC, a VCR (in case thePC video capture failed) and to a color monitor (figure 4). After making a few short test recordings toensure everything was working properly the video capture system and the VCR were started and a fewseconds later the tensile test was started. The video was recorded at the highest available resolution andframe rate (640x480x24-bits, 30 fps).
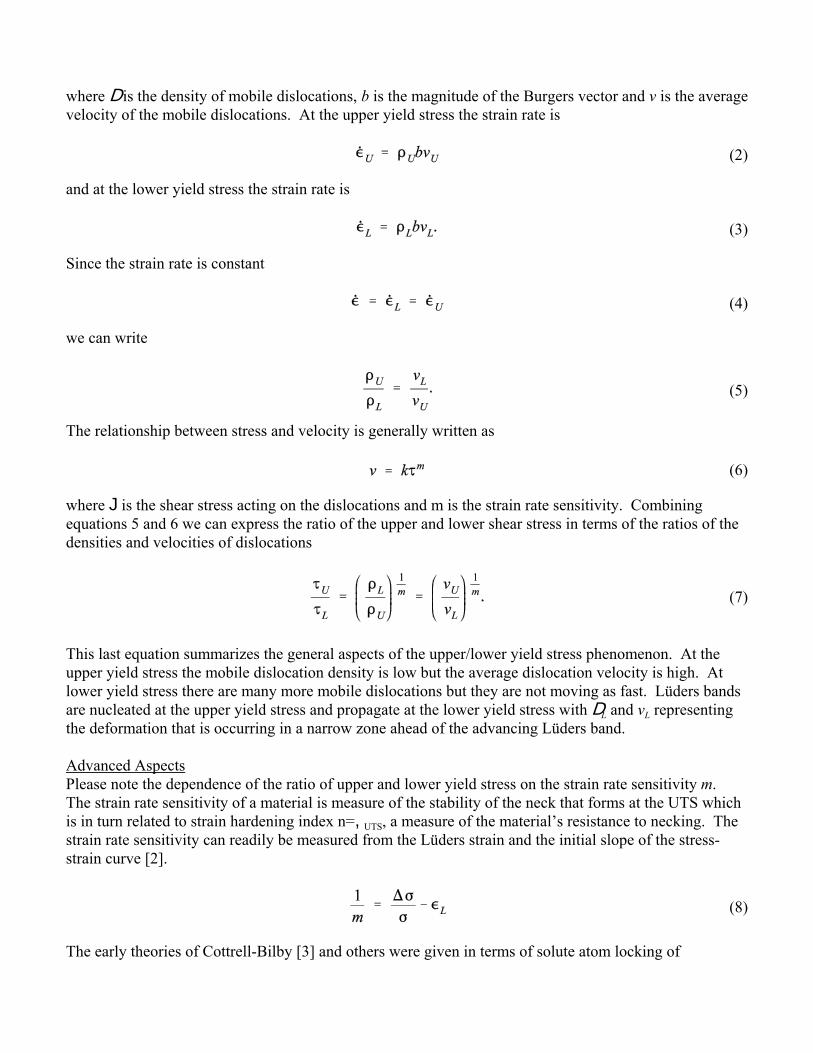
A total of seven tests were conducted and recorded, many giving poor results due to poor lighting. Properillumination of the specimen was difficult due to the highly reflective nature of the specimen and the lowcontrast of the Lüders bands. The original setup consisted of a color camera with a macro lens and a lightsource consisting of a dual light-pipe illuminator and a polarizer (figure 5). These problems were solvedby doing all recordings using the stereo-zoom microscope and a ring illuminator (figure 6). The resultingvideos were similar to microstructures seen using dark-field illumination. The specimen itself appearsdark with bright edges and the Lüders bands showed up as bright streaks on the otherwise dark specimen.
Video ProcessingAll video processing was done on the same PC that was used for the video capture. Adobe Premiere wasused to create the title screens, transitions and micron bars, to cut and splice the video and to assemble thefinal video. The final video shows segments of three different tests. It starts by showing the wholespecimen as it is deformed. About half way through the video two segments showing the close-up viewsof individual Lüders bands. The final video was produced in three formats: 640x480x24-bits,320x240x24-bits and 160x120x24 bits, all at a frame rate of 15 fps. These videos were also accelerated sothat their runtimes would be less than the recommended three minutes.
CD-ROMThe videos, the data from the tensile tests, several frames from the videos and SEM and opticalmicroscope images were written to a CD-ROM.
Comments: Videos such as this one are challenging projects and fun to do with students. They have theadded benefit of producing something which can be used to help teach other students. This projectrequires a thorough understanding of the phenomenon, the testing procedures, advanced computer skillsand a knack for presenting the results in a straightforward manner. It also requires a degree of creativityand promotes a sense of ownership which motivates students to do their very best work.
This video, like the videos showing the orange peal surface develop in annealed brass that we made a fewyears ago [1], was meant to be used as a short video clip in which the instructor provides the backgroundinformation and narration. The appendix at the end of this paper summarizes some of the details of thesharp yielding phenomenon and Lüders band formation.
This video, the tensile test data, and still images may be downloaded from our web site atwww.matsci.ucdavis.edu/ meier/NEW-Update2001. Note that the 640x480 video is a 108 MB file and the320x240 video is in the neighborhood of 40 MB. Download times may be impractical and you will alsoneed enough hard drive space to store these large files. If you would like to get a copy of these videos youcan write or email the authors to request copies of the CD-ROM.
References:1. M.L.Meier, K.H.Ewald, The Underlying Structure of Engineering Materials, Proceedings of the
National Educator’s Workshop-Update 98, Brookhaven National Laboratory (1998).
Biographical Information:Michael L. Meier received his B.S. in Materials Engineering from North Carolina State University in1979 and his M.S. (1986) and Ph.D. (1991) in Materials Science and Engineering from the University ofCalifornia, Davis. After a two-year post-doctorate position at the Universität Erlangen-Nürnberg inErlangen, Germany he returned to UC Davis where he is now the director of Materials Science Central
0
200
400
600
800
Stre
ss, M
Pa
0.00 0.05 0.10 0.15 0.20 Strain
Figure 1 Stress-strain curve for a low-carbon steel. Not the upper and lower yield stresses.
Facilities.
Aaron Broumas is in his junior year at the University of California, Davis and is majoring in materialsscience. He is proficient in metallography, specimen preparation techniques, scanning electronmicroscopy and EDS which he learned outside of normal courses. He has yet to take his core materialsscience courses. Aaron is currently working full time in Materials Science Central Facilities supportingusers of and operating our two scanning electron microscopes. He is also engaged in the analysis of dustsamples collected over Puerto Rica and in the northern deserts of China.
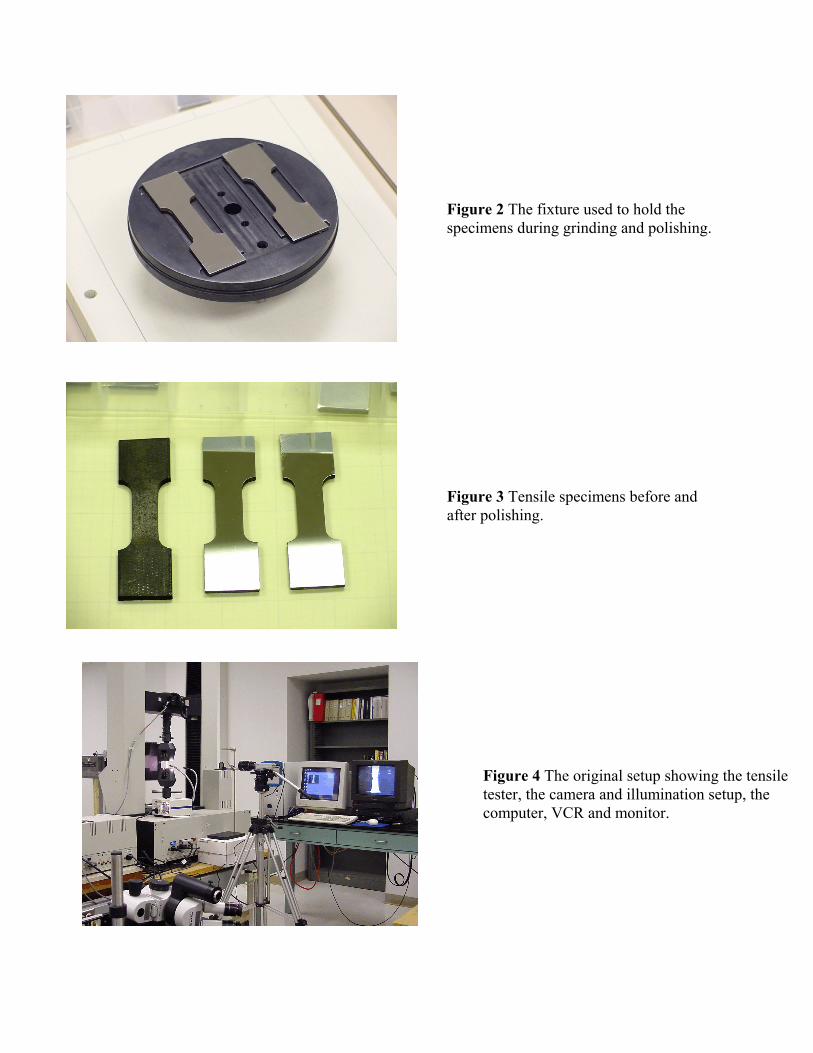
Figure 2 The fixture used to hold thespecimens during grinding and polishing.
Figure 4 The original setup showing the tensiletester, the camera and illumination setup, thecomputer, VCR and monitor.
Figure 3 Tensile specimens before andafter polishing.
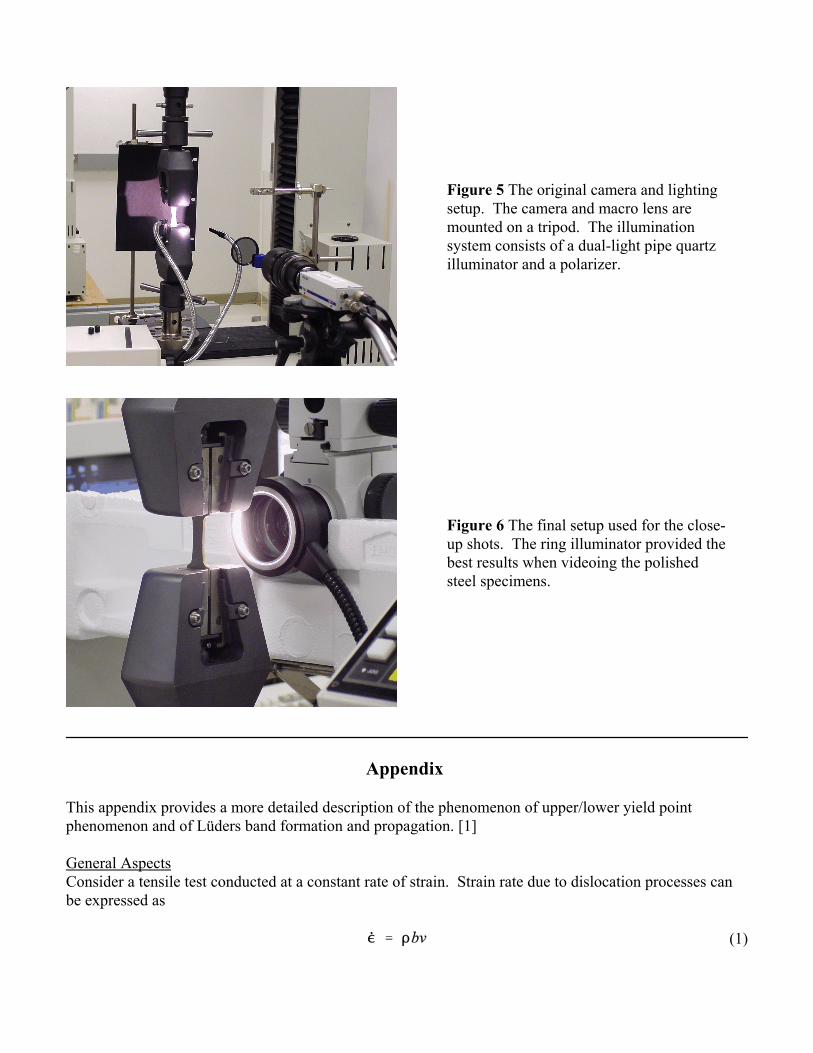
Figure 5 The original camera and lightingsetup. The camera and macro lens aremounted on a tripod. The illuminationsystem consists of a dual-light pipe quartzilluminator and a polarizer.
Figure 6 The final setup used for the close-up shots. The ring illuminator provided thebest results when videoing the polishedsteel specimens.
(1)
Appendix
This appendix provides a more detailed description of the phenomenon of upper/lower yield pointphenomenon and of Lüders band formation and propagation. [1]
General AspectsConsider a tensile test conducted at a constant rate of strain. Strain rate due to dislocation processes canbe expressed as
(2)
(3)
(4)
(5)
(6)
(7)
(8)
where D is the density of mobile dislocations, b is the magnitude of the Burgers vector and v is the averagevelocity of the mobile dislocations. At the upper yield stress the strain rate is
and at the lower yield stress the strain rate is
Since the strain rate is constant
we can write
The relationship between stress and velocity is generally written as
where J is the shear stress acting on the dislocations and m is the strain rate sensitivity. Combiningequations 5 and 6 we can express the ratio of the upper and lower shear stress in terms of the ratios of thedensities and velocities of dislocations
This last equation summarizes the general aspects of the upper/lower yield stress phenomenon. At theupper yield stress the mobile dislocation density is low but the average dislocation velocity is high. Atlower yield stress there are many more mobile dislocations but they are not moving as fast. Lüders bandsare nucleated at the upper yield stress and propagate at the lower yield stress with DL and vL representingthe deformation that is occurring in a narrow zone ahead of the advancing Lüders band.
Advanced AspectsPlease note the dependence of the ratio of upper and lower yield stress on the strain rate sensitivity m. The strain rate sensitivity of a material is measure of the stability of the neck that forms at the UTS whichis in turn related to strain hardening index n=,UTS, a measure of the material’s resistance to necking. Thestrain rate sensitivity can readily be measured from the Lüders strain and the initial slope of the stress-strain curve [2].
The early theories of Cottrell-Bilby [3] and others were given in terms of solute atom locking of
(9)
(10)
dislocations. Initially, dislocations are pinned but at the upper yield strength they break away, the mobiledislocation density increases, the dislocation velocity decreases and the stress decreases to the lower yieldstress. A later theory proposed by Petch [4] addressed the effect of grain size on the upper yield stress. Atthe upper yield stress only a few grains contain mobile dislocations and these dislocations move quicklyrelative to the average velocity for the whole specimen. As more grains acquire mobile dislocations thevelocity drops, the macroscopic stress drops and so does the stress required to penetrate grain boundaries. A Lüders band forms and from that point on the number of active grains remains constant as it propagatesthrough the specimen.
The Hall-Petch equation
where d is the grain size and Ff is a the inherent strength of the material without grain boundaries, definesthe lower yield stress. In Petch’s model Ff is expressed as
where F0 is the inherent strength when all grains are deforming uniformly and N is the number of activegrains per unit volume. The difference between the upper and lower yield stresses is given by the secondterm in the equation above.
As for the lower yield stress, an important factor is the extension of deformation past or through grainboundaries. The lower yield stress was seen as the stress forcing grain boundaries ahead of the Lüdersband and the propagation of the Lüders band involves a process of generating dislocations in the nextgrain, adjacent to the boundary.
Practical AspectsIt is difficult to measure the true upper yield stress due to practical difficulties in testing, such as thespecimen design, grip design, alignment, etc. Consequently the lower yield stress is usually consideredthe material’s yield strength. When these difficulties have been eliminated experiments have shown thatthe upper yield stress can be twice as high as the lower yield stress.
Lüders bands, also called stretcher strains, are unsightly and may spoil the finish during sheet formingoperations. Prior rolling can minimize this, but strain aging can restore it. Strain aging sufficient to causestretcher strains can occur after a few days at room temperature or only an hour at 60-100°C.
References1. Honeycombe, The Plastic Deformation of Metals, Edward Arnold, London, pp.149-157 (1984).2. U.F.Kochs, A.S.Argon and M.F.Ashby, Thermodymanics of Slip, Pergamon Press, Oxford, pp. 261-
264 (1975).3. A.H.Cottrell and B.A.Bilby, Proc. Phys. Soc, A62, 490 (1949).4. N.J.Petch, The Upper Yield Strength of Polycrystalline Iron, Acta Met. 12, 59 (1964).