Embed Size (px)
DESCRIPTION
LT SPICE TUTORIAL
Citation preview
LTSpice: Basics

The purpose of this presentation is to get you familiar with the basics of LTSpice. Advanced functions and features will follow in subsequent presentations.
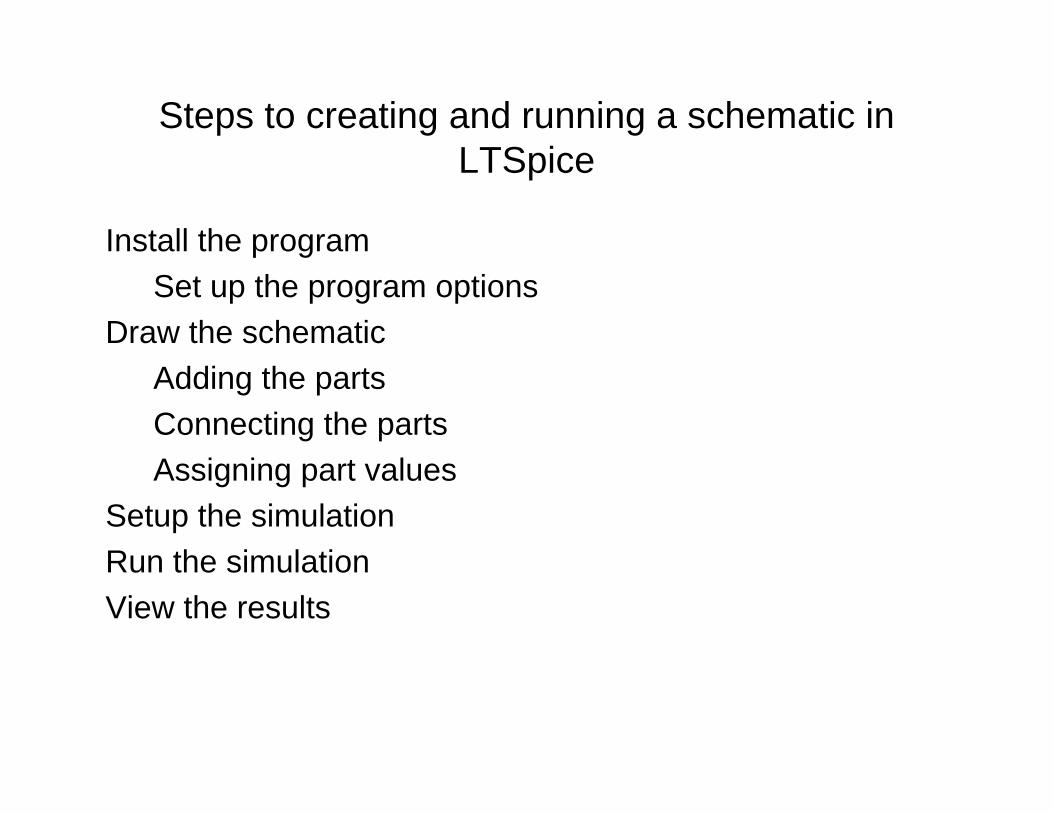
Steps to creating and running a schematic in LTSpice
Install the programSet up the program options
Draw the schematicAdding the partsConnecting the partsAssigning part values
Setup the simulationRun the simulationView the results
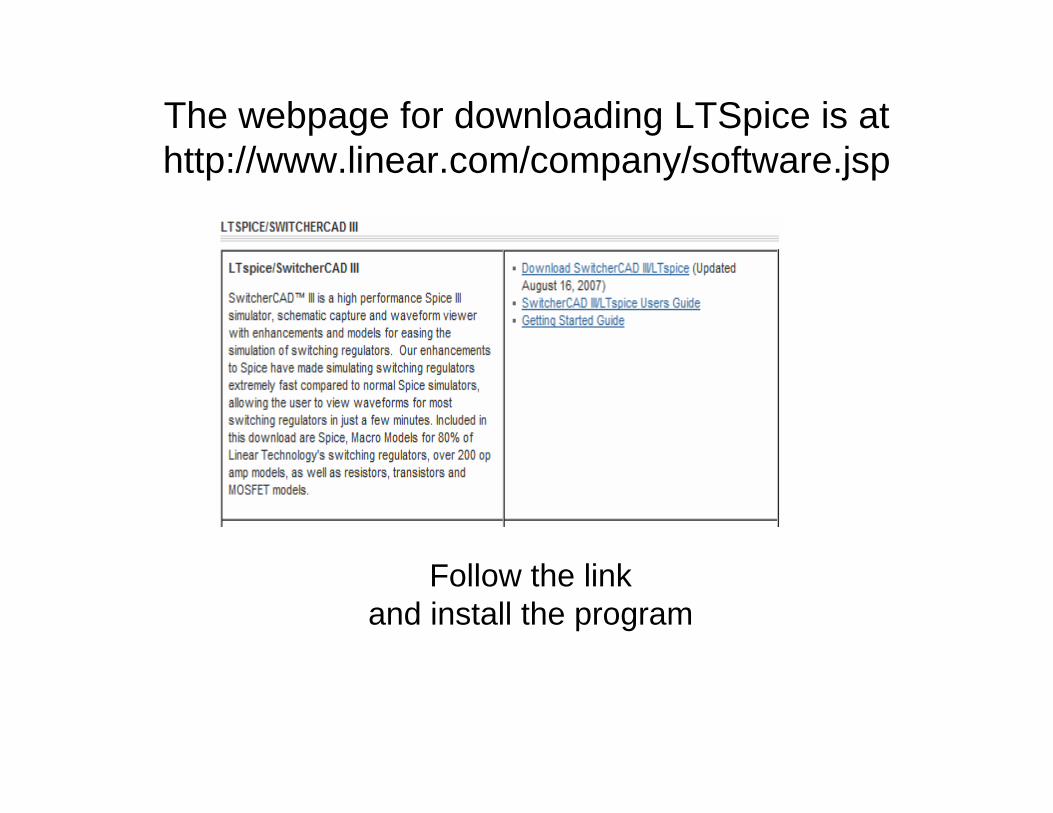
The webpage for downloading LTSpice is at http://www.linear.com/company/software.jsp
Follow the linkand install the program

Open the program to begin.
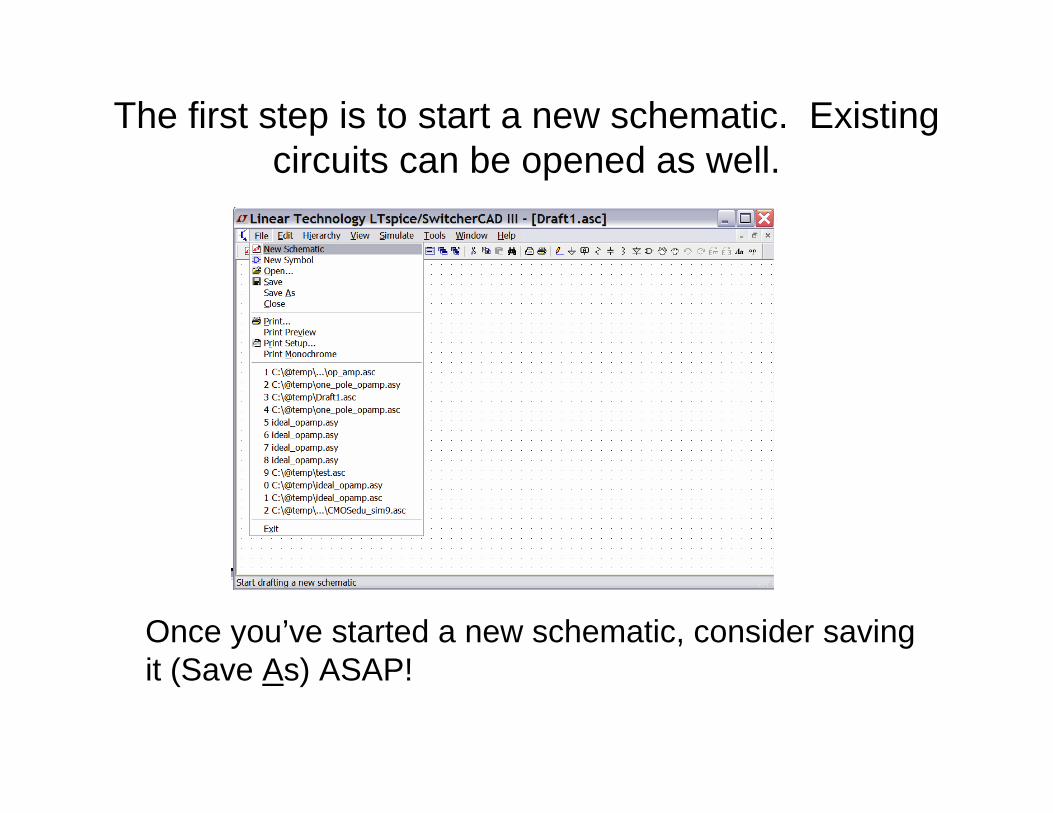
The first step is to start a new schematic. Existing circuits can be opened as well.
Once you’ve started a new schematic, consider saving it (Save As) ASAP!
Once you have LTSpice installed, there are a few options you can set, if you like, such as color preferences for the backgrounds for schematics and waveform plots.
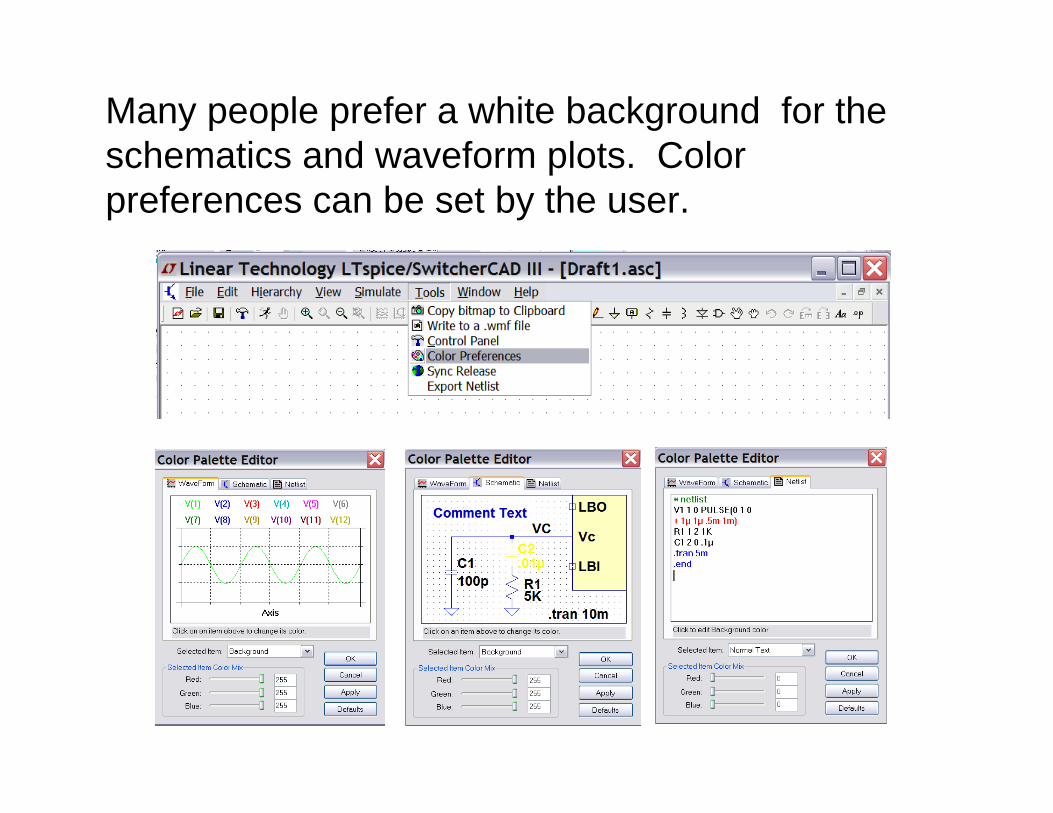
Many people prefer a white background for the schematics and waveform plots. Color preferences can be set by the user.
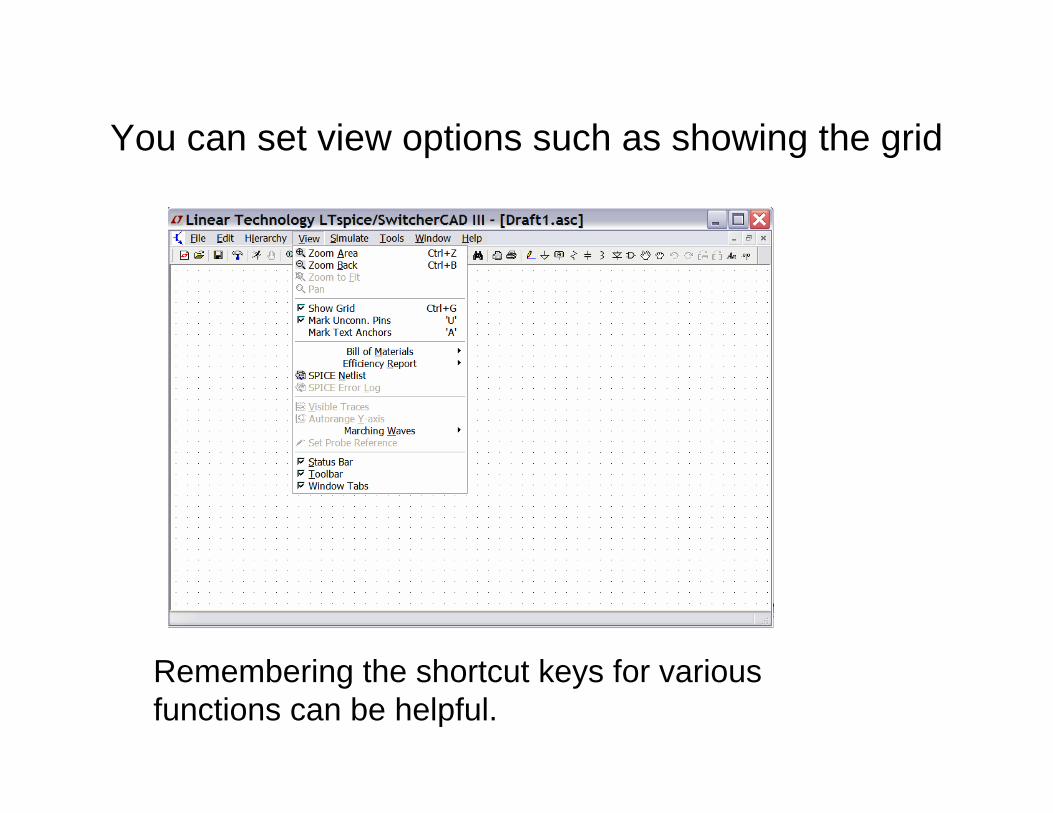
You can set view options such as showing the grid
Remembering the shortcut keys for various functions can be helpful.
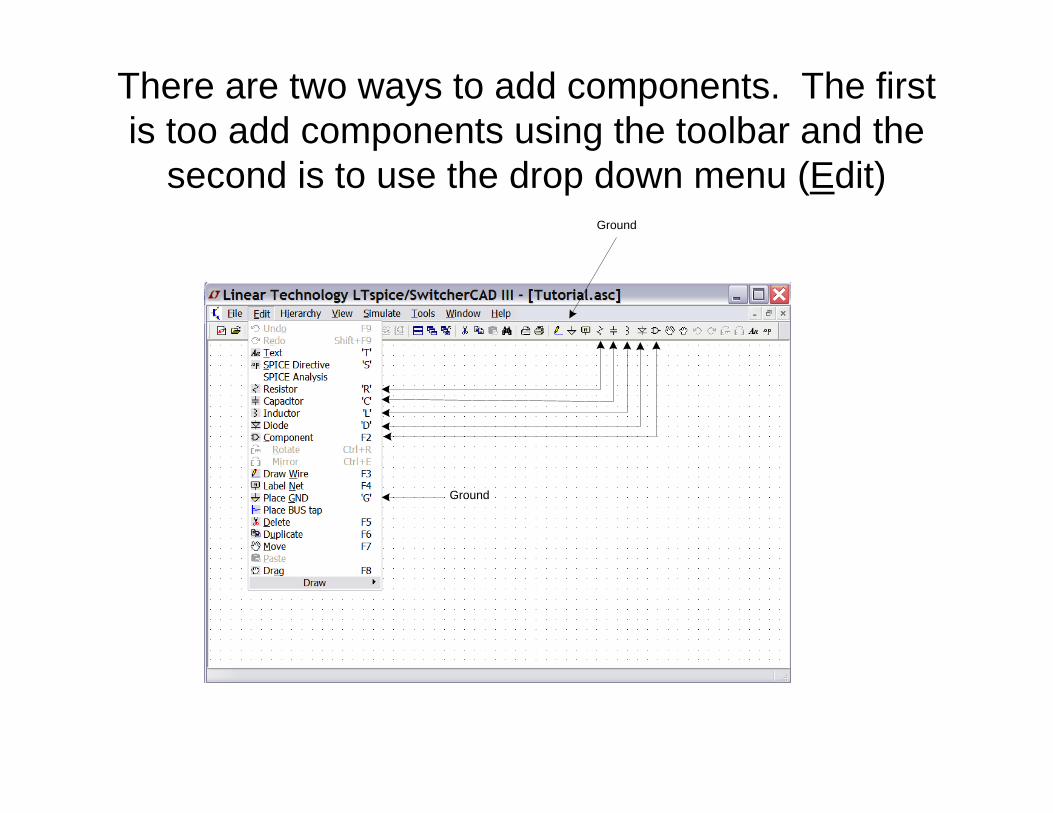
There are two ways to add components. The first is too add components using the toolbar and the
second is to use the drop down menu (Edit)
Ground
Ground
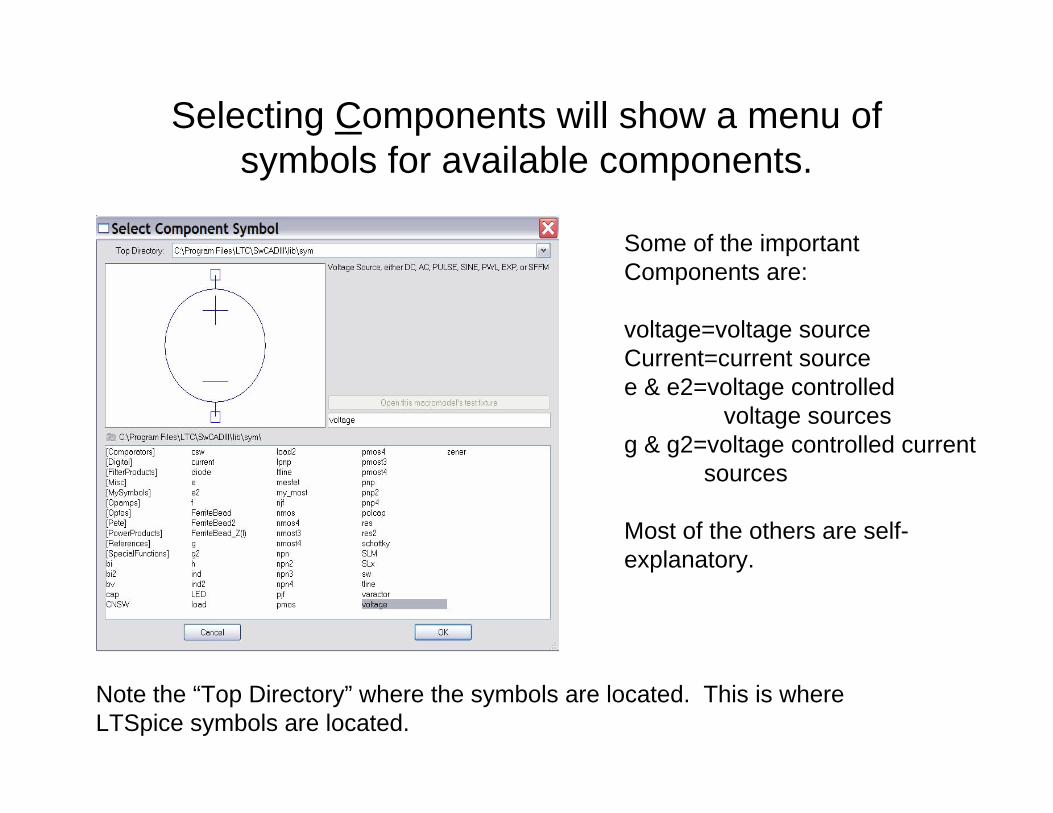
Selecting Components will show a menu of symbols for available components.
Some of the importantComponents are:
voltage=voltage sourceCurrent=current sourcee & e2=voltage controlled
voltage sourcesg & g2=voltage controlled current
sources
Most of the others are self-explanatory.
Note the “Top Directory” where the symbols are located. This is whereLTSpice symbols are located.
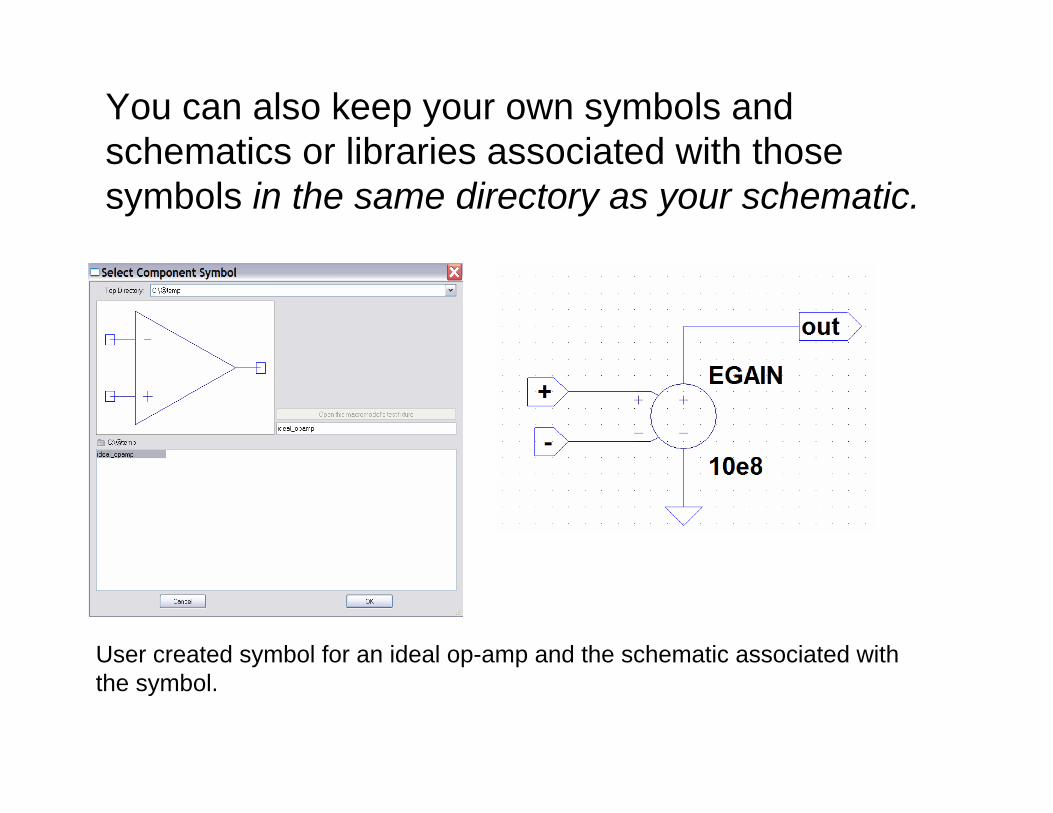
You can also keep your own symbols and schematics or libraries associated with those symbols in the same directory as your schematic.
User created symbol for an ideal op-amp and the schematic associated withthe symbol.
Let’s build an op-amp based inverting amplifier
The steps to drawing a schematic are:
Draw the schematicAdding the partsConnecting the partsAssigning part values
These steps assume that you have created a project directory and downloadedthe symbol and schematic for an ideal op-amp and placed it in your project directory.If you haven’t down this, you can use an op-amp provided by LTSpice.
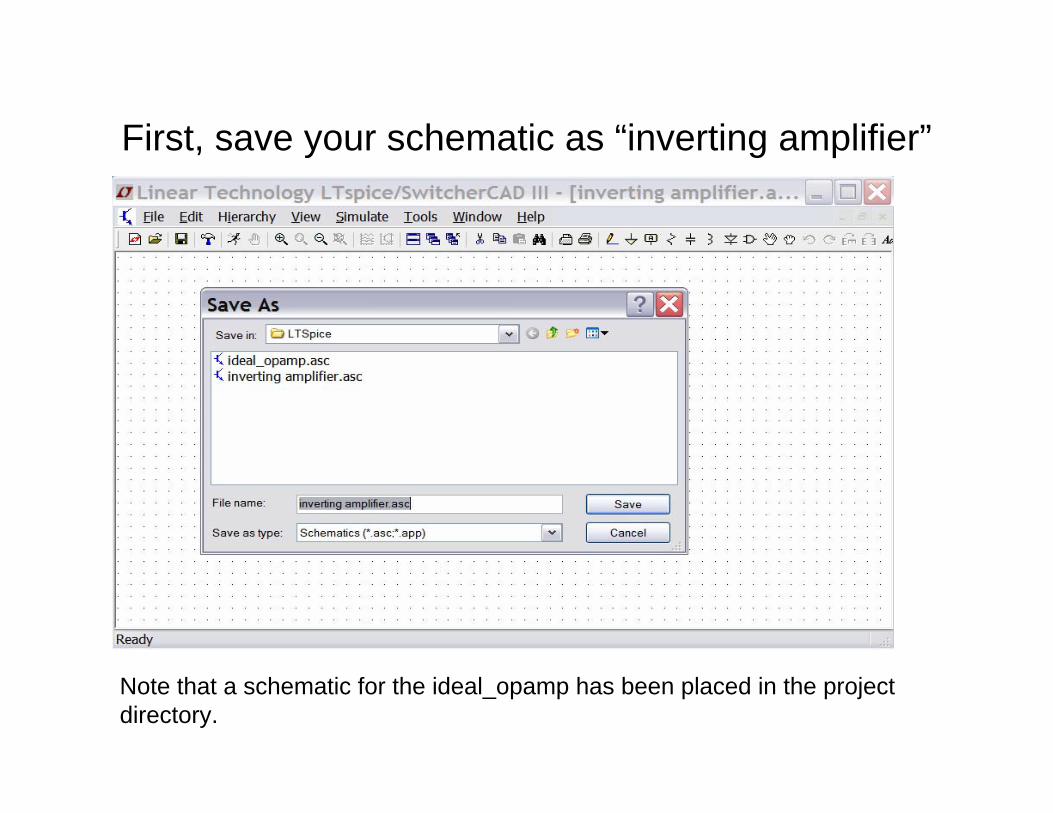
First, save your schematic as “inverting amplifier”
Note that a schematic for the ideal_opamp has been placed in the projectdirectory.
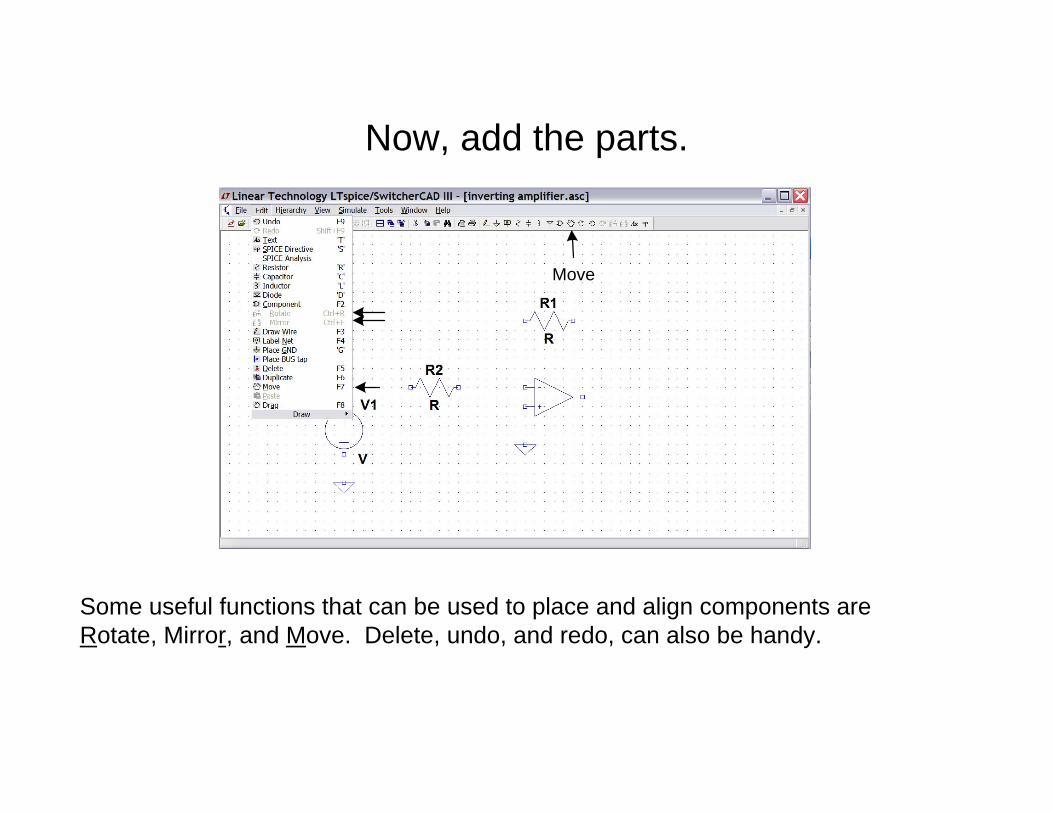
Now, add the parts.
Move
Some useful functions that can be used to place and align components areRotate, Mirror, and Move. Delete, undo, and redo, can also be handy.
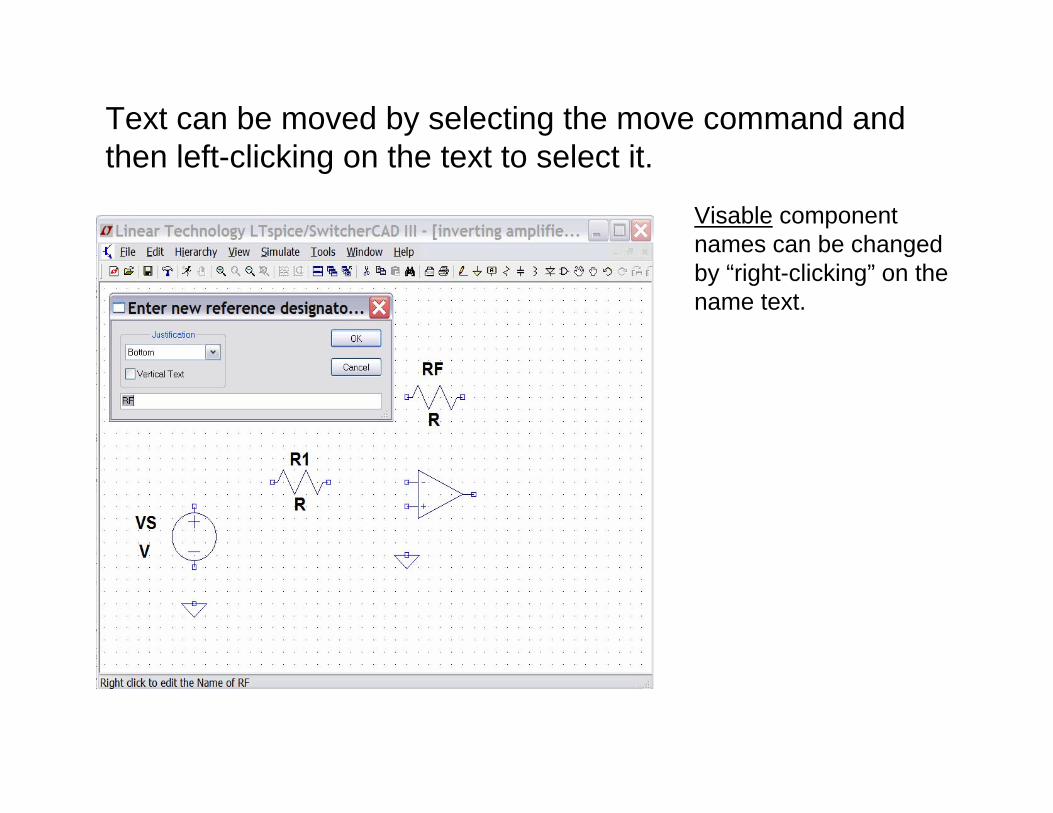
Text can be moved by selecting the move command and then left-clicking on the text to select it.
Visable component names can be changedby “right-clicking” on the name text.
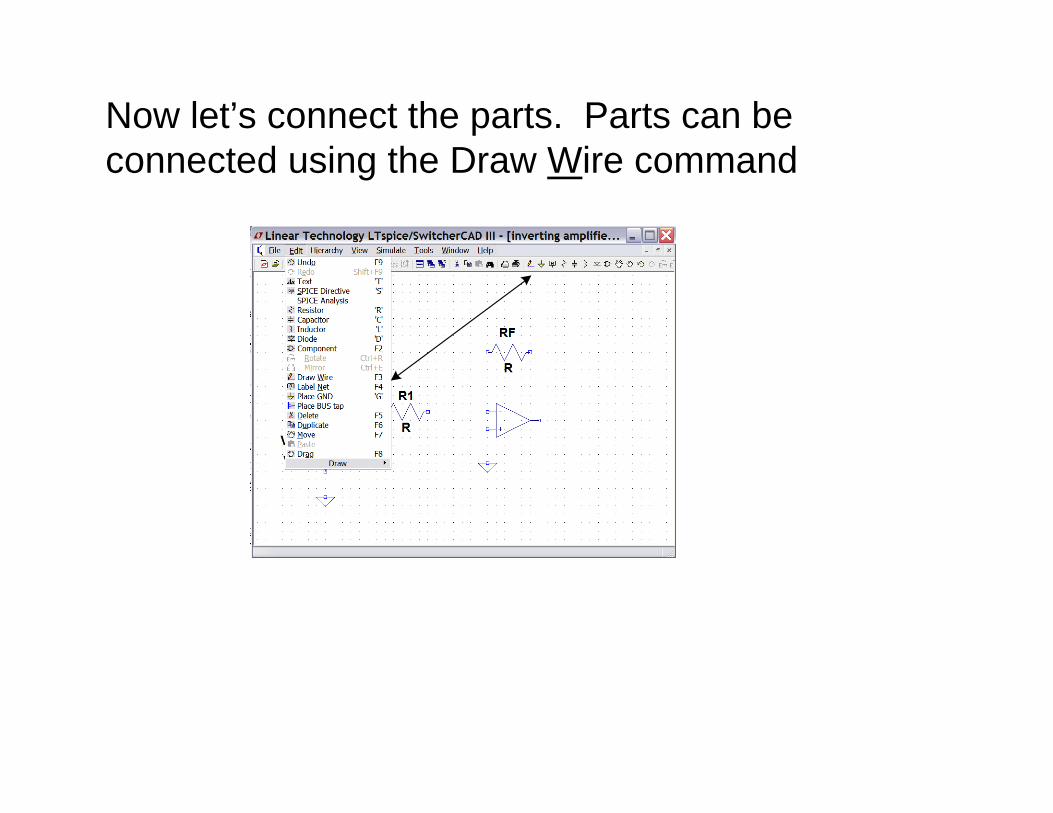
Now let’s connect the parts. Parts can be connected using the Draw Wire command
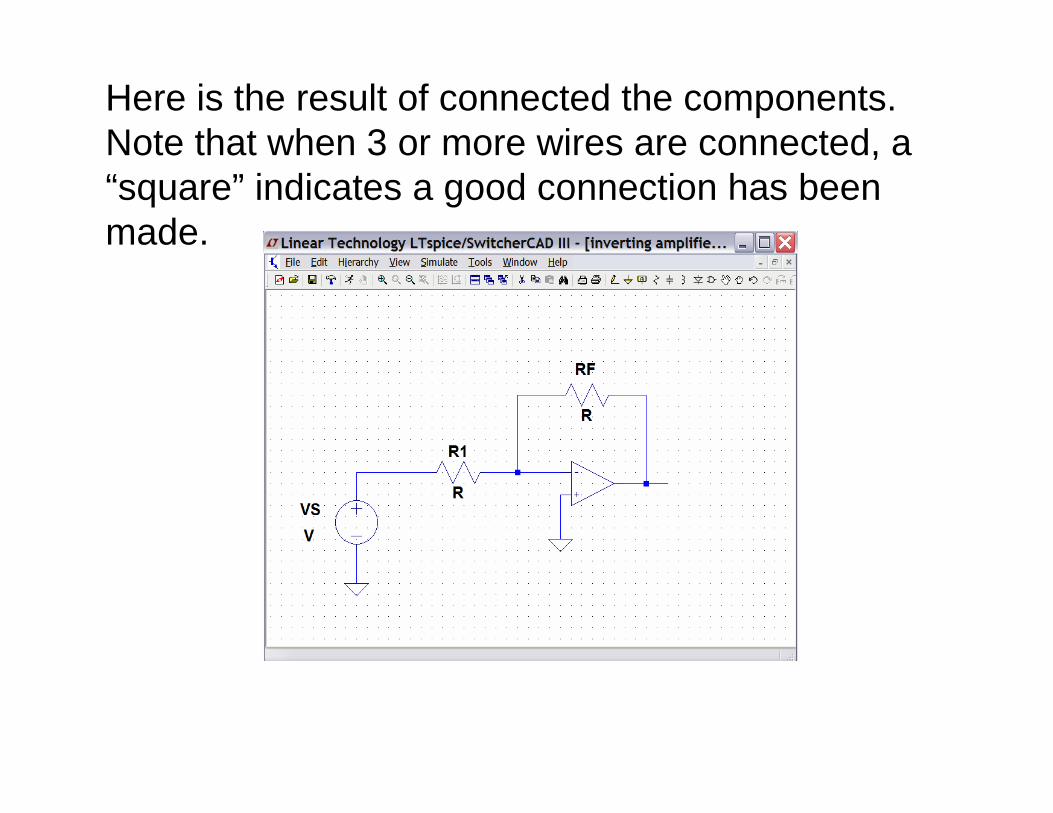
Here is the result of connected the components. Note that when 3 or more wires are connected, a “square” indicates a good connection has been made.
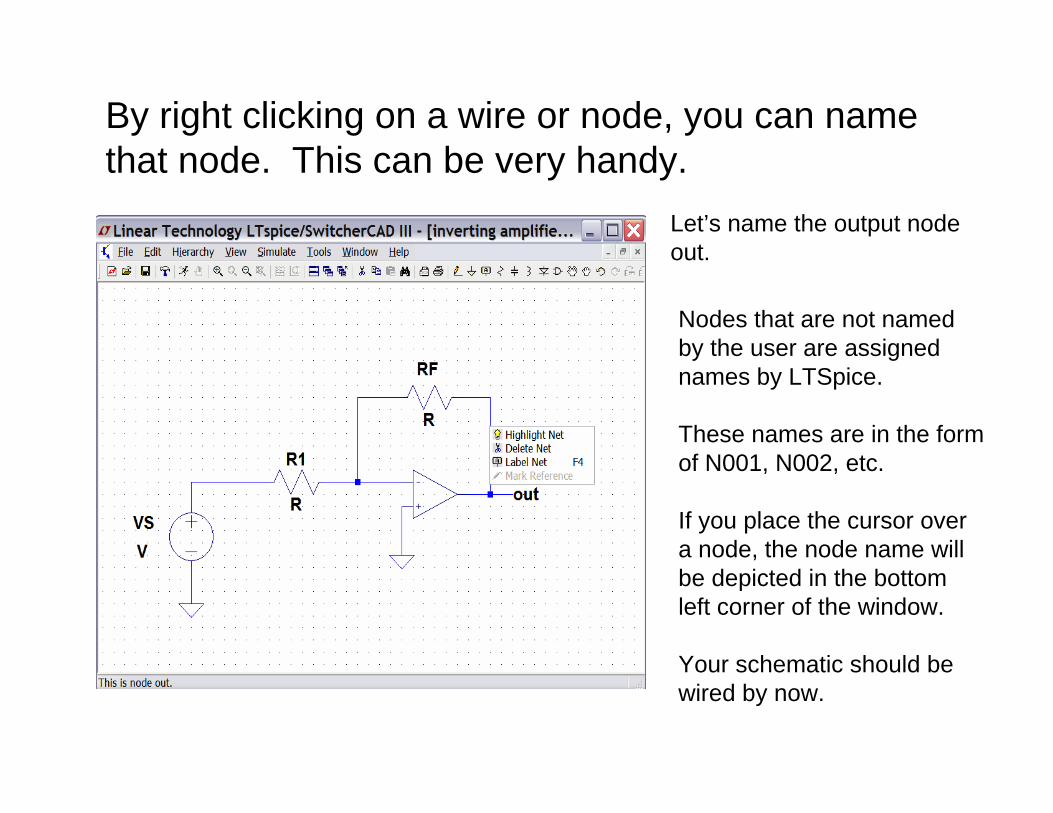
By right clicking on a wire or node, you can name that node. This can be very handy.
Let’s name the output nodeout.
Nodes that are not namedby the user are assignednames by LTSpice.
These names are in the formof N001, N002, etc.
If you place the cursor overa node, the node name willbe depicted in the bottomleft corner of the window.
Your schematic should bewired by now.
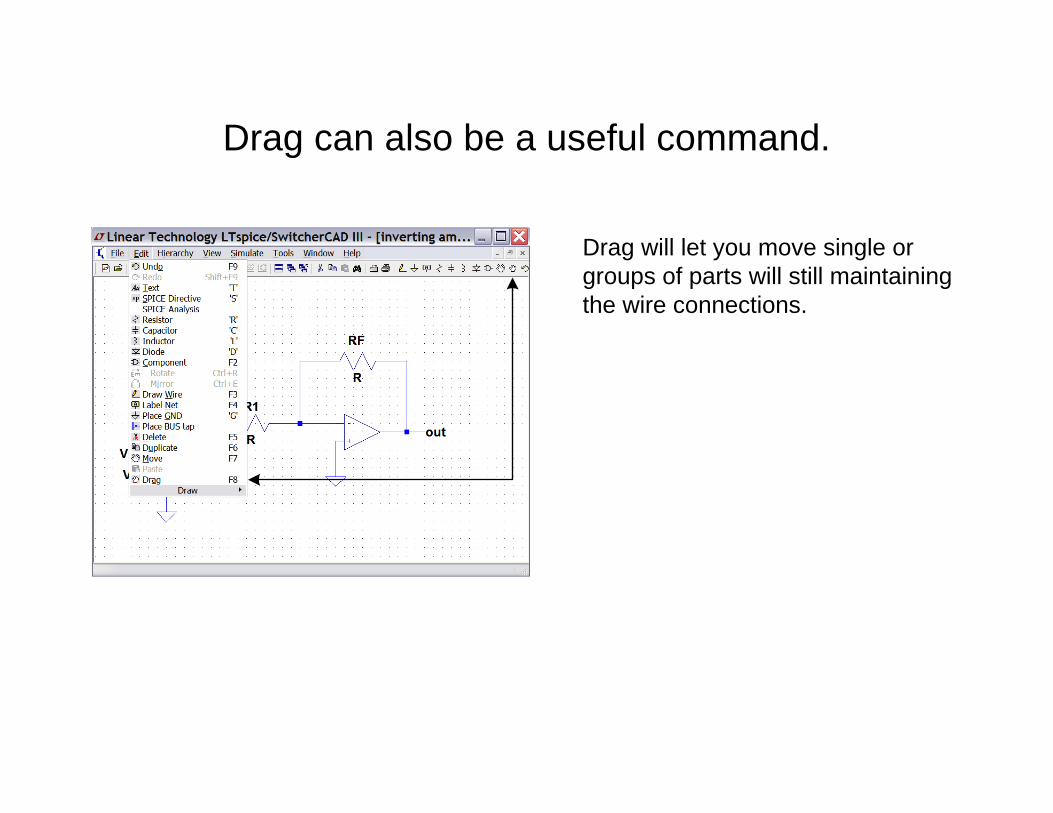
Drag can also be a useful command.
Drag will let you move single orgroups of parts will still maintainingthe wire connections.
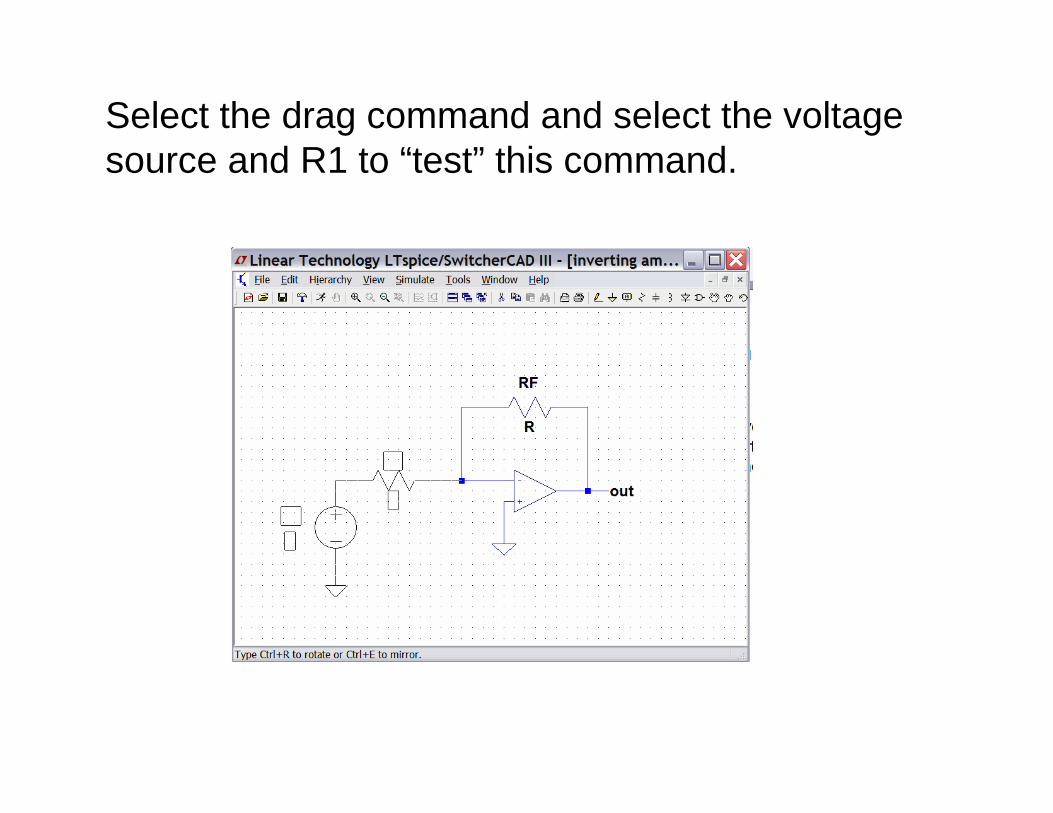
Select the drag command and select the voltagesource and R1 to “test” this command.
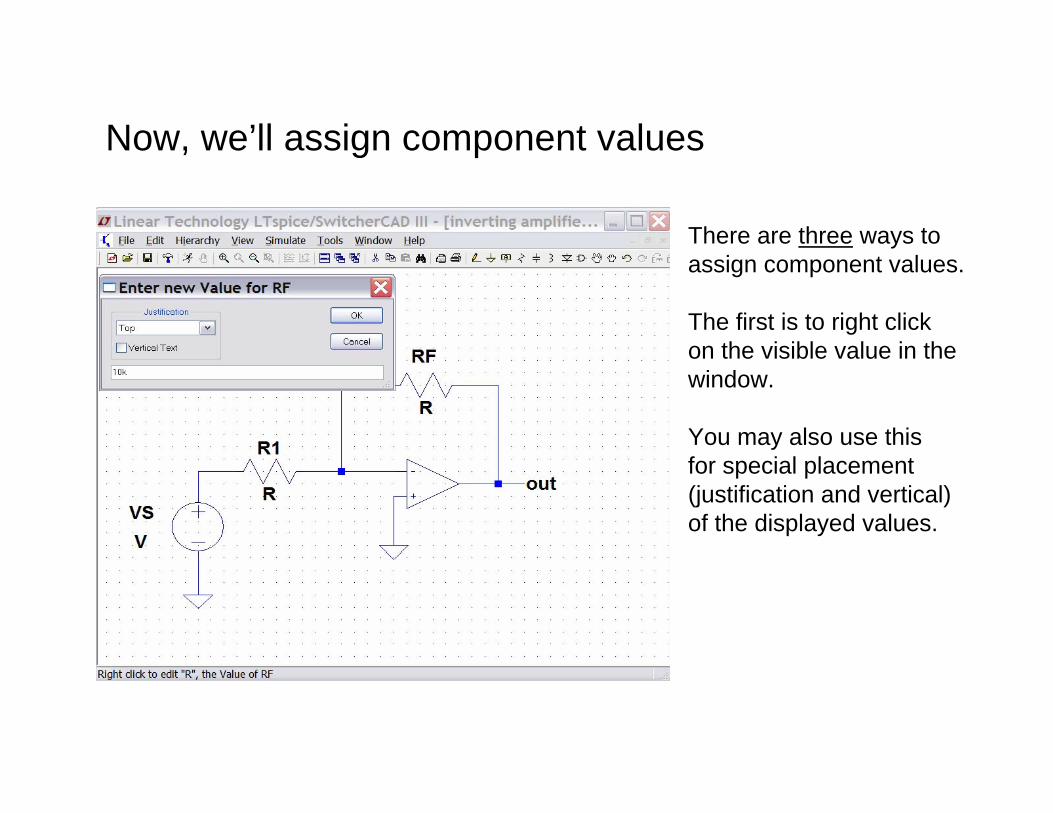
Now, we’ll assign component values
There are three ways toassign component values.
The first is to right clickon the visible value in thewindow.
You may also use this for special placement(justification and vertical)of the displayed values.
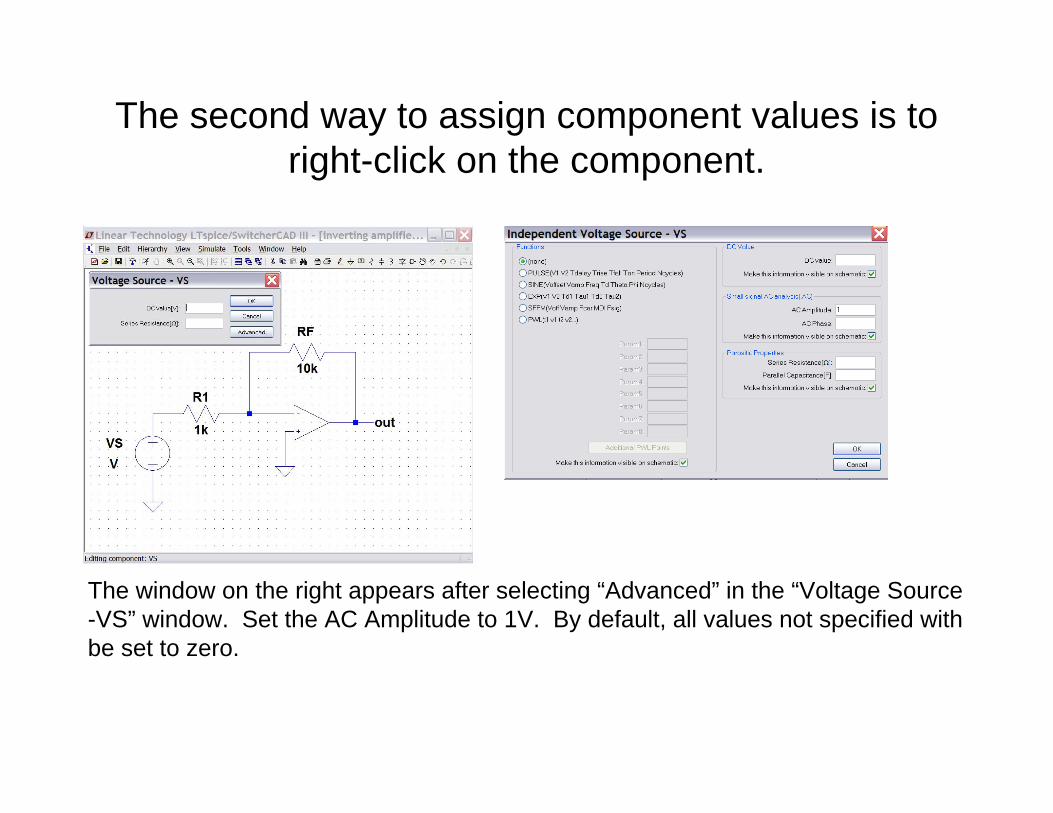
The second way to assign component values is to right-click on the component.
The window on the right appears after selecting “Advanced” in the “Voltage Source-VS” window. Set the AC Amplitude to 1V. By default, all values not specified withbe set to zero.
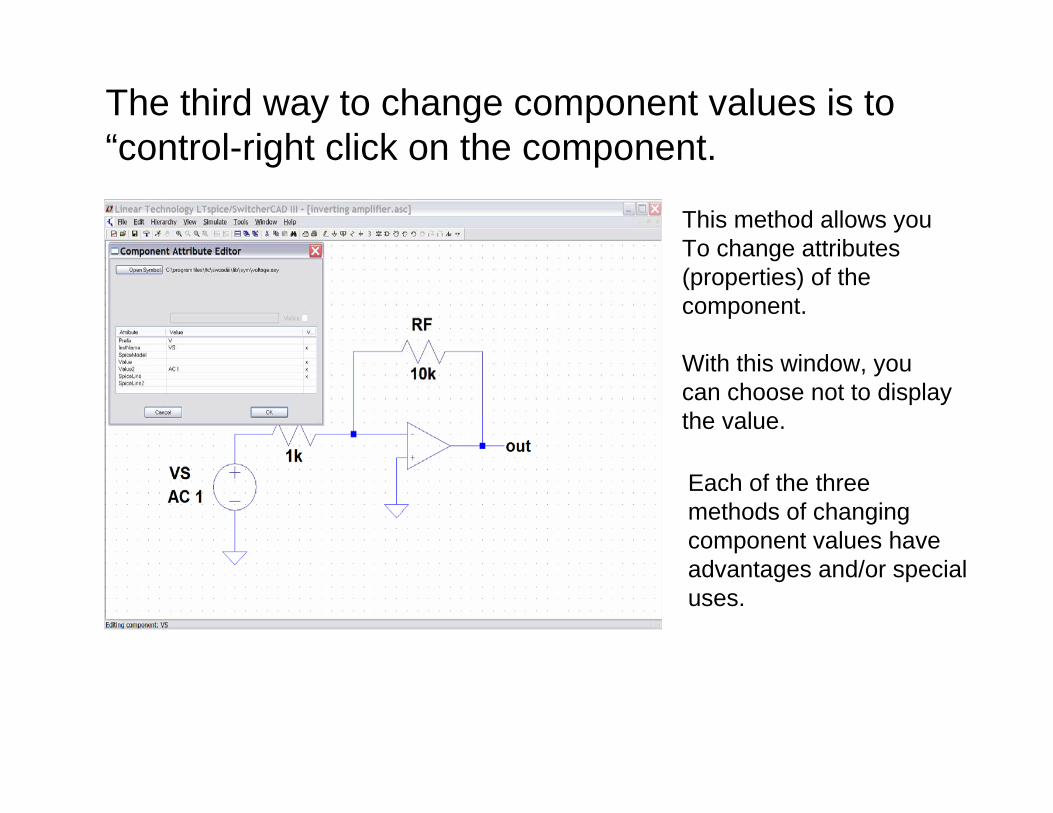
The third way to change component values is to “control-right click on the component.
Each of the threemethods of changingcomponent values have advantages and/or specialuses.
This method allows youTo change attributes (properties) of the component.
With this window, you can choose not to displaythe value.
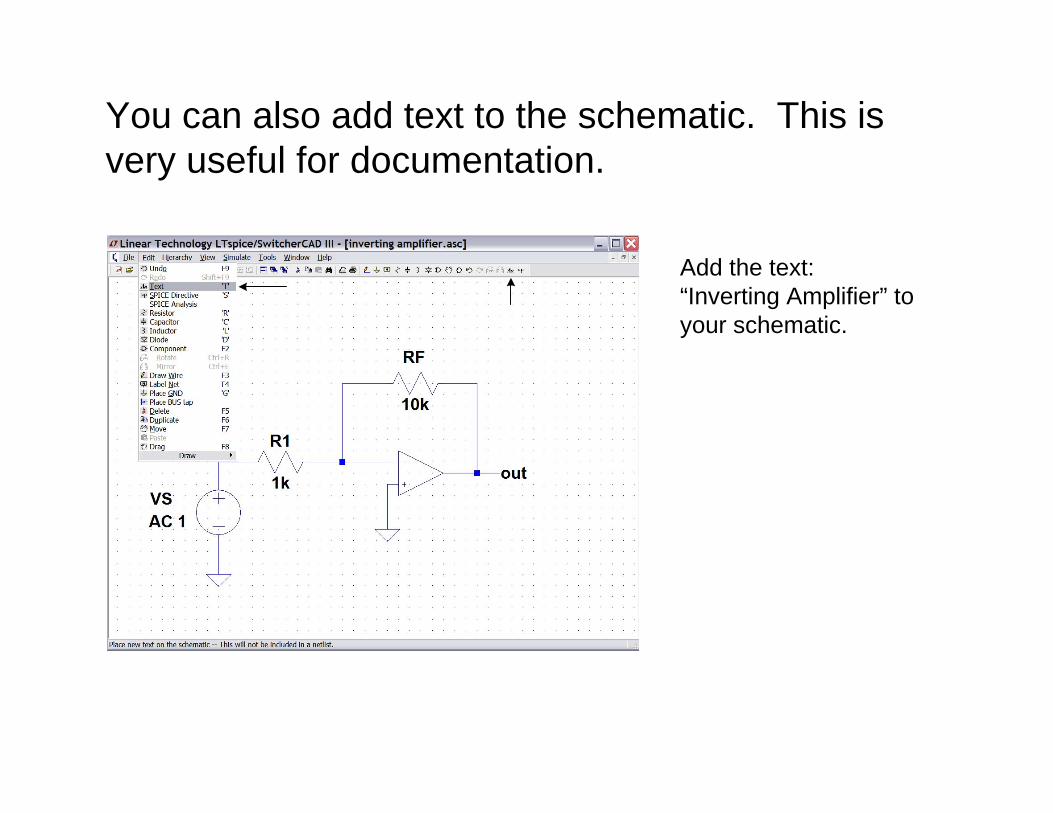
You can also add text to the schematic. This is very useful for documentation.
Add the text:“Inverting Amplifier” toyour schematic.
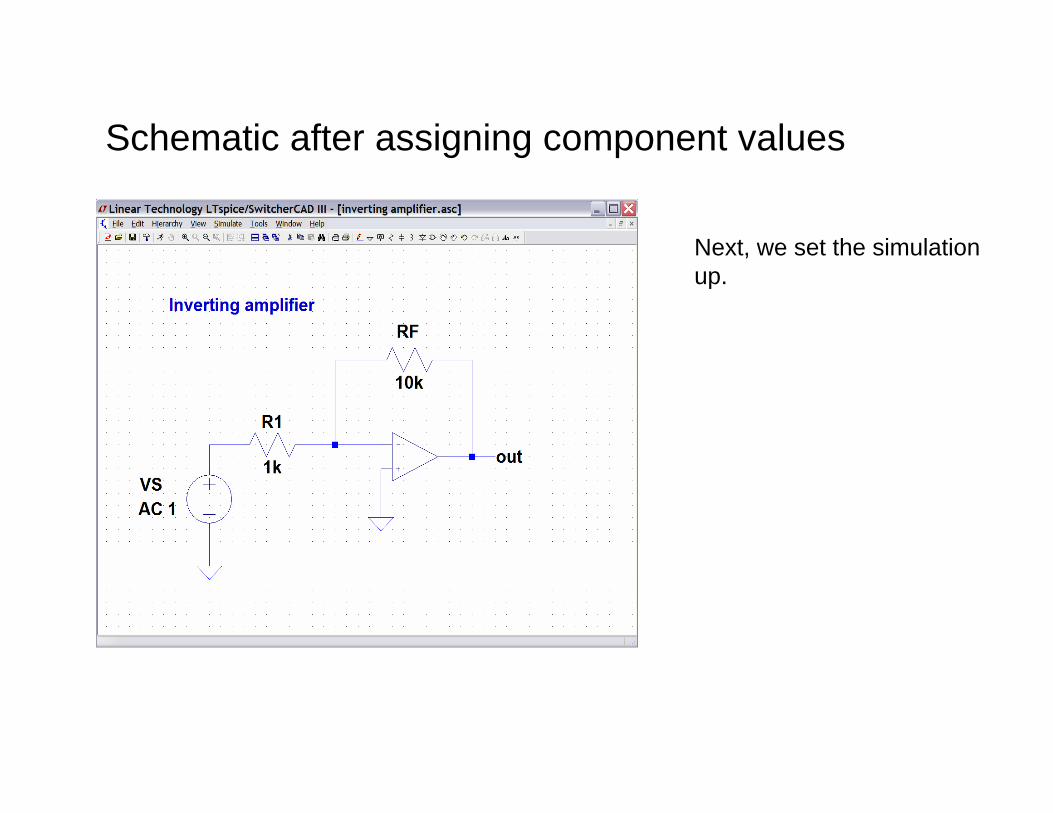
Schematic after assigning component values
Next, we set the simulationup.
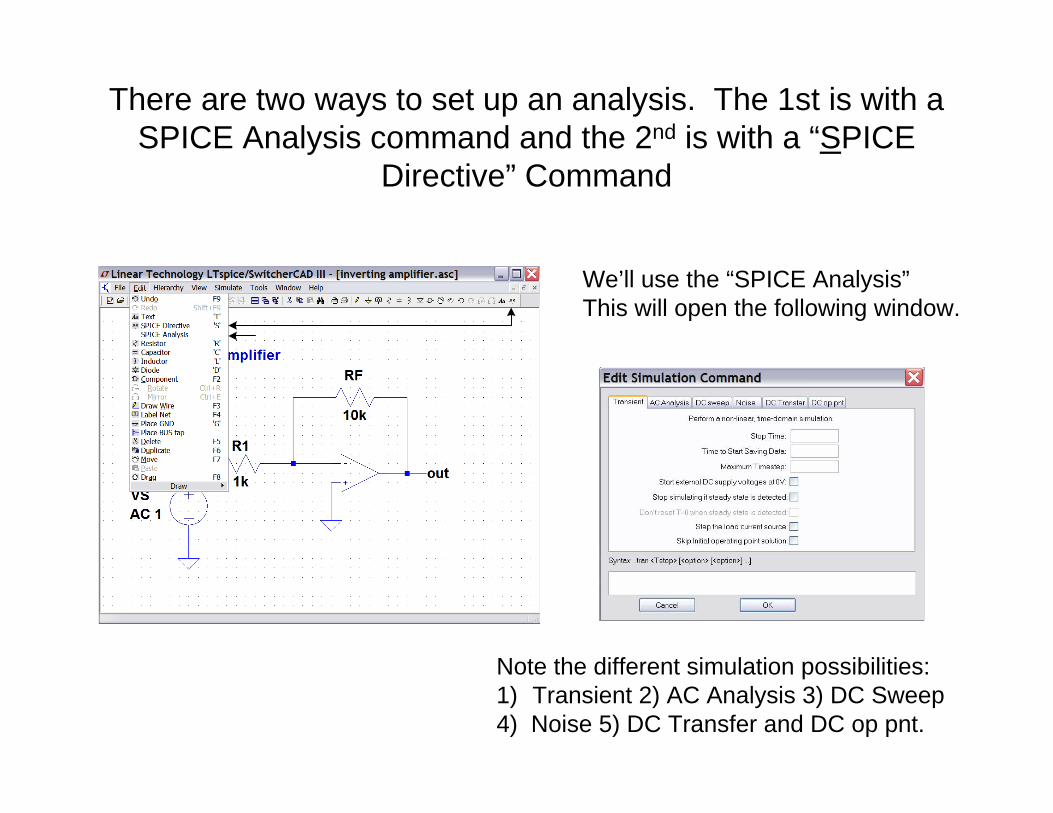
There are two ways to set up an analysis. The 1st is with a SPICE Analysis command and the 2nd is with a “SPICE
Directive” Command
We’ll use the “SPICE Analysis”This will open the following window.
Note the different simulation possibilities:1) Transient 2) AC Analysis 3) DC Sweep4) Noise 5) DC Transfer and DC op pnt.
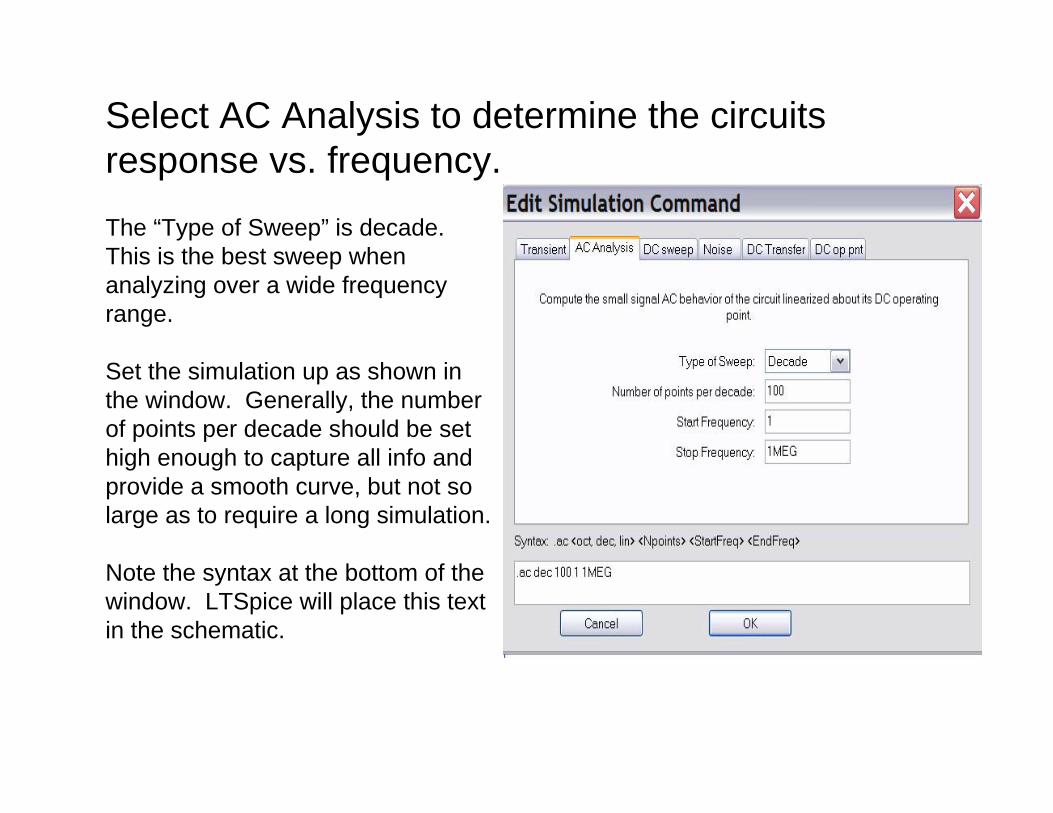
Select AC Analysis to determine the circuitsresponse vs. frequency.
The “Type of Sweep” is decade.This is the best sweep whenanalyzing over a wide frequency range.
Set the simulation up as shown in the window. Generally, the numberof points per decade should be sethigh enough to capture all info andprovide a smooth curve, but not solarge as to require a long simulation.
Note the syntax at the bottom of thewindow. LTSpice will place this text in the schematic.
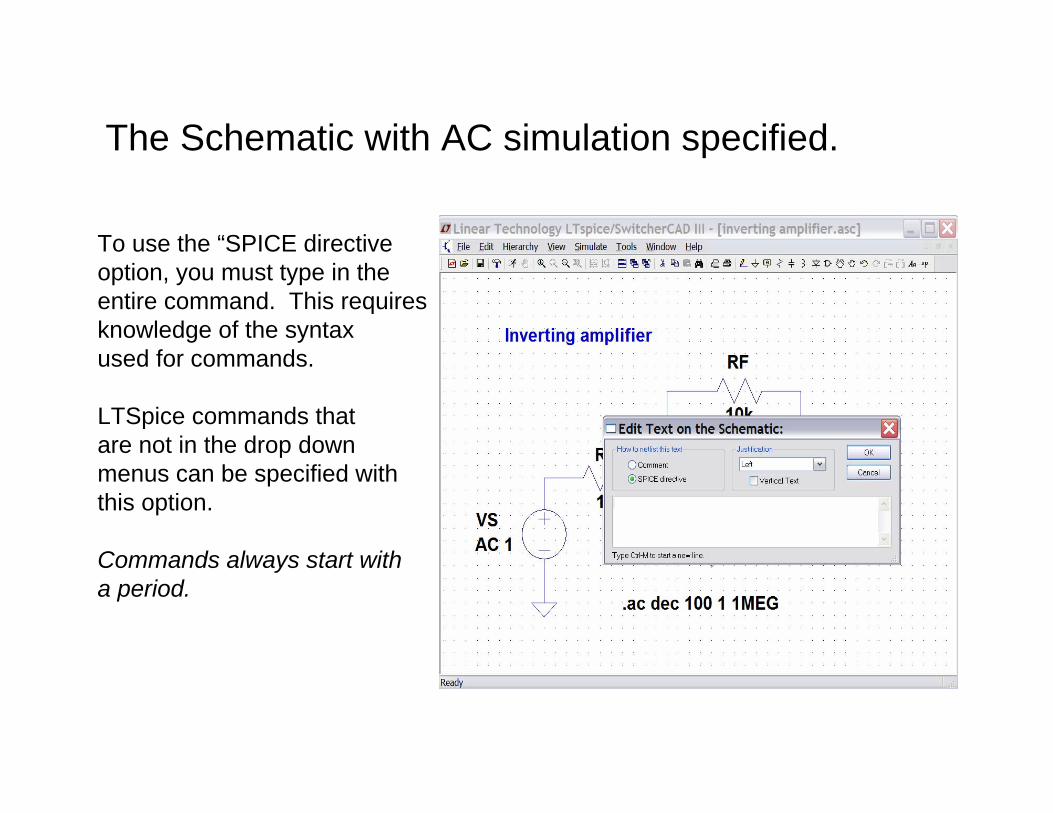
The Schematic with AC simulation specified.
To use the “SPICE directiveoption, you must type in the entire command. This requiresknowledge of the syntaxused for commands.
LTSpice commands thatare not in the drop downmenus can be specified withthis option.
Commands always start witha period.
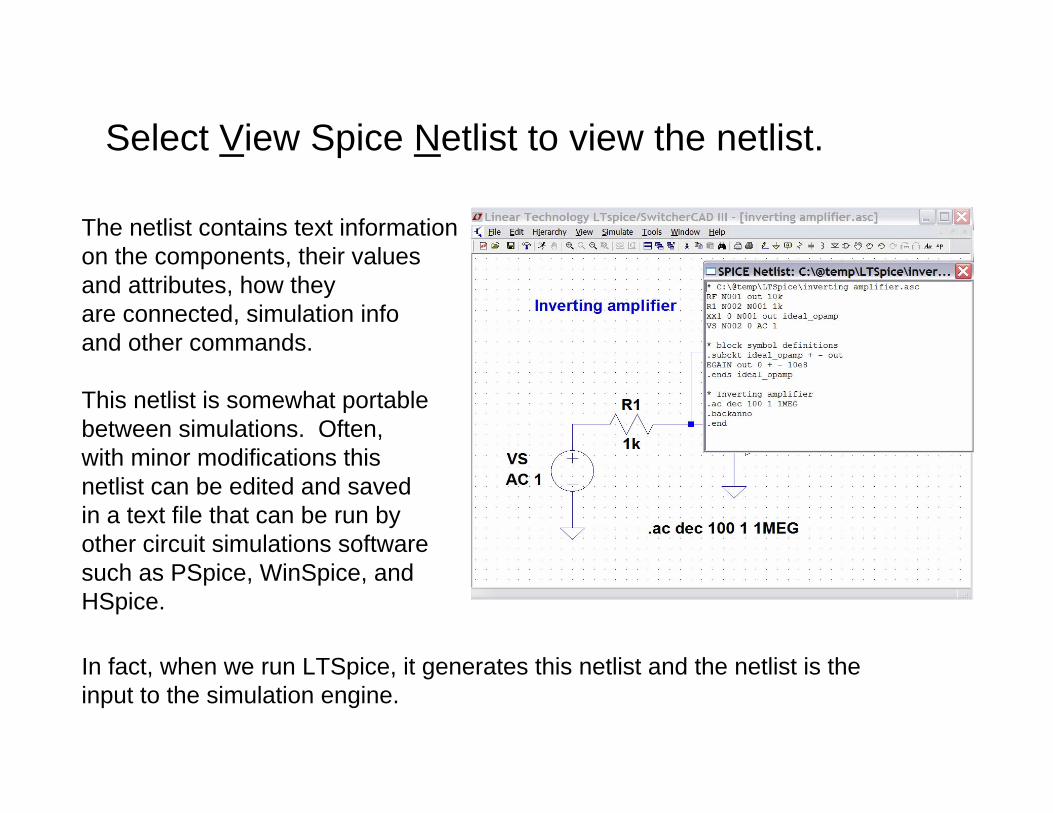
Select View Spice Netlist to view the netlist.
The netlist contains text informationon the components, their valuesand attributes, how theyare connected, simulation infoand other commands.
This netlist is somewhat portablebetween simulations. Often,with minor modifications thisnetlist can be edited and saved in a text file that can be run byother circuit simulations softwaresuch as PSpice, WinSpice, and HSpice.
In fact, when we run LTSpice, it generates this netlist and the netlist is the input to the simulation engine.
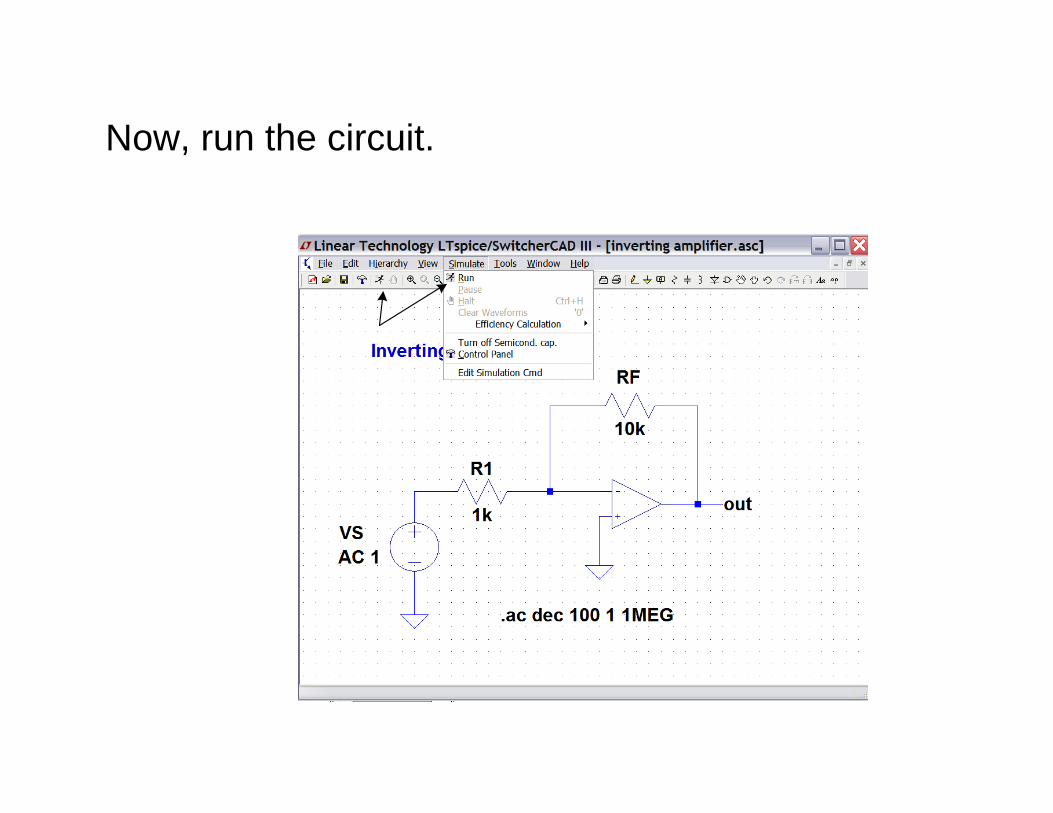
Now, run the circuit.
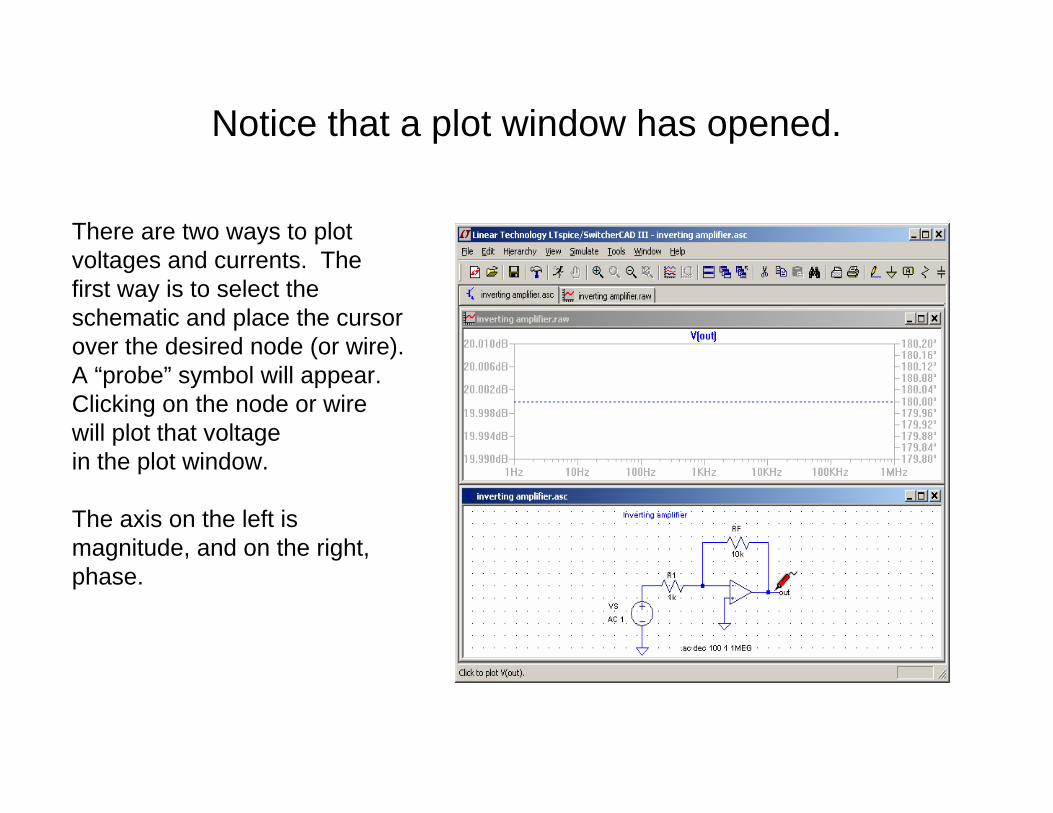
Notice that a plot window has opened.
There are two ways to plotvoltages and currents. The first way is to select the schematic and place the cursor over the desired node (or wire). A “probe” symbol will appear. Clicking on the node or wire will plot that voltagein the plot window.
The axis on the left is magnitude, and on the right, phase.
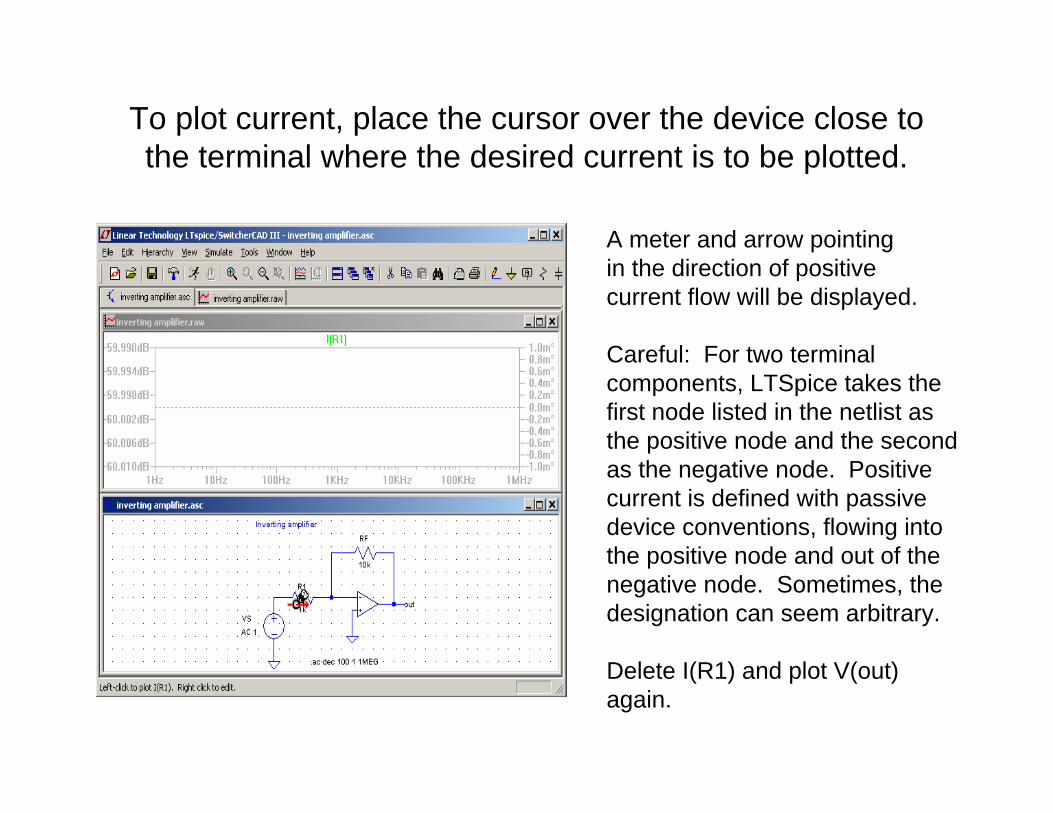
To plot current, place the cursor over the device close to the terminal where the desired current is to be plotted.
A meter and arrow pointingin the direction of positivecurrent flow will be displayed.
Careful: For two terminal components, LTSpice takes thefirst node listed in the netlist asthe positive node and the secondas the negative node. Positivecurrent is defined with passive device conventions, flowing intothe positive node and out of the negative node. Sometimes, thedesignation can seem arbitrary.
Delete I(R1) and plot V(out) again.
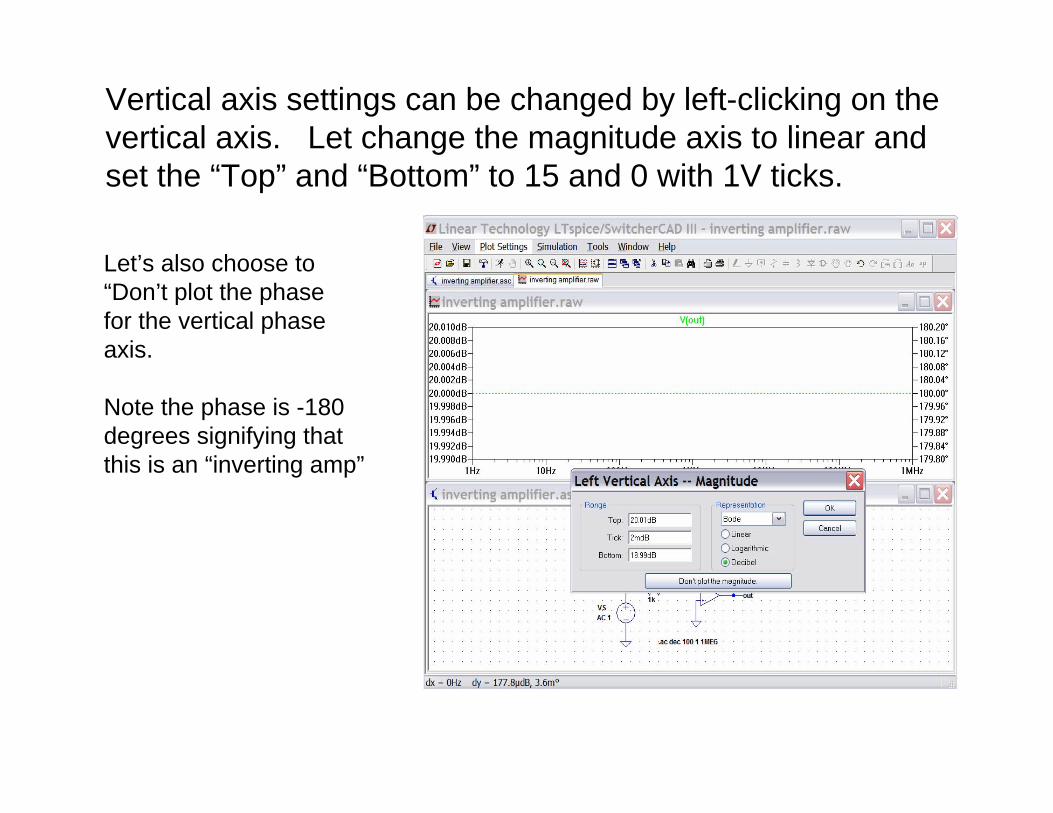
Vertical axis settings can be changed by left-clicking on the vertical axis. Let change the magnitude axis to linear and set the “Top” and “Bottom” to 15 and 0 with 1V ticks.
Let’s also choose to“Don’t plot the phasefor the vertical phase axis.
Note the phase is -180degrees signifying thatthis is an “inverting amp”
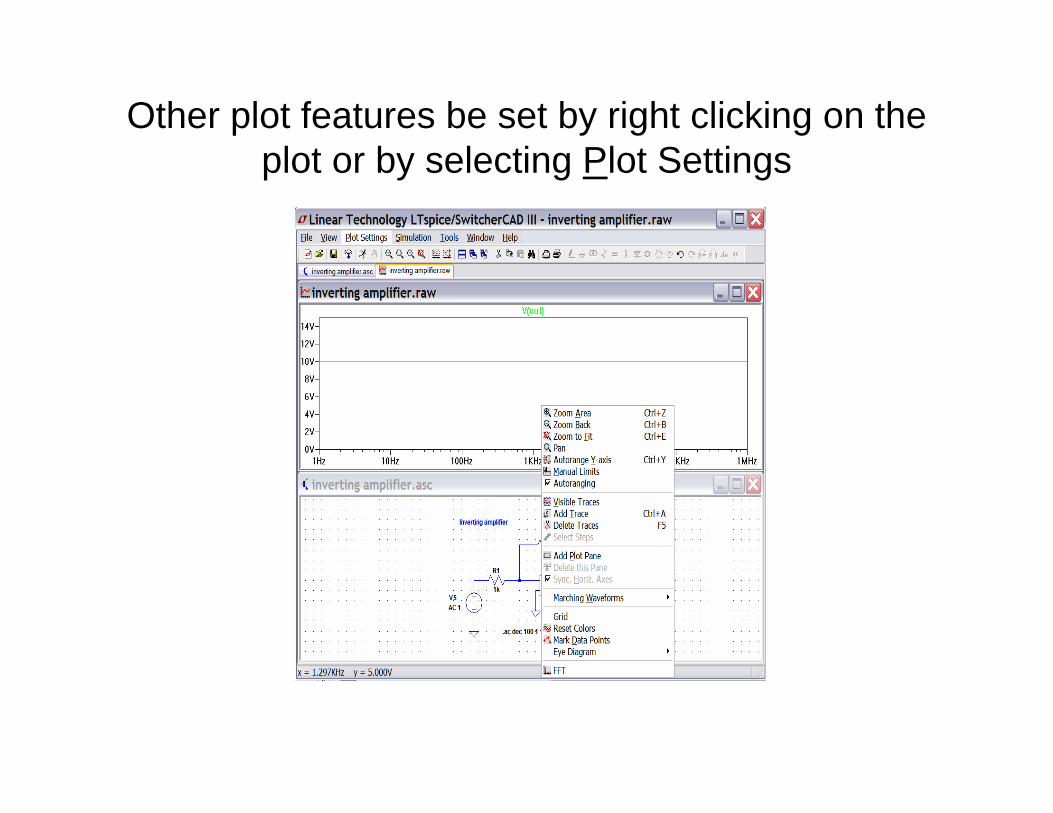
Other plot features be set by right clicking on the plot or by selecting Plot Settings
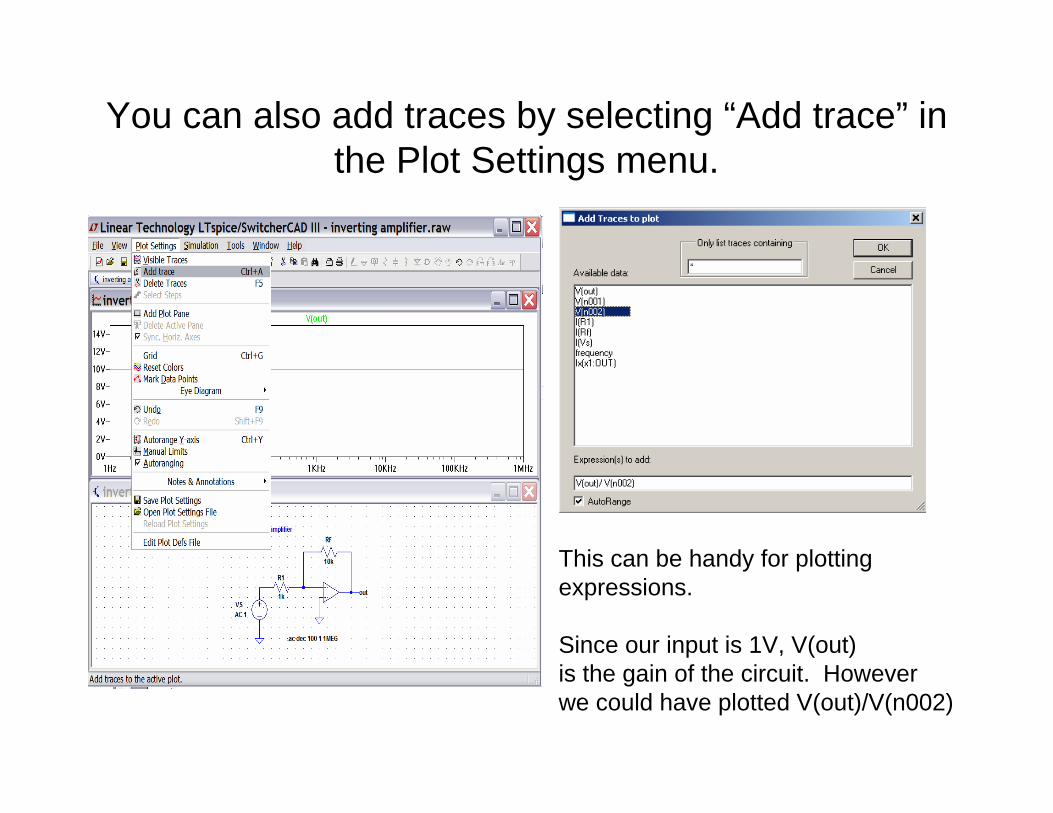
You can also add traces by selecting “Add trace” in the Plot Settings menu.
This can be handy for plotting expressions.
Since our input is 1V, V(out)is the gain of the circuit. Howeverwe could have plotted V(out)/V(n002)
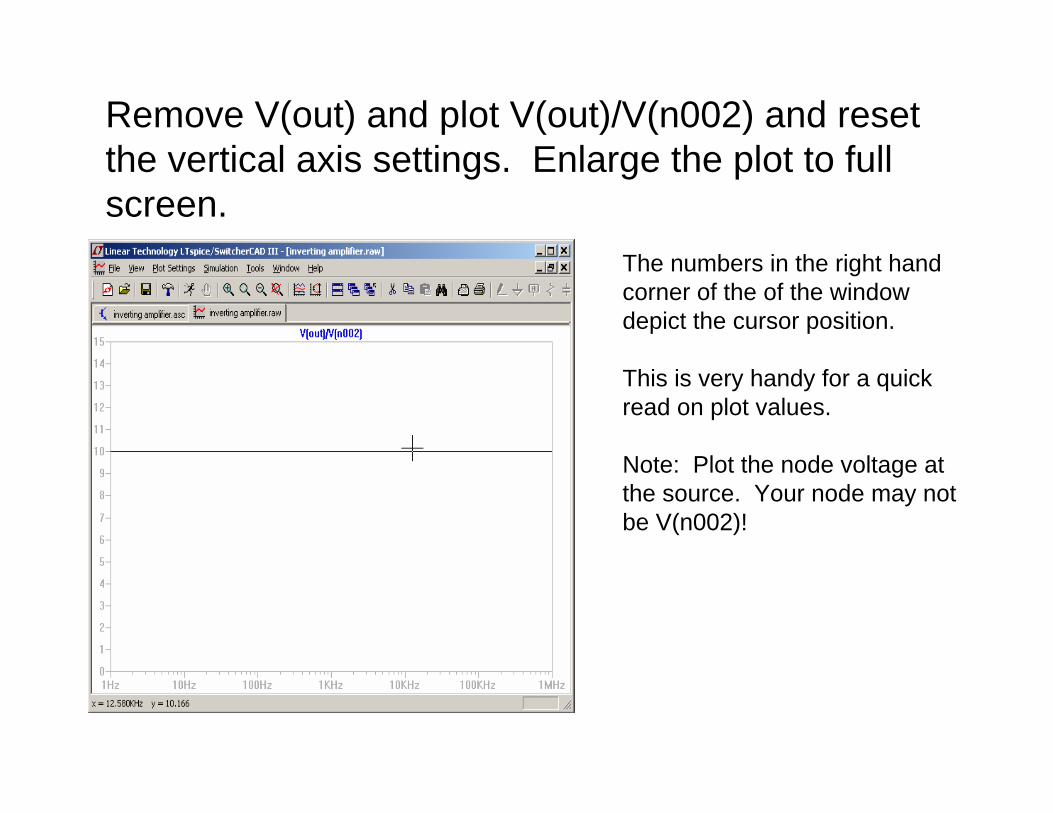
Remove V(out) and plot V(out)/V(n002) and reset the vertical axis settings. Enlarge the plot to full screen.
The numbers in the right handcorner of the of the window depict the cursor position.
This is very handy for a quickread on plot values.
Note: Plot the node voltage atthe source. Your node may notbe V(n002)!
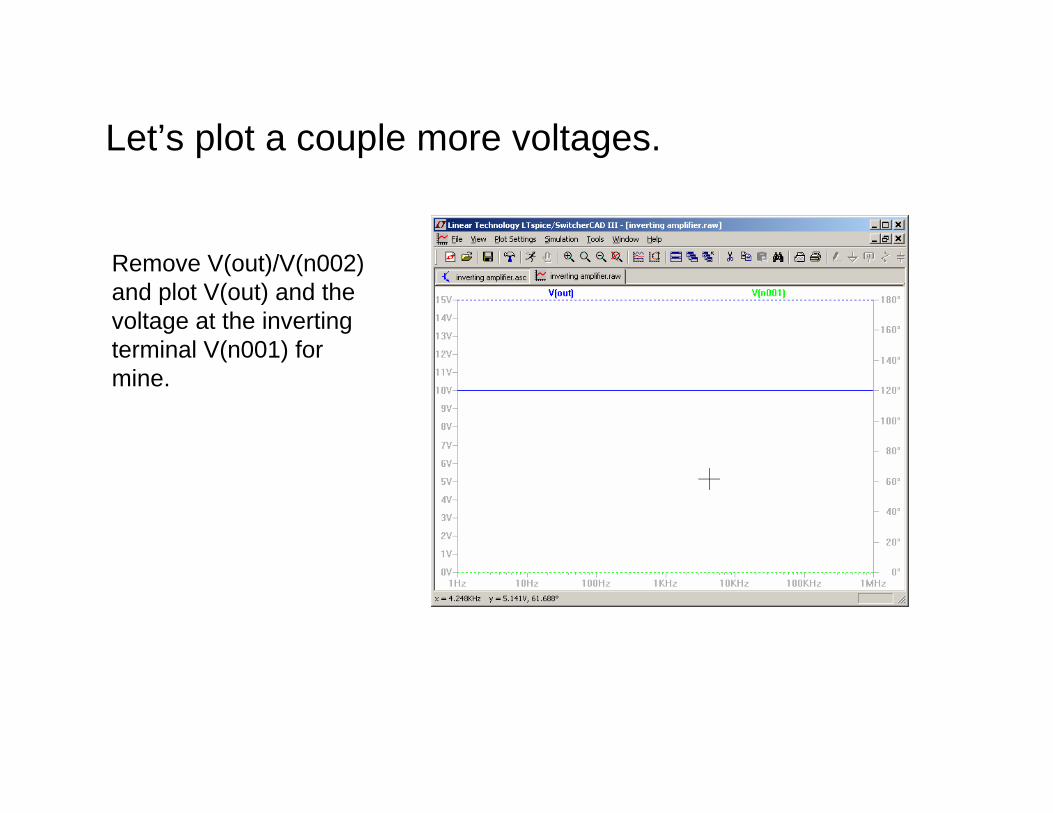
Let’s plot a couple more voltages.
Remove V(out)/V(n002)and plot V(out) and the voltage at the inverting terminal V(n001) for mine.
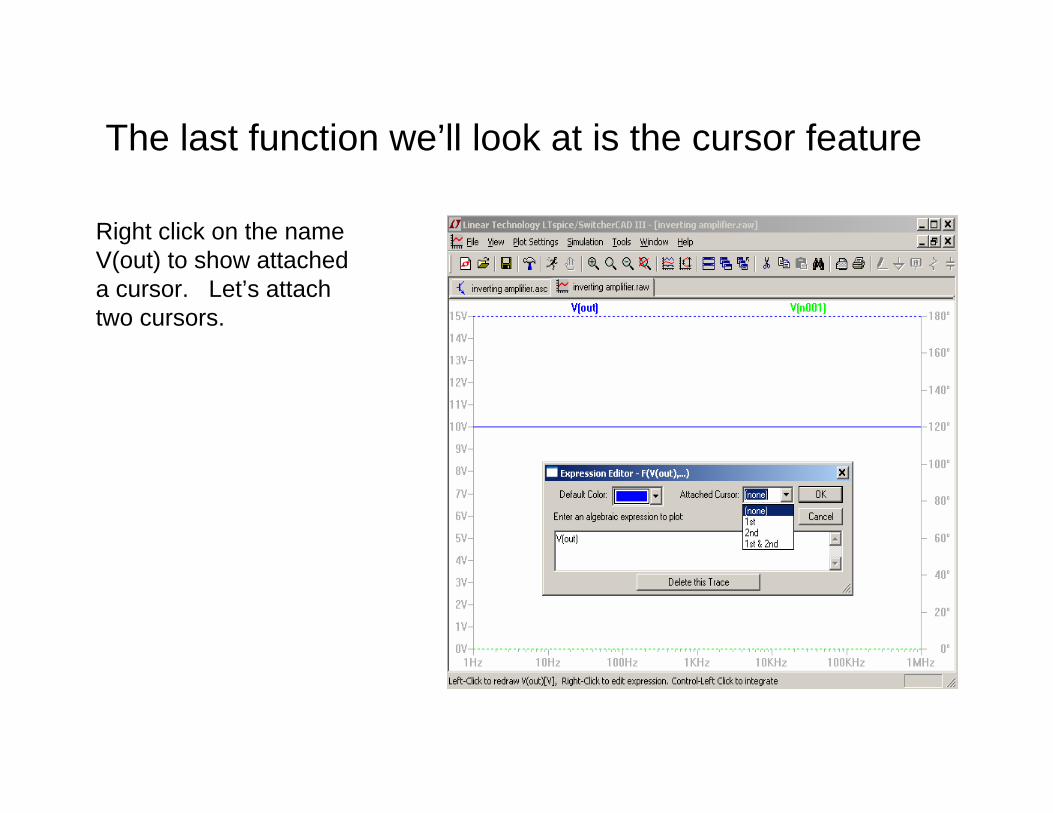
The last function we’ll look at is the cursor feature
Right click on the nameV(out) to show attached a cursor. Let’s attach two cursors.
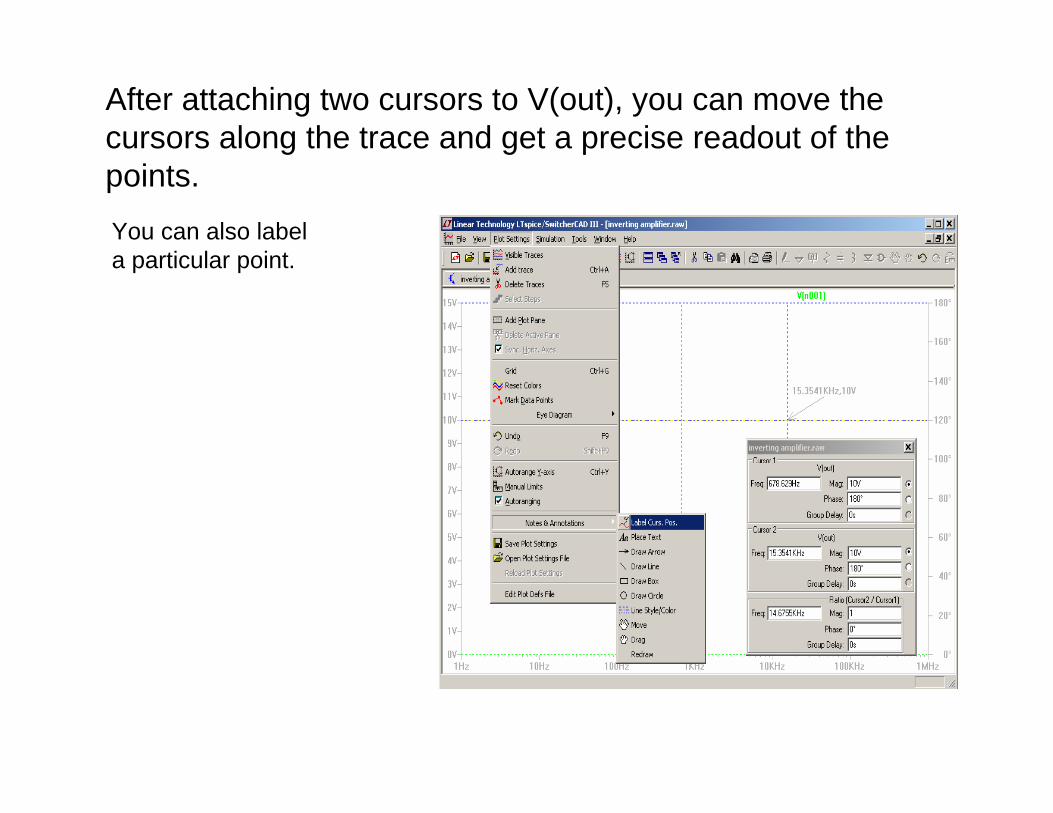
After attaching two cursors to V(out), you can move the cursors along the trace and get a precise readout of the points.You can also labela particular point.
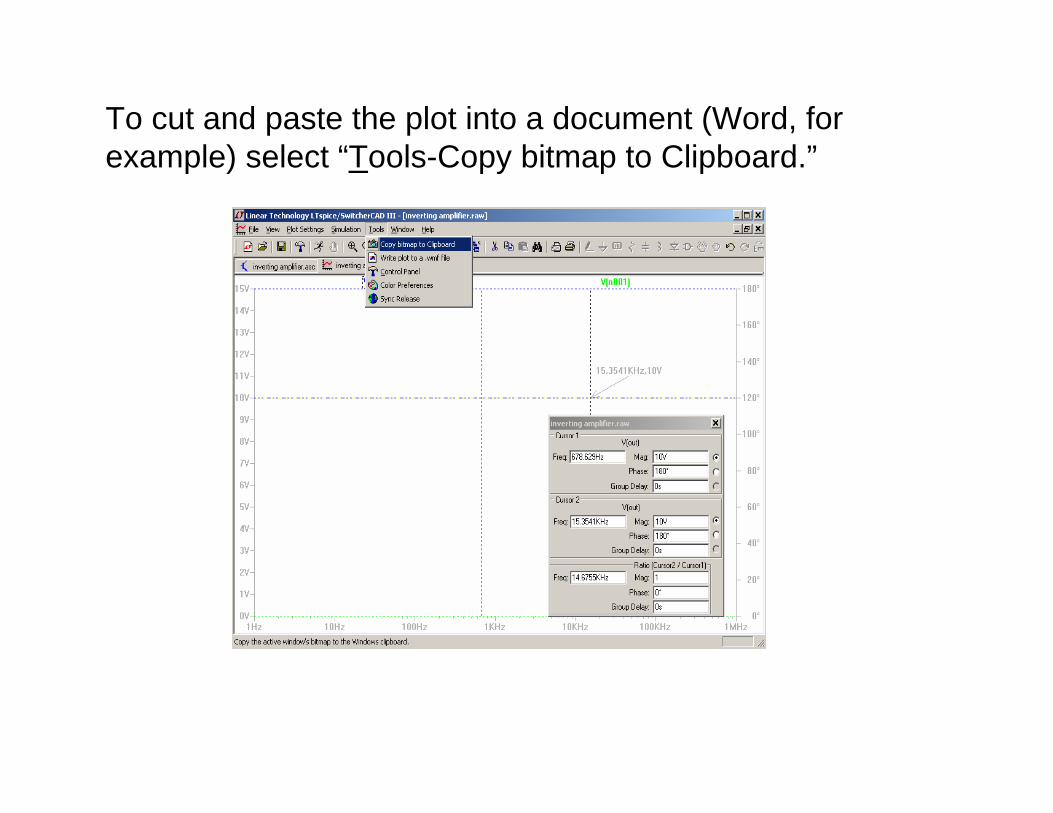
To cut and paste the plot into a document (Word, for example) select “Tools-Copy bitmap to Clipboard.”
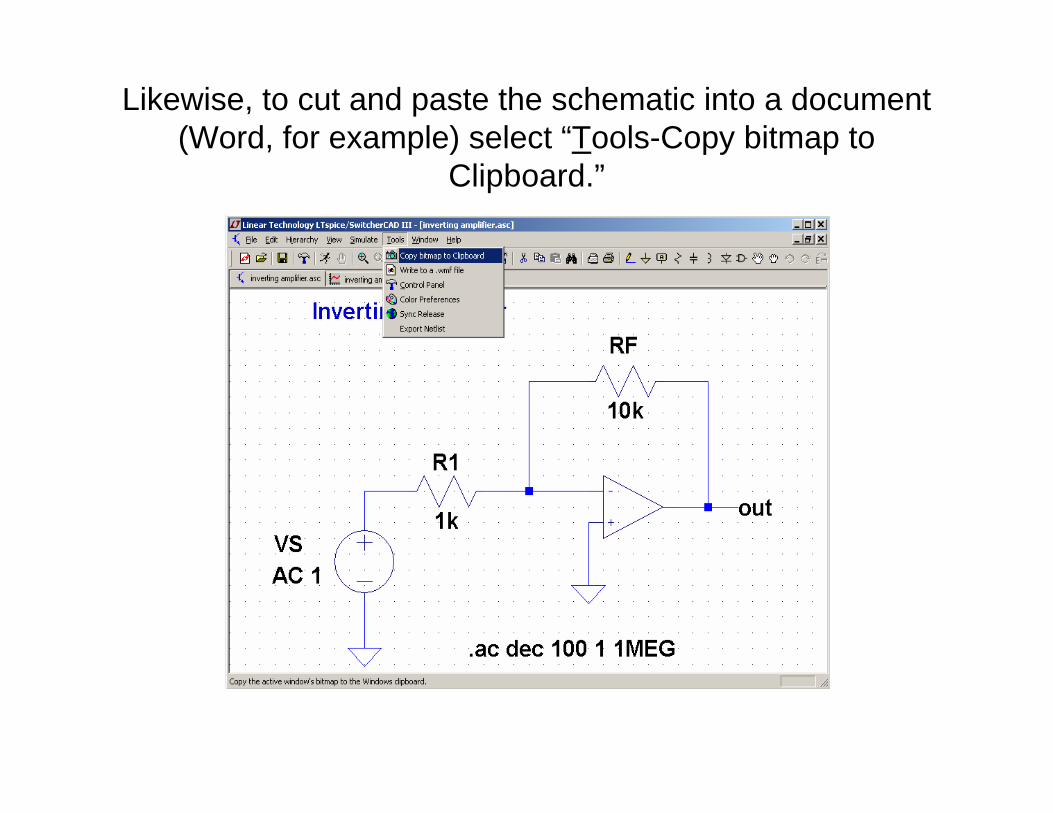
Likewise, to cut and paste the schematic into a document (Word, for example) select “Tools-Copy bitmap to
Clipboard.”
This presentation shows the basics of LTSpice. Advancedfeatures and functions will be forthcoming.


![LTspice getting started guide [2011]](https://img.pdfslide.us/doc/110x75/58815ca91a28ab80508b4e3f/ltspice-getting-started-guide-2011.jpg)