Embed Size (px)
Citation preview
Delaware Valley College Research and Demonstration Center
for On-Lot Systems and Small Flow TechnologyLarry Hepner, MS, CPSS
Professor, Agronomy & Environmental Science
Doug Linde, PhD Associate Professor, Agronomy & Environmental Science
Charles Weber, PhD Associate Professor, Chemistry
Diann Smith, BS Research Associate, Agronomy & Environmental Science
This research and demonstration project was funded from fees collected by the Pennsylvania Department
of Environmental Protection under Section 10 of Act 537 for the review of sewage facilities planning modules for new land development.
www.dep.state.pa.us
Alternative On-Lot Technology Research
ALT
ER
NA
TIV
EO
N-L
OT
TE
CH
NO
LO
GY
RE
SEA
RC
H•
SO
IL-BA
SED
TR
EA
TM
EN
TS
YST
EM
SD
EL
AW
AR
EV
AL
LE
YC
OL
LE
GE
2005
AGRONOMY & ENVIRONMENTAL SCIENCE 700 East Butler AvenueDoylestown, PA 18901
1-800-2DELVAL215-489-2211
www.devalcol.edu
Soil-Based Treatment Systems
Alternative On-Lot Technology Research
DEP CoverSpine FINAL.qxd 10/29/05 12:27 PM Page 1
DVC Project Director: Larry Hepner, Professor of Agronomy &Environmental Science
Research Associates:Diann Smith, Susan Pachuta,Steve Croce, Ray Bunn
DEP Project Coordinators: Milt Lauch, Jay Africa, KarenFenchak, Susan Weaver, Gary Obleski, Bob Hawley
DVC Faculty & Staff: Dr. David AhoMr. Frank BurkMr. Robert CarverDr. Theodore Christie, Jr.Mr. George CoultonDr. Steven DeBrouxMs. Peg HinkelMr. Ronald JohnsonMs. Janet KlaessigMs. Joyce KunkleMr. Ken LeeDr. Doug LindeMr. James LindenDr. James MillerMr. Larry QueripelMr. Tim VaracalloDr. Charles Weber
DVC Students:Susan AlbertsonAmanda BalogachTaryn BartholomewJason BauerBrooke BennetchAmanda BenzBrad BobenniettKathy BooksDavid BowkerThomas BoystDawn BrandtRebecca BurkMike CalkinsColenso CampbellWilliam CisselJacquelyn CozonsTim CravenCharles CurryBrian DaleAmy DeBuck
DVC Students: (continued)
Cheryl DeReiter
Jennifer DilworthBill DomenicoMichele DonovanEnid DunmireBrian DusaultCharles Erway Mike FaganTim FeketeMichael FochtJulie FrancisRachel GlantRyan GlauserMatt GowerKara GraverBenjamin GreenNicole GriesaShaun HenryGreg HinderliterJosh HuyettNicole JulalElizabeth KirkEmily KochGenevie KuhneJay Kulp Coleen LearyOksana LeidyJoe LynchWilliam MagiltonMichele MahoneyAllison MajewskiRachel MayetteRebecca McElhenyMary Kathryn McGonigleKate McGovernJeanette MilewskiJoseph MitalaTony NollPeter OlivieriKristi OrendiJames OrlowskiRosalynd OrrCory PeranichMike PypiakDawn RobisonMax RussickRebecca RyalsKrista SchramJoanne ShaefferRalph ShafferDan ShollenbergerMatt SmithScott Smith
DVC Students: (continued)
Neil SteffyShelby TalleyAngela VincentLisa VolgrafRon VolgrafMadeleine VolbCharles Washington Crystal WheelerGabriel WochleyKristen WolfeIsabela Zwierzynski
Del Val Soils &Environmental Consultants: Joseph Valentine, Soil ScientistSteven Yates, PE
Construction:GS Developers - Jeff RawesFerrero Wastewater
ManagementMcAllister Construction
Design Support:Castle Valley Consultants –
Gary Weaver, PEGeomatrix, LLC - David Potts
Analytical Support:Benchmark Analytics
Consultants:Dr. Robert L. CunninghamMatt Hutchenson
Equipment Suppliers:American ManufacturingGeoflow Inc. Geomatrix, LLCModern ConcretePress Seal CorpRainBird Agri-Products Co.Zabel FiltersZoeller Pump Company
Infographics:Alyssa Wei
Graphic Design:Terese A. Lentini
DEP CoverSpine FINAL.qxd 10/29/05 12:28 PM Page 2
Introduction:
This publication summarizes research conducted on the alternative on-lot wastewater
treatment systems installed at Delaware Valley College. The alternative systems studied
were a combination of primary, secondary, and soil based components that would be
conducive with the climate, geology and soil conditions found throughout Pennsylvania.
These systems were installed in a number of different soil types from somewhat poorly
drained to well drained and on varying slopes anywhere from 1-24%.
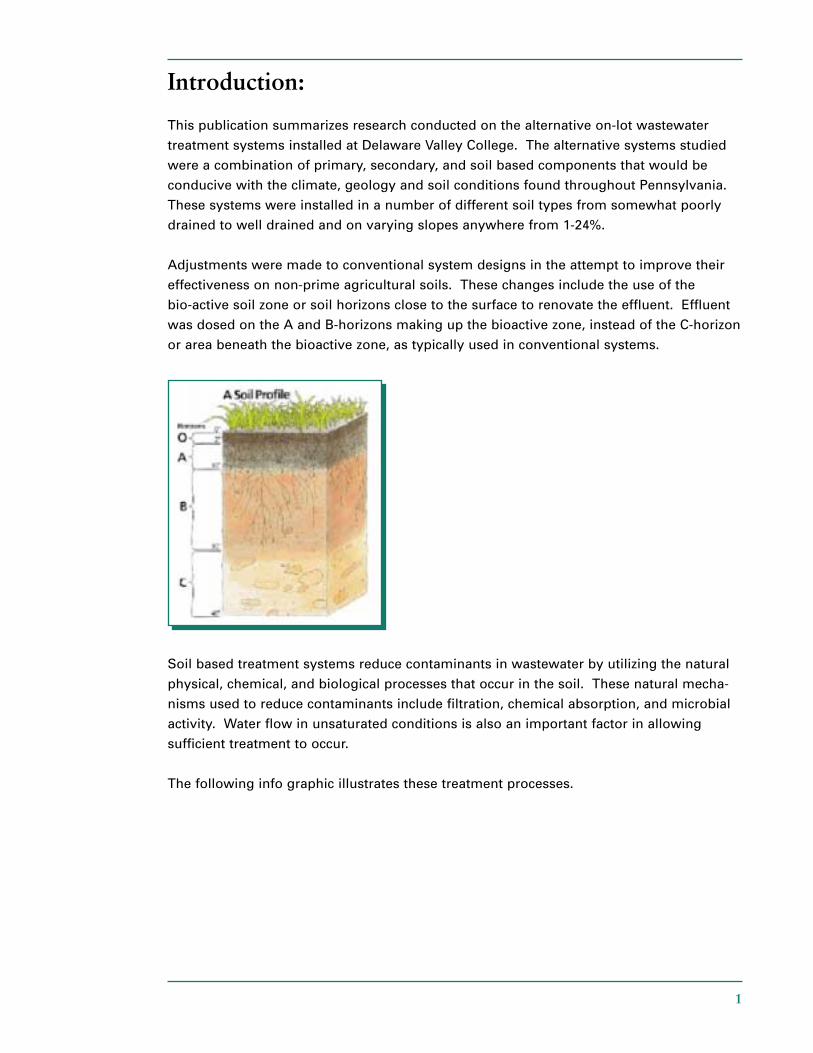
Adjustments were made to conventional system designs in the attempt to improve their
effectiveness on non-prime agricultural soils. These changes include the use of the
bio-active soil zone or soil horizons close to the surface to renovate the effluent. Effluent
was dosed on the A and B-horizons making up the bioactive zone, instead of the C-horizon
or area beneath the bioactive zone, as typically used in conventional systems.
Soil based treatment systems reduce contaminants in wastewater by utilizing the natural
physical, chemical, and biological processes that occur in the soil. These natural mecha-
nisms used to reduce contaminants include filtration, chemical absorption, and microbial
activity. Water flow in unsaturated conditions is also an important factor in allowing
sufficient treatment to occur.
The following info graphic illustrates these treatment processes.
1
2
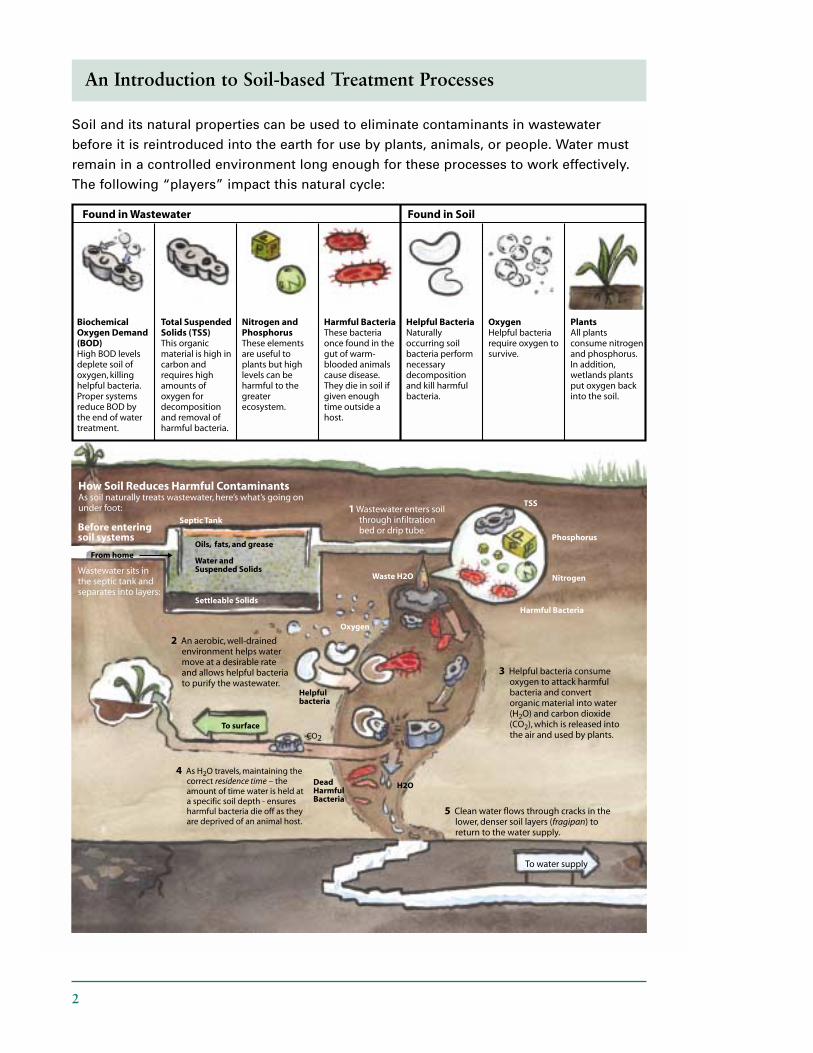
How Soil Reduces Harmful ContaminantsAs soil naturally treats wastewater, here’s what’s going on under foot:
Found in Wastewater Found in Soil
Total Suspended Solids (TSS)This organic material is high in carbon and requires high amounts of oxygen for decomposition and removal of harmful bacteria.
Biochemical Oxygen Demand (BOD)High BOD levels deplete soil of oxygen, killing helpful bacteria. Proper systems reduce BOD by the end of water treatment.
Nitrogen and PhosphorusThese elements are useful to plants but high levels can be harmful to the greater ecosystem.
Harmful BacteriaThese bacteria once found in the gut of warm-blooded animals cause disease. They die in soil if given enough time outside a host.
Helpful BacteriaNaturally occurring soil bacteria perform necessary decomposition and kill harmful bacteria.
OxygenHelpful bacteria require oxygen to survive.
PlantsAll plants consume nitrogen and phosphorus. In addition, wetlands plants put oxygen back into the soil.
1 Wastewater enters soil through infiltration bed or drip tube.
Wastewater sits in the septic tank and separates into layers:
Before entering soil systems
2 An aerobic, well-drained environment helps water move at a desirable rate and allows helpful bacteria to purify the wastewater.
3 Helpful bacteria consume oxygen to attack harmful bacteria and convert organic material into water (H2O) and carbon dioxide (CO2), which is released into the air and used by plants.
4 As H2O travels, maintaining the correct residence time – the amount of time water is held at a specific soil depth - ensures harmful bacteria die off as they are deprived of an animal host.
5 Clean water flows through cracks in the lower, denser soil layers (fragipan) to return to the water supply.
Helpful bacteria
Oxygen
To surfaceCO2
To water supply
Septic Tank
From home
TSS
Phosphorus
Harmful Bacteria
NitrogenWaste H2O
H2ODeadHarmfulBacteria
Oils, fats, and grease
Water and Suspended Solids
Settleable Solids
An Introduction to Soil-based Treatment Processes
Soil and its natural properties can be used to eliminate contaminants in wastewater
before it is reintroduced into the earth for use by plants, animals, or people. Water must
remain in a controlled environment long enough for these processes to work effectively.
The following “players” impact this natural cycle:
Wastewater Infiltration and Testing:
One important component of soil-based treatment is to introduce the wastewater in a
fashion that allows unsaturated flow to occur through the soil. Unsaturated flow allows
for long residence times in the soil and provides the needed oxygen for microbial and
chemical processes to treat the wastewater.
At-grade beds and drip irrigation are two methods of introducing wastewater into the soil
to maintain unsaturated flow conditions. Eventually, saturated flow conditions will occur
and gravity will move the treated water down through the soil profile.
The sampling procedure used in this project captured water as it moved by gravity down
through the soil profile. The collected treated wastewater samples were then lab analyzed
for a number of different contaminants, such as fecal bacteria, biological oxygen demand,
total suspended solids, nitrogen, and phosphorus.
The following info graphic illustrates these methods.
3

4
The Basics of Wastewater Infiltration and Testing Methods
This study used two methods of introducing water into the soil for treatment. One was
at-grade pressure dosed beds containing underground pipes with evenly spaced holes
dosing constructed beds and the second was drip irrigation using flexible tubes with
evenly spaced emitters trickling water into drip irrigation areas.
In the drip irrigation methods, water seeps into soil at controlled intervals, spreading as such:
1 Dry soil pulls moisture sideways and upward as much as gravity pulls it down.
2 As soil above becomes more saturated, gravity has more influence.
3 Moisture continues until it hits bedrock or a fragipan – a dense layer of soil forming an anaerobic atmosphere that is already saturated with water. Wastewater needs to be safe before it hits these layers to avoid harmful results to the ecosystem, as the anaerobic nature of a fragipan renders it a poor soil-based treatment technique.
Lysimeters – groupings of pipes cut to varying lengths to reach different soil depths – allow samples to be extracted easily and in a controlled way. The samples are tested for harmful bacteria levels.
Emitter hole
In the pressure dosed at grade bed:
1 Water fills the gravel and spreads over the soil during dosing.
2 Water moves down through the soil.
3 Moisture continues until it hits bedrock or a fragipan.
Gravel
Soil
Soil
Fragipan
Drilled hole
Water Quality Testing
Water flows in at specific depth
Mesh lysimeter opening
6 inch reservoir
P VC pipe
Polyethylene tubing
HarmfulBacteriaAbove Ground
Below Ground
45˚
Anatomy of a Lysimeter Lysimeters in the Field
Statistical Analysis of Alternative Systems:
Multiple statistical methods such as graphs, charts, descriptive statistics, and hypothesis
tests were used to interpret lab results obtained from wastewater samples collected at
each of the alternative systems studied. Data values for each test parameter were
graphed in relation to the date sampled (time series) in order to observe any concentration
changes and fluctuations for each sampling site. Histograms, bar charts of relative
frequencies of data set values, helped to determine if the data sets distribution was
skewed, followed a normal bell-shaped curve, and or contained outliers. These indicators
determined the type of hypothesis testing or significance test performed on the data.
A hypothesis test is a formal procedure used to draw conclusions from the collected data.
Most of the collected site parameter data was skewed and contained outliers, thus
non-parametric statistical tests were performed.
The Wilcoxon rank sum test was used to determine the statistical significance between
two variables and the Kruskal-Wallis test was used to determine the statistical significance
among three or more variables. To test the statistical significance of the lab results, a
pre-determined alpha of .05 was used for accepting or rejecting the null hypothesis, which
stated that there was no significant difference between the compared sampling site
parameter values. When the calculated p-value was .05 or greater, the null hypothesis
was accepted. Accepting the null hypothesis supported evidence that there was no
significant difference between sampling site parameter values. When a significant
difference was indicate using the Kruskal-Wallis test, the Pairwise Comparison test was
performed to identify which specific depths were significantly different. In addition, if a
significant difference was seen, the test calculated mean rank was used as a location
parameter to determine which site was higher or lower.
The descriptive statistics in the form of a 5-number summary along with the number of
site data values (N) were charted to describe the center (average or midpoint) and spread
(variability) of each data set. The 5-number summary consists of the minimum or lowest
data value, the 1st quartile or value where 25% of the values fall at or below it, the median
or middle value (50% of values at or below), the 3rd quartile or value where 75% of the
values fall at or below it, and the maximum or highest data value.
5
6
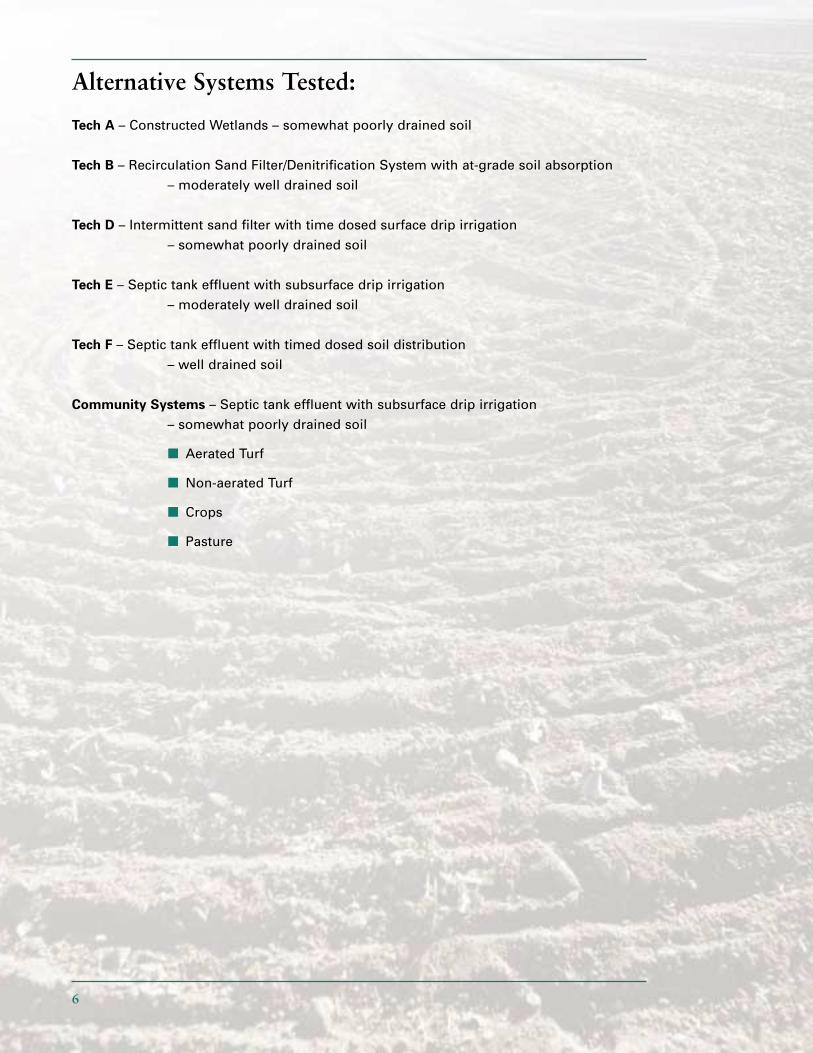
Alternative Systems Tested:
Tech A – Constructed Wetlands – somewhat poorly drained soil
Tech B – Recirculation Sand Filter/Denitrification System with at-grade soil absorption
– moderately well drained soil
Tech D – Intermittent sand filter with time dosed surface drip irrigation
– somewhat poorly drained soil
Tech E – Septic tank effluent with subsurface drip irrigation
– moderately well drained soil
Tech F – Septic tank effluent with timed dosed soil distribution
– well drained soil
Community Systems – Septic tank effluent with subsurface drip irrigation
– somewhat poorly drained soil
■ Aerated Turf
■ Non-aerated Turf
■ Crops
■ Pasture
7
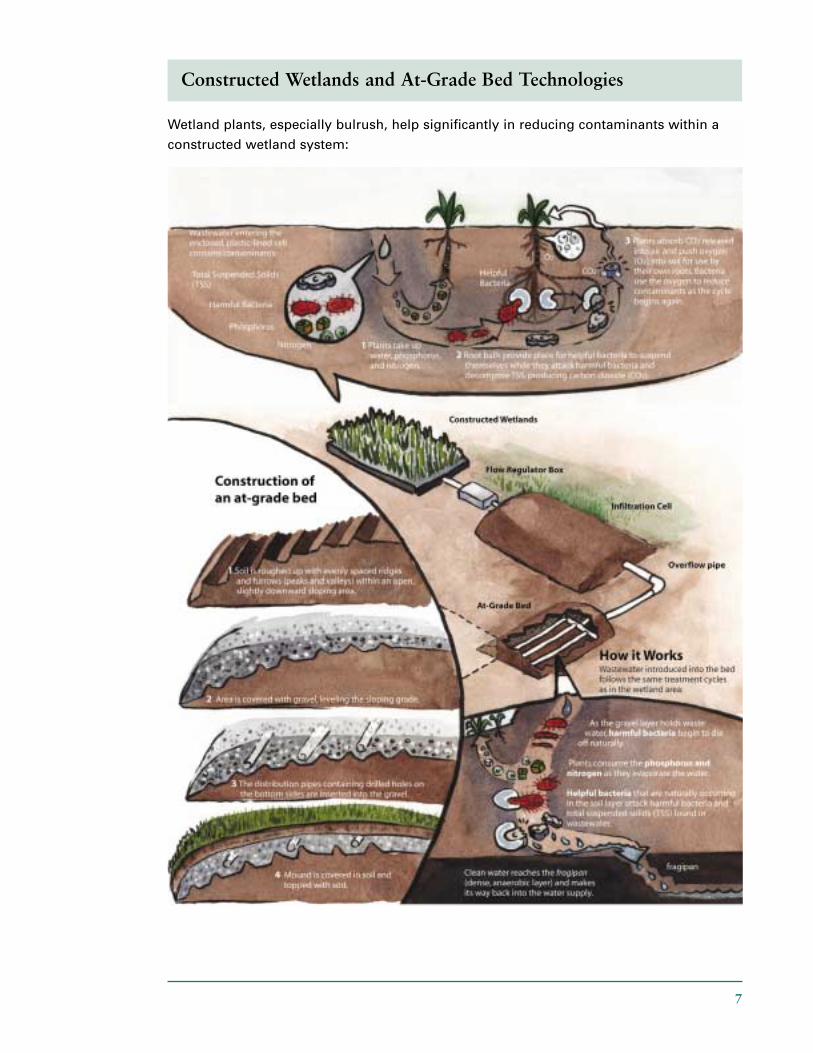
Constructed Wetlands and At-Grade Bed Technologies
Wetland plants, especially bulrush, help significantly in reducing contaminants within a
constructed wetland system:
8
Technology A:
The Constructed Wetland System is a natural method of treating water. The physical and
chemical processes that nature provides can be adjusted by altering factors including
depth, media, and vegetation in the wetland.
There are two major categories of constructed wetlands: the free-water surface and the
subsurface flow. A free-water surface wetland has water exposed to the atmosphere,
while the water in a subsurface flow wetland remains below the surface of the media.
This project utilized subsurface flow wetlands.
The subsurface wetlands can have horizontal flow through the wetland, or vertical flow
through the system. The wetlands on this project were designed to function by either
flow method depending on valve settings. The root zone in a typical horizontal flow bed
remains saturated and must rely on the macrophyte plants to supply the oxygen required
for the conversion of ammonia nitrogen to nitrate nitrogen. Nitrate nitrogen can then be
converted to gaseous nitrogen in the anaerobic areas and released to the atmosphere.
Scirpus sp., commonly known as bulrush, is a well-suited macrophyte due to its high
ammonia nitrogen tolerance and highly oxygenated rhizome. In addition, Juncus and
other wetland plants (see plant list) could be utilized.
Tennessee Valley Authority sizing guidelines were employed. Hydraulic loading rate
calculations were performed in order to predict the minimum cross sectional area and
surface area required to treat the biochemical oxygen demand. Each wetland system
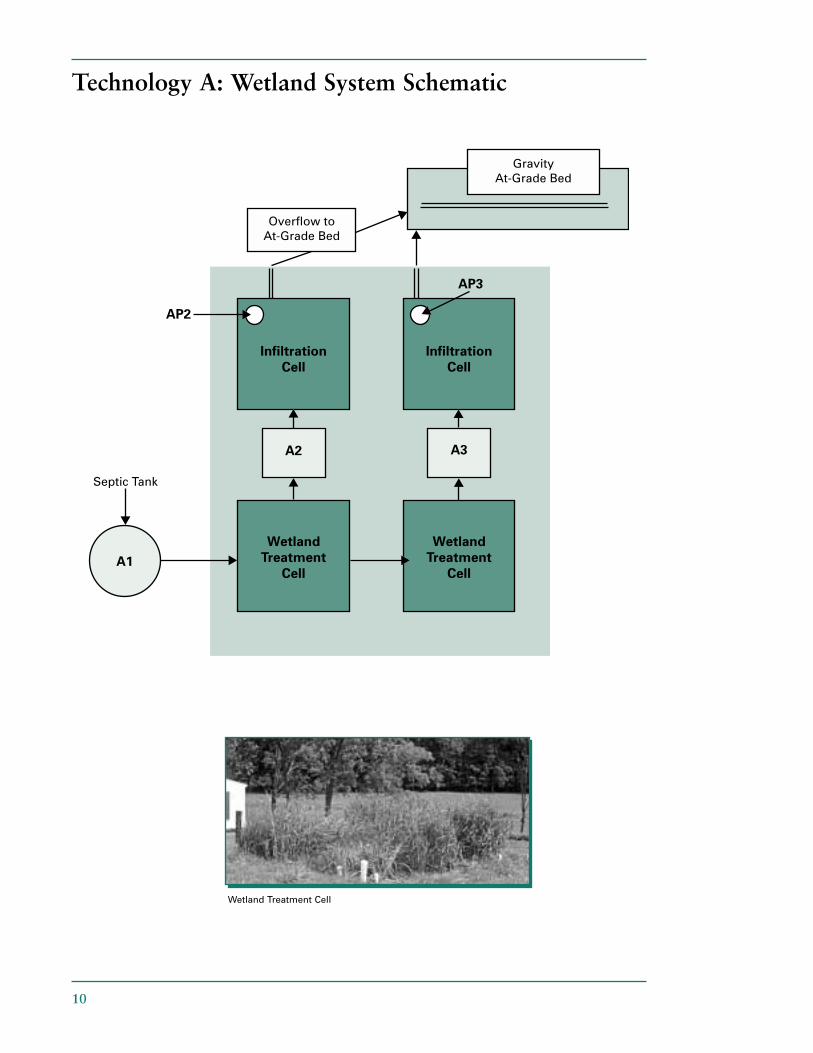
consisted of two 16' by 16' cells approximately 2.5ft. deep. The first cell was lined with a
20-mil PVC liner. The second cell was open at the bottom, but lined around the sidewalls.
The media used was 3/4" clean stone. A gravity dosed at-grade bed containing one - 4in.
PVC pipe was used to handle any overflow from the infiltration cell.
Both wetland systems received septic tank quality effluent.
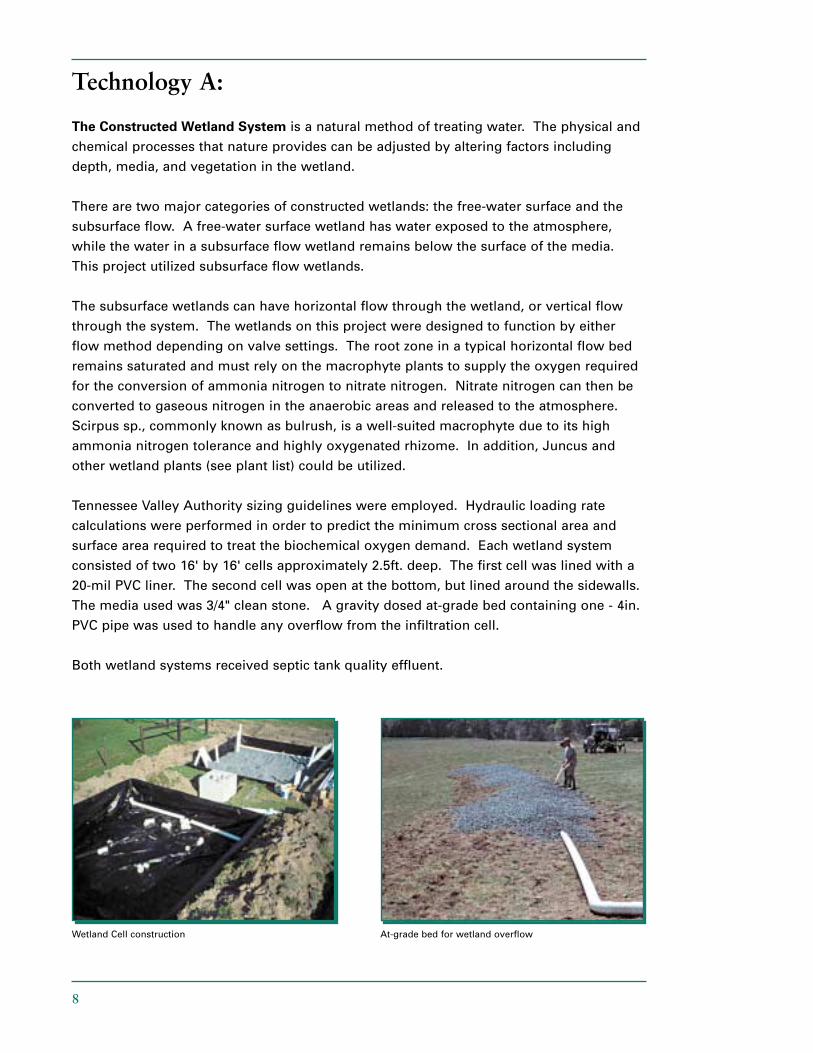
Wetland Cell construction At-grade bed for wetland overflow
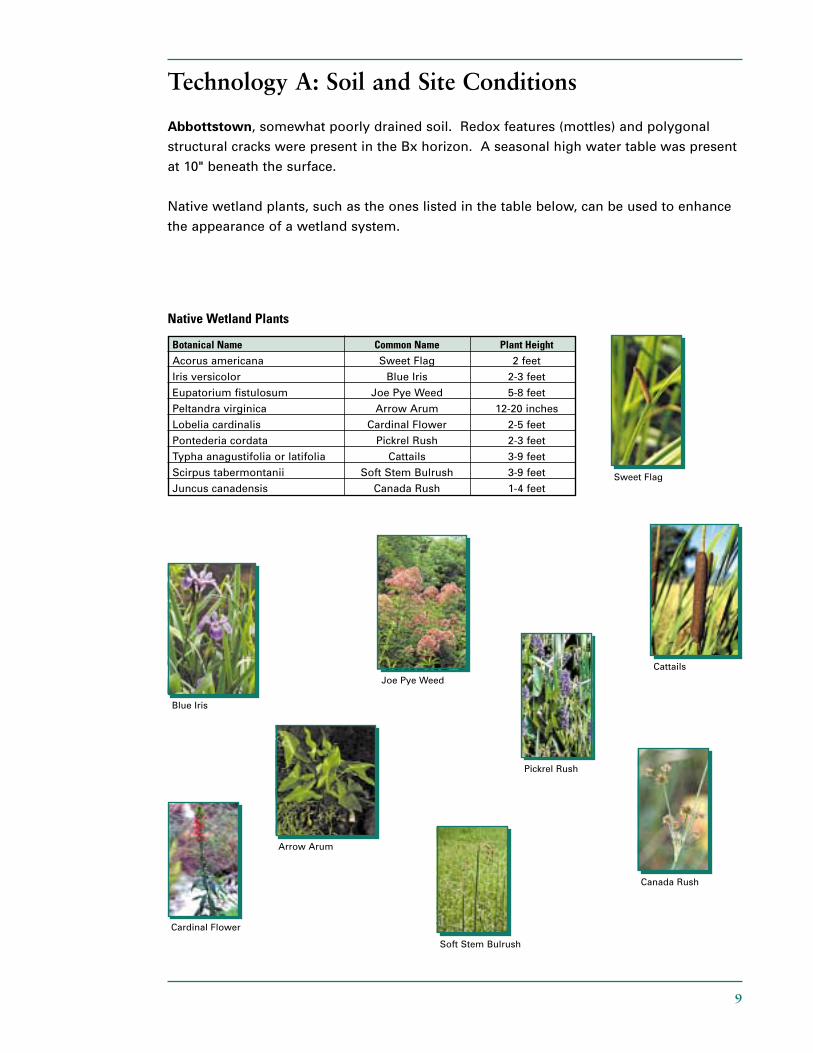
Technology A: Soil and Site Conditions
Abbottstown, somewhat poorly drained soil. Redox features (mottles) and polygonal
structural cracks were present in the Bx horizon. A seasonal high water table was present
at 10" beneath the surface.
Native wetland plants, such as the ones listed in the table below, can be used to enhance
the appearance of a wetland system.
9
Native Wetland Plants
Botanical Name Common Name Plant HeightAcorus americana Sweet Flag 2 feet
Iris versicolor Blue Iris 2-3 feet
Eupatorium fistulosum Joe Pye Weed 5-8 feet
Peltandra virginica Arrow Arum 12-20 inches
Lobelia cardinalis Cardinal Flower 2-5 feet
Pontederia cordata Pickrel Rush 2-3 feet
Typha anagustifolia or latifolia Cattails 3-9 feet
Scirpus tabermontanii Soft Stem Bulrush 3-9 feet
Juncus canadensis Canada Rush 1-4 feetSweet Flag
Cattails
Pickrel Rush
Blue Iris
Arrow Arum
Soft Stem Bulrush
Canada Rush
Cardinal Flower
Joe Pye Weed
10
Technology A: Wetland System Schematic
Wetland Treatment Cell
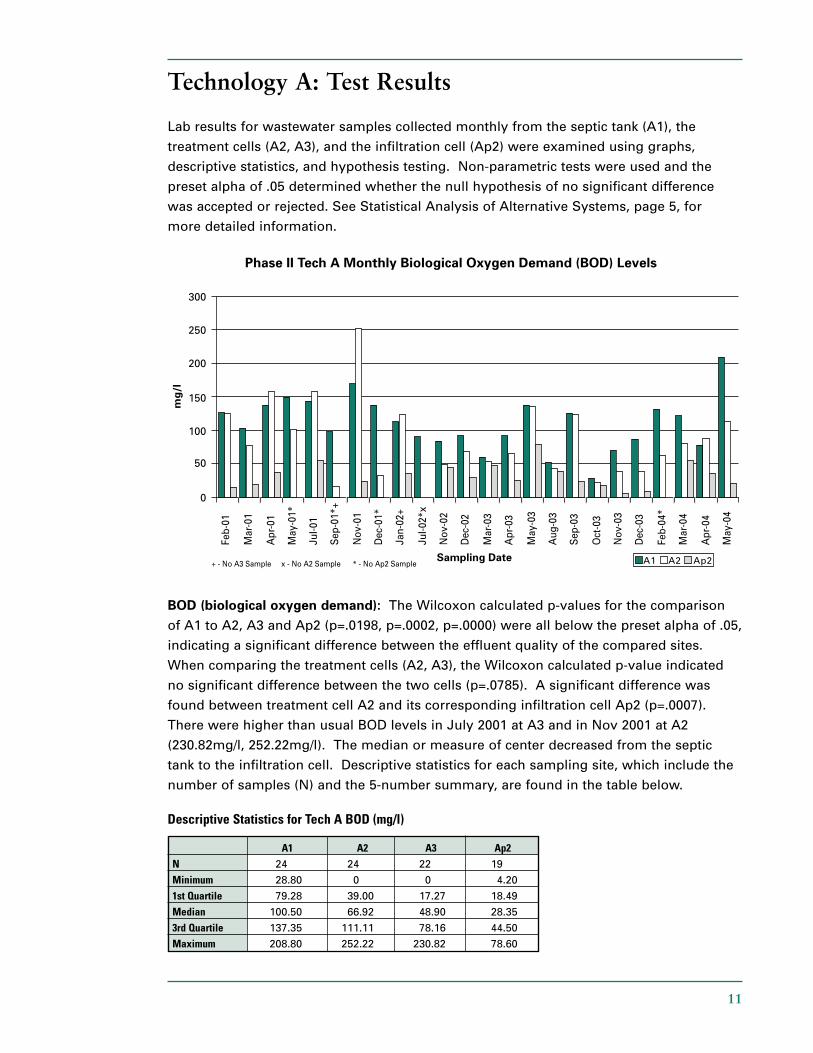
Technology A: Test Results
Lab results for wastewater samples collected monthly from the septic tank (A1), the
treatment cells (A2, A3), and the infiltration cell (Ap2) were examined using graphs,
descriptive statistics, and hypothesis testing. Non-parametric tests were used and the
preset alpha of .05 determined whether the null hypothesis of no significant difference
was accepted or rejected. See Statistical Analysis of Alternative Systems, page 5, for
more detailed information.
BOD (biological oxygen demand): The Wilcoxon calculated p-values for the comparison
of A1 to A2, A3 and Ap2 (p=.0198, p=.0002, p=.0000) were all below the preset alpha of .05,
indicating a significant difference between the effluent quality of the compared sites.
When comparing the treatment cells (A2, A3), the Wilcoxon calculated p-value indicated
no significant difference between the two cells (p=.0785). A significant difference was
found between treatment cell A2 and its corresponding infiltration cell Ap2 (p=.0007).
There were higher than usual BOD levels in July 2001 at A3 and in Nov 2001 at A2
(230.82mg/l, 252.22mg/l). The median or measure of center decreased from the septic
tank to the infiltration cell. Descriptive statistics for each sampling site, which include the
number of samples (N) and the 5-number summary, are found in the table below.
11
Descriptive Statistics for Tech A BOD (mg/l)
A1 A2 A3 Ap2N 24 24 22 19
Minimum 28.80 0 0 4.20
1st Quartile 79.28 39.00 17.27 18.49
Median 100.50 66.92 48.90 28.35
3rd Quartile 137.35 111.11 78.16 44.50
Maximum 208.80 252.22 230.82 78.60
12
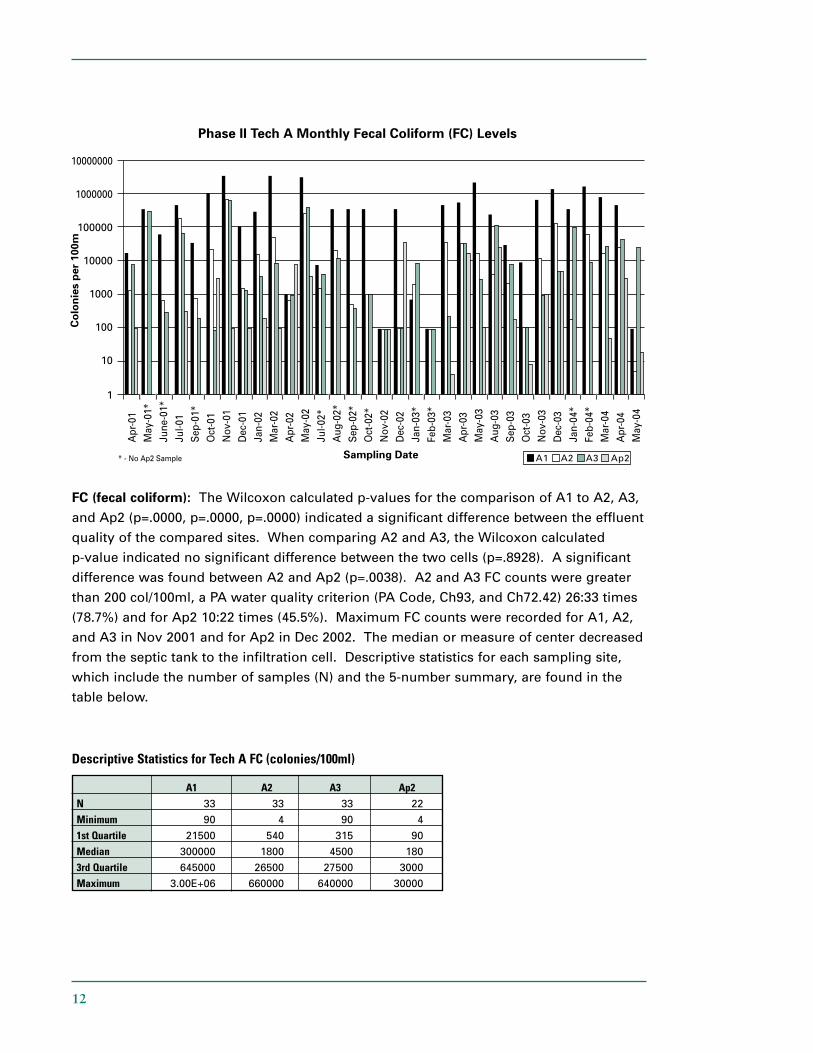
FC (fecal coliform): The Wilcoxon calculated p-values for the comparison of A1 to A2, A3,
and Ap2 (p=.0000, p=.0000, p=.0000) indicated a significant difference between the effluent
quality of the compared sites. When comparing A2 and A3, the Wilcoxon calculated
p-value indicated no significant difference between the two cells (p=.8928). A significant
difference was found between A2 and Ap2 (p=.0038). A2 and A3 FC counts were greater
than 200 col/100ml, a PA water quality criterion (PA Code, Ch93, and Ch72.42) 26:33 times
(78.7%) and for Ap2 10:22 times (45.5%). Maximum FC counts were recorded for A1, A2,
and A3 in Nov 2001 and for Ap2 in Dec 2002. The median or measure of center decreased
from the septic tank to the infiltration cell. Descriptive statistics for each sampling site,
which include the number of samples (N) and the 5-number summary, are found in the
table below.
Descriptive Statistics for Tech A FC (colonies/100ml)
A1 A2 A3 Ap2N 33 33 33 22
Minimum 90 4 90 4
1st Quartile 21500 540 315 90
Median 300000 1800 4500 180
3rd Quartile 645000 26500 27500 3000
Maximum 3.00E+06 660000 640000 30000
13
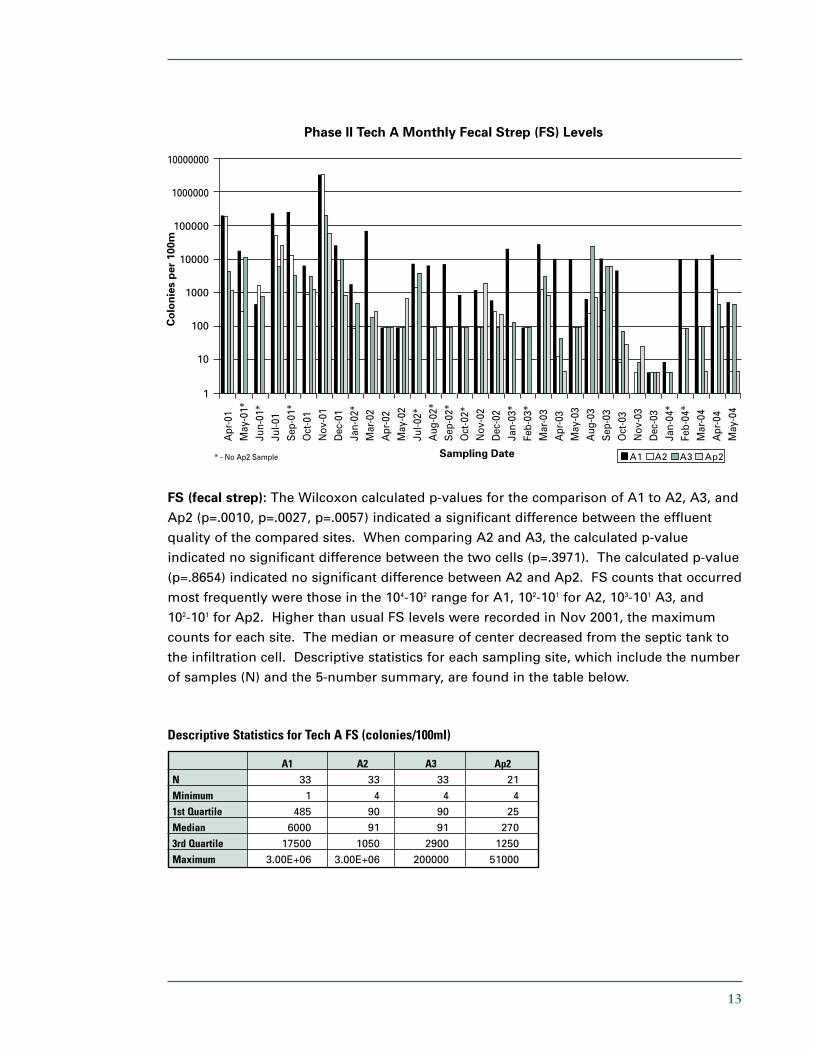
FS (fecal strep): The Wilcoxon calculated p-values for the comparison of A1 to A2, A3, and
Ap2 (p=.0010, p=.0027, p=.0057) indicated a significant difference between the effluent
quality of the compared sites. When comparing A2 and A3, the calculated p-value
indicated no significant difference between the two cells (p=.3971). The calculated p-value
(p=.8654) indicated no significant difference between A2 and Ap2. FS counts that occurred
most frequently were those in the 104-102 range for A1, 102-101 for A2, 103-101 A3, and
102-101 for Ap2. Higher than usual FS levels were recorded in Nov 2001, the maximum
counts for each site. The median or measure of center decreased from the septic tank to
the infiltration cell. Descriptive statistics for each sampling site, which include the number
of samples (N) and the 5-number summary, are found in the table below.
Descriptive Statistics for Tech A FS (colonies/100ml)
A1 A2 A3 Ap2N 33 33 33 21
Minimum 1 4 4 4
1st Quartile 485 90 90 25
Median 6000 91 91 270
3rd Quartile 17500 1050 2900 1250
Maximum 3.00E+06 3.00E+06 200000 51000
14
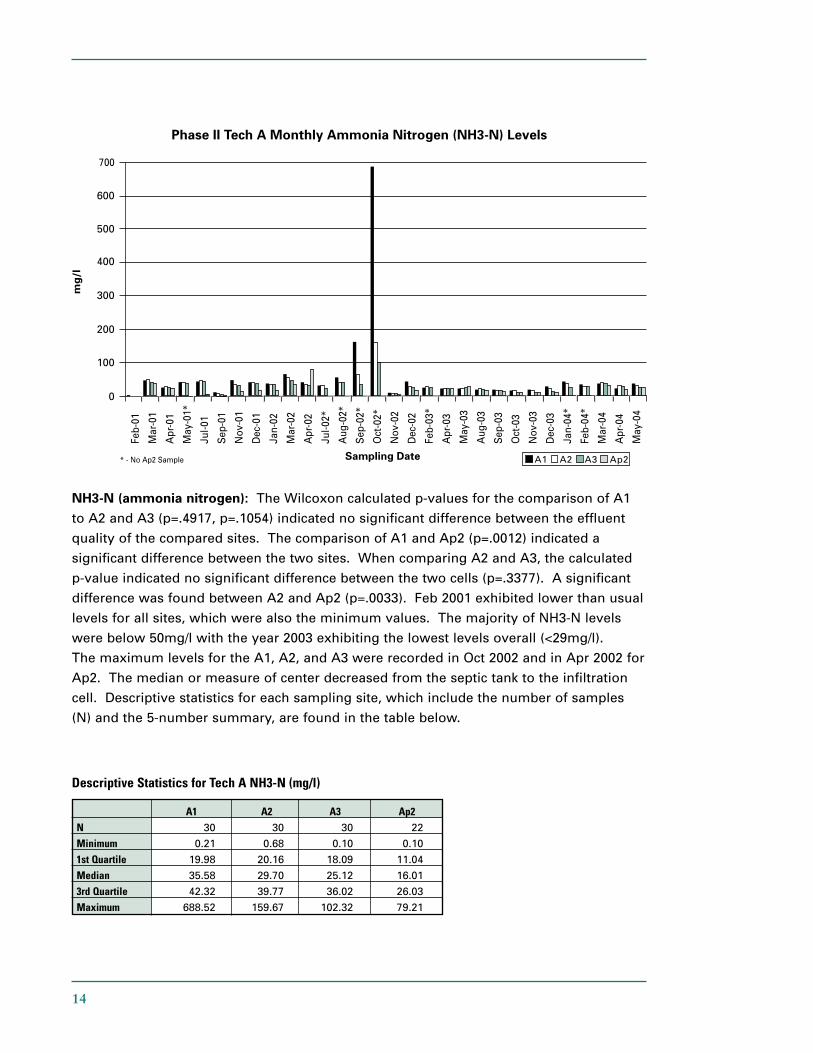
NH3-N (ammonia nitrogen): The Wilcoxon calculated p-values for the comparison of A1
to A2 and A3 (p=.4917, p=.1054) indicated no significant difference between the effluent
quality of the compared sites. The comparison of A1 and Ap2 (p=.0012) indicated a
significant difference between the two sites. When comparing A2 and A3, the calculated
p-value indicated no significant difference between the two cells (p=.3377). A significant
difference was found between A2 and Ap2 (p=.0033). Feb 2001 exhibited lower than usual
levels for all sites, which were also the minimum values. The majority of NH3-N levels
were below 50mg/l with the year 2003 exhibiting the lowest levels overall (<29mg/l).
The maximum levels for the A1, A2, and A3 were recorded in Oct 2002 and in Apr 2002 for
Ap2. The median or measure of center decreased from the septic tank to the infiltration
cell. Descriptive statistics for each sampling site, which include the number of samples
(N) and the 5-number summary, are found in the table below.
Descriptive Statistics for Tech A NH3-N (mg/l)
A1 A2 A3 Ap2N 30 30 30 22
Minimum 0.21 0.68 0.10 0.10
1st Quartile 19.98 20.16 18.09 11.04
Median 35.58 29.70 25.12 16.01
3rd Quartile 42.32 39.77 36.02 26.03
Maximum 688.52 159.67 102.32 79.21
15
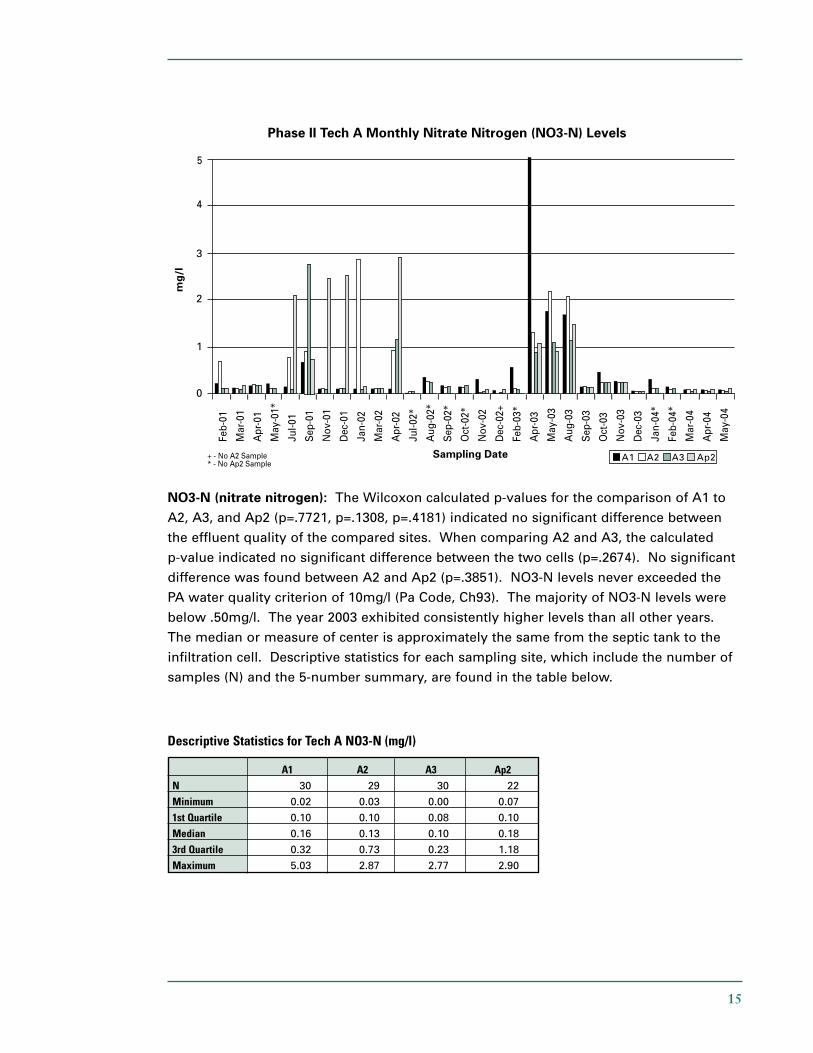
NO3-N (nitrate nitrogen): The Wilcoxon calculated p-values for the comparison of A1 to
A2, A3, and Ap2 (p=.7721, p=.1308, p=.4181) indicated no significant difference between
the effluent quality of the compared sites. When comparing A2 and A3, the calculated
p-value indicated no significant difference between the two cells (p=.2674). No significant
difference was found between A2 and Ap2 (p=.3851). NO3-N levels never exceeded the
PA water quality criterion of 10mg/l (Pa Code, Ch93). The majority of NO3-N levels were
below .50mg/l. The year 2003 exhibited consistently higher levels than all other years.
The median or measure of center is approximately the same from the septic tank to the
infiltration cell. Descriptive statistics for each sampling site, which include the number of
samples (N) and the 5-number summary, are found in the table below.
Descriptive Statistics for Tech A NO3-N (mg/l)
A1 A2 A3 Ap2N 30 29 30 22
Minimum 0.02 0.03 0.00 0.07
1st Quartile 0.10 0.10 0.08 0.10
Median 0.16 0.13 0.10 0.18
3rd Quartile 0.32 0.73 0.23 1.18
Maximum 5.03 2.87 2.77 2.90
16
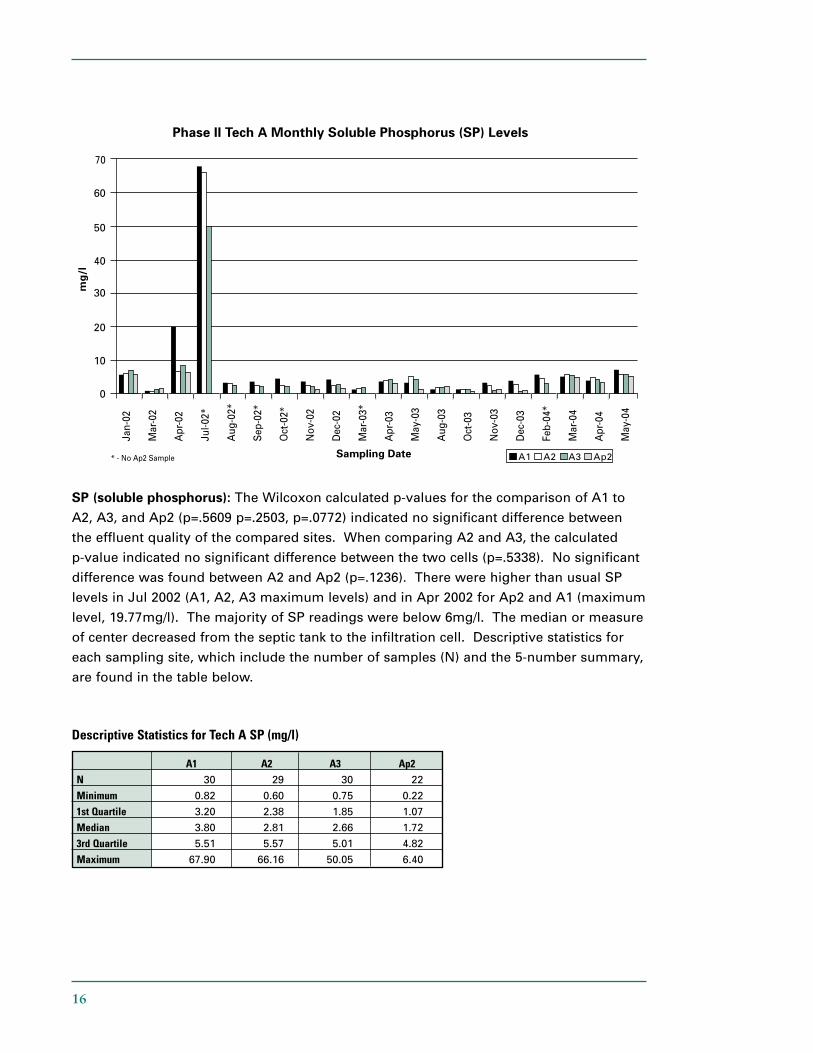
SP (soluble phosphorus): The Wilcoxon calculated p-values for the comparison of A1 to
A2, A3, and Ap2 (p=.5609 p=.2503, p=.0772) indicated no significant difference between
the effluent quality of the compared sites. When comparing A2 and A3, the calculated
p-value indicated no significant difference between the two cells (p=.5338). No significant
difference was found between A2 and Ap2 (p=.1236). There were higher than usual SP
levels in Jul 2002 (A1, A2, A3 maximum levels) and in Apr 2002 for Ap2 and A1 (maximum
level, 19.77mg/l). The majority of SP readings were below 6mg/l. The median or measure
of center decreased from the septic tank to the infiltration cell. Descriptive statistics for
each sampling site, which include the number of samples (N) and the 5-number summary,
are found in the table below.
Descriptive Statistics for Tech A SP (mg/l)
A1 A2 A3 Ap2N 30 29 30 22
Minimum 0.82 0.60 0.75 0.22
1st Quartile 3.20 2.38 1.85 1.07
Median 3.80 2.81 2.66 1.72
3rd Quartile 5.51 5.57 5.01 4.82
Maximum 67.90 66.16 50.05 6.40
Technology B:
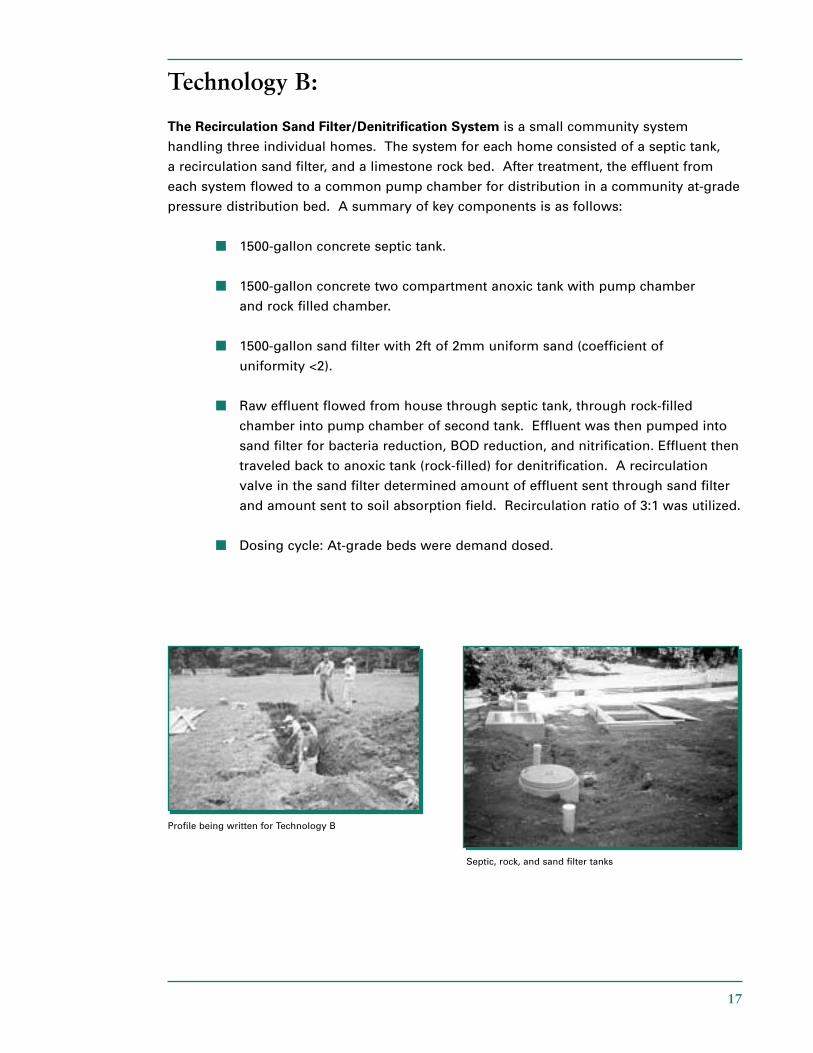
The Recirculation Sand Filter/Denitrification System is a small community system
handling three individual homes. The system for each home consisted of a septic tank,
a recirculation sand filter, and a limestone rock bed. After treatment, the effluent from
each system flowed to a common pump chamber for distribution in a community at-grade
pressure distribution bed. A summary of key components is as follows:
■ 1500-gallon concrete septic tank.
■ 1500-gallon concrete two compartment anoxic tank with pump chamber
and rock filled chamber.
■ 1500-gallon sand filter with 2ft of 2mm uniform sand (coefficient of
uniformity <2).
■ Raw effluent flowed from house through septic tank, through rock-filled
chamber into pump chamber of second tank. Effluent was then pumped into
sand filter for bacteria reduction, BOD reduction, and nitrification. Effluent then
traveled back to anoxic tank (rock-filled) for denitrification. A recirculation
valve in the sand filter determined amount of effluent sent through sand filter
and amount sent to soil absorption field. Recirculation ratio of 3:1 was utilized.
■ Dosing cycle: At-grade beds were demand dosed.
17
Septic, rock, and sand filter tanks
Profile being written for Technology B
18
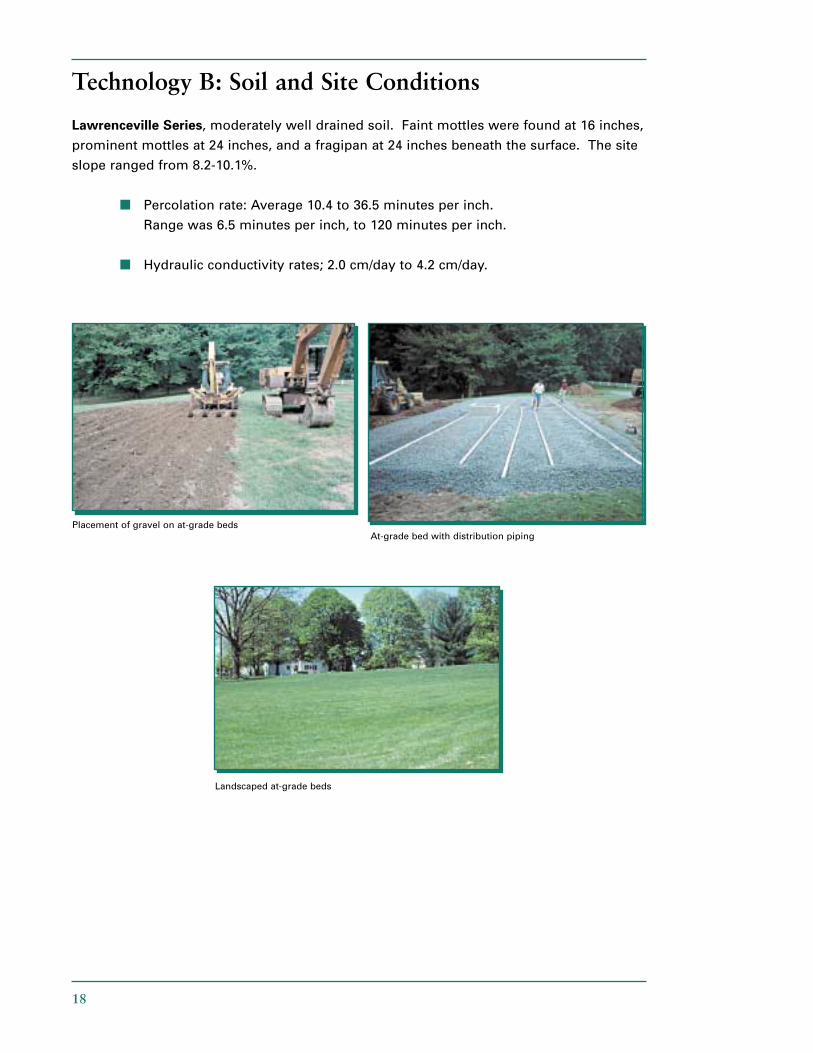
Technology B: Soil and Site Conditions
Lawrenceville Series, moderately well drained soil. Faint mottles were found at 16 inches,
prominent mottles at 24 inches, and a fragipan at 24 inches beneath the surface. The site
slope ranged from 8.2-10.1%.
■ Percolation rate: Average 10.4 to 36.5 minutes per inch.
Range was 6.5 minutes per inch, to 120 minutes per inch.
■ Hydraulic conductivity rates; 2.0 cm/day to 4.2 cm/day.
Landscaped at-grade beds
Placement of gravel on at-grade bedsAt-grade bed with distribution piping
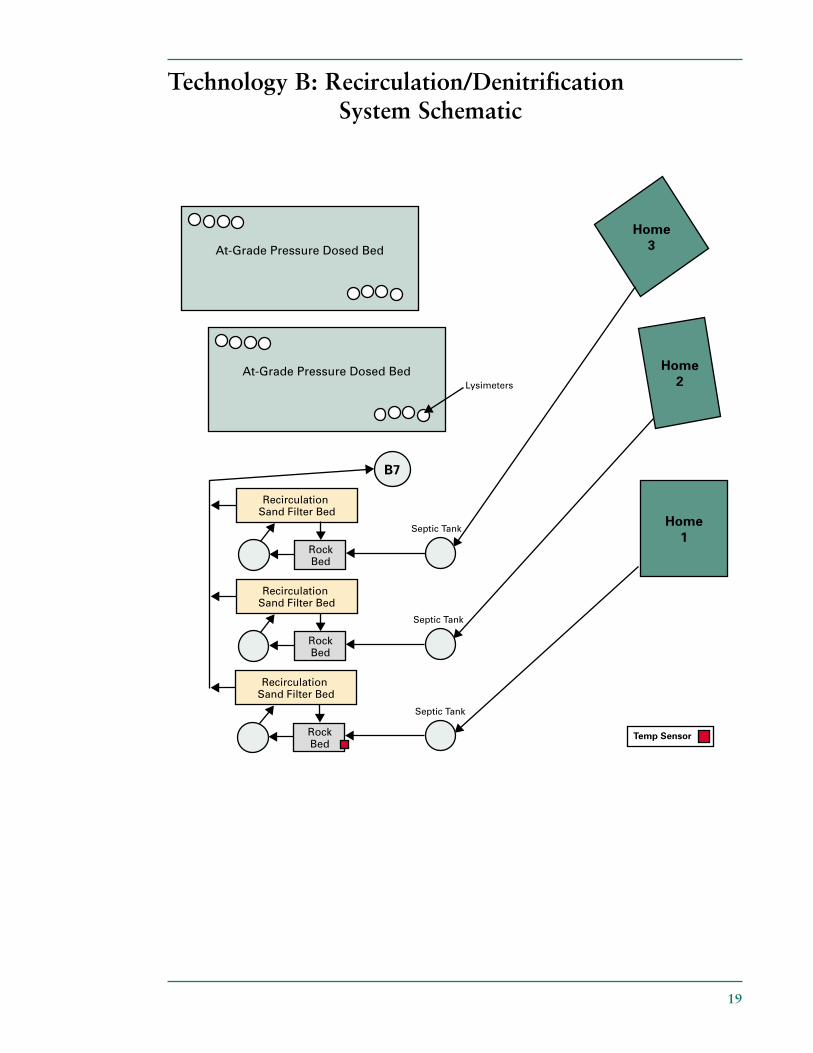
Technology B: Recirculation/Denitrification System Schematic
19
20
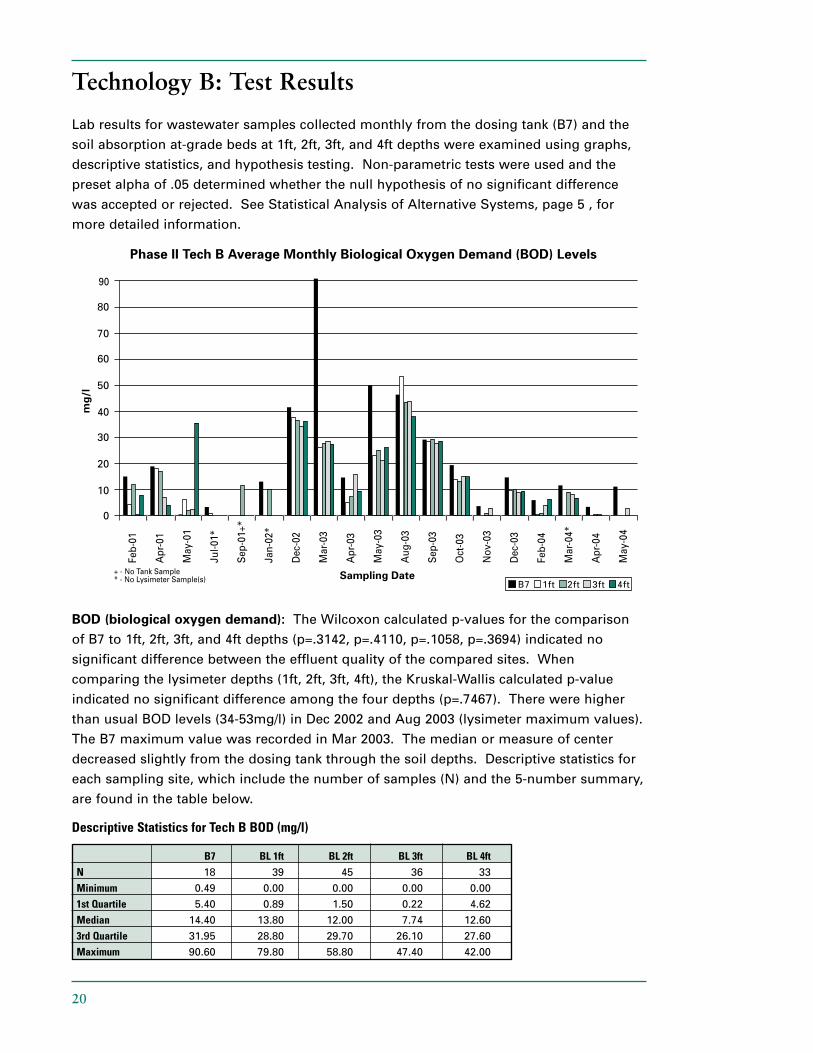
BOD (biological oxygen demand): The Wilcoxon calculated p-values for the comparison
of B7 to 1ft, 2ft, 3ft, and 4ft depths (p=.3142, p=.4110, p=.1058, p=.3694) indicated no
significant difference between the effluent quality of the compared sites. When
comparing the lysimeter depths (1ft, 2ft, 3ft, 4ft), the Kruskal-Wallis calculated p-value
indicated no significant difference among the four depths (p=.7467). There were higher
than usual BOD levels (34-53mg/l) in Dec 2002 and Aug 2003 (lysimeter maximum values).
The B7 maximum value was recorded in Mar 2003. The median or measure of center
decreased slightly from the dosing tank through the soil depths. Descriptive statistics for
each sampling site, which include the number of samples (N) and the 5-number summary,
are found in the table below.
Descriptive Statistics for Tech B BOD (mg/l)
B7 BL 1ft BL 2ft BL 3ft BL 4ftN 18 39 45 36 33
Minimum 0.49 0.00 0.00 0.00 0.00
1st Quartile 5.40 0.89 1.50 0.22 4.62
Median 14.40 13.80 12.00 7.74 12.60
3rd Quartile 31.95 28.80 29.70 26.10 27.60
Maximum 90.60 79.80 58.80 47.40 42.00
Lab results for wastewater samples collected monthly from the dosing tank (B7) and the
soil absorption at-grade beds at 1ft, 2ft, 3ft, and 4ft depths were examined using graphs,
descriptive statistics, and hypothesis testing. Non-parametric tests were used and the
preset alpha of .05 determined whether the null hypothesis of no significant difference
was accepted or rejected. See Statistical Analysis of Alternative Systems, page 5 , for
more detailed information.
Technology B: Test Results
21
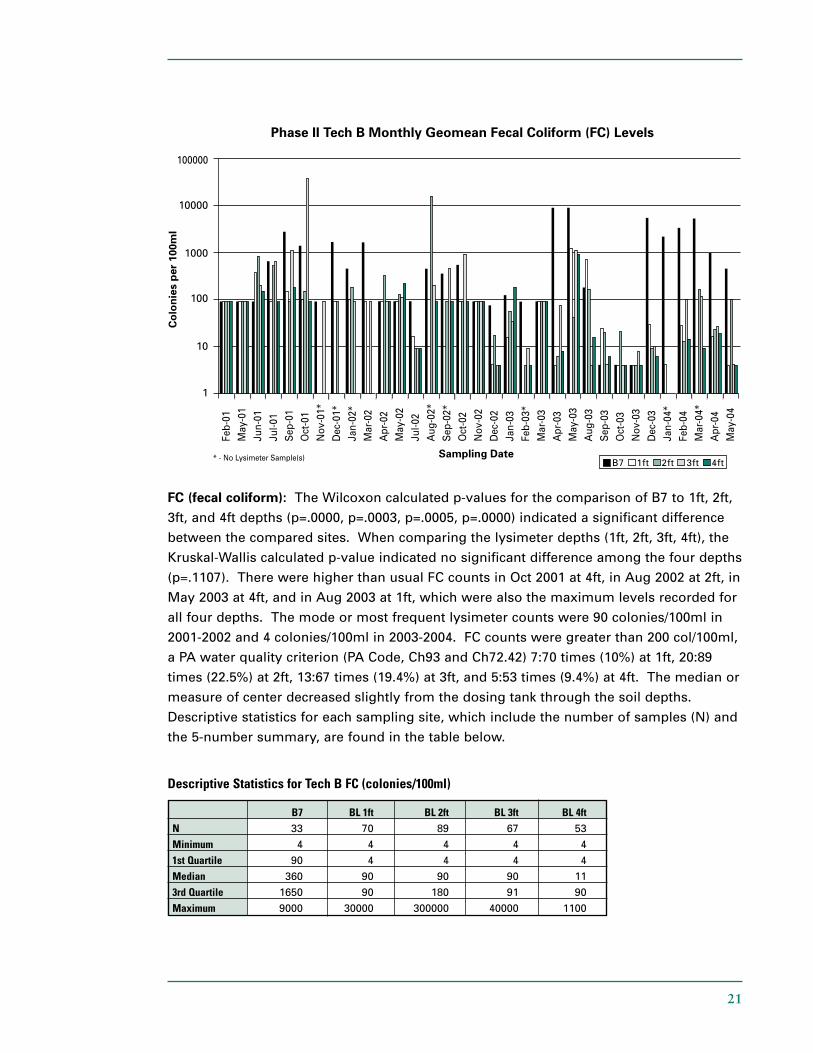
FC (fecal coliform): The Wilcoxon calculated p-values for the comparison of B7 to 1ft, 2ft,
3ft, and 4ft depths (p=.0000, p=.0003, p=.0005, p=.0000) indicated a significant difference
between the compared sites. When comparing the lysimeter depths (1ft, 2ft, 3ft, 4ft), the
Kruskal-Wallis calculated p-value indicated no significant difference among the four depths
(p=.1107). There were higher than usual FC counts in Oct 2001 at 4ft, in Aug 2002 at 2ft, in
May 2003 at 4ft, and in Aug 2003 at 1ft, which were also the maximum levels recorded for
all four depths. The mode or most frequent lysimeter counts were 90 colonies/100ml in
2001-2002 and 4 colonies/100ml in 2003-2004. FC counts were greater than 200 col/100ml,
a PA water quality criterion (PA Code, Ch93 and Ch72.42) 7:70 times (10%) at 1ft, 20:89
times (22.5%) at 2ft, 13:67 times (19.4%) at 3ft, and 5:53 times (9.4%) at 4ft. The median or
measure of center decreased slightly from the dosing tank through the soil depths.
Descriptive statistics for each sampling site, which include the number of samples (N) and
the 5-number summary, are found in the table below.
Descriptive Statistics for Tech B FC (colonies/100ml)
B7 BL 1ft BL 2ft BL 3ft BL 4ftN 33 70 89 67 53
Minimum 4 4 4 4 4
1st Quartile 90 4 4 4 4
Median 360 90 90 90 11
3rd Quartile 1650 90 180 91 90
Maximum 9000 30000 300000 40000 1100
22
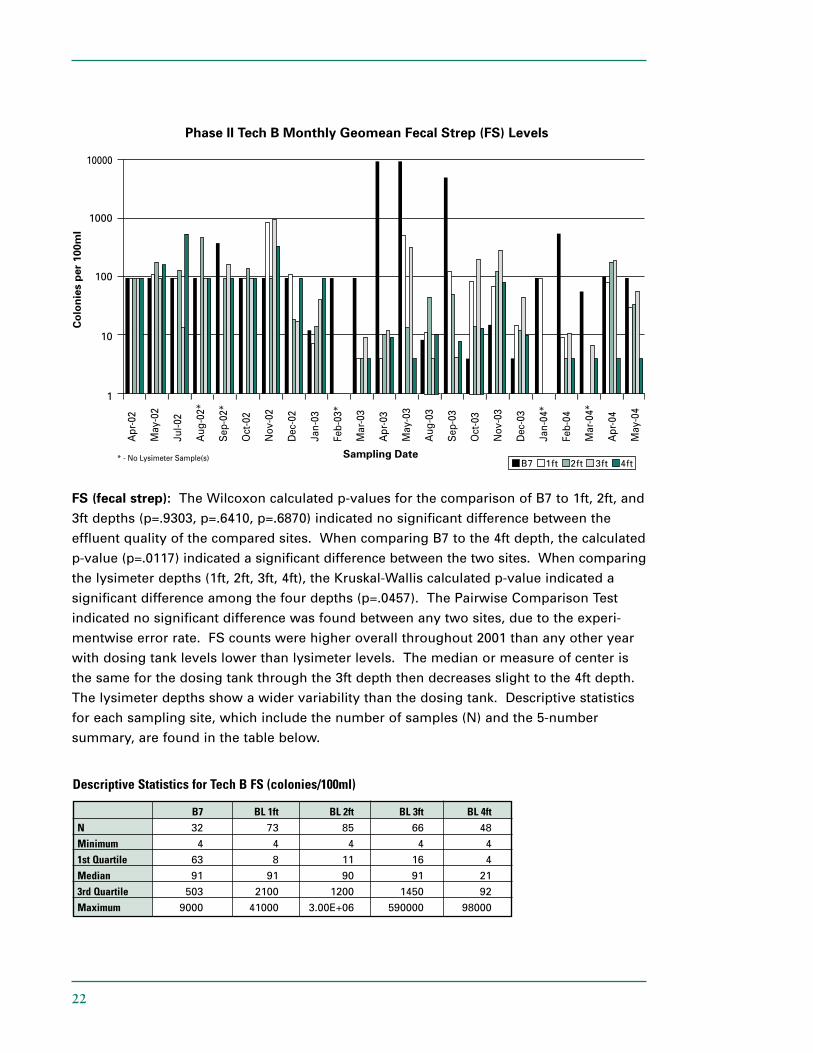
FS (fecal strep): The Wilcoxon calculated p-values for the comparison of B7 to 1ft, 2ft, and
3ft depths (p=.9303, p=.6410, p=.6870) indicated no significant difference between the
effluent quality of the compared sites. When comparing B7 to the 4ft depth, the calculated
p-value (p=.0117) indicated a significant difference between the two sites. When comparing
the lysimeter depths (1ft, 2ft, 3ft, 4ft), the Kruskal-Wallis calculated p-value indicated a
significant difference among the four depths (p=.0457). The Pairwise Comparison Test
indicated no significant difference was found between any two sites, due to the experi-
mentwise error rate. FS counts were higher overall throughout 2001 than any other year
with dosing tank levels lower than lysimeter levels. The median or measure of center is
the same for the dosing tank through the 3ft depth then decreases slight to the 4ft depth.
The lysimeter depths show a wider variability than the dosing tank. Descriptive statistics
for each sampling site, which include the number of samples (N) and the 5-number
summary, are found in the table below.
Descriptive Statistics for Tech B FS (colonies/100ml)
B7 BL 1ft BL 2ft BL 3ft BL 4ftN 32 73 85 66 48
Minimum 4 4 4 4 4
1st Quartile 63 8 11 16 4
Median 91 91 90 91 21
3rd Quartile 503 2100 1200 1450 92
Maximum 9000 41000 3.00E+06 590000 98000
23
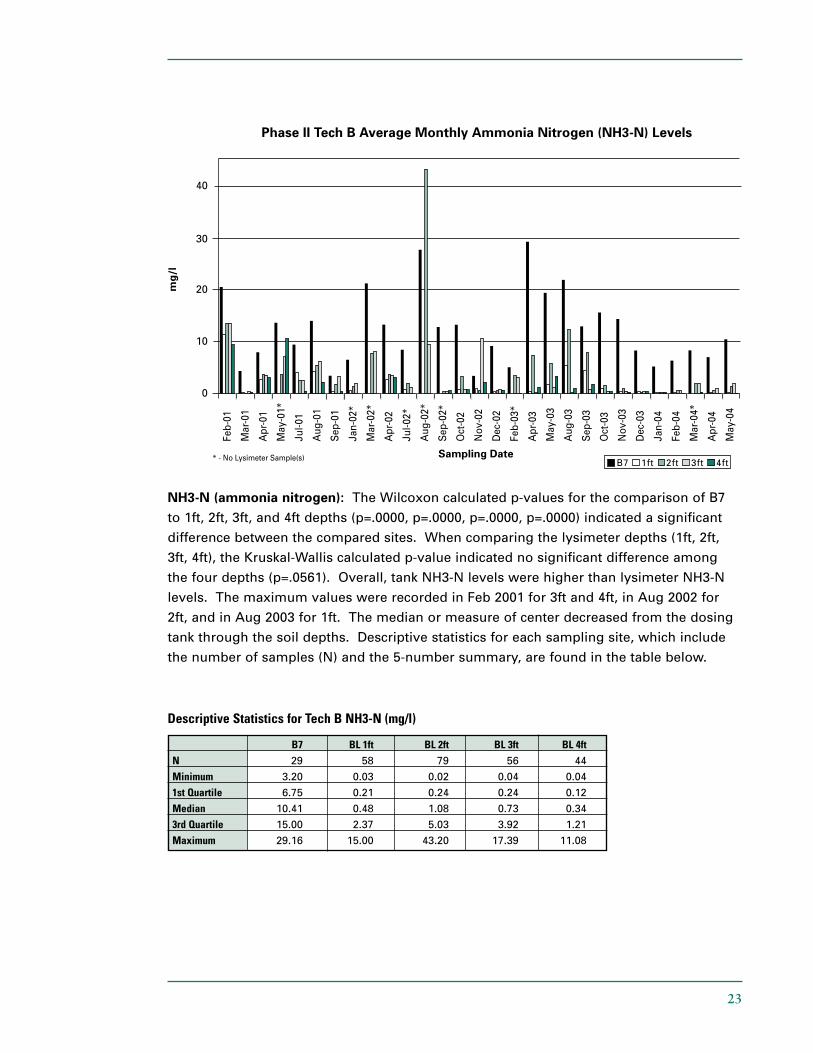
NH3-N (ammonia nitrogen): The Wilcoxon calculated p-values for the comparison of B7
to 1ft, 2ft, 3ft, and 4ft depths (p=.0000, p=.0000, p=.0000, p=.0000) indicated a significant
difference between the compared sites. When comparing the lysimeter depths (1ft, 2ft,
3ft, 4ft), the Kruskal-Wallis calculated p-value indicated no significant difference among
the four depths (p=.0561). Overall, tank NH3-N levels were higher than lysimeter NH3-N
levels. The maximum values were recorded in Feb 2001 for 3ft and 4ft, in Aug 2002 for
2ft, and in Aug 2003 for 1ft. The median or measure of center decreased from the dosing
tank through the soil depths. Descriptive statistics for each sampling site, which include
the number of samples (N) and the 5-number summary, are found in the table below.
Descriptive Statistics for Tech B NH3-N (mg/l)
B7 BL 1ft BL 2ft BL 3ft BL 4ftN 29 58 79 56 44
Minimum 3.20 0.03 0.02 0.04 0.04
1st Quartile 6.75 0.21 0.24 0.24 0.12
Median 10.41 0.48 1.08 0.73 0.34
3rd Quartile 15.00 2.37 5.03 3.92 1.21
Maximum 29.16 15.00 43.20 17.39 11.08
24
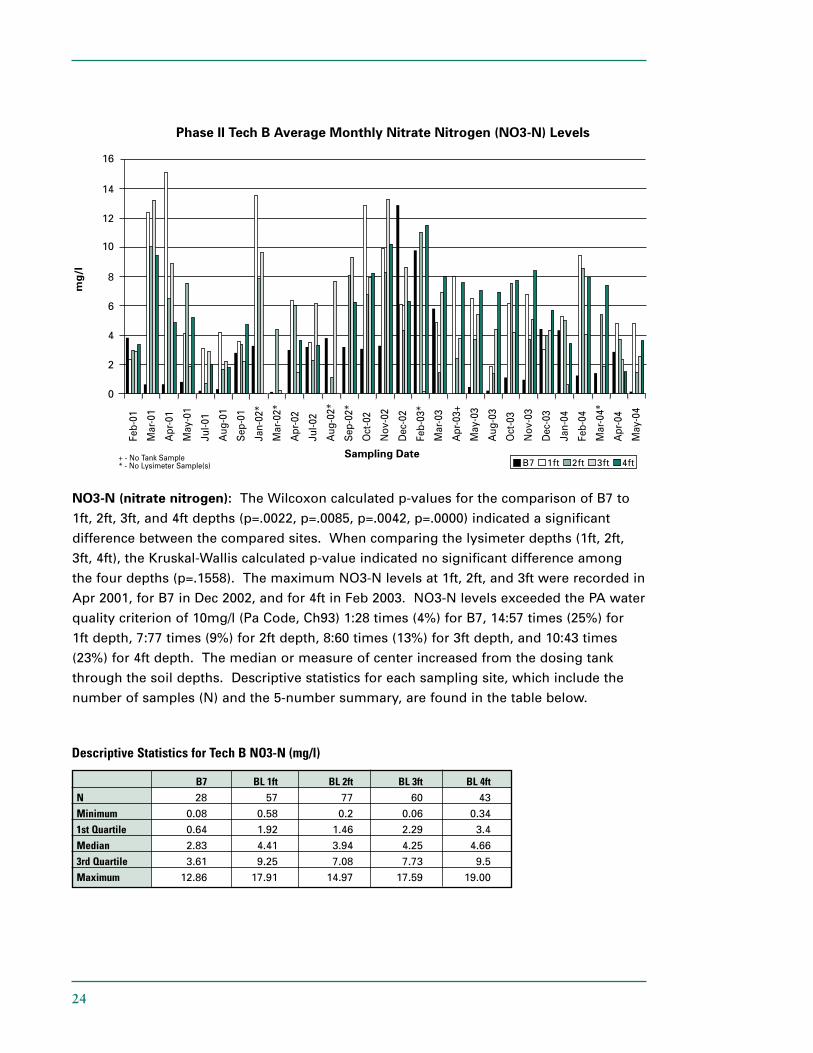
NO3-N (nitrate nitrogen): The Wilcoxon calculated p-values for the comparison of B7 to
1ft, 2ft, 3ft, and 4ft depths (p=.0022, p=.0085, p=.0042, p=.0000) indicated a significant
difference between the compared sites. When comparing the lysimeter depths (1ft, 2ft,
3ft, 4ft), the Kruskal-Wallis calculated p-value indicated no significant difference among
the four depths (p=.1558). The maximum NO3-N levels at 1ft, 2ft, and 3ft were recorded in
Apr 2001, for B7 in Dec 2002, and for 4ft in Feb 2003. NO3-N levels exceeded the PA water
quality criterion of 10mg/l (Pa Code, Ch93) 1:28 times (4%) for B7, 14:57 times (25%) for
1ft depth, 7:77 times (9%) for 2ft depth, 8:60 times (13%) for 3ft depth, and 10:43 times
(23%) for 4ft depth. The median or measure of center increased from the dosing tank
through the soil depths. Descriptive statistics for each sampling site, which include the
number of samples (N) and the 5-number summary, are found in the table below.
Descriptive Statistics for Tech B NO3-N (mg/l)
B7 BL 1ft BL 2ft BL 3ft BL 4ftN 28 57 77 60 43
Minimum 0.08 0.58 0.2 0.06 0.34
1st Quartile 0.64 1.92 1.46 2.29 3.4
Median 2.83 4.41 3.94 4.25 4.66
3rd Quartile 3.61 9.25 7.08 7.73 9.5
Maximum 12.86 17.91 14.97 17.59 19.00
25
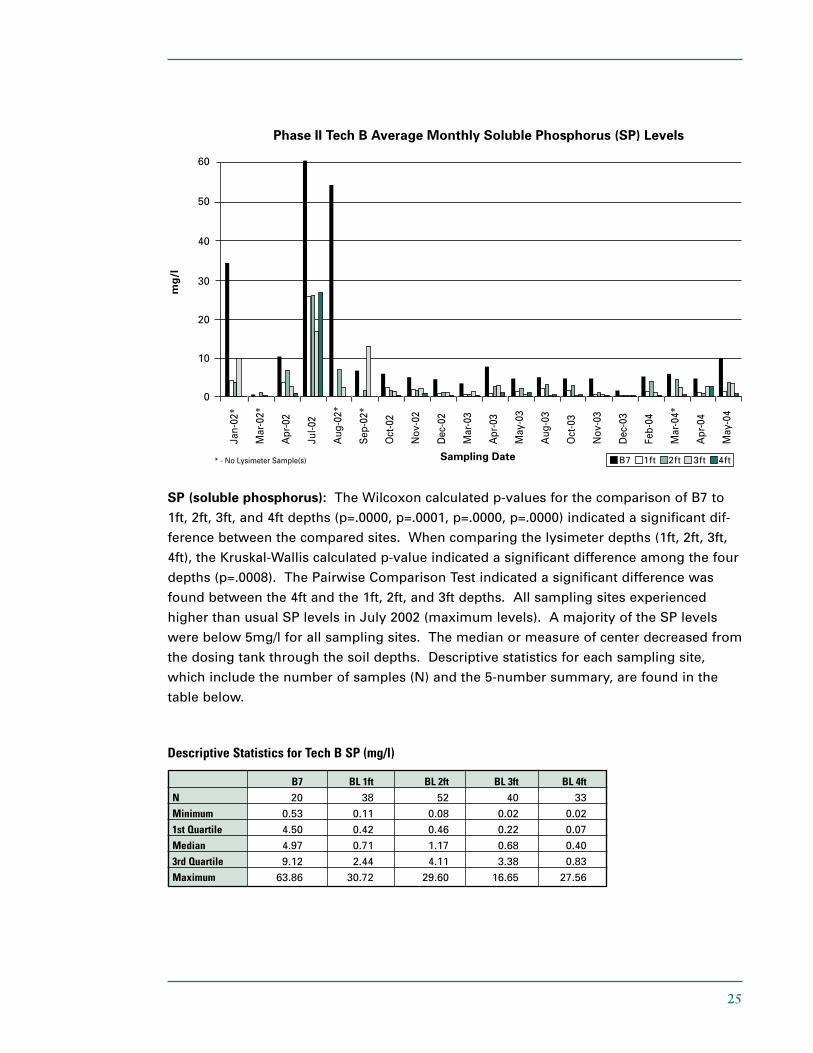
SP (soluble phosphorus): The Wilcoxon calculated p-values for the comparison of B7 to
1ft, 2ft, 3ft, and 4ft depths (p=.0000, p=.0001, p=.0000, p=.0000) indicated a significant dif-
ference between the compared sites. When comparing the lysimeter depths (1ft, 2ft, 3ft,
4ft), the Kruskal-Wallis calculated p-value indicated a significant difference among the four
depths (p=.0008). The Pairwise Comparison Test indicated a significant difference was
found between the 4ft and the 1ft, 2ft, and 3ft depths. All sampling sites experienced
higher than usual SP levels in July 2002 (maximum levels). A majority of the SP levels
were below 5mg/l for all sampling sites. The median or measure of center decreased from
the dosing tank through the soil depths. Descriptive statistics for each sampling site,
which include the number of samples (N) and the 5-number summary, are found in the
table below.
Descriptive Statistics for Tech B SP (mg/l)
B7 BL 1ft BL 2ft BL 3ft BL 4ftN 20 38 52 40 33
Minimum 0.53 0.11 0.08 0.02 0.02
1st Quartile 4.50 0.42 0.46 0.22 0.07
Median 4.97 0.71 1.17 0.68 0.40
3rd Quartile 9.12 2.44 4.11 3.38 0.83
Maximum 63.86 30.72 29.60 16.65 27.56
26
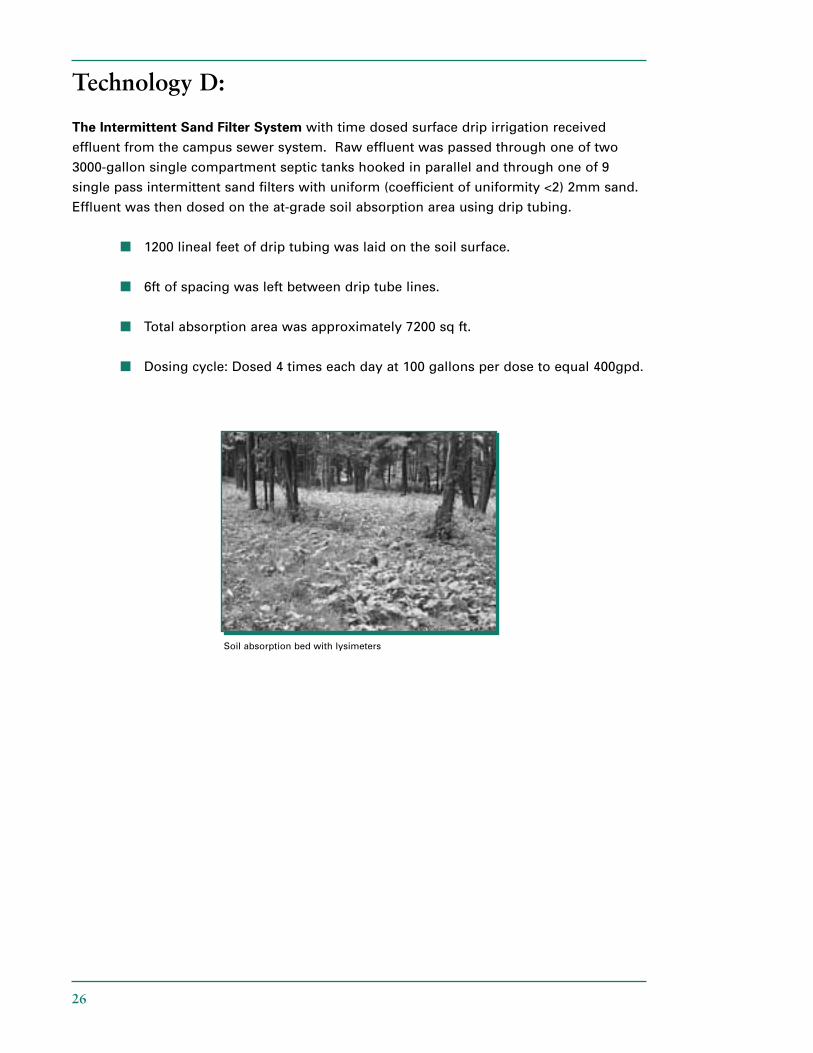
Technology D:
The Intermittent Sand Filter System with time dosed surface drip irrigation received
effluent from the campus sewer system. Raw effluent was passed through one of two
3000-gallon single compartment septic tanks hooked in parallel and through one of 9
single pass intermittent sand filters with uniform (coefficient of uniformity <2) 2mm sand.
Effluent was then dosed on the at-grade soil absorption area using drip tubing.
■ 1200 lineal feet of drip tubing was laid on the soil surface.
■ 6ft of spacing was left between drip tube lines.
■ Total absorption area was approximately 7200 sq ft.
■ Dosing cycle: Dosed 4 times each day at 100 gallons per dose to equal 400gpd.
Soil absorption bed with lysimeters
27
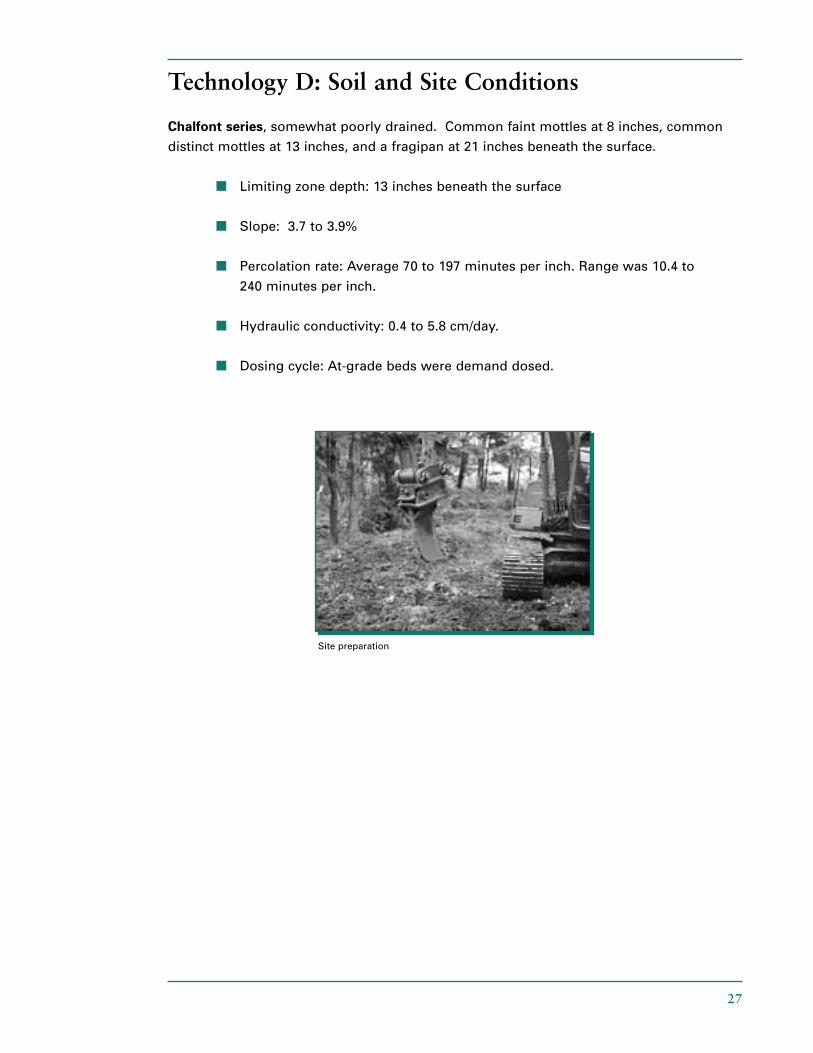
Technology D: Soil and Site Conditions
Chalfont series, somewhat poorly drained. Common faint mottles at 8 inches, common
distinct mottles at 13 inches, and a fragipan at 21 inches beneath the surface.
■ Limiting zone depth: 13 inches beneath the surface
■ Slope: 3.7 to 3.9%
■ Percolation rate: Average 70 to 197 minutes per inch. Range was 10.4 to
240 minutes per inch.
■ Hydraulic conductivity: 0.4 to 5.8 cm/day.
■ Dosing cycle: At-grade beds were demand dosed.
Site preparation
28
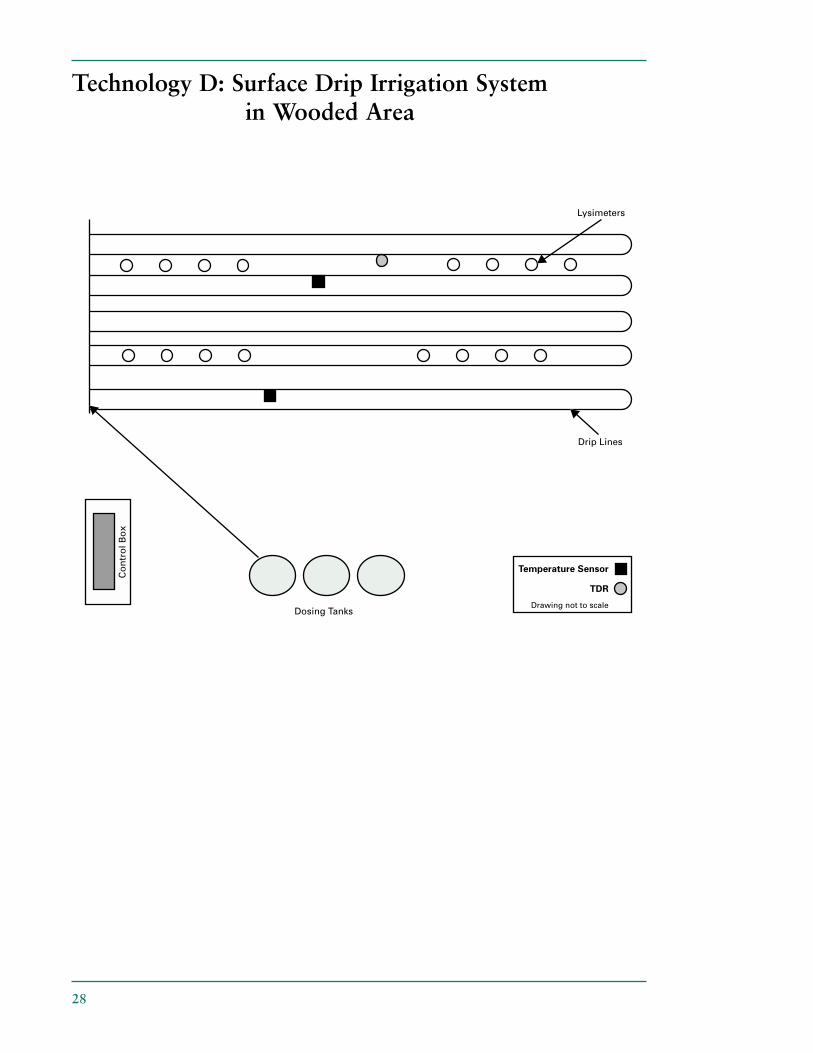
Technology D: Surface Drip Irrigation System in Wooded Area
29
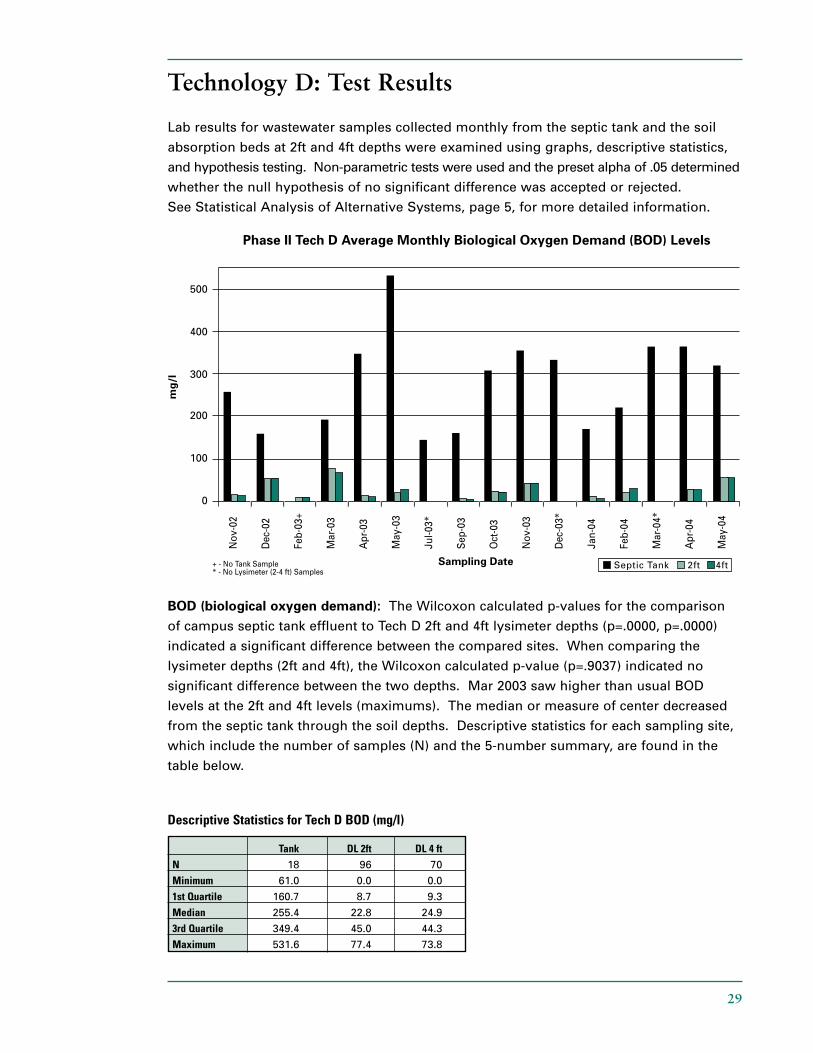
Technology D: Test Results
Lab results for wastewater samples collected monthly from the septic tank and the soil
absorption beds at 2ft and 4ft depths were examined using graphs, descriptive statistics,
and hypothesis testing. Non-parametric tests were used and the preset alpha of .05 determined
whether the null hypothesis of no significant difference was accepted or rejected.
See Statistical Analysis of Alternative Systems, page 5, for more detailed information.
BOD (biological oxygen demand): The Wilcoxon calculated p-values for the comparison
of campus septic tank effluent to Tech D 2ft and 4ft lysimeter depths (p=.0000, p=.0000)
indicated a significant difference between the compared sites. When comparing the
lysimeter depths (2ft and 4ft), the Wilcoxon calculated p-value (p=.9037) indicated no
significant difference between the two depths. Mar 2003 saw higher than usual BOD
levels at the 2ft and 4ft levels (maximums). The median or measure of center decreased
from the septic tank through the soil depths. Descriptive statistics for each sampling site,
which include the number of samples (N) and the 5-number summary, are found in the
table below.
Descriptive Statistics for Tech D BOD (mg/l)
Tank DL 2ft DL 4 ftN 18 96 70
Minimum 61.0 0.0 0.0
1st Quartile 160.7 8.7 9.3
Median 255.4 22.8 24.9
3rd Quartile 349.4 45.0 44.3
Maximum 531.6 77.4 73.8
30
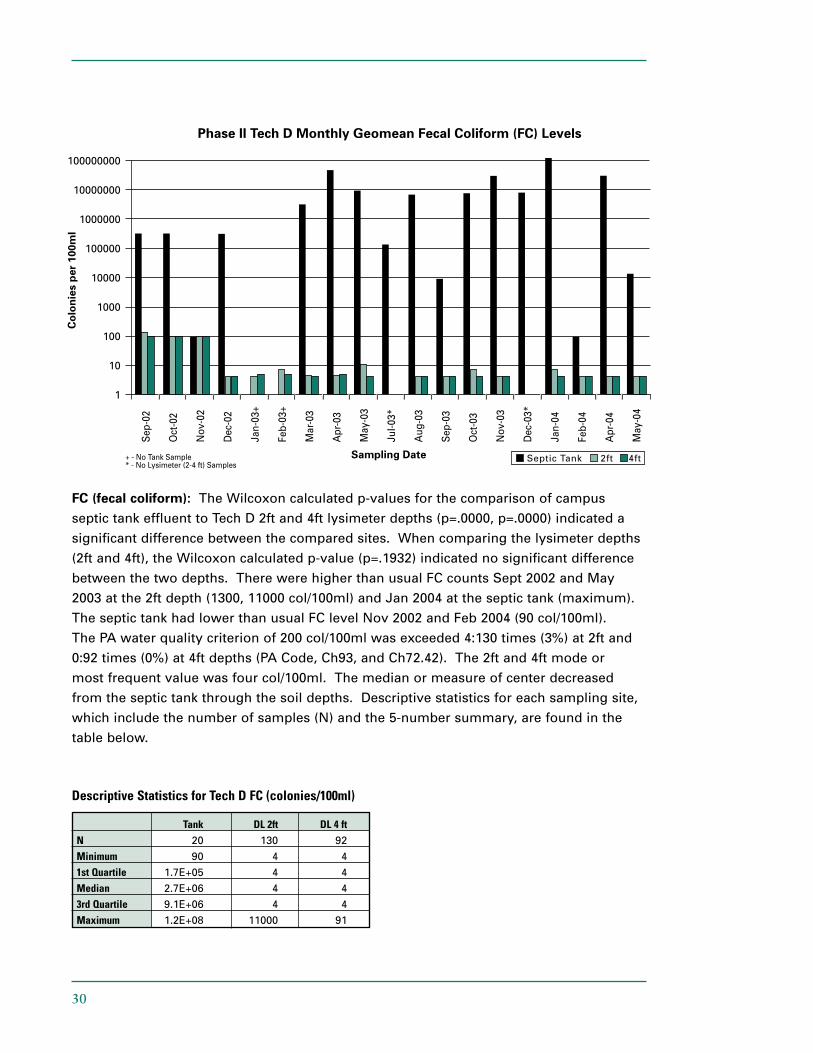
FC (fecal coliform): The Wilcoxon calculated p-values for the comparison of campus
septic tank effluent to Tech D 2ft and 4ft lysimeter depths (p=.0000, p=.0000) indicated a
significant difference between the compared sites. When comparing the lysimeter depths
(2ft and 4ft), the Wilcoxon calculated p-value (p=.1932) indicated no significant difference
between the two depths. There were higher than usual FC counts Sept 2002 and May
2003 at the 2ft depth (1300, 11000 col/100ml) and Jan 2004 at the septic tank (maximum).
The septic tank had lower than usual FC level Nov 2002 and Feb 2004 (90 col/100ml).
The PA water quality criterion of 200 col/100ml was exceeded 4:130 times (3%) at 2ft and
0:92 times (0%) at 4ft depths (PA Code, Ch93, and Ch72.42). The 2ft and 4ft mode or
most frequent value was four col/100ml. The median or measure of center decreased
from the septic tank through the soil depths. Descriptive statistics for each sampling site,
which include the number of samples (N) and the 5-number summary, are found in the
table below.
Descriptive Statistics for Tech D FC (colonies/100ml)
Tank DL 2ft DL 4 ftN 20 130 92
Minimum 90 4 4
1st Quartile 1.7E+05 4 4
Median 2.7E+06 4 4
3rd Quartile 9.1E+06 4 4
Maximum 1.2E+08 11000 91
31
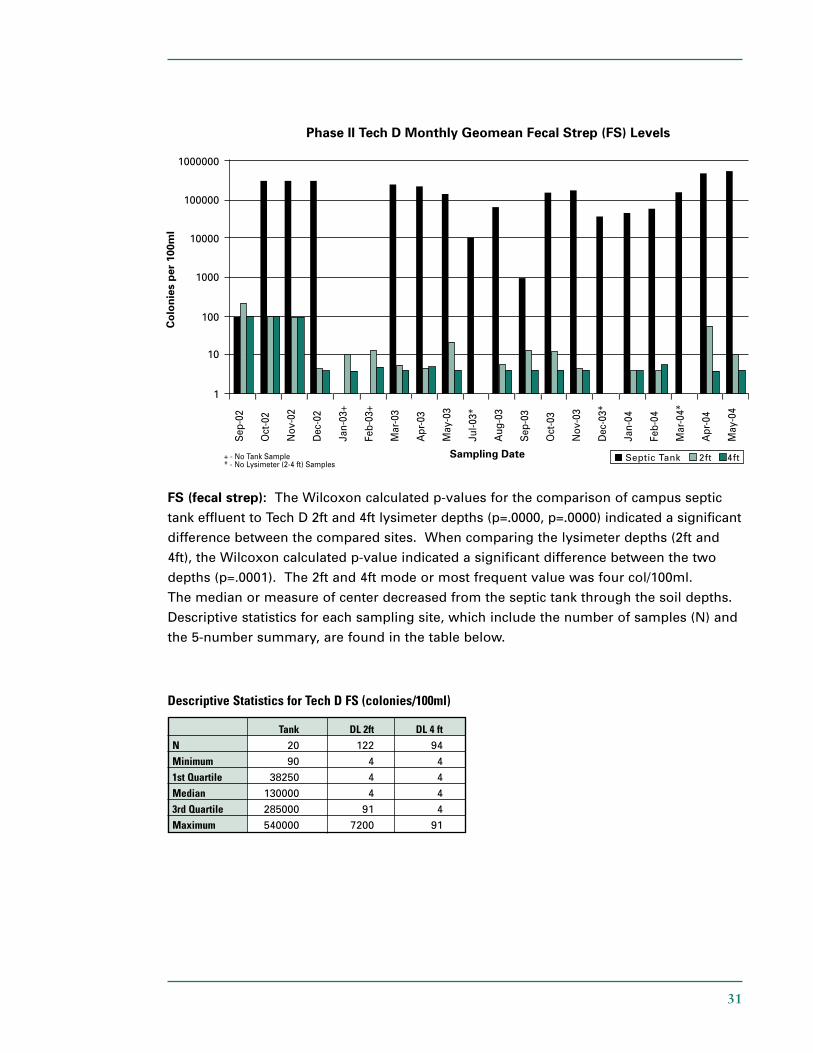
FS (fecal strep): The Wilcoxon calculated p-values for the comparison of campus septic
tank effluent to Tech D 2ft and 4ft lysimeter depths (p=.0000, p=.0000) indicated a significant
difference between the compared sites. When comparing the lysimeter depths (2ft and
4ft), the Wilcoxon calculated p-value indicated a significant difference between the two
depths (p=.0001). The 2ft and 4ft mode or most frequent value was four col/100ml.
The median or measure of center decreased from the septic tank through the soil depths.
Descriptive statistics for each sampling site, which include the number of samples (N) and
the 5-number summary, are found in the table below.
Descriptive Statistics for Tech D FS (colonies/100ml)
Tank DL 2ft DL 4 ftN 20 122 94
Minimum 90 4 4
1st Quartile 38250 4 4
Median 130000 4 4
3rd Quartile 285000 91 4
Maximum 540000 7200 91
32
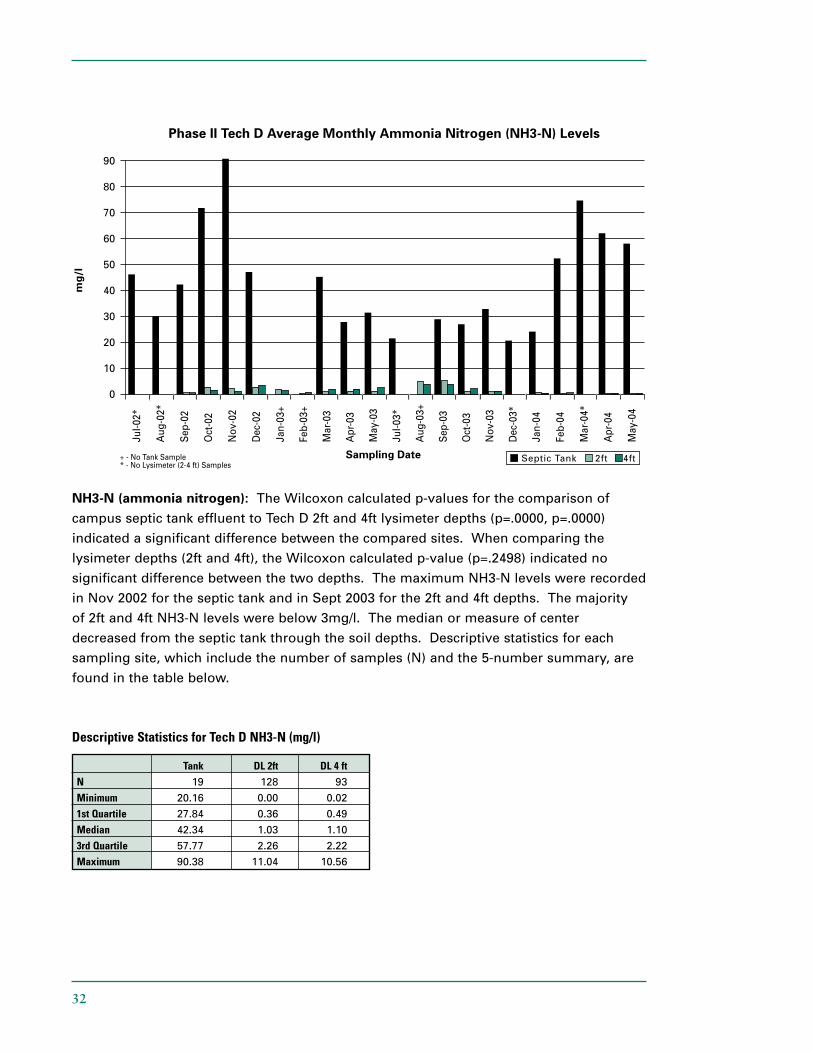
NH3-N (ammonia nitrogen): The Wilcoxon calculated p-values for the comparison of
campus septic tank effluent to Tech D 2ft and 4ft lysimeter depths (p=.0000, p=.0000)
indicated a significant difference between the compared sites. When comparing the
lysimeter depths (2ft and 4ft), the Wilcoxon calculated p-value (p=.2498) indicated no
significant difference between the two depths. The maximum NH3-N levels were recorded
in Nov 2002 for the septic tank and in Sept 2003 for the 2ft and 4ft depths. The majority
of 2ft and 4ft NH3-N levels were below 3mg/l. The median or measure of center
decreased from the septic tank through the soil depths. Descriptive statistics for each
sampling site, which include the number of samples (N) and the 5-number summary, are
found in the table below.
Descriptive Statistics for Tech D NH3-N (mg/l)
Tank DL 2ft DL 4 ftN 19 128 93
Minimum 20.16 0.00 0.02
1st Quartile 27.84 0.36 0.49
Median 42.34 1.03 1.10
3rd Quartile 57.77 2.26 2.22
Maximum 90.38 11.04 10.56
33
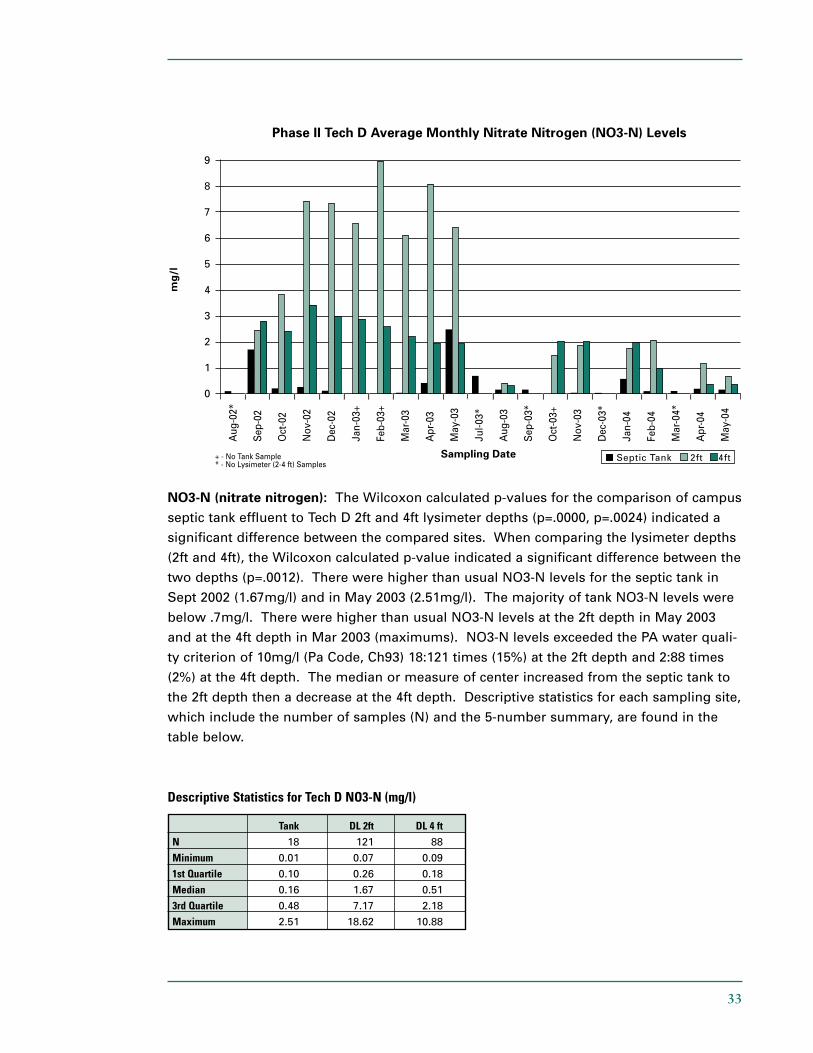
NO3-N (nitrate nitrogen): The Wilcoxon calculated p-values for the comparison of campus
septic tank effluent to Tech D 2ft and 4ft lysimeter depths (p=.0000, p=.0024) indicated a
significant difference between the compared sites. When comparing the lysimeter depths
(2ft and 4ft), the Wilcoxon calculated p-value indicated a significant difference between the
two depths (p=.0012). There were higher than usual NO3-N levels for the septic tank in
Sept 2002 (1.67mg/l) and in May 2003 (2.51mg/l). The majority of tank NO3-N levels were
below .7mg/l. There were higher than usual NO3-N levels at the 2ft depth in May 2003
and at the 4ft depth in Mar 2003 (maximums). NO3-N levels exceeded the PA water quali-
ty criterion of 10mg/l (Pa Code, Ch93) 18:121 times (15%) at the 2ft depth and 2:88 times
(2%) at the 4ft depth. The median or measure of center increased from the septic tank to
the 2ft depth then a decrease at the 4ft depth. Descriptive statistics for each sampling site,
which include the number of samples (N) and the 5-number summary, are found in the
table below.
Descriptive Statistics for Tech D NO3-N (mg/l)
Tank DL 2ft DL 4 ftN 18 121 88
Minimum 0.01 0.07 0.09
1st Quartile 0.10 0.26 0.18
Median 0.16 1.67 0.51
3rd Quartile 0.48 7.17 2.18
Maximum 2.51 18.62 10.88
34
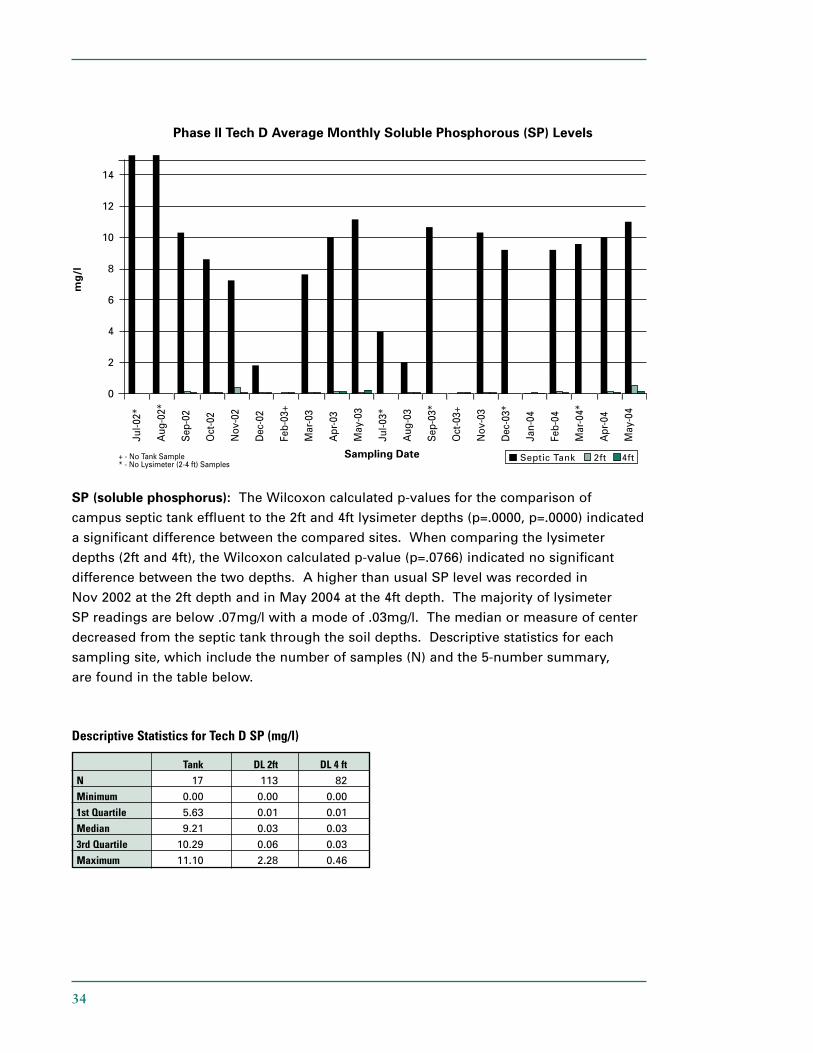
SP (soluble phosphorus): The Wilcoxon calculated p-values for the comparison of
campus septic tank effluent to the 2ft and 4ft lysimeter depths (p=.0000, p=.0000) indicated
a significant difference between the compared sites. When comparing the lysimeter
depths (2ft and 4ft), the Wilcoxon calculated p-value (p=.0766) indicated no significant
difference between the two depths. A higher than usual SP level was recorded in
Nov 2002 at the 2ft depth and in May 2004 at the 4ft depth. The majority of lysimeter
SP readings are below .07mg/l with a mode of .03mg/l. The median or measure of center
decreased from the septic tank through the soil depths. Descriptive statistics for each
sampling site, which include the number of samples (N) and the 5-number summary,
are found in the table below.
Descriptive Statistics for Tech D SP (mg/l)
Tank DL 2ft DL 4 ftN 17 113 82
Minimum 0.00 0.00 0.00
1st Quartile 5.63 0.01 0.01
Median 9.21 0.03 0.03
3rd Quartile 10.29 0.06 0.03
Maximum 11.10 2.28 0.46

35
Drip Irrigation in a Wooded Setting
While not able to be used in dense woods, drip irrigation can be used in areas where
several trees are present. This system introduces a smaller amount of water to a larger
surface area over a longer period of time, creating a more controlled environment in
which to maintain oxygen levels in soil to increase effectiveness of treatment.
36
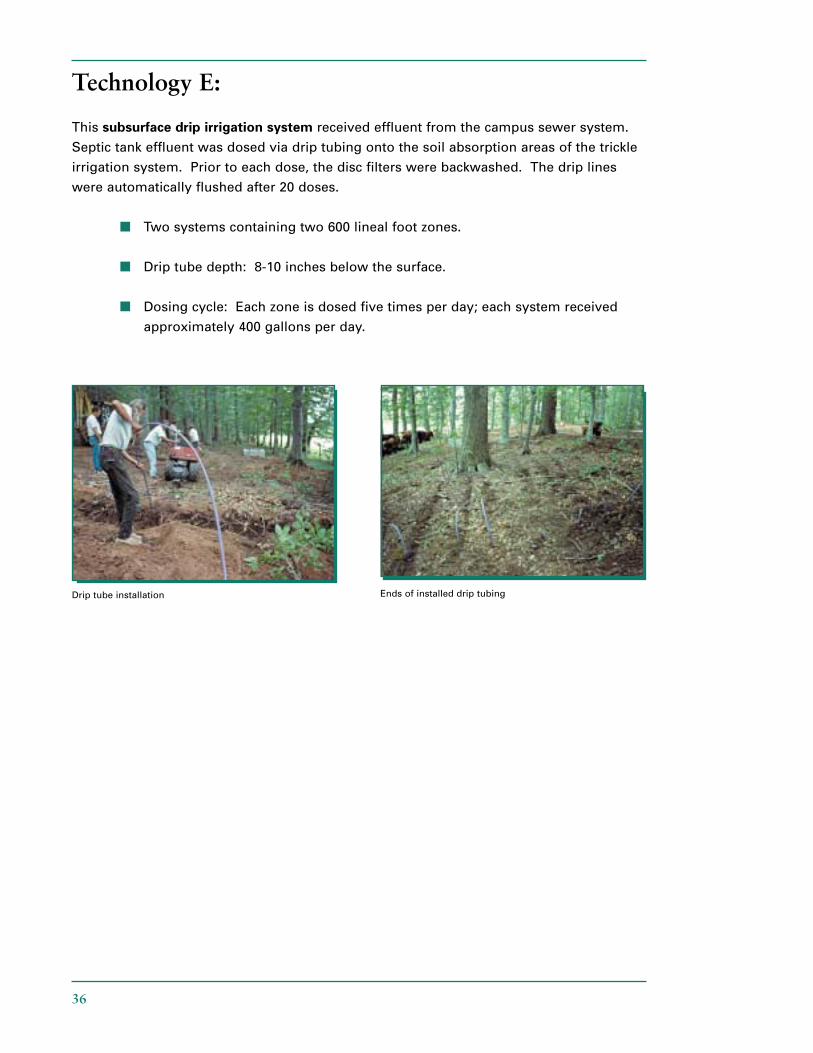
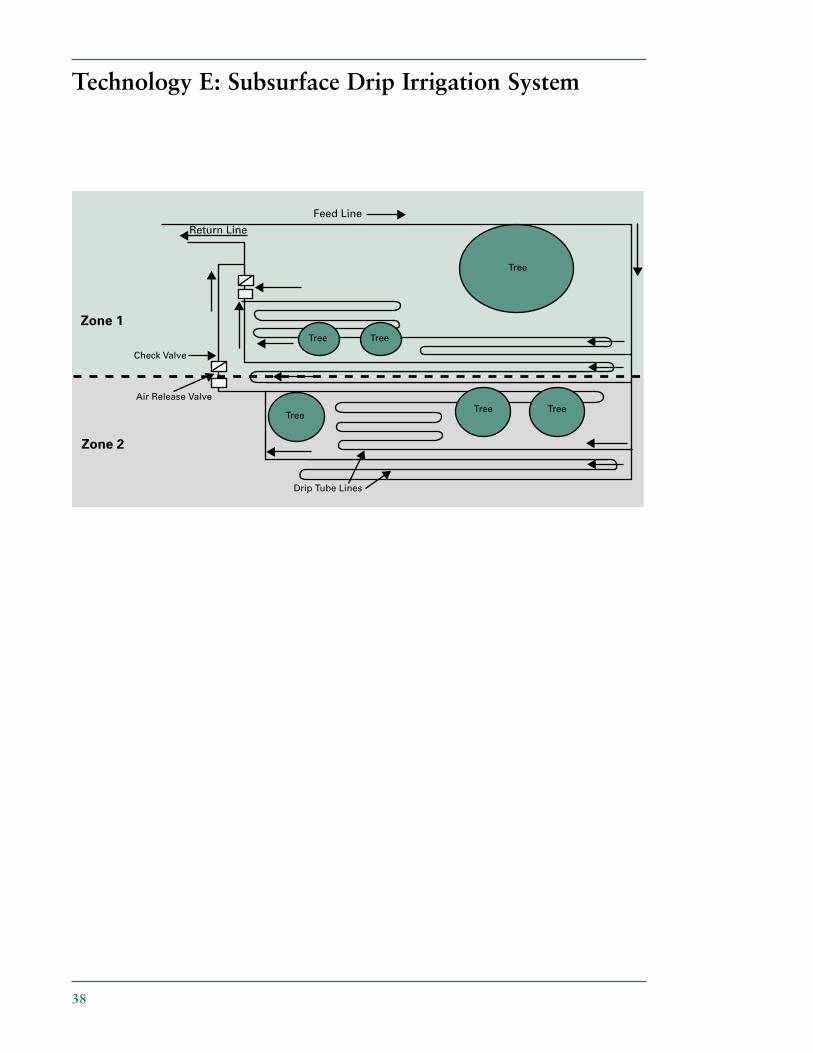
Technology E:
This subsurface drip irrigation system received effluent from the campus sewer system.
Septic tank effluent was dosed via drip tubing onto the soil absorption areas of the trickle
irrigation system. Prior to each dose, the disc filters were backwashed. The drip lines
were automatically flushed after 20 doses.
■ Two systems containing two 600 lineal foot zones.
■ Drip tube depth: 8-10 inches below the surface.
■ Dosing cycle: Each zone is dosed five times per day; each system received
approximately 400 gallons per day.
Drip tube installation Ends of installed drip tubing
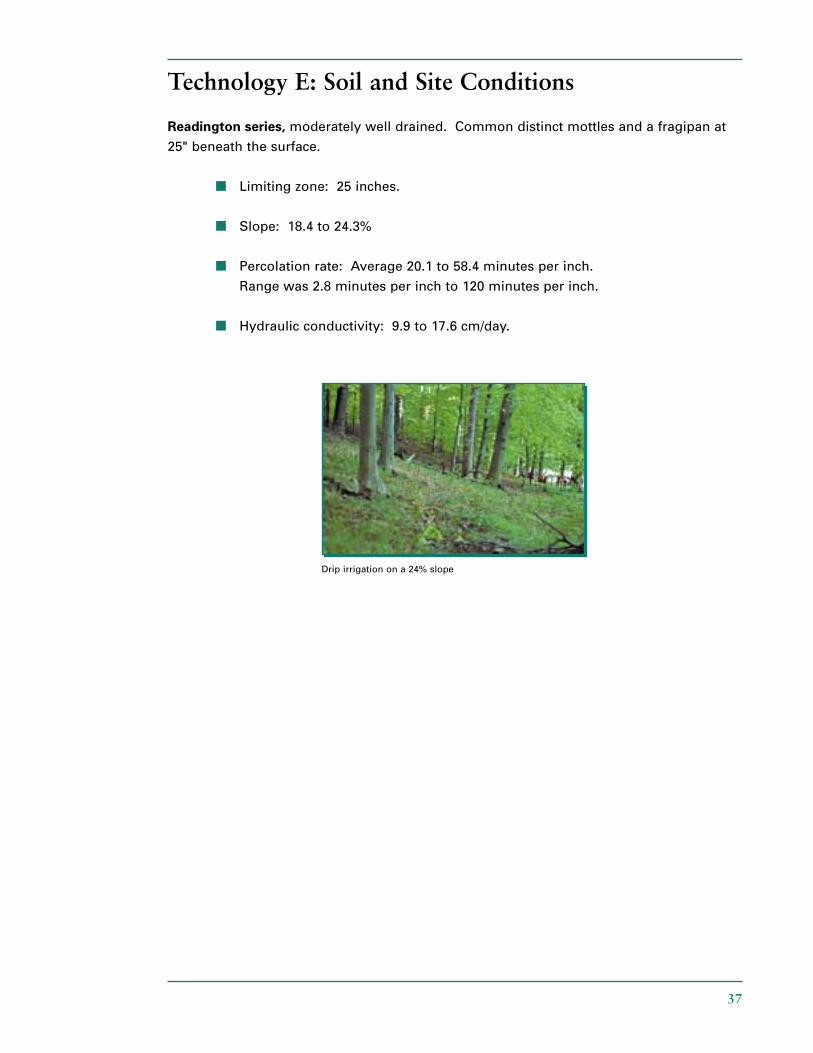
Technology E: Soil and Site Conditions
Readington series, moderately well drained. Common distinct mottles and a fragipan at
25" beneath the surface.
■ Limiting zone: 25 inches.
■ Slope: 18.4 to 24.3%
■ Percolation rate: Average 20.1 to 58.4 minutes per inch.
Range was 2.8 minutes per inch to 120 minutes per inch.
■ Hydraulic conductivity: 9.9 to 17.6 cm/day.
37
Drip irrigation on a 24% slope
38
Technology E: Subsurface Drip Irrigation System
39
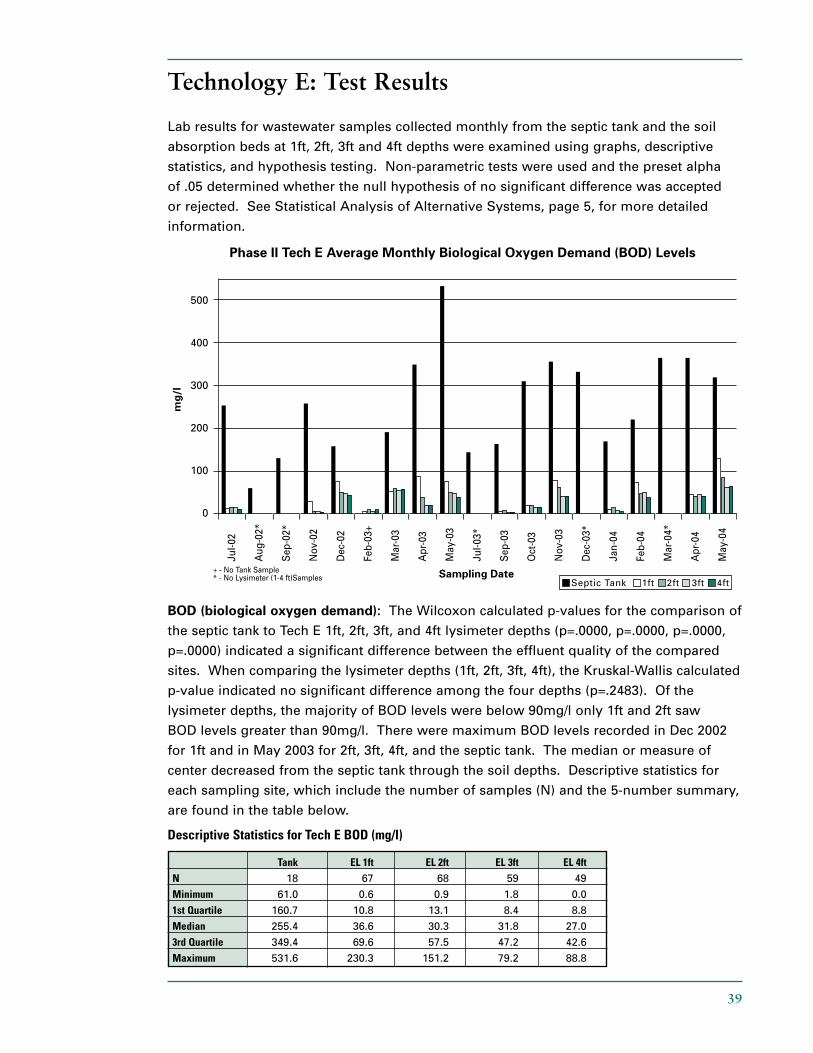
Technology E: Test Results
Lab results for wastewater samples collected monthly from the septic tank and the soil
absorption beds at 1ft, 2ft, 3ft and 4ft depths were examined using graphs, descriptive
statistics, and hypothesis testing. Non-parametric tests were used and the preset alpha
of .05 determined whether the null hypothesis of no significant difference was accepted
or rejected. See Statistical Analysis of Alternative Systems, page 5, for more detailed
information.
BOD (biological oxygen demand): The Wilcoxon calculated p-values for the comparison of
the septic tank to Tech E 1ft, 2ft, 3ft, and 4ft lysimeter depths (p=.0000, p=.0000, p=.0000,
p=.0000) indicated a significant difference between the effluent quality of the compared
sites. When comparing the lysimeter depths (1ft, 2ft, 3ft, 4ft), the Kruskal-Wallis calculated
p-value indicated no significant difference among the four depths (p=.2483). Of the
lysimeter depths, the majority of BOD levels were below 90mg/l only 1ft and 2ft saw
BOD levels greater than 90mg/l. There were maximum BOD levels recorded in Dec 2002
for 1ft and in May 2003 for 2ft, 3ft, 4ft, and the septic tank. The median or measure of
center decreased from the septic tank through the soil depths. Descriptive statistics for
each sampling site, which include the number of samples (N) and the 5-number summary,
are found in the table below.
Descriptive Statistics for Tech E BOD (mg/l)
Tank EL 1ft EL 2ft EL 3ft EL 4ftN 18 67 68 59 49
Minimum 61.0 0.6 0.9 1.8 0.0
1st Quartile 160.7 10.8 13.1 8.4 8.8
Median 255.4 36.6 30.3 31.8 27.0
3rd Quartile 349.4 69.6 57.5 47.2 42.6
Maximum 531.6 230.3 151.2 79.2 88.8
40
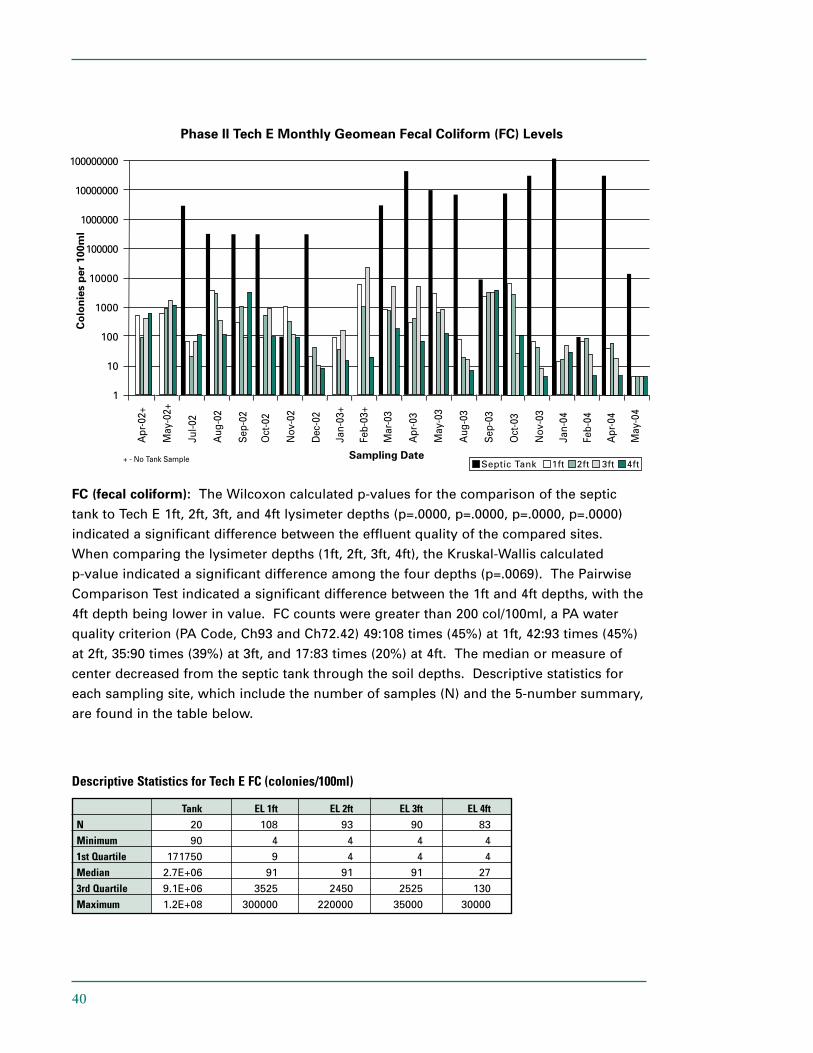
FC (fecal coliform): The Wilcoxon calculated p-values for the comparison of the septic
tank to Tech E 1ft, 2ft, 3ft, and 4ft lysimeter depths (p=.0000, p=.0000, p=.0000, p=.0000)
indicated a significant difference between the effluent quality of the compared sites.
When comparing the lysimeter depths (1ft, 2ft, 3ft, 4ft), the Kruskal-Wallis calculated
p-value indicated a significant difference among the four depths (p=.0069). The Pairwise
Comparison Test indicated a significant difference between the 1ft and 4ft depths, with the
4ft depth being lower in value. FC counts were greater than 200 col/100ml, a PA water
quality criterion (PA Code, Ch93 and Ch72.42) 49:108 times (45%) at 1ft, 42:93 times (45%)
at 2ft, 35:90 times (39%) at 3ft, and 17:83 times (20%) at 4ft. The median or measure of
center decreased from the septic tank through the soil depths. Descriptive statistics for
each sampling site, which include the number of samples (N) and the 5-number summary,
are found in the table below.
Descriptive Statistics for Tech E FC (colonies/100ml)
Tank EL 1ft EL 2ft EL 3ft EL 4ftN 20 108 93 90 83
Minimum 90 4 4 4 4
1st Quartile 171750 9 4 4 4
Median 2.7E+06 91 91 91 27
3rd Quartile 9.1E+06 3525 2450 2525 130
Maximum 1.2E+08 300000 220000 35000 30000
41
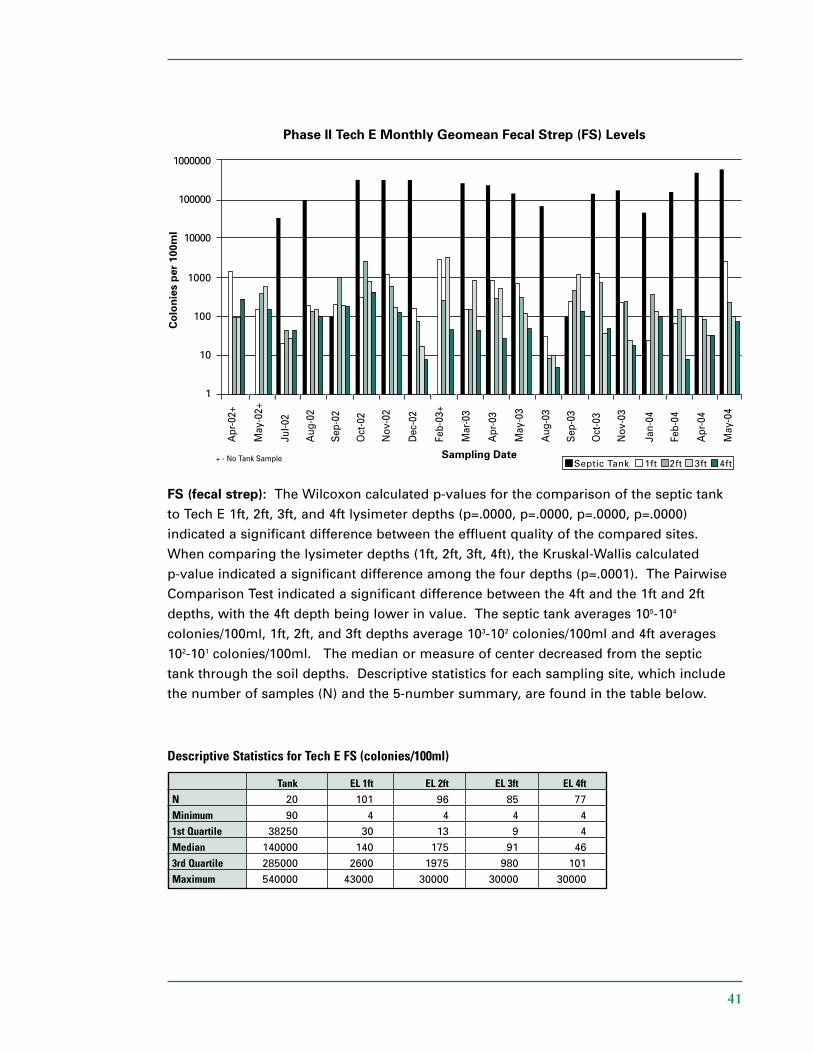
FS (fecal strep): The Wilcoxon calculated p-values for the comparison of the septic tank
to Tech E 1ft, 2ft, 3ft, and 4ft lysimeter depths (p=.0000, p=.0000, p=.0000, p=.0000)
indicated a significant difference between the effluent quality of the compared sites.
When comparing the lysimeter depths (1ft, 2ft, 3ft, 4ft), the Kruskal-Wallis calculated
p-value indicated a significant difference among the four depths (p=.0001). The Pairwise
Comparison Test indicated a significant difference between the 4ft and the 1ft and 2ft
depths, with the 4ft depth being lower in value. The septic tank averages 105-104
colonies/100ml, 1ft, 2ft, and 3ft depths average 103-102 colonies/100ml and 4ft averages
102-101 colonies/100ml. The median or measure of center decreased from the septic
tank through the soil depths. Descriptive statistics for each sampling site, which include
the number of samples (N) and the 5-number summary, are found in the table below.
Descriptive Statistics for Tech E FS (colonies/100ml)
Tank EL 1ft EL 2ft EL 3ft EL 4ftN 20 101 96 85 77
Minimum 90 4 4 4 4
1st Quartile 38250 30 13 9 4
Median 140000 140 175 91 46
3rd Quartile 285000 2600 1975 980 101
Maximum 540000 43000 30000 30000 30000
42
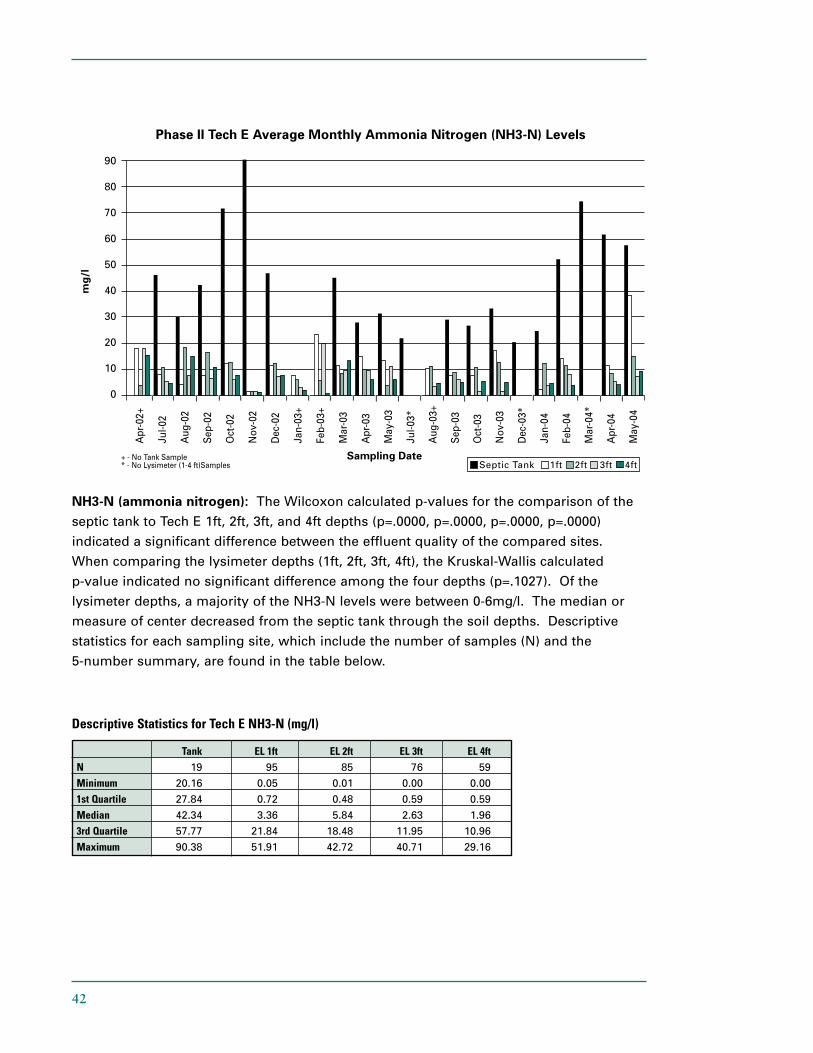
NH3-N (ammonia nitrogen): The Wilcoxon calculated p-values for the comparison of the
septic tank to Tech E 1ft, 2ft, 3ft, and 4ft depths (p=.0000, p=.0000, p=.0000, p=.0000)
indicated a significant difference between the effluent quality of the compared sites.
When comparing the lysimeter depths (1ft, 2ft, 3ft, 4ft), the Kruskal-Wallis calculated
p-value indicated no significant difference among the four depths (p=.1027). Of the
lysimeter depths, a majority of the NH3-N levels were between 0-6mg/l. The median or
measure of center decreased from the septic tank through the soil depths. Descriptive
statistics for each sampling site, which include the number of samples (N) and the
5-number summary, are found in the table below.
Descriptive Statistics for Tech E NH3-N (mg/l)
Tank EL 1ft EL 2ft EL 3ft EL 4ftN 19 95 85 76 59
Minimum 20.16 0.05 0.01 0.00 0.00
1st Quartile 27.84 0.72 0.48 0.59 0.59
Median 42.34 3.36 5.84 2.63 1.96
3rd Quartile 57.77 21.84 18.48 11.95 10.96
Maximum 90.38 51.91 42.72 40.71 29.16
43
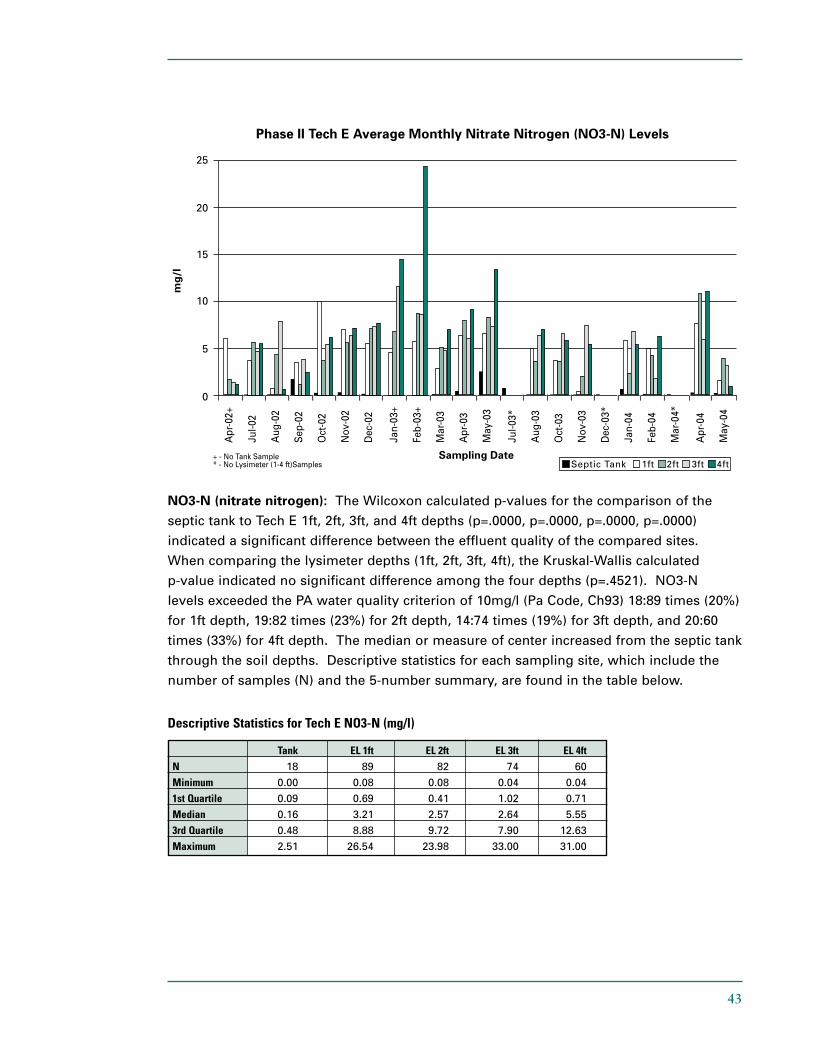
NO3-N (nitrate nitrogen): The Wilcoxon calculated p-values for the comparison of the
septic tank to Tech E 1ft, 2ft, 3ft, and 4ft depths (p=.0000, p=.0000, p=.0000, p=.0000)
indicated a significant difference between the effluent quality of the compared sites.
When comparing the lysimeter depths (1ft, 2ft, 3ft, 4ft), the Kruskal-Wallis calculated
p-value indicated no significant difference among the four depths (p=.4521). NO3-N
levels exceeded the PA water quality criterion of 10mg/l (Pa Code, Ch93) 18:89 times (20%)
for 1ft depth, 19:82 times (23%) for 2ft depth, 14:74 times (19%) for 3ft depth, and 20:60
times (33%) for 4ft depth. The median or measure of center increased from the septic tank
through the soil depths. Descriptive statistics for each sampling site, which include the
number of samples (N) and the 5-number summary, are found in the table below.
Descriptive Statistics for Tech E NO3-N (mg/l)
Tank EL 1ft EL 2ft EL 3ft EL 4ftN 18 89 82 74 60
Minimum 0.00 0.08 0.08 0.04 0.04
1st Quartile 0.09 0.69 0.41 1.02 0.71
Median 0.16 3.21 2.57 2.64 5.55
3rd Quartile 0.48 8.88 9.72 7.90 12.63
Maximum 2.51 26.54 23.98 33.00 31.00
44
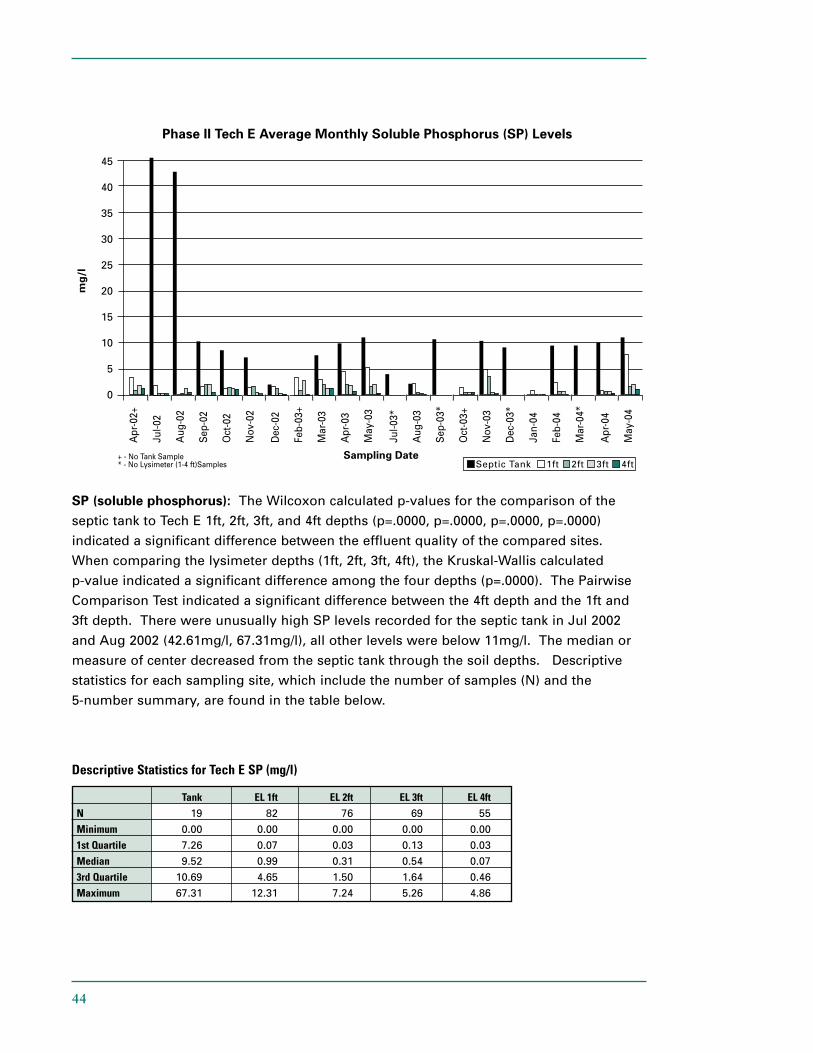
SP (soluble phosphorus): The Wilcoxon calculated p-values for the comparison of the
septic tank to Tech E 1ft, 2ft, 3ft, and 4ft depths (p=.0000, p=.0000, p=.0000, p=.0000)
indicated a significant difference between the effluent quality of the compared sites.
When comparing the lysimeter depths (1ft, 2ft, 3ft, 4ft), the Kruskal-Wallis calculated
p-value indicated a significant difference among the four depths (p=.0000). The Pairwise
Comparison Test indicated a significant difference between the 4ft depth and the 1ft and
3ft depth. There were unusually high SP levels recorded for the septic tank in Jul 2002
and Aug 2002 (42.61mg/l, 67.31mg/l), all other levels were below 11mg/l. The median or
measure of center decreased from the septic tank through the soil depths. Descriptive
statistics for each sampling site, which include the number of samples (N) and the
5-number summary, are found in the table below.
Descriptive Statistics for Tech E SP (mg/l)
Tank EL 1ft EL 2ft EL 3ft EL 4ftN 19 82 76 69 55
Minimum 0.00 0.00 0.00 0.00 0.00
1st Quartile 7.26 0.07 0.03 0.13 0.03
Median 9.52 0.99 0.31 0.54 0.07
3rd Quartile 10.69 4.65 1.50 1.64 0.46
Maximum 67.31 12.31 7.24 5.26 4.86
45
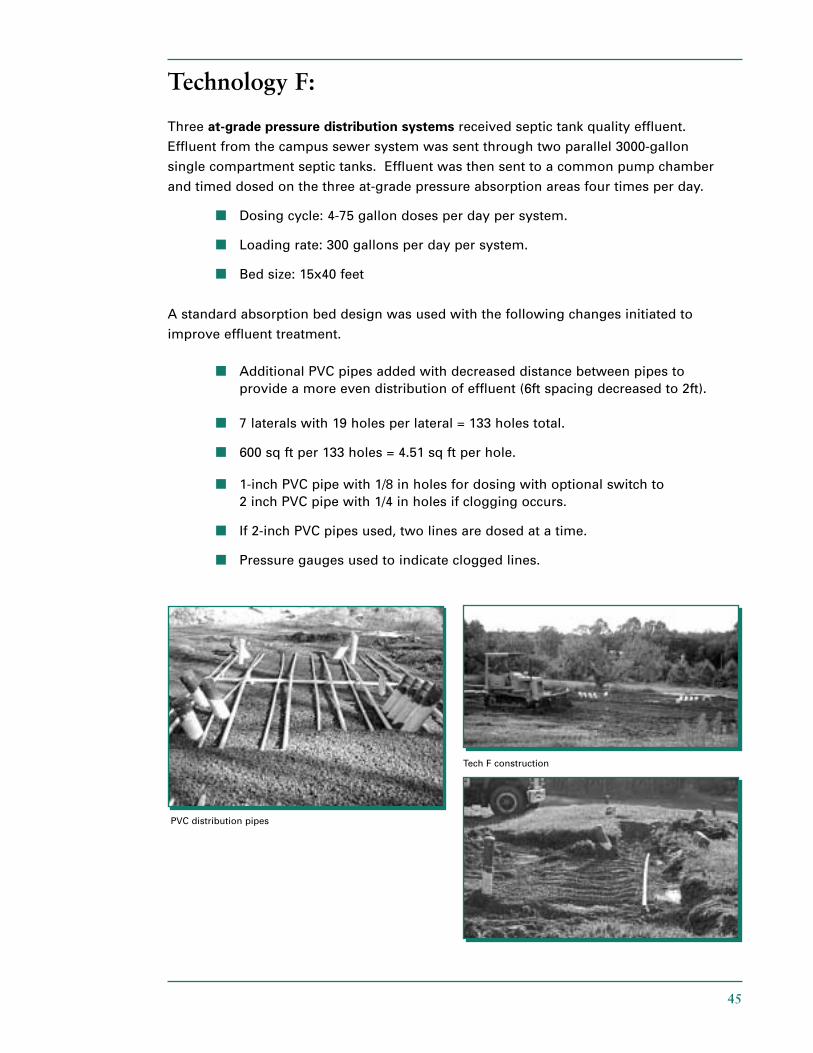
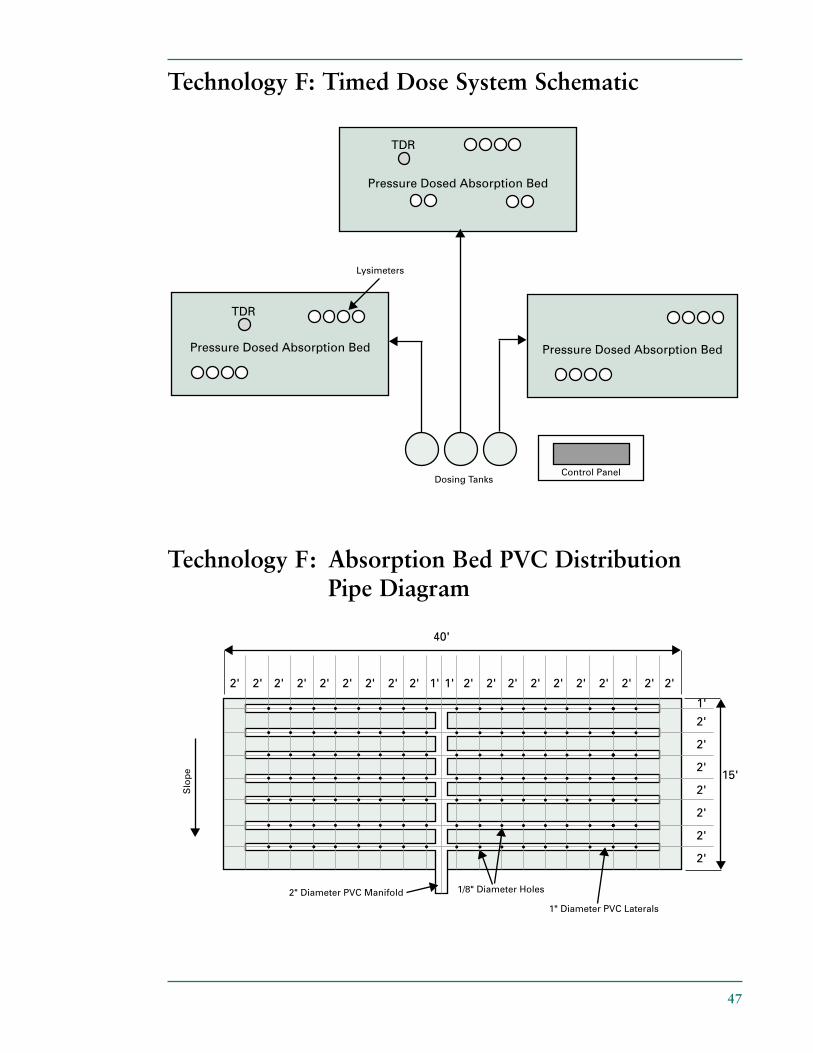
Technology F:
Three at-grade pressure distribution systems received septic tank quality effluent.
Effluent from the campus sewer system was sent through two parallel 3000-gallon
single compartment septic tanks. Effluent was then sent to a common pump chamber
and timed dosed on the three at-grade pressure absorption areas four times per day.
■ Dosing cycle: 4-75 gallon doses per day per system.
■ Loading rate: 300 gallons per day per system.
■ Bed size: 15x40 feet
A standard absorption bed design was used with the following changes initiated to
improve effluent treatment.
■ Additional PVC pipes added with decreased distance between pipes to provide a more even distribution of effluent (6ft spacing decreased to 2ft).
■ 7 laterals with 19 holes per lateral = 133 holes total.
■ 600 sq ft per 133 holes = 4.51 sq ft per hole.
■ 1-inch PVC pipe with 1/8 in holes for dosing with optional switch to 2 inch PVC pipe with 1/4 in holes if clogging occurs.
■ If 2-inch PVC pipes used, two lines are dosed at a time.
■ Pressure gauges used to indicate clogged lines.
PVC distribution pipes
Tech F construction
46
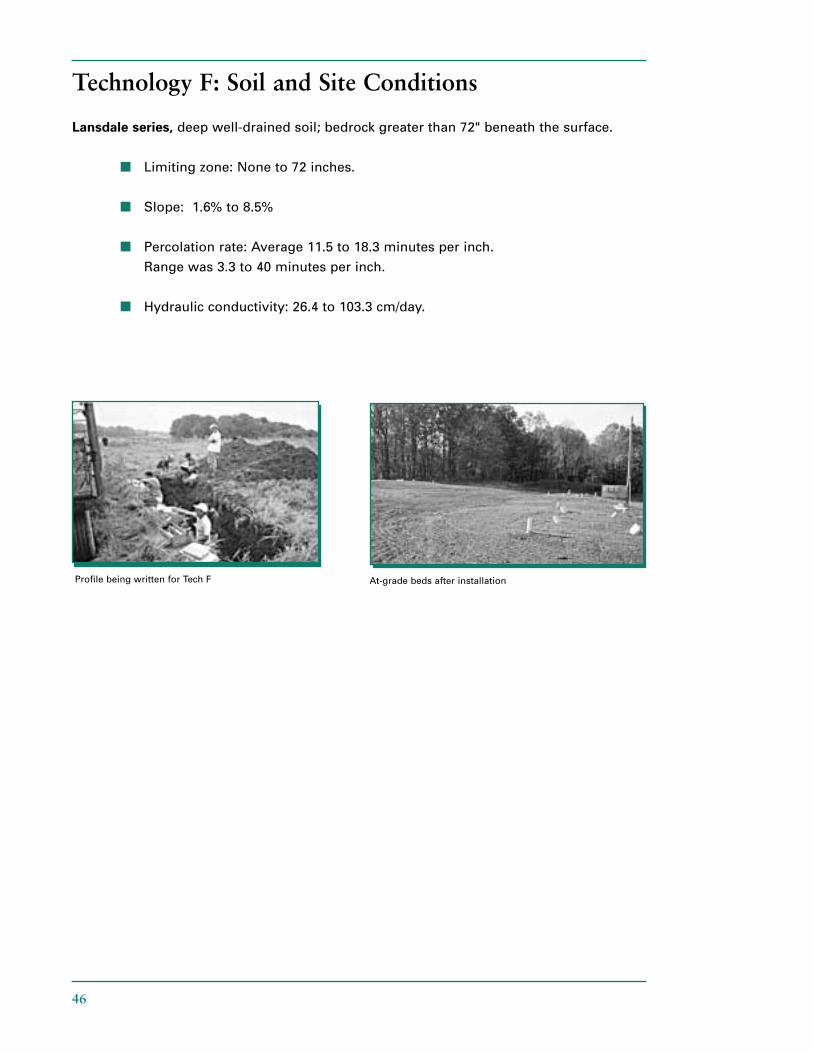
Technology F: Soil and Site Conditions
Lansdale series, deep well-drained soil; bedrock greater than 72" beneath the surface.
■ Limiting zone: None to 72 inches.
■ Slope: 1.6% to 8.5%
■ Percolation rate: Average 11.5 to 18.3 minutes per inch.
Range was 3.3 to 40 minutes per inch.
■ Hydraulic conductivity: 26.4 to 103.3 cm/day.
Profile being written for Tech F At-grade beds after installation
47
Technology F: Timed Dose System Schematic
Technology F: Absorption Bed PVC Distribution Pipe Diagram
48
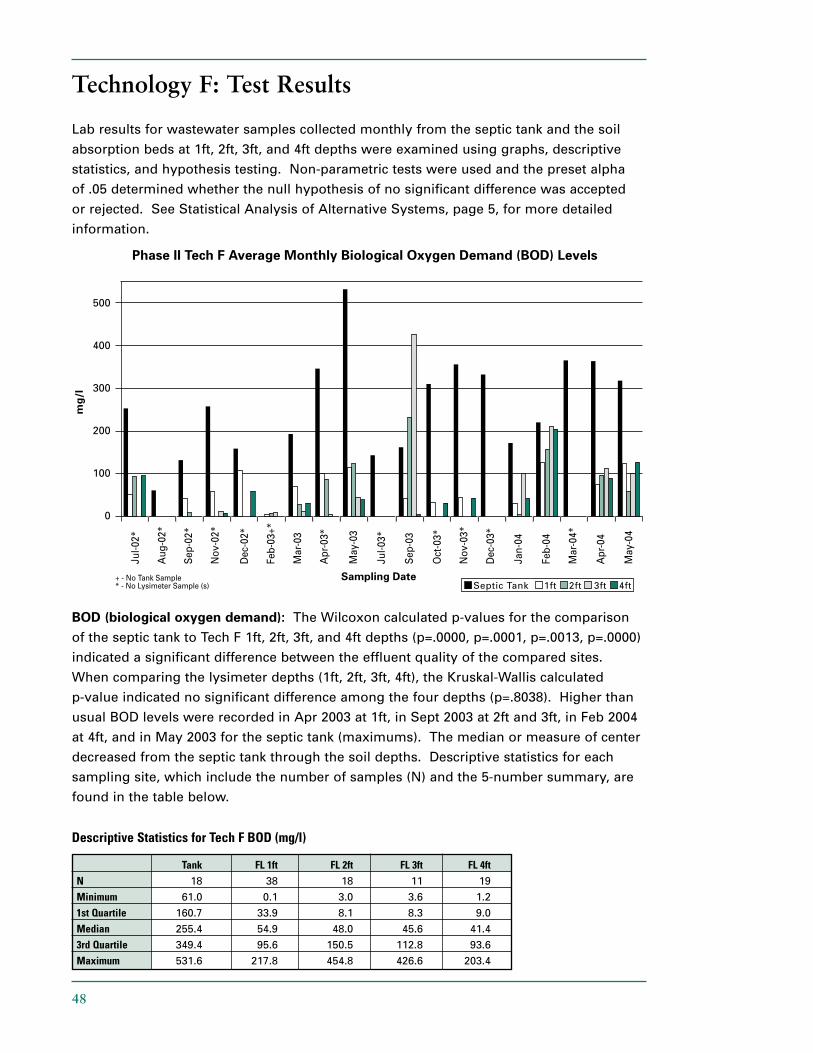
Technology F: Test Results
Lab results for wastewater samples collected monthly from the septic tank and the soil
absorption beds at 1ft, 2ft, 3ft, and 4ft depths were examined using graphs, descriptive
statistics, and hypothesis testing. Non-parametric tests were used and the preset alpha
of .05 determined whether the null hypothesis of no significant difference was accepted
or rejected. See Statistical Analysis of Alternative Systems, page 5, for more detailed
information.
BOD (biological oxygen demand): The Wilcoxon calculated p-values for the comparison
of the septic tank to Tech F 1ft, 2ft, 3ft, and 4ft depths (p=.0000, p=.0001, p=.0013, p=.0000)
indicated a significant difference between the effluent quality of the compared sites.
When comparing the lysimeter depths (1ft, 2ft, 3ft, 4ft), the Kruskal-Wallis calculated
p-value indicated no significant difference among the four depths (p=.8038). Higher than
usual BOD levels were recorded in Apr 2003 at 1ft, in Sept 2003 at 2ft and 3ft, in Feb 2004
at 4ft, and in May 2003 for the septic tank (maximums). The median or measure of center
decreased from the septic tank through the soil depths. Descriptive statistics for each
sampling site, which include the number of samples (N) and the 5-number summary, are
found in the table below.
Descriptive Statistics for Tech F BOD (mg/l)
Tank FL 1ft FL 2ft FL 3ft FL 4ftN 18 38 18 11 19
Minimum 61.0 0.1 3.0 3.6 1.2
1st Quartile 160.7 33.9 8.1 8.3 9.0
Median 255.4 54.9 48.0 45.6 41.4
3rd Quartile 349.4 95.6 150.5 112.8 93.6
Maximum 531.6 217.8 454.8 426.6 203.4
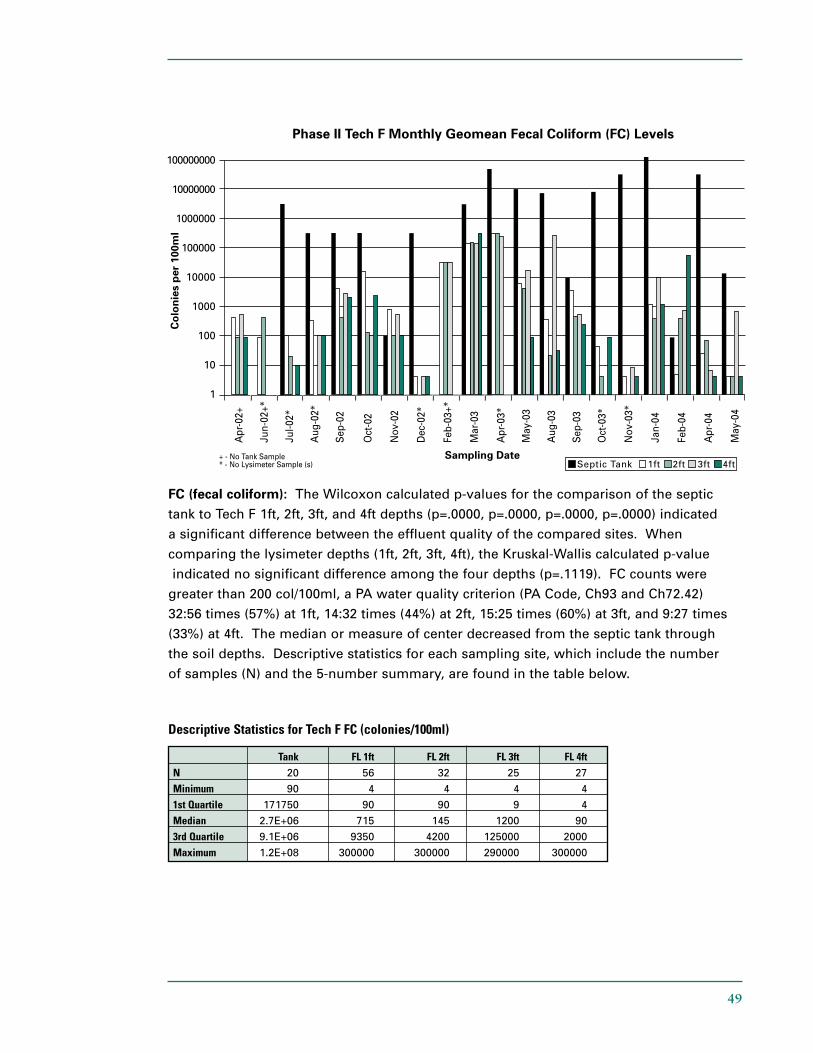
49
FC (fecal coliform): The Wilcoxon calculated p-values for the comparison of the septic
tank to Tech F 1ft, 2ft, 3ft, and 4ft depths (p=.0000, p=.0000, p=.0000, p=.0000) indicated
a significant difference between the effluent quality of the compared sites. When
comparing the lysimeter depths (1ft, 2ft, 3ft, 4ft), the Kruskal-Wallis calculated p-value
indicated no significant difference among the four depths (p=.1119). FC counts were
greater than 200 col/100ml, a PA water quality criterion (PA Code, Ch93 and Ch72.42)
32:56 times (57%) at 1ft, 14:32 times (44%) at 2ft, 15:25 times (60%) at 3ft, and 9:27 times
(33%) at 4ft. The median or measure of center decreased from the septic tank through
the soil depths. Descriptive statistics for each sampling site, which include the number
of samples (N) and the 5-number summary, are found in the table below.
Descriptive Statistics for Tech F FC (colonies/100ml)
Tank FL 1ft FL 2ft FL 3ft FL 4ftN 20 56 32 25 27
Minimum 90 4 4 4 4
1st Quartile 171750 90 90 9 4
Median 2.7E+06 715 145 1200 90
3rd Quartile 9.1E+06 9350 4200 125000 2000
Maximum 1.2E+08 300000 300000 290000 300000
50
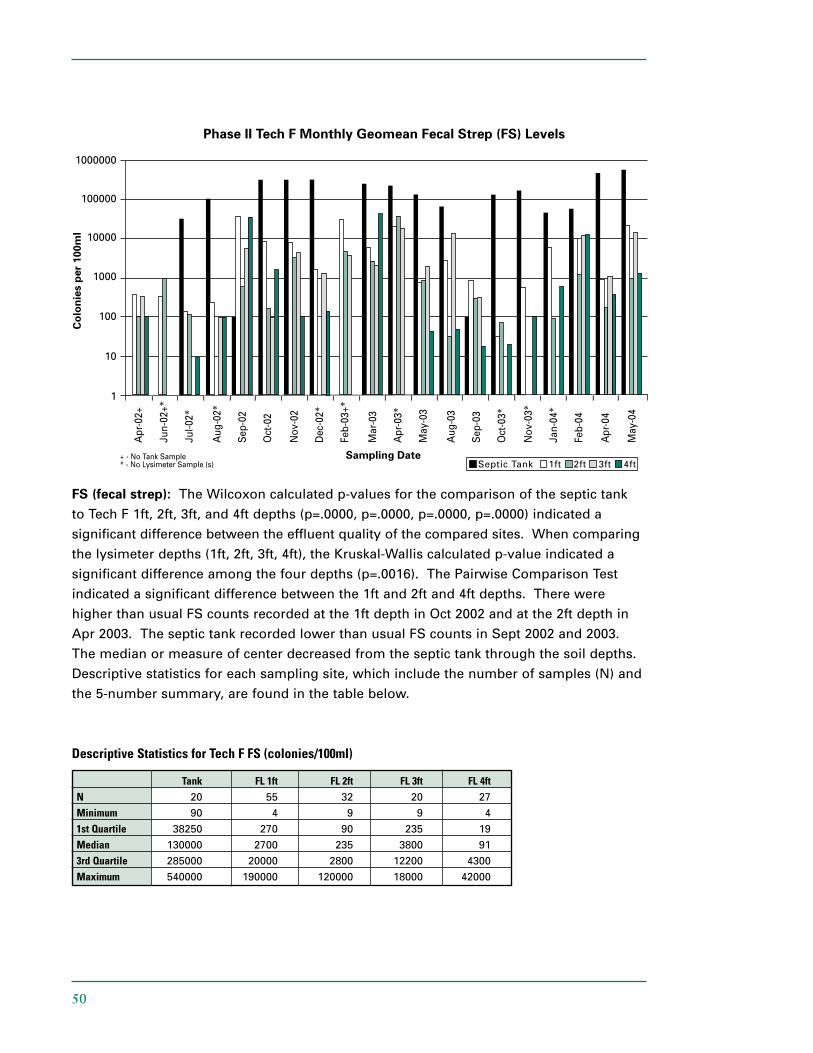
FS (fecal strep): The Wilcoxon calculated p-values for the comparison of the septic tank
to Tech F 1ft, 2ft, 3ft, and 4ft depths (p=.0000, p=.0000, p=.0000, p=.0000) indicated a
significant difference between the effluent quality of the compared sites. When comparing
the lysimeter depths (1ft, 2ft, 3ft, 4ft), the Kruskal-Wallis calculated p-value indicated a
significant difference among the four depths (p=.0016). The Pairwise Comparison Test
indicated a significant difference between the 1ft and 2ft and 4ft depths. There were
higher than usual FS counts recorded at the 1ft depth in Oct 2002 and at the 2ft depth in
Apr 2003. The septic tank recorded lower than usual FS counts in Sept 2002 and 2003.
The median or measure of center decreased from the septic tank through the soil depths.
Descriptive statistics for each sampling site, which include the number of samples (N) and
the 5-number summary, are found in the table below.
Descriptive Statistics for Tech F FS (colonies/100ml)
Tank FL 1ft FL 2ft FL 3ft FL 4ftN 20 55 32 20 27
Minimum 90 4 9 9 4
1st Quartile 38250 270 90 235 19
Median 130000 2700 235 3800 91
3rd Quartile 285000 20000 2800 12200 4300
Maximum 540000 190000 120000 18000 42000
51
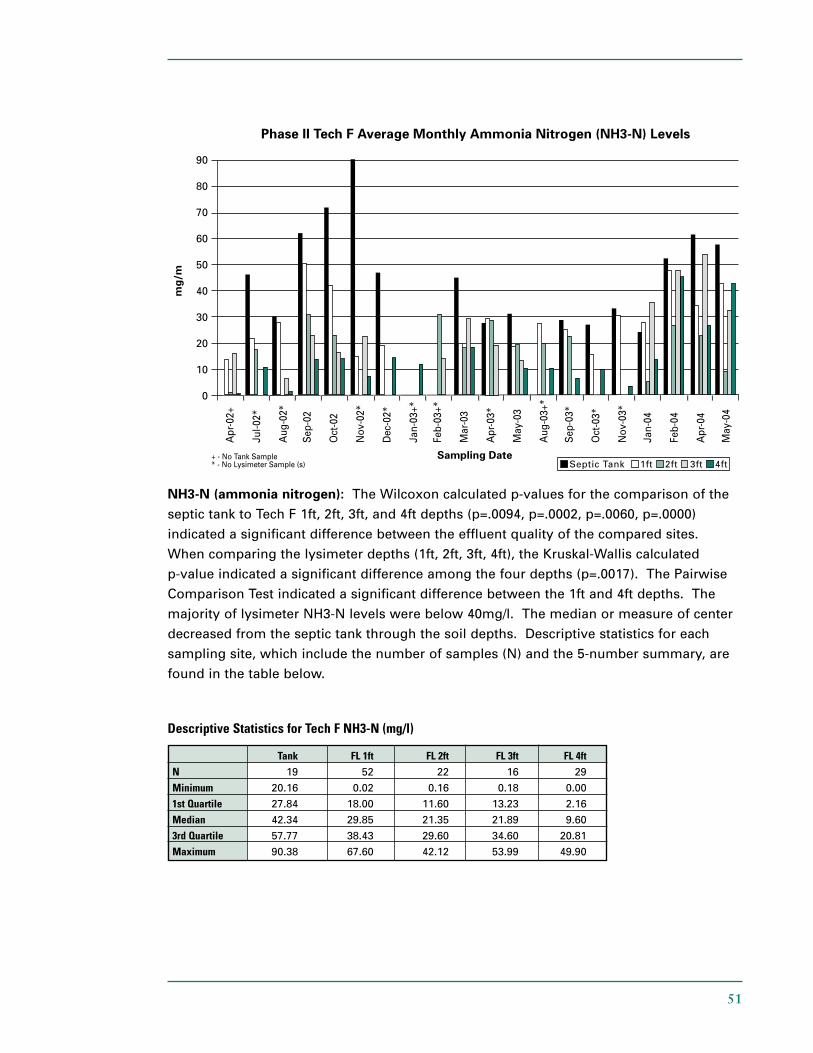
NH3-N (ammonia nitrogen): The Wilcoxon calculated p-values for the comparison of the
septic tank to Tech F 1ft, 2ft, 3ft, and 4ft depths (p=.0094, p=.0002, p=.0060, p=.0000)
indicated a significant difference between the effluent quality of the compared sites.
When comparing the lysimeter depths (1ft, 2ft, 3ft, 4ft), the Kruskal-Wallis calculated
p-value indicated a significant difference among the four depths (p=.0017). The Pairwise
Comparison Test indicated a significant difference between the 1ft and 4ft depths. The
majority of lysimeter NH3-N levels were below 40mg/l. The median or measure of center
decreased from the septic tank through the soil depths. Descriptive statistics for each
sampling site, which include the number of samples (N) and the 5-number summary, are
found in the table below.
Descriptive Statistics for Tech F NH3-N (mg/l)
Tank FL 1ft FL 2ft FL 3ft FL 4ftN 19 52 22 16 29
Minimum 20.16 0.02 0.16 0.18 0.00
1st Quartile 27.84 18.00 11.60 13.23 2.16
Median 42.34 29.85 21.35 21.89 9.60
3rd Quartile 57.77 38.43 29.60 34.60 20.81
Maximum 90.38 67.60 42.12 53.99 49.90
52
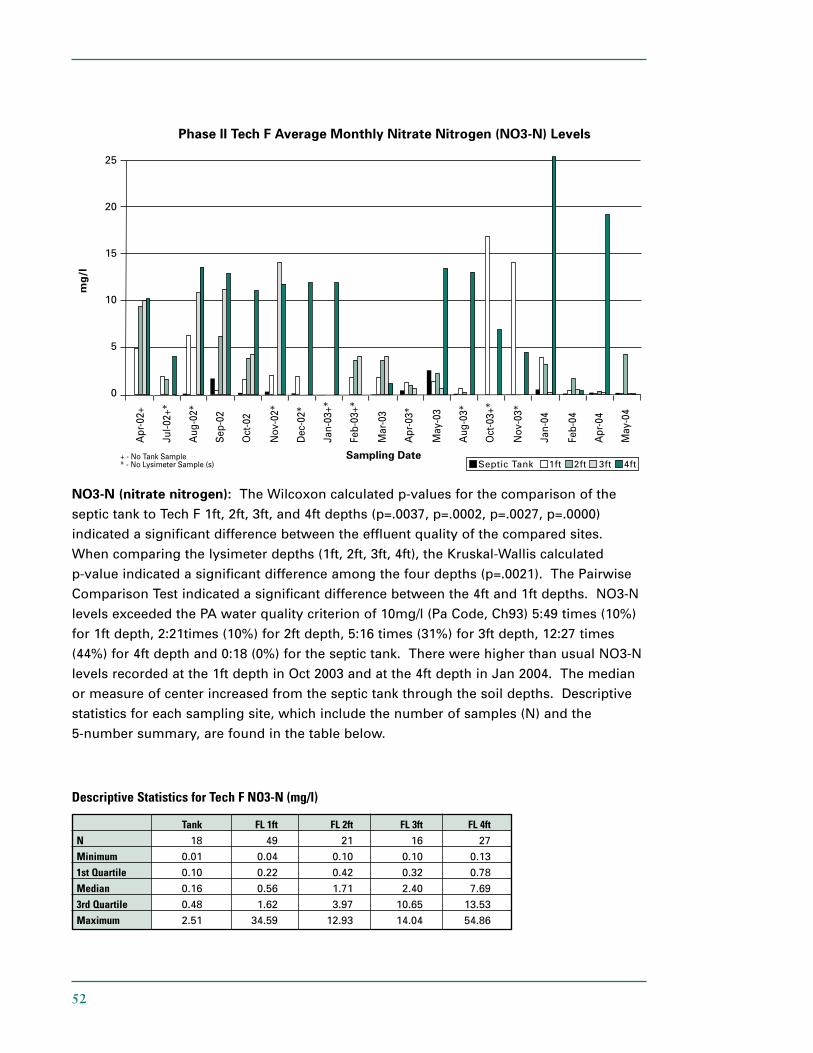
NO3-N (nitrate nitrogen): The Wilcoxon calculated p-values for the comparison of the
septic tank to Tech F 1ft, 2ft, 3ft, and 4ft depths (p=.0037, p=.0002, p=.0027, p=.0000)
indicated a significant difference between the effluent quality of the compared sites.
When comparing the lysimeter depths (1ft, 2ft, 3ft, 4ft), the Kruskal-Wallis calculated
p-value indicated a significant difference among the four depths (p=.0021). The Pairwise
Comparison Test indicated a significant difference between the 4ft and 1ft depths. NO3-N
levels exceeded the PA water quality criterion of 10mg/l (Pa Code, Ch93) 5:49 times (10%)
for 1ft depth, 2:21times (10%) for 2ft depth, 5:16 times (31%) for 3ft depth, 12:27 times
(44%) for 4ft depth and 0:18 (0%) for the septic tank. There were higher than usual NO3-N
levels recorded at the 1ft depth in Oct 2003 and at the 4ft depth in Jan 2004. The median
or measure of center increased from the septic tank through the soil depths. Descriptive
statistics for each sampling site, which include the number of samples (N) and the
5-number summary, are found in the table below.
Descriptive Statistics for Tech F NO3-N (mg/l)
Tank FL 1ft FL 2ft FL 3ft FL 4ftN 18 49 21 16 27
Minimum 0.01 0.04 0.10 0.10 0.13
1st Quartile 0.10 0.22 0.42 0.32 0.78
Median 0.16 0.56 1.71 2.40 7.69
3rd Quartile 0.48 1.62 3.97 10.65 13.53
Maximum 2.51 34.59 12.93 14.04 54.86
53
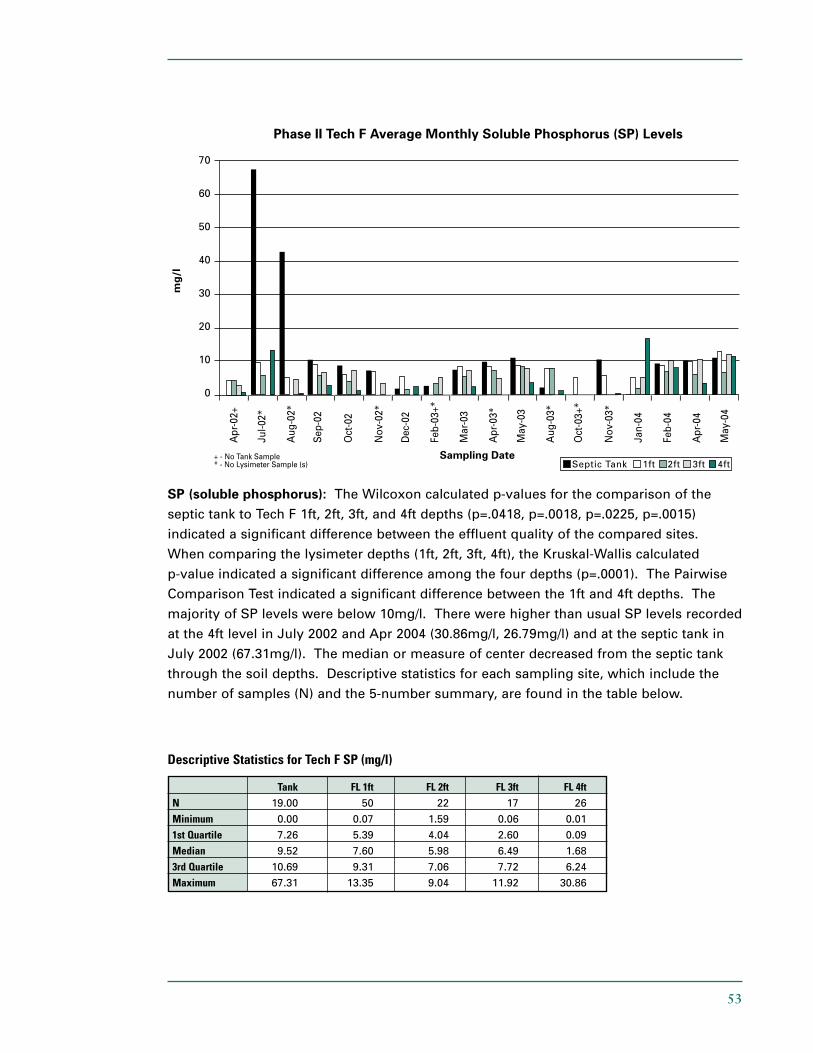
SP (soluble phosphorus): The Wilcoxon calculated p-values for the comparison of the
septic tank to Tech F 1ft, 2ft, 3ft, and 4ft depths (p=.0418, p=.0018, p=.0225, p=.0015)
indicated a significant difference between the effluent quality of the compared sites.
When comparing the lysimeter depths (1ft, 2ft, 3ft, 4ft), the Kruskal-Wallis calculated
p-value indicated a significant difference among the four depths (p=.0001). The Pairwise
Comparison Test indicated a significant difference between the 1ft and 4ft depths. The
majority of SP levels were below 10mg/l. There were higher than usual SP levels recorded
at the 4ft level in July 2002 and Apr 2004 (30.86mg/l, 26.79mg/l) and at the septic tank in
July 2002 (67.31mg/l). The median or measure of center decreased from the septic tank
through the soil depths. Descriptive statistics for each sampling site, which include the
number of samples (N) and the 5-number summary, are found in the table below.
Descriptive Statistics for Tech F SP (mg/l)
Tank FL 1ft FL 2ft FL 3ft FL 4ftN 19.00 50 22 17 26
Minimum 0.00 0.07 1.59 0.06 0.01
1st Quartile 7.26 5.39 4.04 2.60 0.09
Median 9.52 7.60 5.98 6.49 1.68
3rd Quartile 10.69 9.31 7.06 7.72 6.24
Maximum 67.31 13.35 9.04 11.92 30.86

54
Drip Irrigation in a Landscape Setting
Similar to drip irrigation technology used in a wooded setting, a trickle system
can be used to maintain the beauty and land use of a home or park.

Community Systems:
These subsurface drip irrigation systems received septic tank effluent that was dosed
onto four drip fields each 15000 sq. ft. that represented the following areas: aerated turf,
non-aerated turf, pasture, and crops. Installation specifics are as follows:
■ Drip tubing installed at a depth of 9-11 inches.
■ Drip tube spacing at 2 ft. apart.
■ Loading rate: .08gpd/sq. ft. or .9in/wk during months of May-Nov. and .04gpd/sq. ft. during months of Dec.-Apr.
■ Dosing rate: each zone was dosed 3 times per day at .026gal/sq. ft. per dose during months of May-Nov. and .013gal/sq. ft. per dose during months of Dec.-Apr.
■ The non-aerated turf and pasture systems utilized Netafim drip tubing that was forward flushed every 50 cycles.
■ The aerated turf system utilized Rainbird drip tubing that was continually forward flushed.
■ To maintain aerated conditions, a constant flow of air was blown through the 8100 ft. of Rainbird tubing at 127cfm.
■ The cropland zones utilized Geoflow drip tubing.
■ Soil profile: Chalfont soil series with faint redox features at 11 inches, common distinct redox features at 18 inches, and a fragipan at 25 inches.
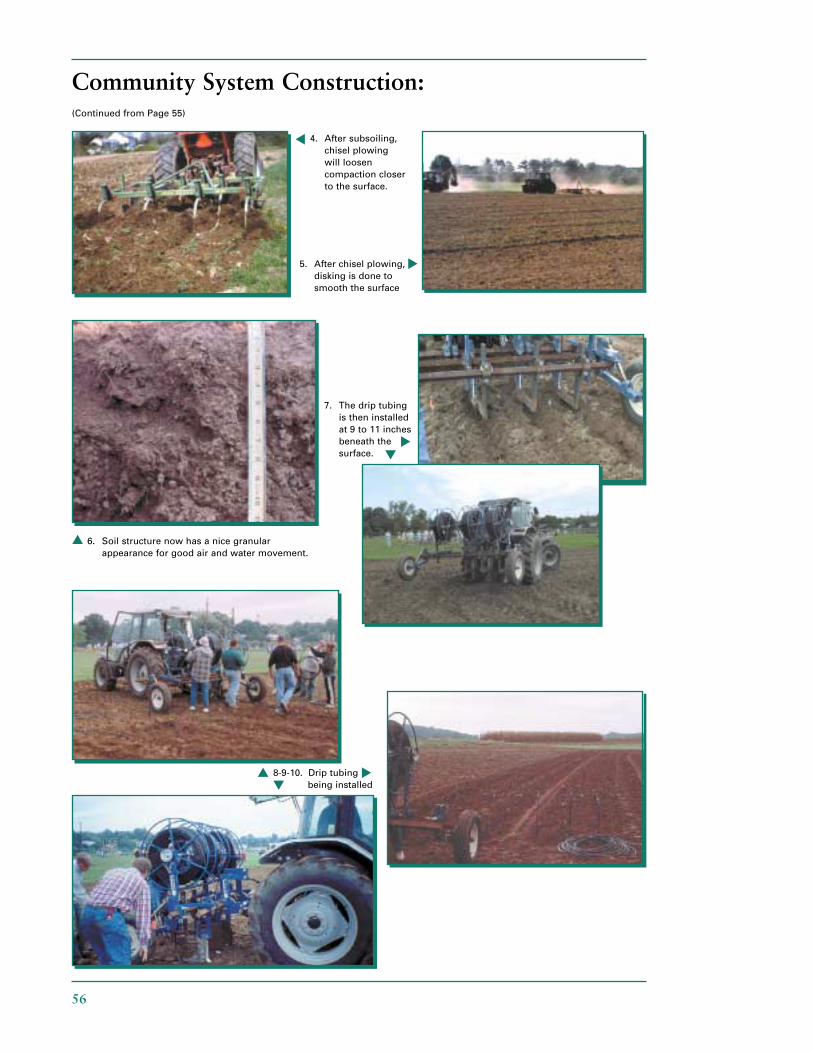
Community System Construction:
55
1. Soils are often compacted and needto be loosened for systems to operate successfully. Compacted soils do not allow air and water to move freely.
2. Typical “plow pan” of compacted soil from many years of agricultural operations:
3. Subsoiling is the first step in breaking up the compaction that has gone deep into the profile.
▲
▲
▲
56
Community System Construction:(Continued from Page 55)
6. Soil structure now has a nice granular appearance for good air and water movement.
▲
8-9-10. Drip tubing being installed
▲ ▲
▲
4. After subsoiling, chisel plowing will loosen compaction closer to the surface.
▲
▲
5. After chisel plowing, disking is done to smooth the surface
7. The drip tubing is then installed at 9 to 11 inches beneath the surface.
▲
▲
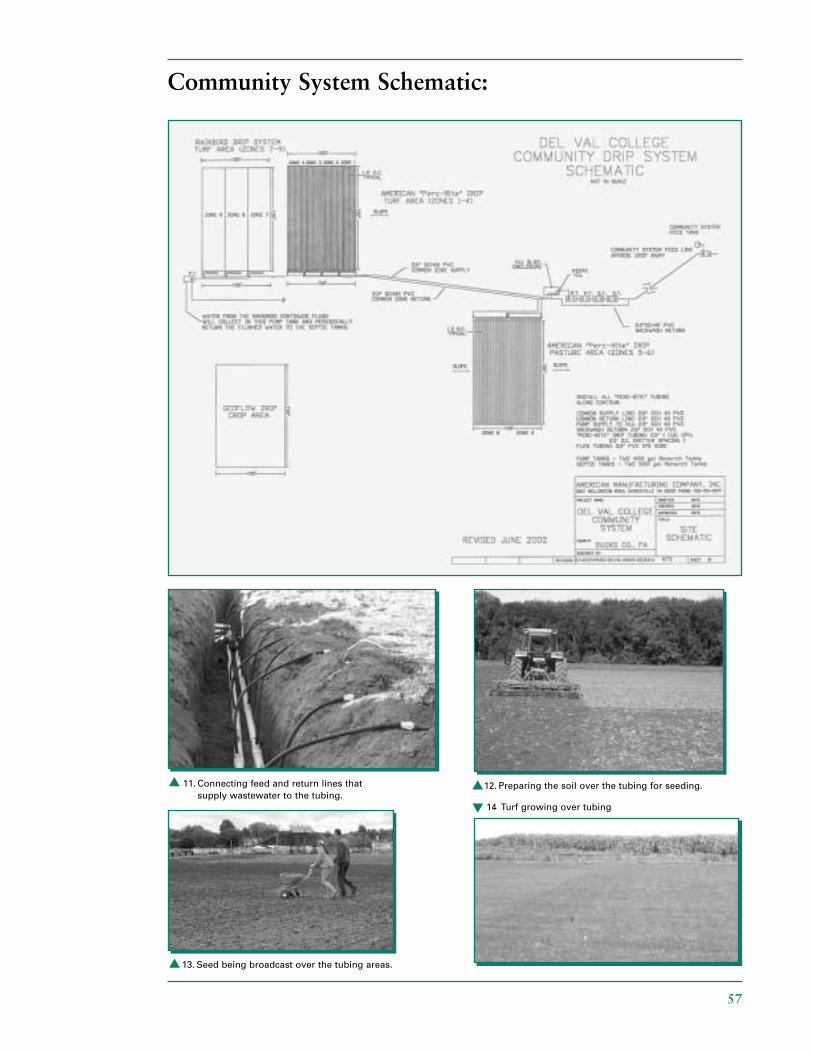
Community System Schematic:
57
11. Connecting feed and return lines that supply wastewater to the tubing.
12. Preparing the soil over the tubing for seeding.
13. Seed being broadcast over the tubing areas.▲
▲▲
14 Turf growing over tubing▲
58
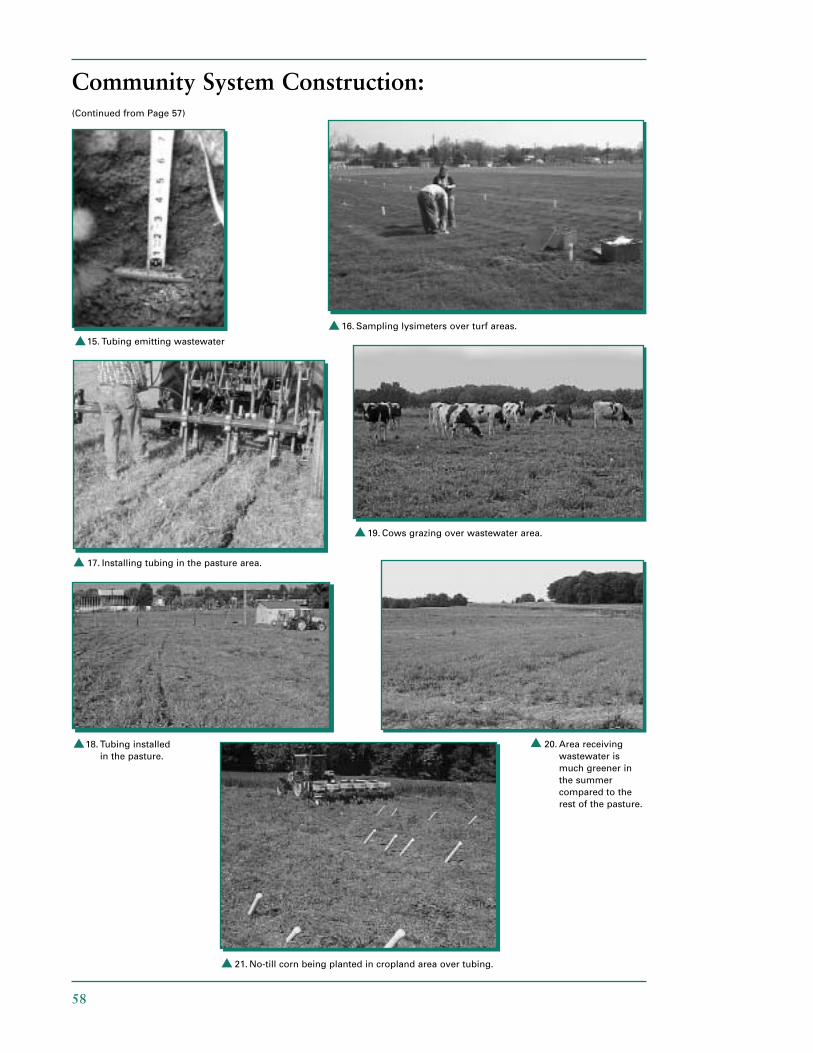
16. Sampling lysimeters over turf areas.
17. Installing tubing in the pasture area.
▲
▲
20. Area receiving wastewater is much greener in the summer compared to the rest of the pasture.
▲
21. No-till corn being planted in cropland area over tubing.▲
19. Cows grazing over wastewater area.▲
18. Tubing installed in the pasture.
▲
15. Tubing emitting wastewater▲
Community System Construction:(Continued from Page 57)
59
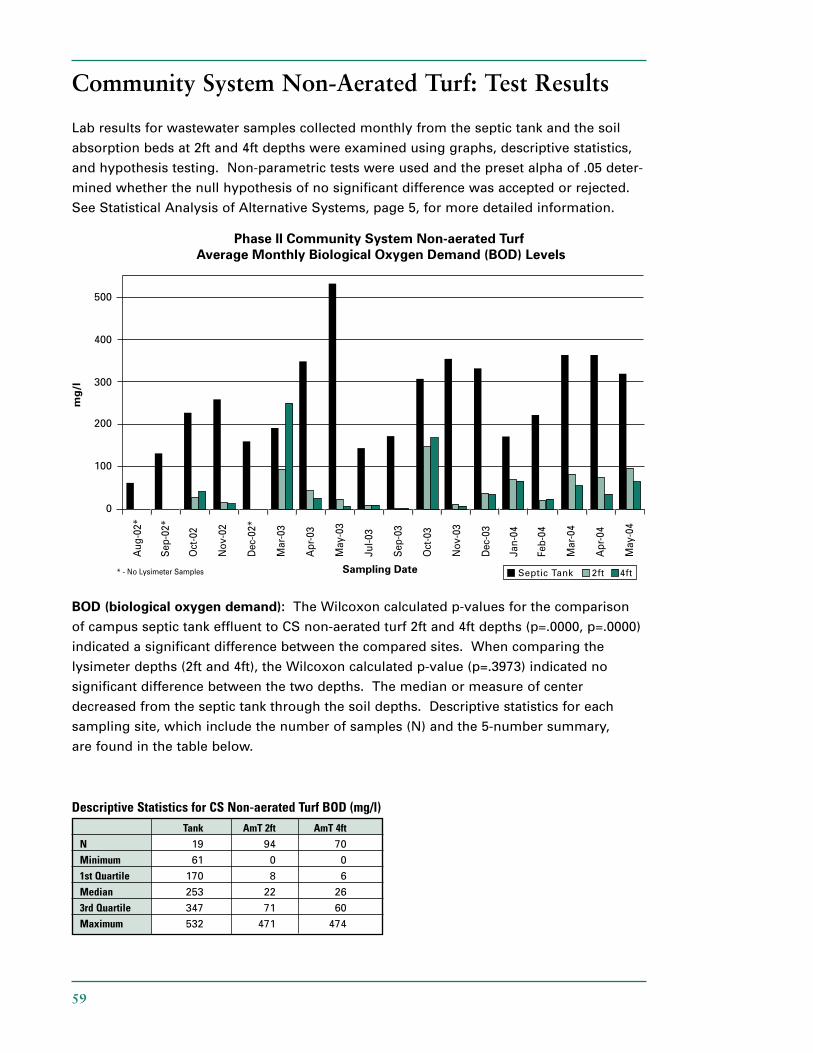
Community System Non-Aerated Turf: Test Results
Lab results for wastewater samples collected monthly from the septic tank and the soil
absorption beds at 2ft and 4ft depths were examined using graphs, descriptive statistics,
and hypothesis testing. Non-parametric tests were used and the preset alpha of .05 deter-
mined whether the null hypothesis of no significant difference was accepted or rejected.
See Statistical Analysis of Alternative Systems, page 5, for more detailed information.
BOD (biological oxygen demand): The Wilcoxon calculated p-values for the comparison
of campus septic tank effluent to CS non-aerated turf 2ft and 4ft depths (p=.0000, p=.0000)
indicated a significant difference between the compared sites. When comparing the
lysimeter depths (2ft and 4ft), the Wilcoxon calculated p-value (p=.3973) indicated no
significant difference between the two depths. The median or measure of center
decreased from the septic tank through the soil depths. Descriptive statistics for each
sampling site, which include the number of samples (N) and the 5-number summary,
are found in the table below.
Descriptive Statistics for CS Non-aerated Turf BOD (mg/l)Tank AmT 2ft AmT 4ft
N 19 94 70
Minimum 61 0 0
1st Quartile 170 8 6
Median 253 22 26
3rd Quartile 347 71 60
Maximum 532 471 474
60
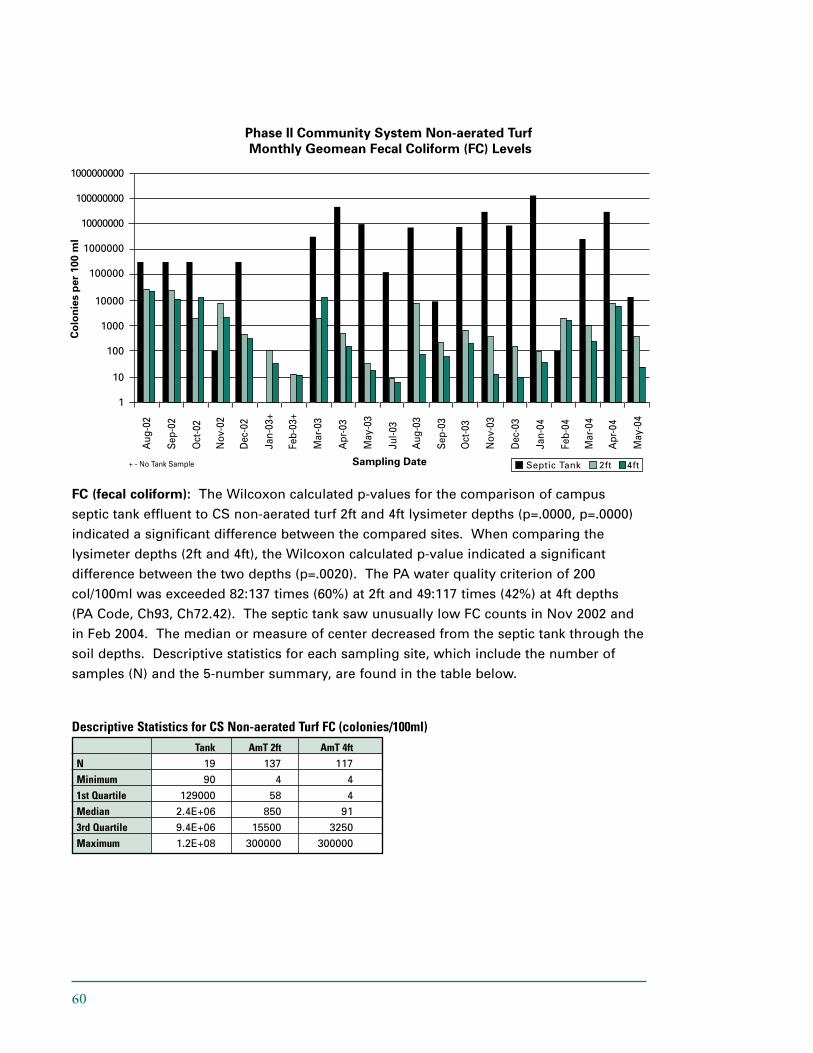
FC (fecal coliform): The Wilcoxon calculated p-values for the comparison of campus
septic tank effluent to CS non-aerated turf 2ft and 4ft lysimeter depths (p=.0000, p=.0000)
indicated a significant difference between the compared sites. When comparing the
lysimeter depths (2ft and 4ft), the Wilcoxon calculated p-value indicated a significant
difference between the two depths (p=.0020). The PA water quality criterion of 200
col/100ml was exceeded 82:137 times (60%) at 2ft and 49:117 times (42%) at 4ft depths
(PA Code, Ch93, Ch72.42). The septic tank saw unusually low FC counts in Nov 2002 and
in Feb 2004. The median or measure of center decreased from the septic tank through the
soil depths. Descriptive statistics for each sampling site, which include the number of
samples (N) and the 5-number summary, are found in the table below.
Descriptive Statistics for CS Non-aerated Turf FC (colonies/100ml)Tank AmT 2ft AmT 4ft
N 19 137 117
Minimum 90 4 4
1st Quartile 129000 58 4
Median 2.4E+06 850 91
3rd Quartile 9.4E+06 15500 3250
Maximum 1.2E+08 300000 300000
61
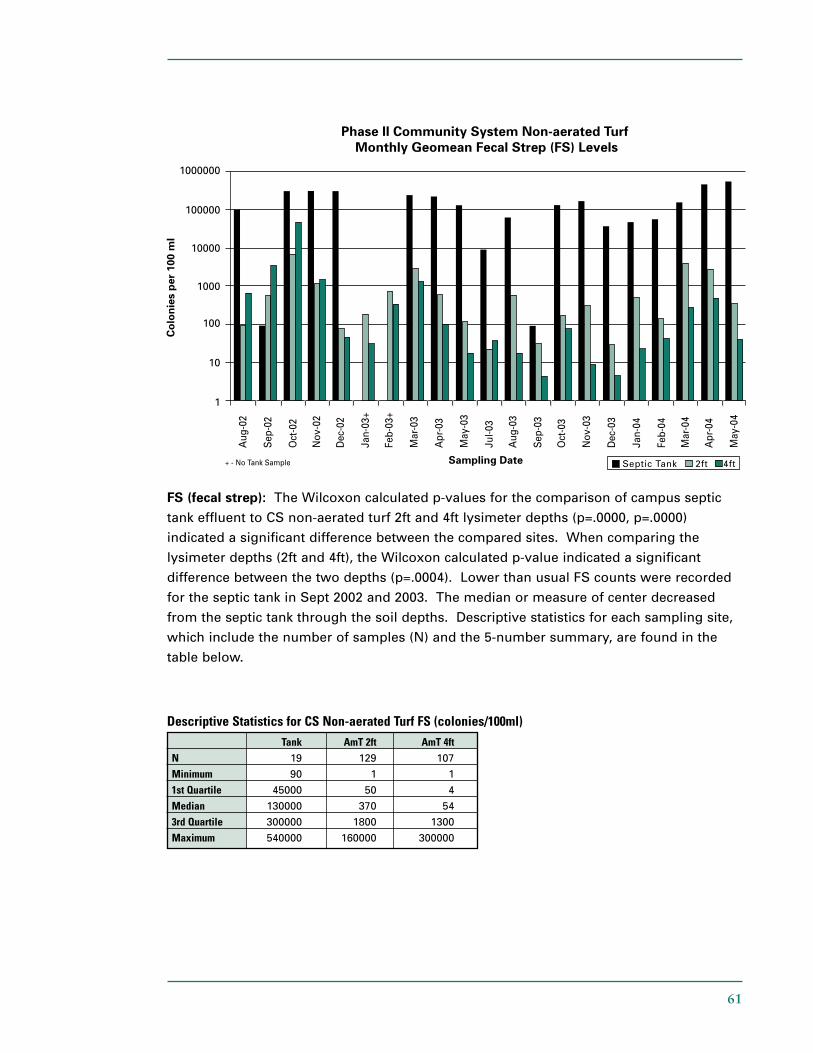
FS (fecal strep): The Wilcoxon calculated p-values for the comparison of campus septic
tank effluent to CS non-aerated turf 2ft and 4ft lysimeter depths (p=.0000, p=.0000)
indicated a significant difference between the compared sites. When comparing the
lysimeter depths (2ft and 4ft), the Wilcoxon calculated p-value indicated a significant
difference between the two depths (p=.0004). Lower than usual FS counts were recorded
for the septic tank in Sept 2002 and 2003. The median or measure of center decreased
from the septic tank through the soil depths. Descriptive statistics for each sampling site,
which include the number of samples (N) and the 5-number summary, are found in the
table below.
Descriptive Statistics for CS Non-aerated Turf FS (colonies/100ml)Tank AmT 2ft AmT 4ft
N 19 129 107
Minimum 90 1 1
1st Quartile 45000 50 4
Median 130000 370 54
3rd Quartile 300000 1800 1300
Maximum 540000 160000 300000
62
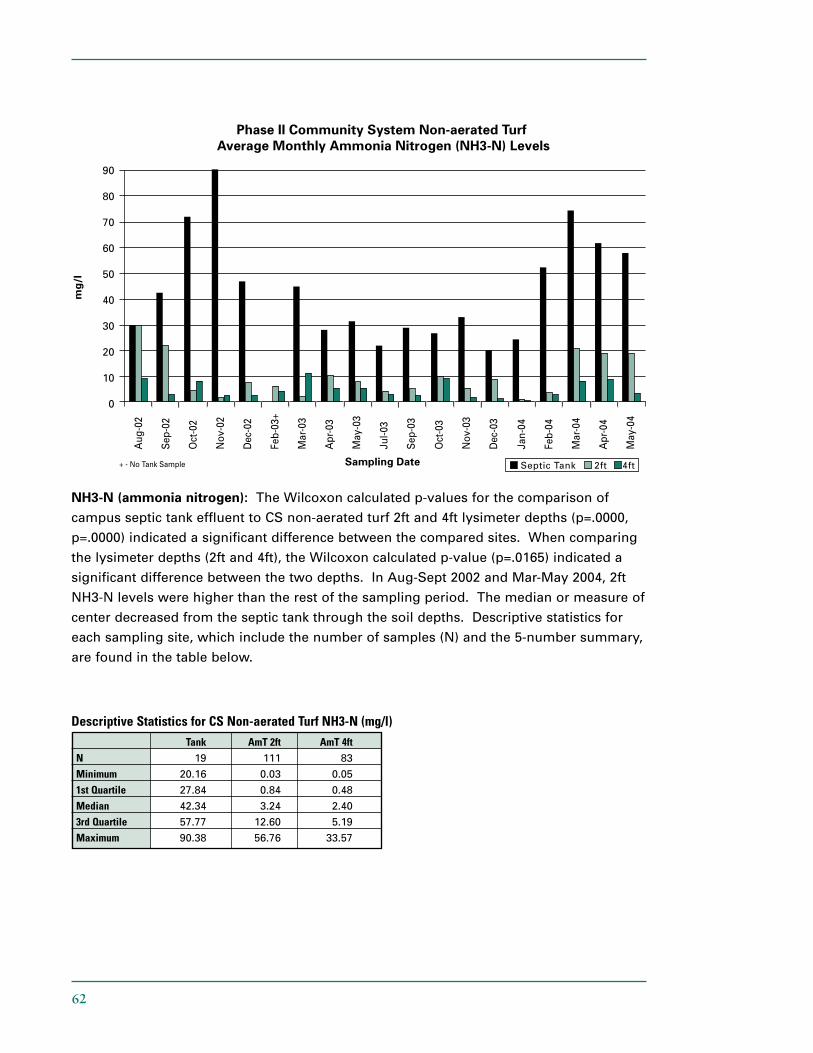
NH3-N (ammonia nitrogen): The Wilcoxon calculated p-values for the comparison of
campus septic tank effluent to CS non-aerated turf 2ft and 4ft lysimeter depths (p=.0000,
p=.0000) indicated a significant difference between the compared sites. When comparing
the lysimeter depths (2ft and 4ft), the Wilcoxon calculated p-value (p=.0165) indicated a
significant difference between the two depths. In Aug-Sept 2002 and Mar-May 2004, 2ft
NH3-N levels were higher than the rest of the sampling period. The median or measure of
center decreased from the septic tank through the soil depths. Descriptive statistics for
each sampling site, which include the number of samples (N) and the 5-number summary,
are found in the table below.
Descriptive Statistics for CS Non-aerated Turf NH3-N (mg/l)Tank AmT 2ft AmT 4ft
N 19 111 83
Minimum 20.16 0.03 0.05
1st Quartile 27.84 0.84 0.48
Median 42.34 3.24 2.40
3rd Quartile 57.77 12.60 5.19
Maximum 90.38 56.76 33.57
63
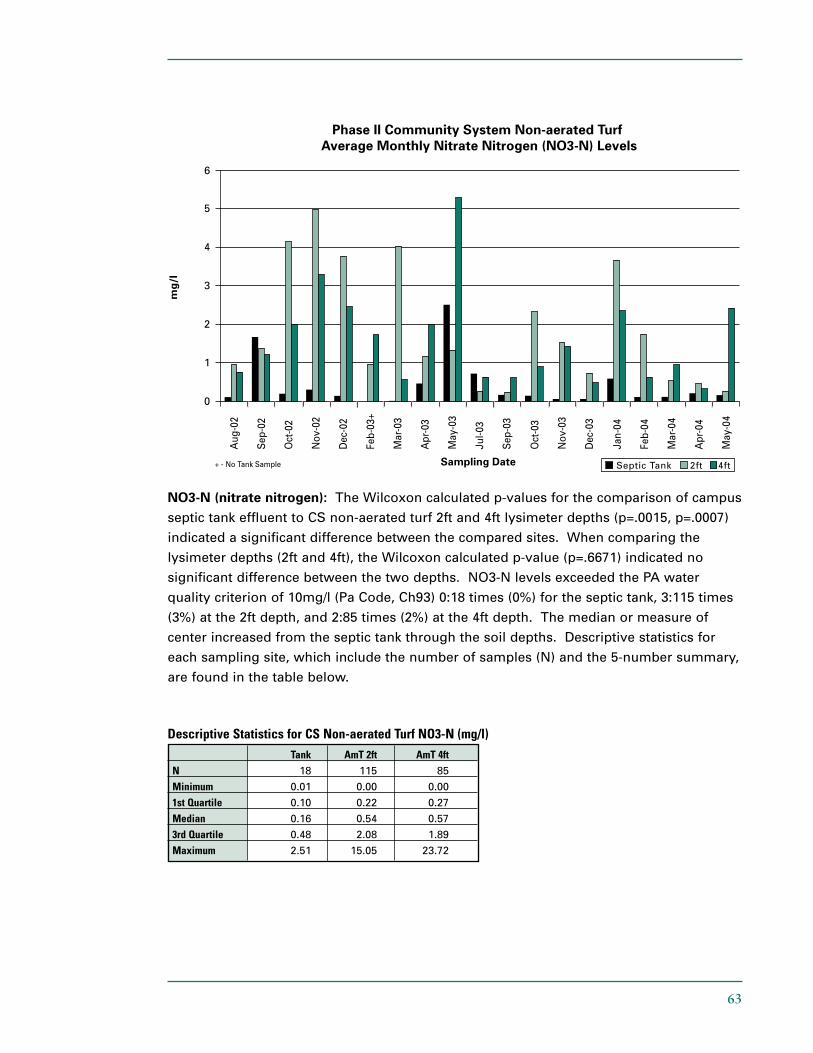
NO3-N (nitrate nitrogen): The Wilcoxon calculated p-values for the comparison of campus
septic tank effluent to CS non-aerated turf 2ft and 4ft lysimeter depths (p=.0015, p=.0007)
indicated a significant difference between the compared sites. When comparing the
lysimeter depths (2ft and 4ft), the Wilcoxon calculated p-value (p=.6671) indicated no
significant difference between the two depths. NO3-N levels exceeded the PA water
quality criterion of 10mg/l (Pa Code, Ch93) 0:18 times (0%) for the septic tank, 3:115 times
(3%) at the 2ft depth, and 2:85 times (2%) at the 4ft depth. The median or measure of
center increased from the septic tank through the soil depths. Descriptive statistics for
each sampling site, which include the number of samples (N) and the 5-number summary,
are found in the table below.
Descriptive Statistics for CS Non-aerated Turf NO3-N (mg/l)Tank AmT 2ft AmT 4ft
N 18 115 85
Minimum 0.01 0.00 0.00
1st Quartile 0.10 0.22 0.27
Median 0.16 0.54 0.57
3rd Quartile 0.48 2.08 1.89
Maximum 2.51 15.05 23.72
64
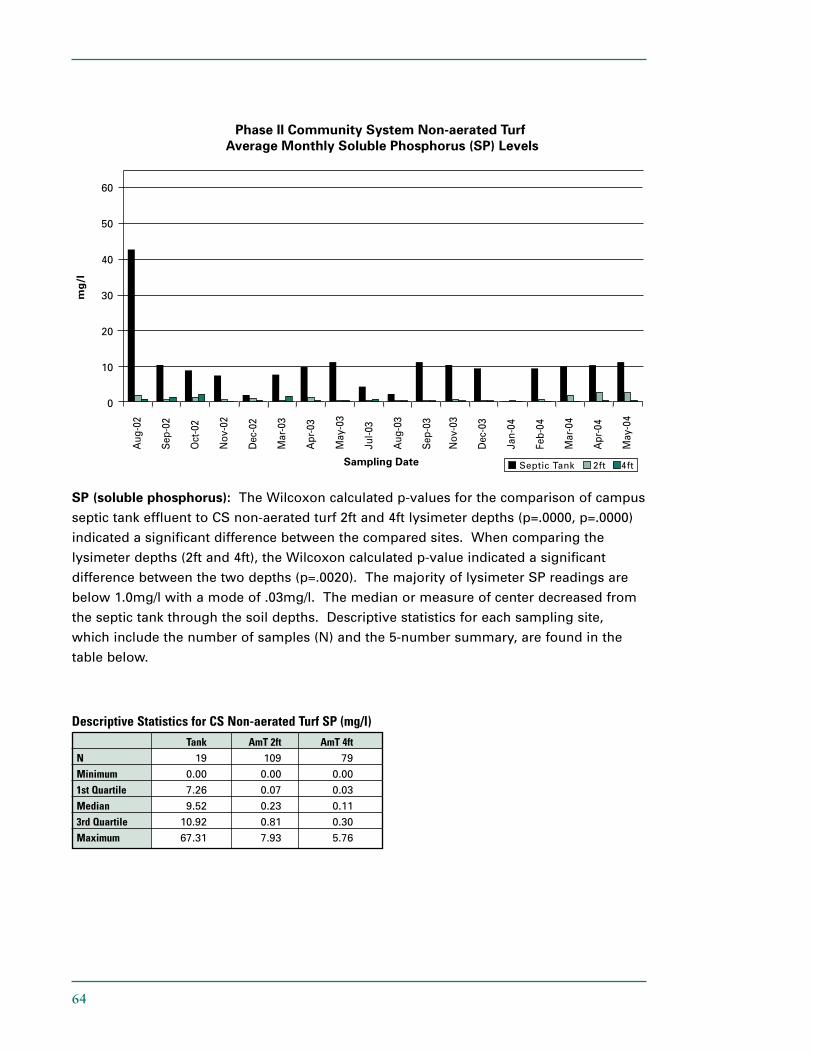
SP (soluble phosphorus): The Wilcoxon calculated p-values for the comparison of campus
septic tank effluent to CS non-aerated turf 2ft and 4ft lysimeter depths (p=.0000, p=.0000)
indicated a significant difference between the compared sites. When comparing the
lysimeter depths (2ft and 4ft), the Wilcoxon calculated p-value indicated a significant
difference between the two depths (p=.0020). The majority of lysimeter SP readings are
below 1.0mg/l with a mode of .03mg/l. The median or measure of center decreased from
the septic tank through the soil depths. Descriptive statistics for each sampling site,
which include the number of samples (N) and the 5-number summary, are found in the
table below.
Descriptive Statistics for CS Non-aerated Turf SP (mg/l)Tank AmT 2ft AmT 4ft
N 19 109 79
Minimum 0.00 0.00 0.00
1st Quartile 7.26 0.07 0.03
Median 9.52 0.23 0.11
3rd Quartile 10.92 0.81 0.30
Maximum 67.31 7.93 5.76
65
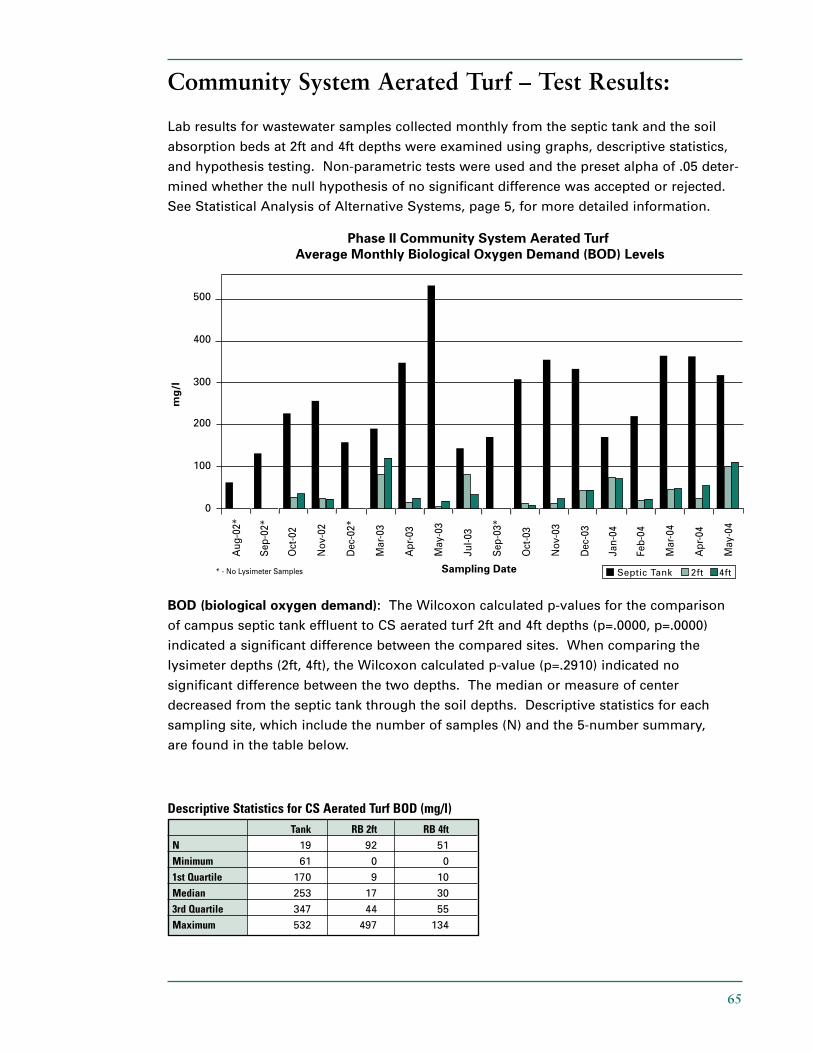
Descriptive Statistics for CS Aerated Turf BOD (mg/l)Tank RB 2ft RB 4ft
N 19 92 51
Minimum 61 0 0
1st Quartile 170 9 10
Median 253 17 30
3rd Quartile 347 44 55
Maximum 532 497 134
Community System Aerated Turf – Test Results:
Lab results for wastewater samples collected monthly from the septic tank and the soil
absorption beds at 2ft and 4ft depths were examined using graphs, descriptive statistics,
and hypothesis testing. Non-parametric tests were used and the preset alpha of .05 deter-
mined whether the null hypothesis of no significant difference was accepted or rejected.
See Statistical Analysis of Alternative Systems, page 5, for more detailed information.
BOD (biological oxygen demand): The Wilcoxon calculated p-values for the comparison
of campus septic tank effluent to CS aerated turf 2ft and 4ft depths (p=.0000, p=.0000)
indicated a significant difference between the compared sites. When comparing the
lysimeter depths (2ft, 4ft), the Wilcoxon calculated p-value (p=.2910) indicated no
significant difference between the two depths. The median or measure of center
decreased from the septic tank through the soil depths. Descriptive statistics for each
sampling site, which include the number of samples (N) and the 5-number summary,
are found in the table below.
66
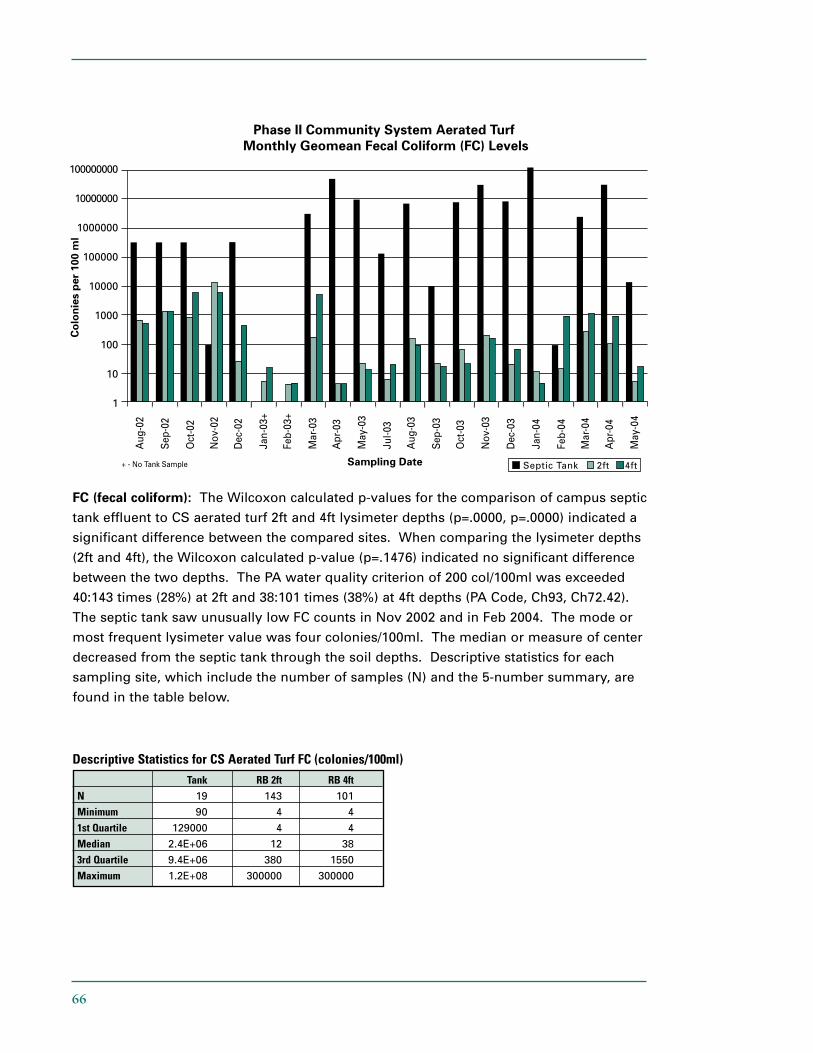
FC (fecal coliform): The Wilcoxon calculated p-values for the comparison of campus septic
tank effluent to CS aerated turf 2ft and 4ft lysimeter depths (p=.0000, p=.0000) indicated a
significant difference between the compared sites. When comparing the lysimeter depths
(2ft and 4ft), the Wilcoxon calculated p-value (p=.1476) indicated no significant difference
between the two depths. The PA water quality criterion of 200 col/100ml was exceeded
40:143 times (28%) at 2ft and 38:101 times (38%) at 4ft depths (PA Code, Ch93, Ch72.42).
The septic tank saw unusually low FC counts in Nov 2002 and in Feb 2004. The mode or
most frequent lysimeter value was four colonies/100ml. The median or measure of center
decreased from the septic tank through the soil depths. Descriptive statistics for each
sampling site, which include the number of samples (N) and the 5-number summary, are
found in the table below.
Descriptive Statistics for CS Aerated Turf FC (colonies/100ml) Tank RB 2ft RB 4ft
N 19 143 101
Minimum 90 4 4
1st Quartile 129000 4 4
Median 2.4E+06 12 38
3rd Quartile 9.4E+06 380 1550
Maximum 1.2E+08 300000 300000
67
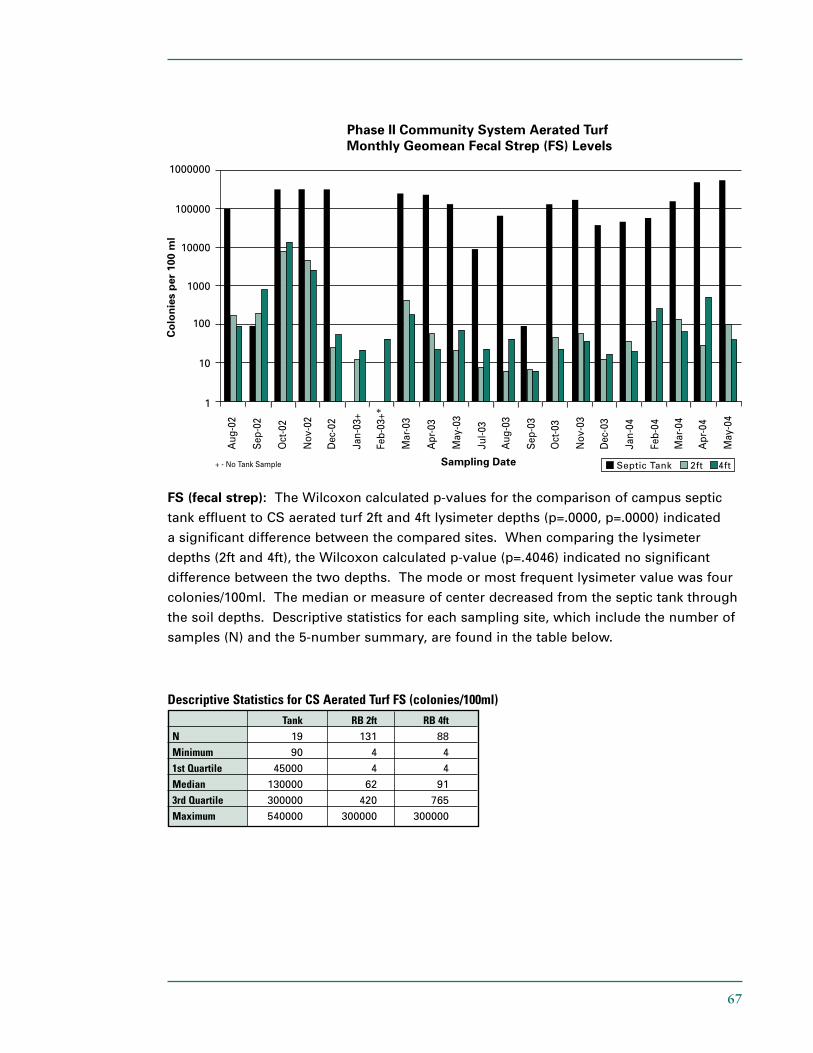
FS (fecal strep): The Wilcoxon calculated p-values for the comparison of campus septic
tank effluent to CS aerated turf 2ft and 4ft lysimeter depths (p=.0000, p=.0000) indicated
a significant difference between the compared sites. When comparing the lysimeter
depths (2ft and 4ft), the Wilcoxon calculated p-value (p=.4046) indicated no significant
difference between the two depths. The mode or most frequent lysimeter value was four
colonies/100ml. The median or measure of center decreased from the septic tank through
the soil depths. Descriptive statistics for each sampling site, which include the number of
samples (N) and the 5-number summary, are found in the table below.
Descriptive Statistics for CS Aerated Turf FS (colonies/100ml) Tank RB 2ft RB 4ft
N 19 131 88
Minimum 90 4 4
1st Quartile 45000 4 4
Median 130000 62 91
3rd Quartile 300000 420 765
Maximum 540000 300000 300000
68
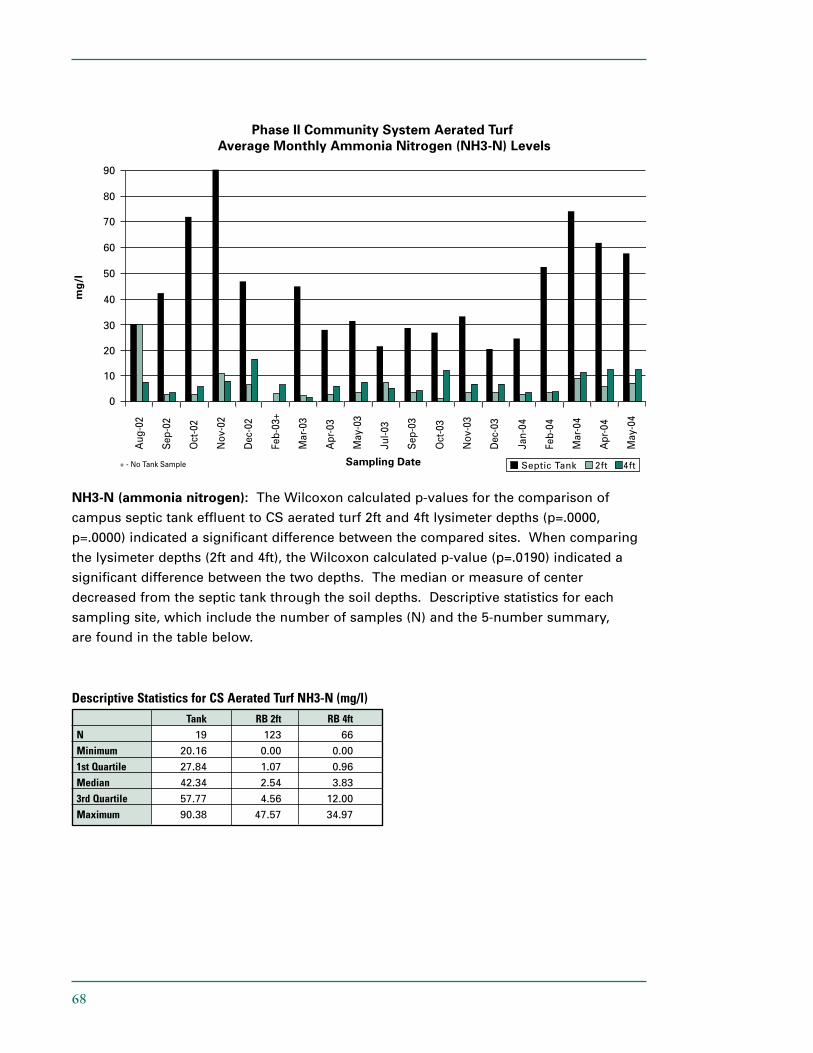
NH3-N (ammonia nitrogen): The Wilcoxon calculated p-values for the comparison of
campus septic tank effluent to CS aerated turf 2ft and 4ft lysimeter depths (p=.0000,
p=.0000) indicated a significant difference between the compared sites. When comparing
the lysimeter depths (2ft and 4ft), the Wilcoxon calculated p-value (p=.0190) indicated a
significant difference between the two depths. The median or measure of center
decreased from the septic tank through the soil depths. Descriptive statistics for each
sampling site, which include the number of samples (N) and the 5-number summary,
are found in the table below.
Descriptive Statistics for CS Aerated Turf NH3-N (mg/l) Tank RB 2ft RB 4ft
N 19 123 66
Minimum 20.16 0.00 0.00
1st Quartile 27.84 1.07 0.96
Median 42.34 2.54 3.83
3rd Quartile 57.77 4.56 12.00
Maximum 90.38 47.57 34.97
69
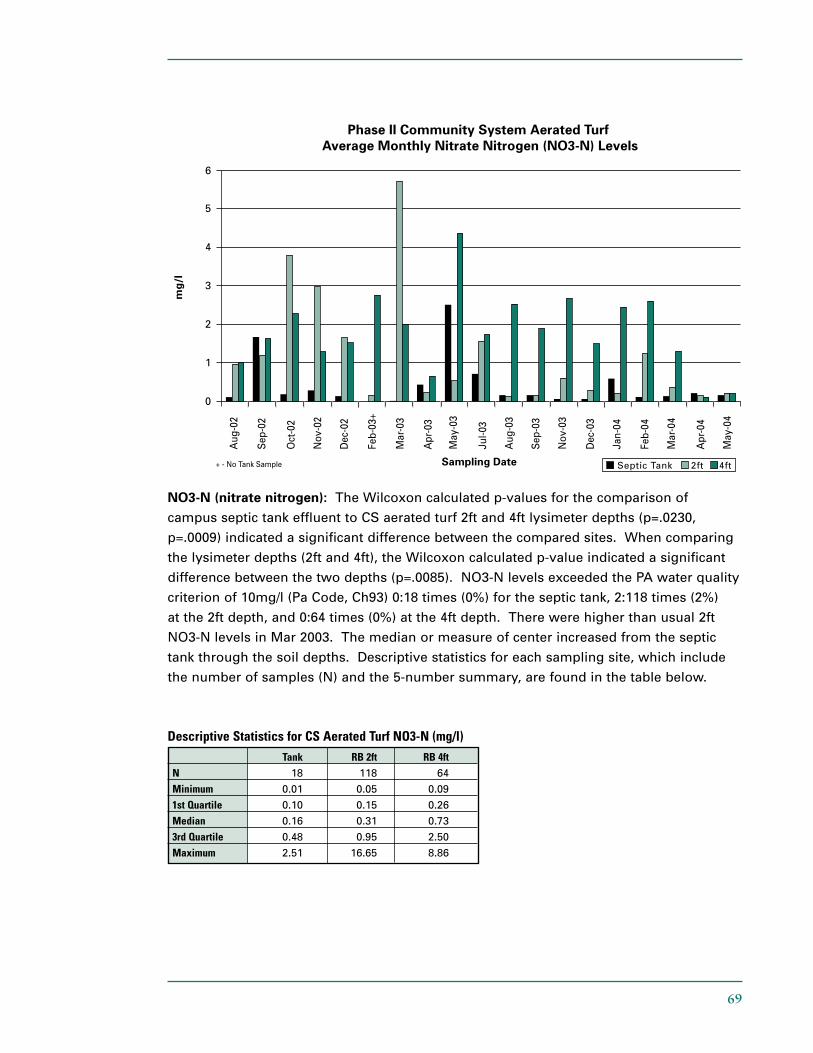
NO3-N (nitrate nitrogen): The Wilcoxon calculated p-values for the comparison of
campus septic tank effluent to CS aerated turf 2ft and 4ft lysimeter depths (p=.0230,
p=.0009) indicated a significant difference between the compared sites. When comparing
the lysimeter depths (2ft and 4ft), the Wilcoxon calculated p-value indicated a significant
difference between the two depths (p=.0085). NO3-N levels exceeded the PA water quality
criterion of 10mg/l (Pa Code, Ch93) 0:18 times (0%) for the septic tank, 2:118 times (2%)
at the 2ft depth, and 0:64 times (0%) at the 4ft depth. There were higher than usual 2ft
NO3-N levels in Mar 2003. The median or measure of center increased from the septic
tank through the soil depths. Descriptive statistics for each sampling site, which include
the number of samples (N) and the 5-number summary, are found in the table below.
Descriptive Statistics for CS Aerated Turf NO3-N (mg/l) Tank RB 2ft RB 4ft
N 18 118 64
Minimum 0.01 0.05 0.09
1st Quartile 0.10 0.15 0.26
Median 0.16 0.31 0.73
3rd Quartile 0.48 0.95 2.50
Maximum 2.51 16.65 8.86
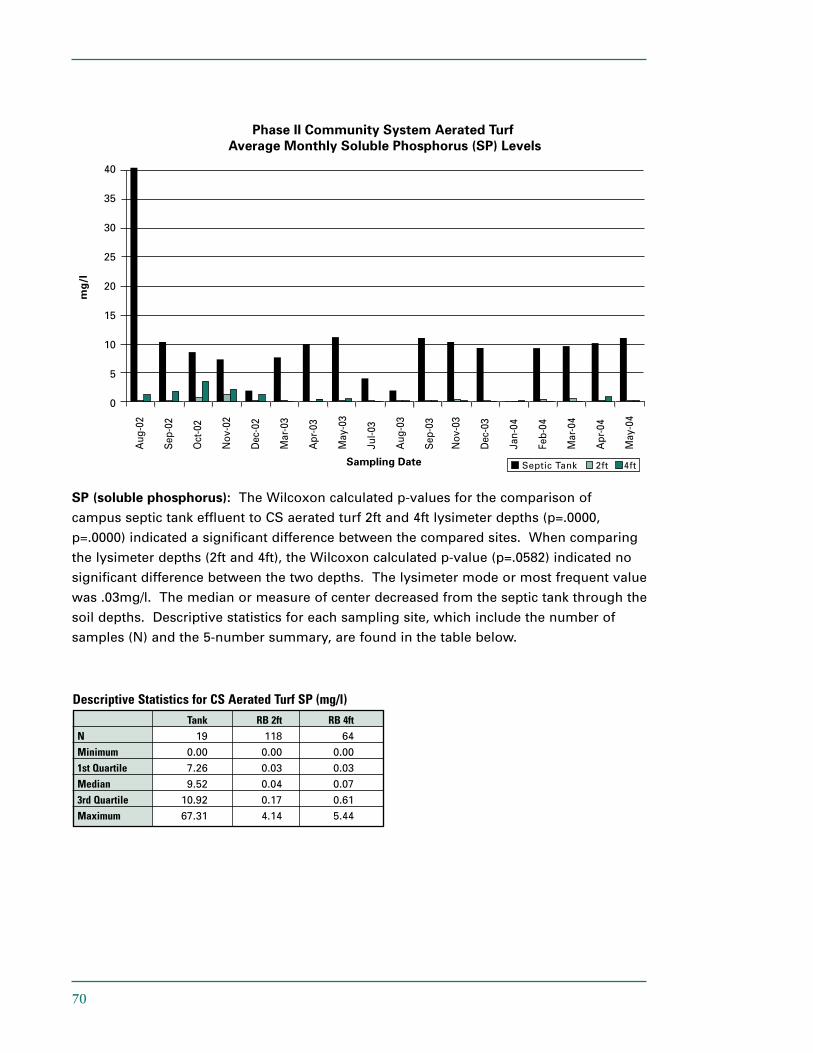
70
SP (soluble phosphorus): The Wilcoxon calculated p-values for the comparison of
campus septic tank effluent to CS aerated turf 2ft and 4ft lysimeter depths (p=.0000,
p=.0000) indicated a significant difference between the compared sites. When comparing
the lysimeter depths (2ft and 4ft), the Wilcoxon calculated p-value (p=.0582) indicated no
significant difference between the two depths. The lysimeter mode or most frequent value
was .03mg/l. The median or measure of center decreased from the septic tank through the
soil depths. Descriptive statistics for each sampling site, which include the number of
samples (N) and the 5-number summary, are found in the table below.
Descriptive Statistics for CS Aerated Turf SP (mg/l)Tank RB 2ft RB 4ft
N 19 118 64
Minimum 0.00 0.00 0.00
1st Quartile 7.26 0.03 0.03
Median 9.52 0.04 0.07
3rd Quartile 10.92 0.17 0.61
Maximum 67.31 4.14 5.44
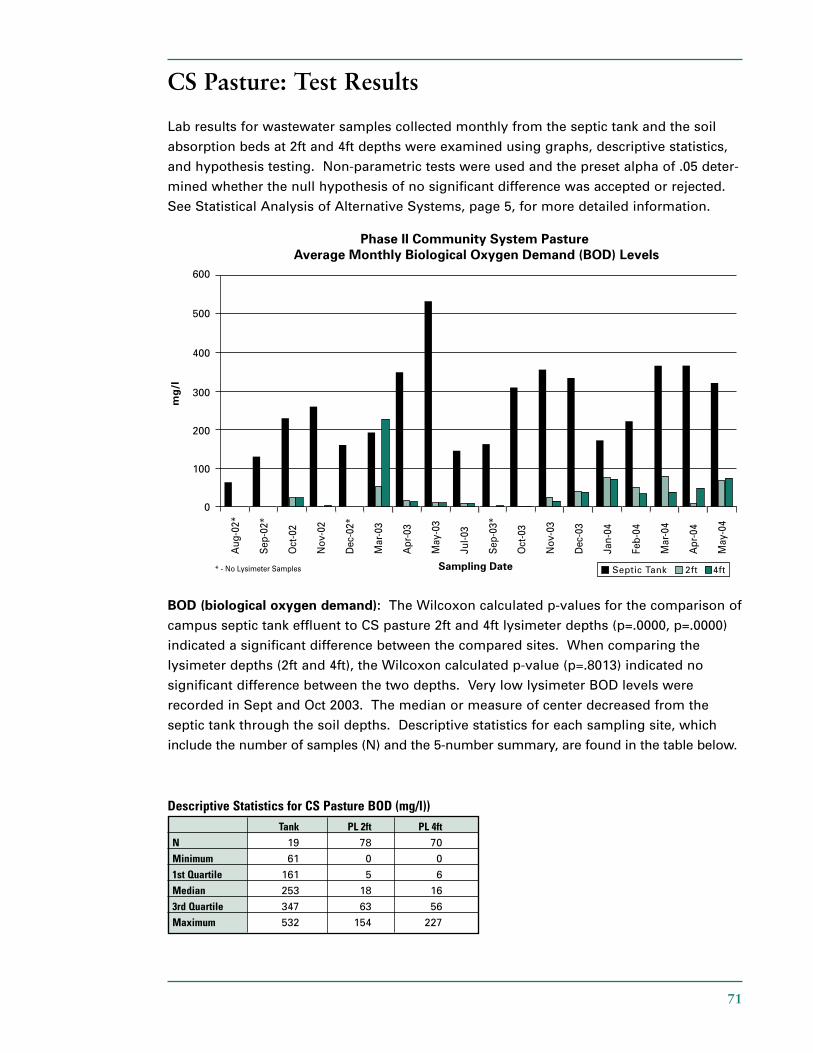
71
CS Pasture: Test Results
Lab results for wastewater samples collected monthly from the septic tank and the soil
absorption beds at 2ft and 4ft depths were examined using graphs, descriptive statistics,
and hypothesis testing. Non-parametric tests were used and the preset alpha of .05 deter-
mined whether the null hypothesis of no significant difference was accepted or rejected.
See Statistical Analysis of Alternative Systems, page 5, for more detailed information.
BOD (biological oxygen demand): The Wilcoxon calculated p-values for the comparison of
campus septic tank effluent to CS pasture 2ft and 4ft lysimeter depths (p=.0000, p=.0000)
indicated a significant difference between the compared sites. When comparing the
lysimeter depths (2ft and 4ft), the Wilcoxon calculated p-value (p=.8013) indicated no
significant difference between the two depths. Very low lysimeter BOD levels were
recorded in Sept and Oct 2003. The median or measure of center decreased from the
septic tank through the soil depths. Descriptive statistics for each sampling site, which
include the number of samples (N) and the 5-number summary, are found in the table below.
Descriptive Statistics for CS Pasture BOD (mg/l))Tank PL 2ft PL 4ft
N 19 78 70
Minimum 61 0 0
1st Quartile 161 5 6
Median 253 18 16
3rd Quartile 347 63 56
Maximum 532 154 227
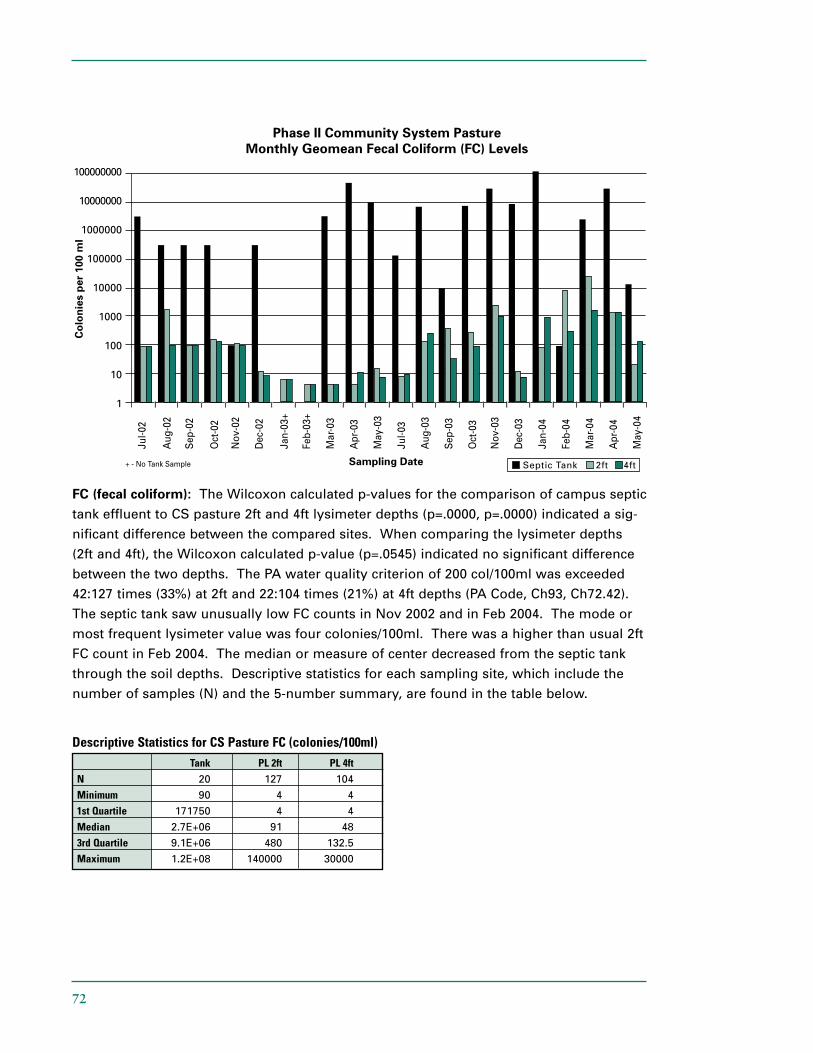
72
FC (fecal coliform): The Wilcoxon calculated p-values for the comparison of campus septic
tank effluent to CS pasture 2ft and 4ft lysimeter depths (p=.0000, p=.0000) indicated a sig-
nificant difference between the compared sites. When comparing the lysimeter depths
(2ft and 4ft), the Wilcoxon calculated p-value (p=.0545) indicated no significant difference
between the two depths. The PA water quality criterion of 200 col/100ml was exceeded
42:127 times (33%) at 2ft and 22:104 times (21%) at 4ft depths (PA Code, Ch93, Ch72.42).
The septic tank saw unusually low FC counts in Nov 2002 and in Feb 2004. The mode or
most frequent lysimeter value was four colonies/100ml. There was a higher than usual 2ft
FC count in Feb 2004. The median or measure of center decreased from the septic tank
through the soil depths. Descriptive statistics for each sampling site, which include the
number of samples (N) and the 5-number summary, are found in the table below.
Descriptive Statistics for CS Pasture FC (colonies/100ml)Tank PL 2ft PL 4ft
N 20 127 104
Minimum 90 4 4
1st Quartile 171750 4 4
Median 2.7E+06 91 48
3rd Quartile 9.1E+06 480 132.5
Maximum 1.2E+08 140000 30000
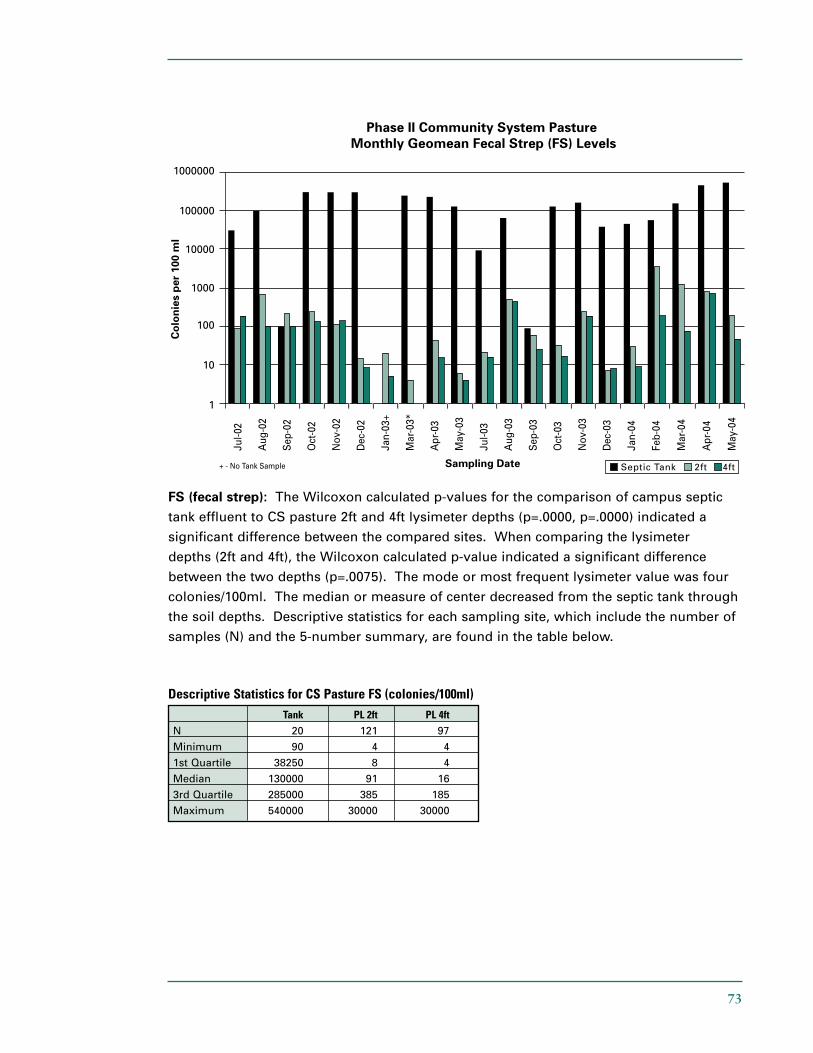
73
FS (fecal strep): The Wilcoxon calculated p-values for the comparison of campus septic
tank effluent to CS pasture 2ft and 4ft lysimeter depths (p=.0000, p=.0000) indicated a
significant difference between the compared sites. When comparing the lysimeter
depths (2ft and 4ft), the Wilcoxon calculated p-value indicated a significant difference
between the two depths (p=.0075). The mode or most frequent lysimeter value was four
colonies/100ml. The median or measure of center decreased from the septic tank through
the soil depths. Descriptive statistics for each sampling site, which include the number of
samples (N) and the 5-number summary, are found in the table below.
Descriptive Statistics for CS Pasture FS (colonies/100ml) Tank PL 2ft PL 4ft
N 20 121 97
Minimum 90 4 4
1st Quartile 38250 8 4
Median 130000 91 16
3rd Quartile 285000 385 185
Maximum 540000 30000 30000
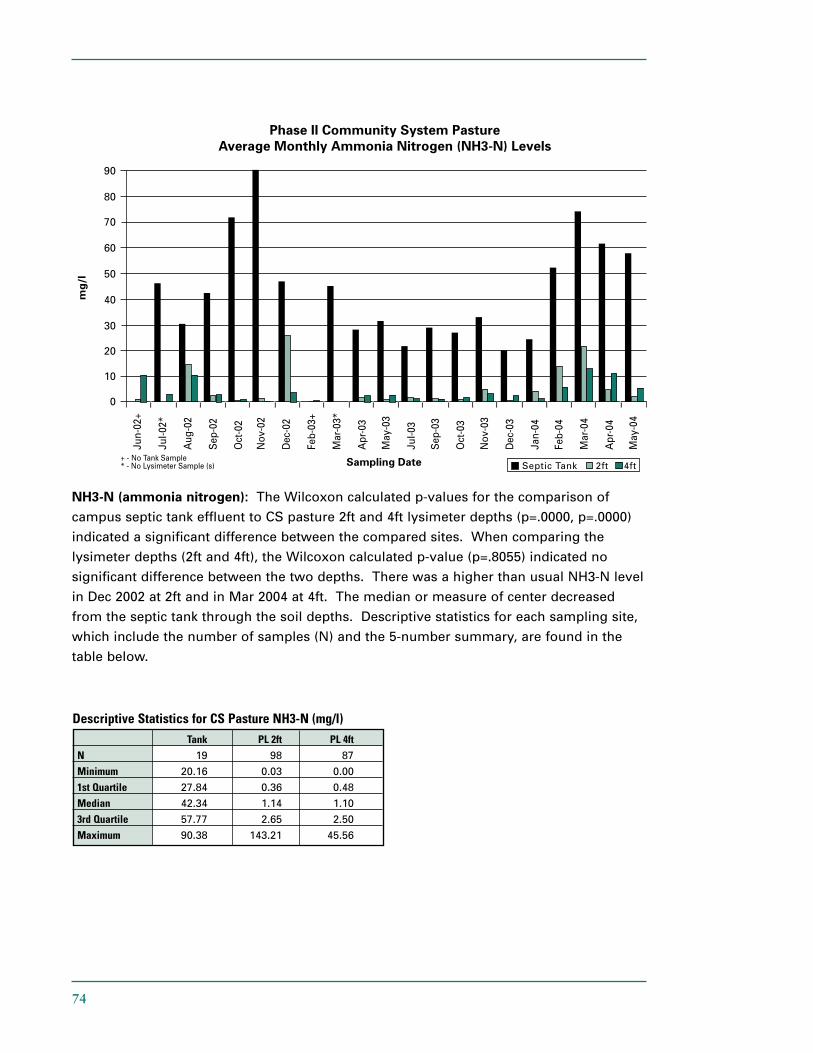
74
NH3-N (ammonia nitrogen): The Wilcoxon calculated p-values for the comparison of
campus septic tank effluent to CS pasture 2ft and 4ft lysimeter depths (p=.0000, p=.0000)
indicated a significant difference between the compared sites. When comparing the
lysimeter depths (2ft and 4ft), the Wilcoxon calculated p-value (p=.8055) indicated no
significant difference between the two depths. There was a higher than usual NH3-N level
in Dec 2002 at 2ft and in Mar 2004 at 4ft. The median or measure of center decreased
from the septic tank through the soil depths. Descriptive statistics for each sampling site,
which include the number of samples (N) and the 5-number summary, are found in the
table below.
Descriptive Statistics for CS Pasture NH3-N (mg/l)Tank PL 2ft PL 4ft
N 19 98 87
Minimum 20.16 0.03 0.00
1st Quartile 27.84 0.36 0.48
Median 42.34 1.14 1.10
3rd Quartile 57.77 2.65 2.50
Maximum 90.38 143.21 45.56
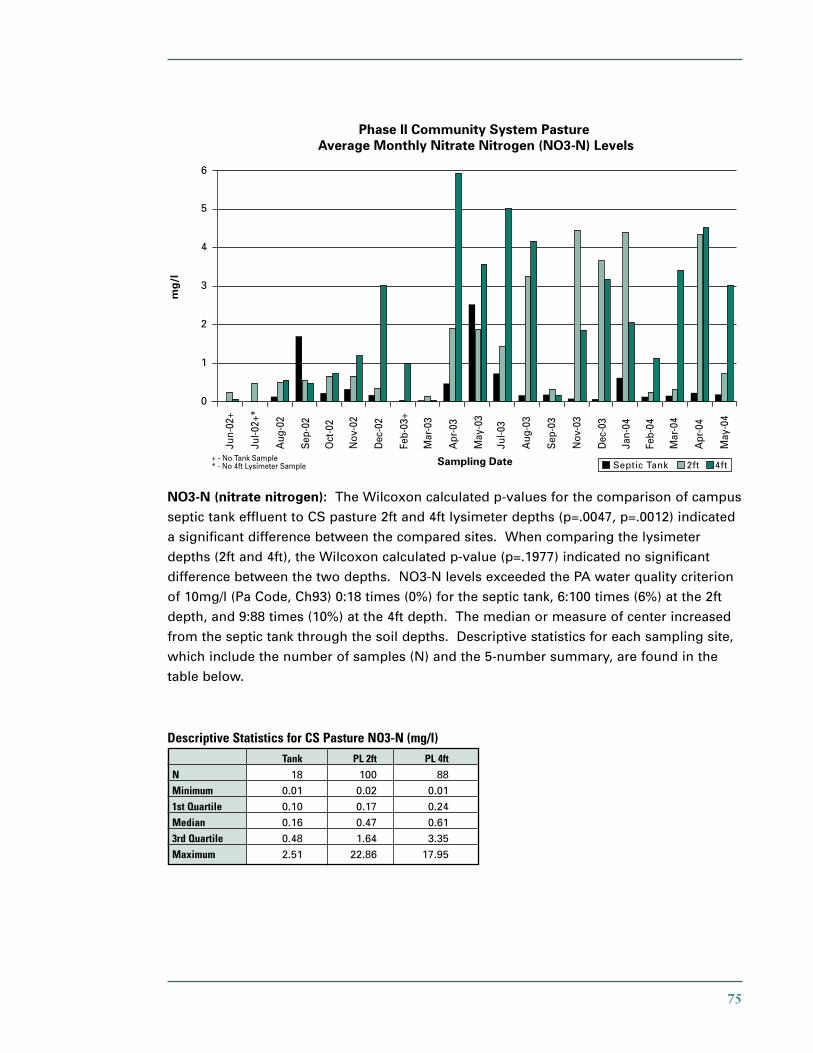
75
NO3-N (nitrate nitrogen): The Wilcoxon calculated p-values for the comparison of campus
septic tank effluent to CS pasture 2ft and 4ft lysimeter depths (p=.0047, p=.0012) indicated
a significant difference between the compared sites. When comparing the lysimeter
depths (2ft and 4ft), the Wilcoxon calculated p-value (p=.1977) indicated no significant
difference between the two depths. NO3-N levels exceeded the PA water quality criterion
of 10mg/l (Pa Code, Ch93) 0:18 times (0%) for the septic tank, 6:100 times (6%) at the 2ft
depth, and 9:88 times (10%) at the 4ft depth. The median or measure of center increased
from the septic tank through the soil depths. Descriptive statistics for each sampling site,
which include the number of samples (N) and the 5-number summary, are found in the
table below.
Descriptive Statistics for CS Pasture NO3-N (mg/l) Tank PL 2ft PL 4ft
N 18 100 88
Minimum 0.01 0.02 0.01
1st Quartile 0.10 0.17 0.24
Median 0.16 0.47 0.61
3rd Quartile 0.48 1.64 3.35
Maximum 2.51 22.86 17.95
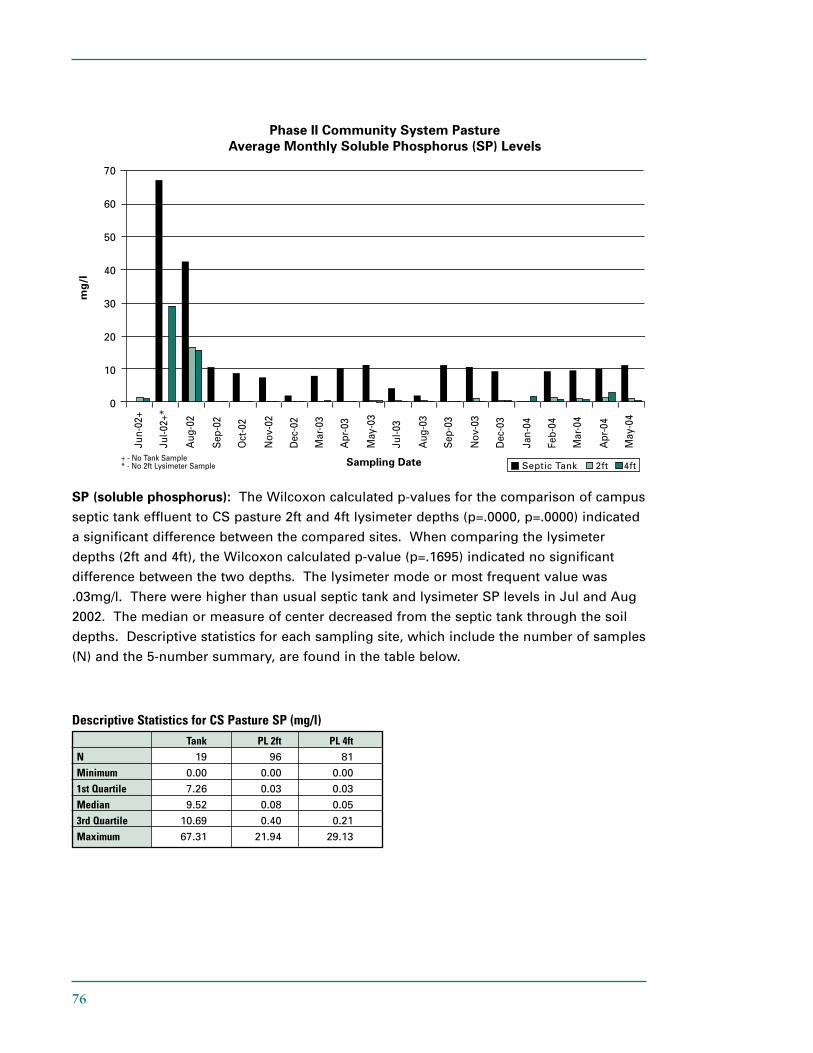
76
SP (soluble phosphorus): The Wilcoxon calculated p-values for the comparison of campus
septic tank effluent to CS pasture 2ft and 4ft lysimeter depths (p=.0000, p=.0000) indicated
a significant difference between the compared sites. When comparing the lysimeter
depths (2ft and 4ft), the Wilcoxon calculated p-value (p=.1695) indicated no significant
difference between the two depths. The lysimeter mode or most frequent value was
.03mg/l. There were higher than usual septic tank and lysimeter SP levels in Jul and Aug
2002. The median or measure of center decreased from the septic tank through the soil
depths. Descriptive statistics for each sampling site, which include the number of samples
(N) and the 5-number summary, are found in the table below.
Descriptive Statistics for CS Pasture SP (mg/l)Tank PL 2ft PL 4ft
N 19 96 81
Minimum 0.00 0.00 0.00
1st Quartile 7.26 0.03 0.03
Median 9.52 0.08 0.05
3rd Quartile 10.69 0.40 0.21
Maximum 67.31 21.94 29.13
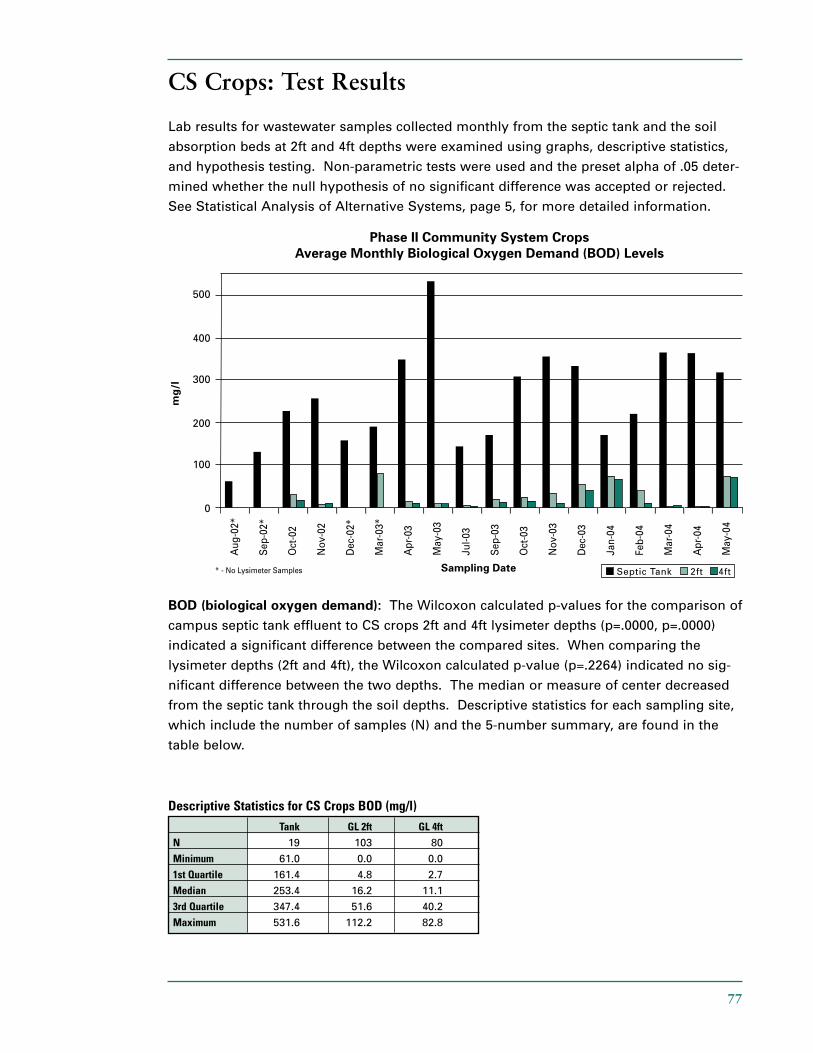
77
CS Crops: Test Results
Lab results for wastewater samples collected monthly from the septic tank and the soil
absorption beds at 2ft and 4ft depths were examined using graphs, descriptive statistics,
and hypothesis testing. Non-parametric tests were used and the preset alpha of .05 deter-
mined whether the null hypothesis of no significant difference was accepted or rejected.
See Statistical Analysis of Alternative Systems, page 5, for more detailed information.
BOD (biological oxygen demand): The Wilcoxon calculated p-values for the comparison of
campus septic tank effluent to CS crops 2ft and 4ft lysimeter depths (p=.0000, p=.0000)
indicated a significant difference between the compared sites. When comparing the
lysimeter depths (2ft and 4ft), the Wilcoxon calculated p-value (p=.2264) indicated no sig-
nificant difference between the two depths. The median or measure of center decreased
from the septic tank through the soil depths. Descriptive statistics for each sampling site,
which include the number of samples (N) and the 5-number summary, are found in the
table below.
Descriptive Statistics for CS Crops BOD (mg/l)Tank GL 2ft GL 4ft
N 19 103 80
Minimum 61.0 0.0 0.0
1st Quartile 161.4 4.8 2.7
Median 253.4 16.2 11.1
3rd Quartile 347.4 51.6 40.2
Maximum 531.6 112.2 82.8
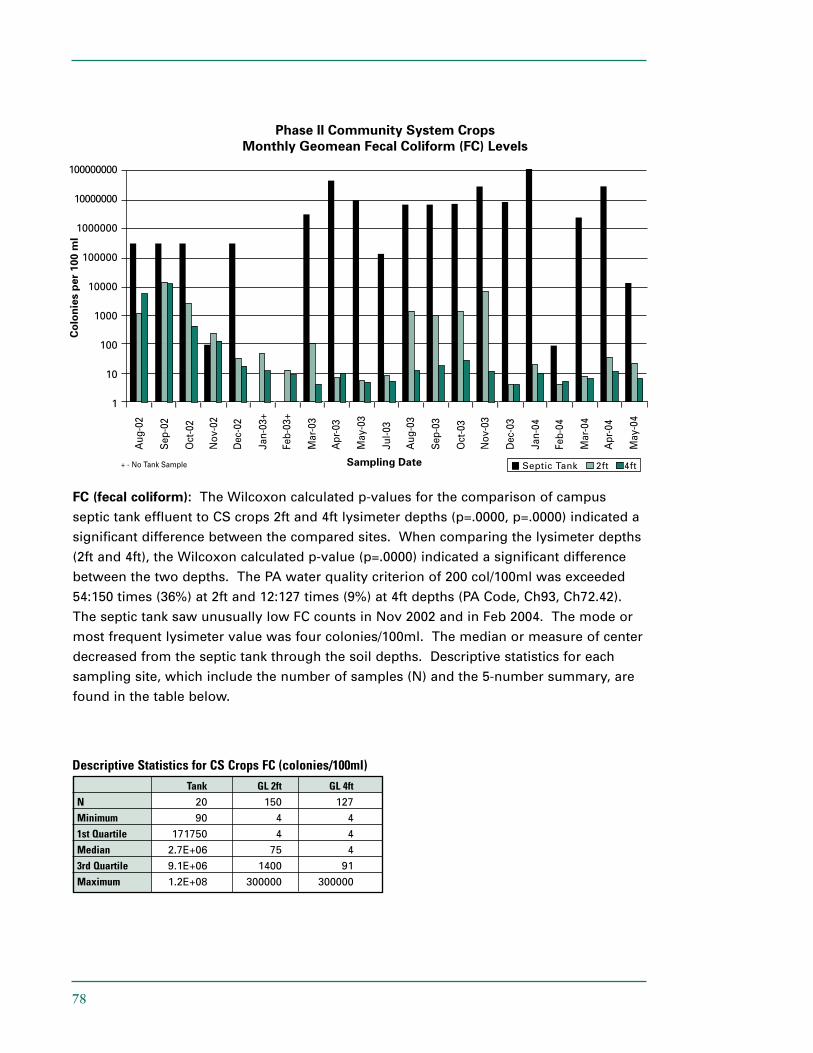
78
FC (fecal coliform): The Wilcoxon calculated p-values for the comparison of campus
septic tank effluent to CS crops 2ft and 4ft lysimeter depths (p=.0000, p=.0000) indicated a
significant difference between the compared sites. When comparing the lysimeter depths
(2ft and 4ft), the Wilcoxon calculated p-value (p=.0000) indicated a significant difference
between the two depths. The PA water quality criterion of 200 col/100ml was exceeded
54:150 times (36%) at 2ft and 12:127 times (9%) at 4ft depths (PA Code, Ch93, Ch72.42).
The septic tank saw unusually low FC counts in Nov 2002 and in Feb 2004. The mode or
most frequent lysimeter value was four colonies/100ml. The median or measure of center
decreased from the septic tank through the soil depths. Descriptive statistics for each
sampling site, which include the number of samples (N) and the 5-number summary, are
found in the table below.
Descriptive Statistics for CS Crops FC (colonies/100ml)Tank GL 2ft GL 4ft
N 20 150 127
Minimum 90 4 4
1st Quartile 171750 4 4
Median 2.7E+06 75 4
3rd Quartile 9.1E+06 1400 91
Maximum 1.2E+08 300000 300000
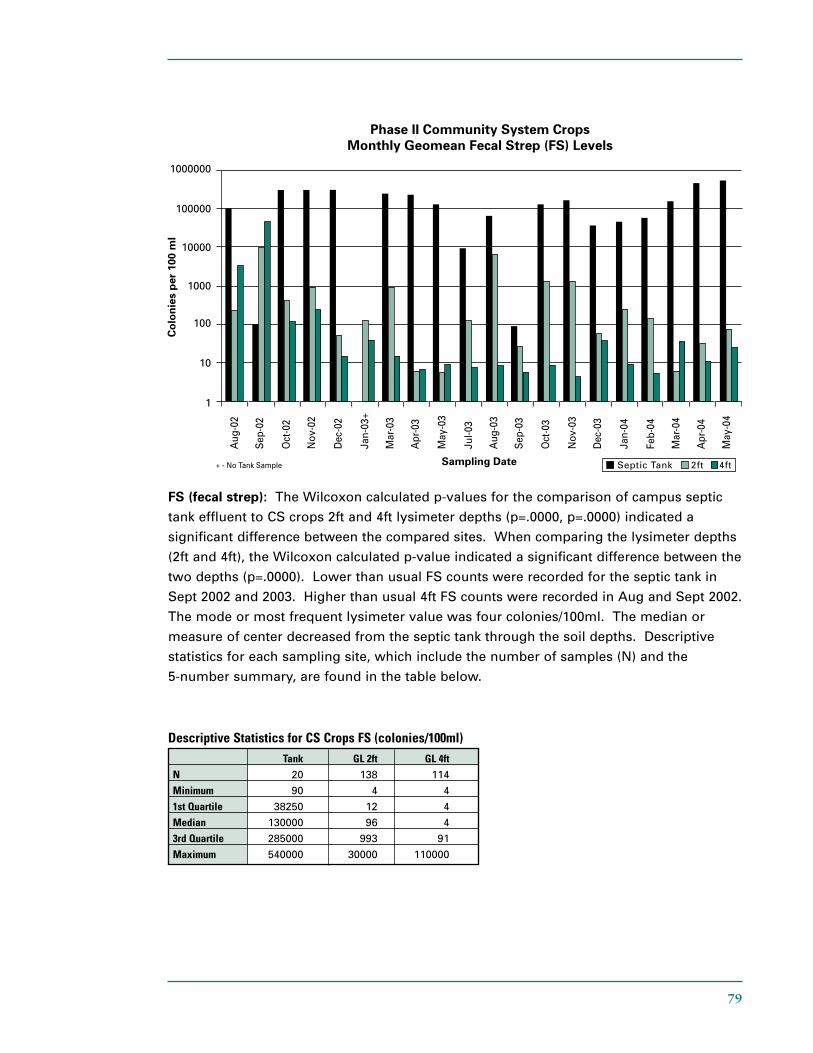
79
FS (fecal strep): The Wilcoxon calculated p-values for the comparison of campus septic
tank effluent to CS crops 2ft and 4ft lysimeter depths (p=.0000, p=.0000) indicated a
significant difference between the compared sites. When comparing the lysimeter depths
(2ft and 4ft), the Wilcoxon calculated p-value indicated a significant difference between the
two depths (p=.0000). Lower than usual FS counts were recorded for the septic tank in
Sept 2002 and 2003. Higher than usual 4ft FS counts were recorded in Aug and Sept 2002.
The mode or most frequent lysimeter value was four colonies/100ml. The median or
measure of center decreased from the septic tank through the soil depths. Descriptive
statistics for each sampling site, which include the number of samples (N) and the
5-number summary, are found in the table below.
Descriptive Statistics for CS Crops FS (colonies/100ml) Tank GL 2ft GL 4ft
N 20 138 114
Minimum 90 4 4
1st Quartile 38250 12 4
Median 130000 96 4
3rd Quartile 285000 993 91
Maximum 540000 30000 110000
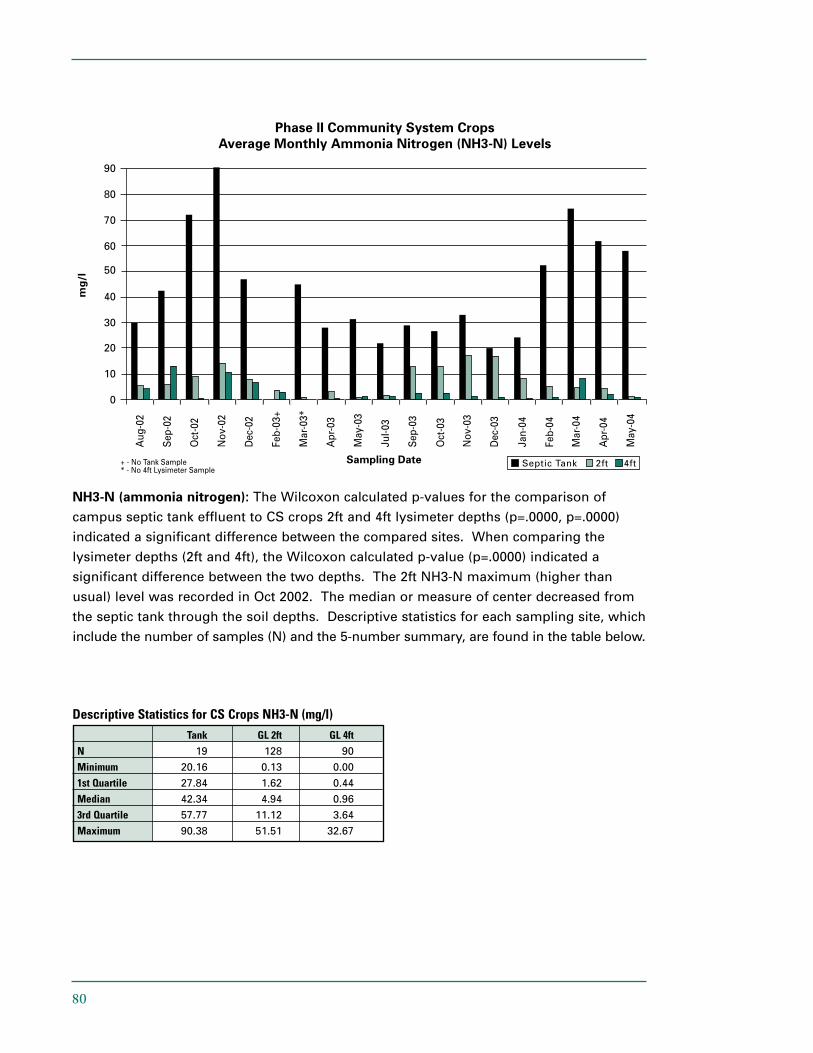
80
NH3-N (ammonia nitrogen): The Wilcoxon calculated p-values for the comparison of
campus septic tank effluent to CS crops 2ft and 4ft lysimeter depths (p=.0000, p=.0000)
indicated a significant difference between the compared sites. When comparing the
lysimeter depths (2ft and 4ft), the Wilcoxon calculated p-value (p=.0000) indicated a
significant difference between the two depths. The 2ft NH3-N maximum (higher than
usual) level was recorded in Oct 2002. The median or measure of center decreased from
the septic tank through the soil depths. Descriptive statistics for each sampling site, which
include the number of samples (N) and the 5-number summary, are found in the table below.
Descriptive Statistics for CS Crops NH3-N (mg/l)Tank GL 2ft GL 4ft
N 19 128 90
Minimum 20.16 0.13 0.00
1st Quartile 27.84 1.62 0.44
Median 42.34 4.94 0.96
3rd Quartile 57.77 11.12 3.64
Maximum 90.38 51.51 32.67
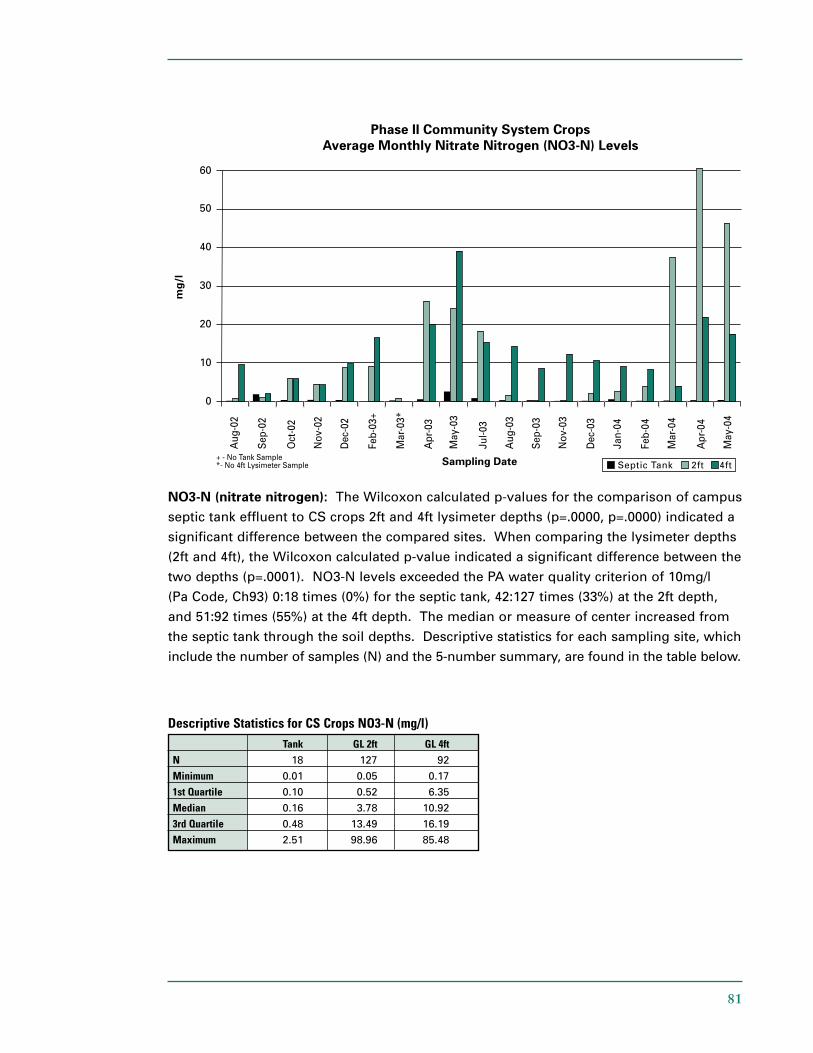
81
NO3-N (nitrate nitrogen): The Wilcoxon calculated p-values for the comparison of campus
septic tank effluent to CS crops 2ft and 4ft lysimeter depths (p=.0000, p=.0000) indicated a
significant difference between the compared sites. When comparing the lysimeter depths
(2ft and 4ft), the Wilcoxon calculated p-value indicated a significant difference between the
two depths (p=.0001). NO3-N levels exceeded the PA water quality criterion of 10mg/l
(Pa Code, Ch93) 0:18 times (0%) for the septic tank, 42:127 times (33%) at the 2ft depth,
and 51:92 times (55%) at the 4ft depth. The median or measure of center increased from
the septic tank through the soil depths. Descriptive statistics for each sampling site, which
include the number of samples (N) and the 5-number summary, are found in the table below.
Descriptive Statistics for CS Crops NO3-N (mg/l) Tank GL 2ft GL 4ft
N 18 127 92
Minimum 0.01 0.05 0.17
1st Quartile 0.10 0.52 6.35
Median 0.16 3.78 10.92
3rd Quartile 0.48 13.49 16.19
Maximum 2.51 98.96 85.48
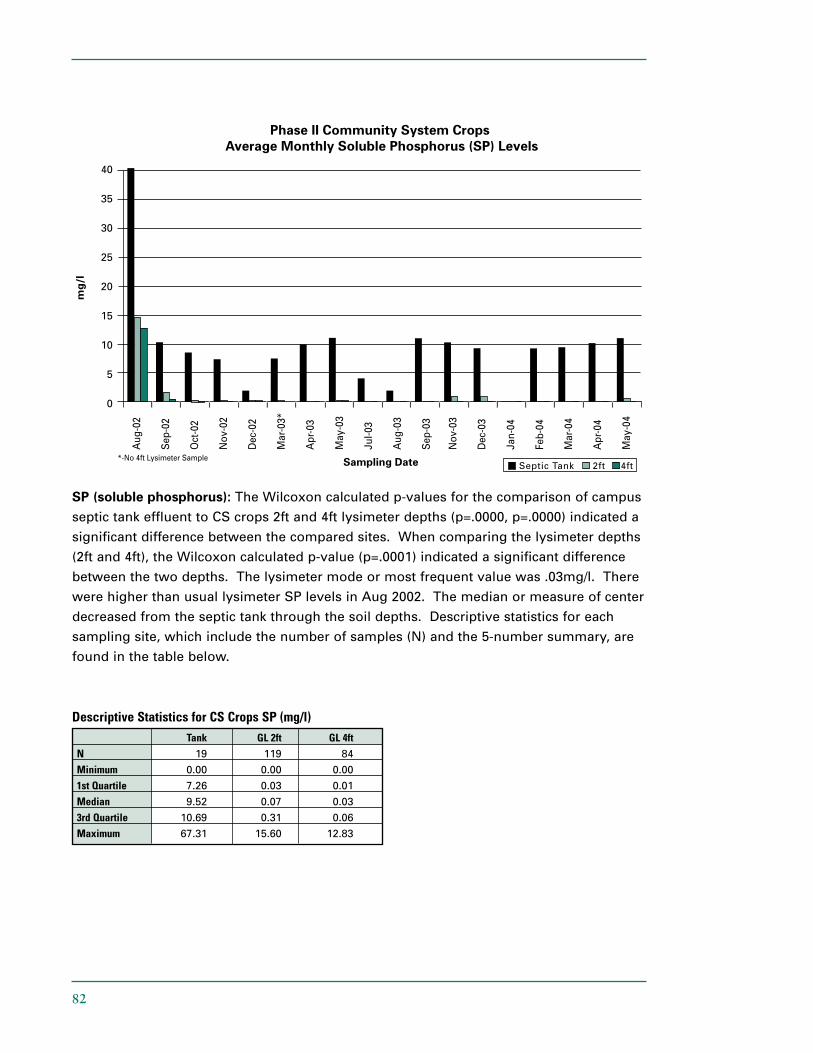
82
SP (soluble phosphorus): The Wilcoxon calculated p-values for the comparison of campus
septic tank effluent to CS crops 2ft and 4ft lysimeter depths (p=.0000, p=.0000) indicated a
significant difference between the compared sites. When comparing the lysimeter depths
(2ft and 4ft), the Wilcoxon calculated p-value (p=.0001) indicated a significant difference
between the two depths. The lysimeter mode or most frequent value was .03mg/l. There
were higher than usual lysimeter SP levels in Aug 2002. The median or measure of center
decreased from the septic tank through the soil depths. Descriptive statistics for each
sampling site, which include the number of samples (N) and the 5-number summary, are
found in the table below.
Descriptive Statistics for CS Crops SP (mg/l)Tank GL 2ft GL 4ft
N 19 119 84
Minimum 0.00 0.00 0.00
1st Quartile 7.26 0.03 0.01
Median 9.52 0.07 0.03
3rd Quartile 10.69 0.31 0.06
Maximum 67.31 15.60 12.83
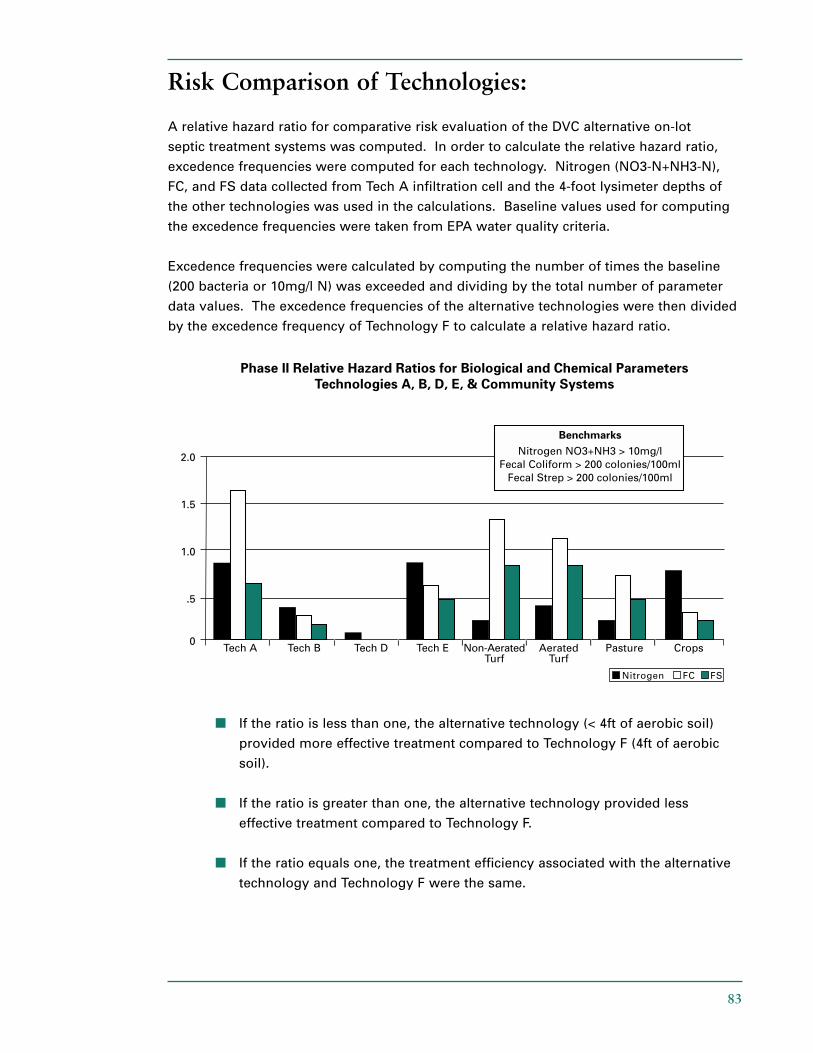
83
Risk Comparison of Technologies:
A relative hazard ratio for comparative risk evaluation of the DVC alternative on-lot
septic treatment systems was computed. In order to calculate the relative hazard ratio,
excedence frequencies were computed for each technology. Nitrogen (NO3-N+NH3-N),
FC, and FS data collected from Tech A infiltration cell and the 4-foot lysimeter depths of
the other technologies was used in the calculations. Baseline values used for computing
the excedence frequencies were taken from EPA water quality criteria.
Excedence frequencies were calculated by computing the number of times the baseline
(200 bacteria or 10mg/l N) was exceeded and dividing by the total number of parameter
data values. The excedence frequencies of the alternative technologies were then divided
by the excedence frequency of Technology F to calculate a relative hazard ratio.
■ If the ratio is less than one, the alternative technology (< 4ft of aerobic soil)
provided more effective treatment compared to Technology F (4ft of aerobic
soil).
■ If the ratio is greater than one, the alternative technology provided less
effective treatment compared to Technology F.
■ If the ratio equals one, the treatment efficiency associated with the alternative
technology and Technology F were the same.

Blank