Embed Size (px)
Citation preview
Let’s Talk About Support Tools
QRadar SIEM
Daniel BarriaultQRadar Support Squad LeadIBM [email protected]
Joel LevesqueQRadar Core Support ArchitectIBM [email protected]
Jonathan PechtaQRadar Support Content LeadIBM [email protected]
December 4, 2019
IBM Security / © 2019 IBM Corporation 2
• QRadar V7.3.3 is available on IBM Fix Central.
• WinCollect 7.2.9 Patch 1 is available on IBM Fix Central.
Announcements
Let’s Talk About Support Tools
Standard Support Tools 04get_logs.sh - About 05get_logs.sh – options 07all_servers.sh 09deployment_info.sh 10partitionDiagnostic 11partitionDiagnostic – options 12ha_diagnosis 13ha_diagnosis – options 15iteam_support.sh 16mod_log4j 17WinCollectHealthCheck.sh 19DrQ and Cliniq 21collectGvStats.sh 22Recon – application status 23Common System Notifications 25Support Tools 101 30
IBM Security / © 2019 IBM Corporation 3
Standard Support Tools
IBM Security / © 2019 IBM Corporation 4
• get_logs.sh• all_servers.sh• deployment_info.sh• partitionDiagnostic• ha_diagnosis.sh• iteam_support.sh• mod_log4j.pl• WinCollectHealthCheck.sh• collectGvStats.sh• cliniq (and DrQ)• recon
All standard support tools are available in /opt/qradar/support/. The weekly auto update (WAU) is responsible for updating support tools globally for QRadar (supportability-tools.rpm).
IBM Security / © 2019 IBM Corporation 5
get_logs.sh - About
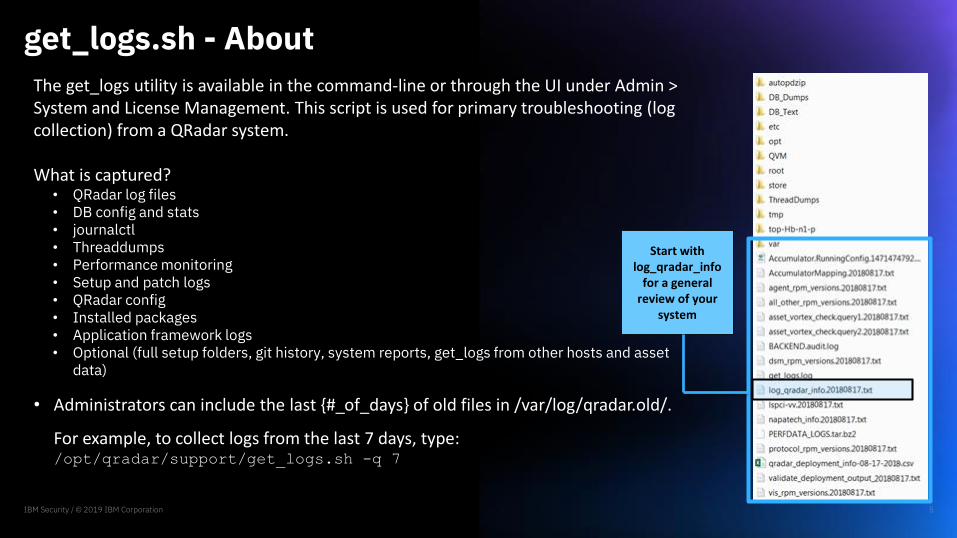
The get_logs utility is available in the command-line or through the UI under Admin > System and License Management. This script is used for primary troubleshooting (log collection) from a QRadar system.
What is captured?• QRadar log files• DB config and stats• journalctl• Threaddumps• Performance monitoring• Setup and patch logs• QRadar config• Installed packages• Application framework logs• Optional (full setup folders, git history, system reports, get_logs from other hosts and asset
data)
• Administrators can include the last {#_of_days} of old files in /var/log/qradar.old/.
For example, to collect logs from the last 7 days, type: /opt/qradar/support/get_logs.sh -q 7
Start with log_qradar_info
for a general review of your
system
IBM Security / © 2019 IBM Corporation 6
get_logs.sh – About (continued)
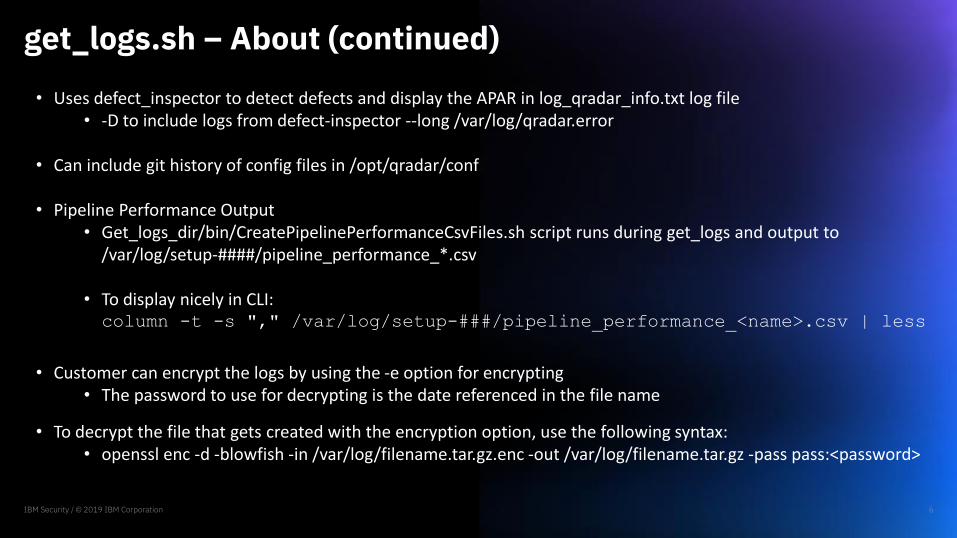
• Uses defect_inspector to detect defects and display the APAR in log_qradar_info.txt log file• -D to include logs from defect-inspector --long /var/log/qradar.error
• Can include git history of config files in /opt/qradar/conf
• Pipeline Performance Output• Get_logs_dir/bin/CreatePipelinePerformanceCsvFiles.sh script runs during get_logs and output to
/var/log/setup-####/pipeline_performance_*.csv
• To display nicely in CLI:column -t -s "," /var/log/setup-###/pipeline_performance_<name>.csv | less
• Customer can encrypt the logs by using the -e option for encrypting• The password to use for decrypting is the date referenced in the file name
• To decrypt the file that gets created with the encryption option, use the following syntax:• openssl enc -d -blowfish -in /var/log/filename.tar.gz.enc -out /var/log/filename.tar.gz -pass pass:<password>
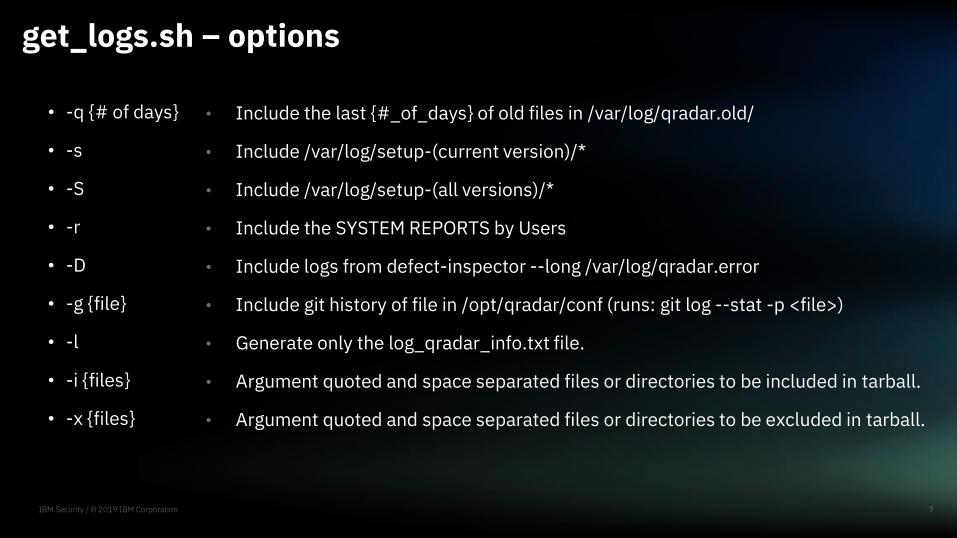
• Include the last {#_of_days} of old files in /var/log/qradar.old/
• Include /var/log/setup-(current version)/*
• Include /var/log/setup-(all versions)/*
• Include the SYSTEM REPORTS by Users
• Include logs from defect-inspector --long /var/log/qradar.error
• Include git history of file in /opt/qradar/conf (runs: git log --stat -p <file>)
• Generate only the log_qradar_info.txt file.
• Argument quoted and space separated files or directories to be included in tarball.
• Argument quoted and space separated files or directories to be excluded in tarball.
get_logs.sh – options
7
• -q {# of days}
• -s
• -S
• -r
• -D
• -g {file}
• -l
• -i {files}
• -x {files}
IBM Security / © 2019 IBM Corporation

• Requires an argument of quoted and comma separated IPs or hostnames. Will collect logs from the hosts and store them in ./GETLOGS_YYYYMMDD. Always includes the console.
• Encrypt the resulting tarball
• Display revision information
• Collect additional asset information and db tables
• Displays this dialog
get_logs.sh – options list (continued)
8
-H {hosts}
-e
-v
-t
-h,--help
IBM Security / © 2019 IBM Corporation

all_servers.sh
9
• A deployment aware CLI tool for information gathering and command execution on MHs.
• Can be used to copy files, running a command on multiple hosts or viewing deployment information.
• Must be executed from the console.
• This is a very powerful tool but can also cause system downtime if not used properly.
• Filter on appliance type, ip address, hostname
• Useful for:- Staging patches on all hosts:
/opt/qradar/support/all_servers.sh -Ckp /storetmp/731_QRadar-7.3.1.20171206222136.sfs
- Operational queries (storage space, load, installed versions, et cetera)/opt/qradar/support/all_servers.sh -Ck df –Th
/opt/qradar/support/all_servers.sh -Ck "umount /media/updates"
- Getting files from all hosts/opt/qradar/support/all_servers.sh -Ckg /var/log/qradar.error
IBM Security / © 2019 IBM Corporation
deployment_info.sh
IBM Security / © 2019 IBM Corporation 10
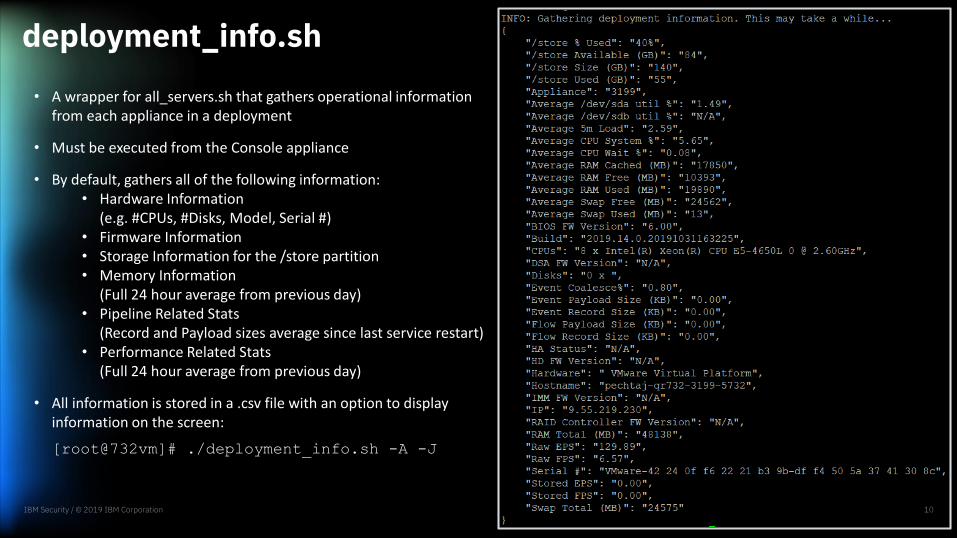
• A wrapper for all_servers.sh that gathers operational information from each appliance in a deployment
• Must be executed from the Console appliance
• By default, gathers all of the following information:• Hardware Information
(e.g. #CPUs, #Disks, Model, Serial #)• Firmware Information• Storage Information for the /store partition• Memory Information
(Full 24 hour average from previous day)• Pipeline Related Stats
(Record and Payload sizes average since last service restart)• Performance Related Stats
(Full 24 hour average from previous day)
• All information is stored in a .csv file with an option to display information on the screen:
[root@732vm]# ./deployment_info.sh -A -J

IBM Security / © 2019 IBM Corporation 11
partitionDiagnostic
• This partitionDiagnostic tool is designed to clean up unused event collection service (ecs-ec and ecs-ec-ingress) versions and free up partition space
• In addition, moves /opt/qradar/dca (scaserver) to /store by creating a symlink
• It is strongly recommended that this script first be run with -n to highlight changes, and then -s to backup and remove the services. This is safest procedure.
• The -d deletes without making backups of the services.
• When running with the -s parameter, the services are backed up under /store/support/ directory
• Future feature will scan partitions for large unused files
[root@SupportLAB]# opt/qradar/support/partitionDiagnostic -n
2019/01/23 10:07:31 -------- ecs-ec --------
2019/01/23 10:07:33 Not loading "rhnplugin" plugin, as it is disabled
Loading "product-id" plugin
Loading "search-disabled-repos" plugin
Loading "subscription-manager" plugin
Updating Subscription Management repositories.
Unable to read consumer identity
This system is not registered with an entitlement server. You can use
subscription-manager to register.
Config time: 0.123
Yum version: 3.4.3
rpmdb time: 0.000
Resolving Dependencies
--> Running transaction check
---> Package ecs-ec-0.0.804.noarch 0:0.0.804-1 will be erased
Checking deps for ecs-ec-0.0.804.noarch 0:0.0.804-1 - e
--> Finished Dependency Resolution
Dependency Process ending
Depsolve time: 1.311
Dependencies Resolved
================================================================================
Package Arch Version Repository Size
================================================================================
Removing:
ecs-ec-0.0.804 noarch 0.0.804-1 @local 149 M
Transaction Summary
================================================================================
Remove 1 Package
Installed size: 149 M
Exiting on user command
2019/01/23 10:07:39 Moving: /opt/qradar/dca/ To: /store/dca/ & Creating a
symlink
2019/01/23 10:07:39 Services that will be shutdown: scaserver

IBM Security / © 2019 IBM Corporation 12
partitionDiagnostic - Options
Don't actually remove anything, just show what would be done.
Delete the files and folders
Scan partition for large unused files :: future feature not available yet (default "/opt/")
Backup all the Files and Folders, before the deletion, will fail if the backups do NOT complete
Help for partitionDiagnostic
• -n, --dry-run
• -d, --delete
• -p, --dir string
• -s, --save-delete
• -h, --help
ha_diagnosis.sh
IBM Security / © 2019 IBM Corporation 13
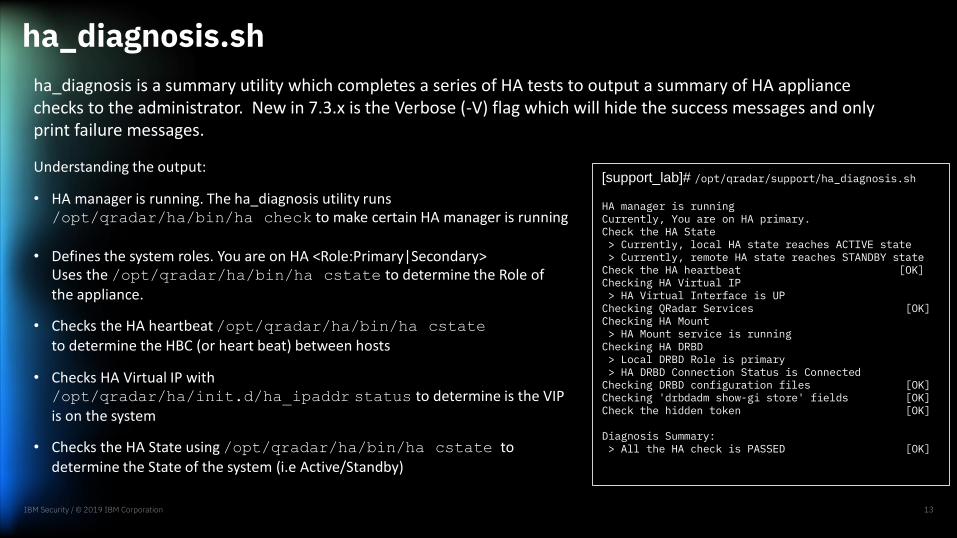
Understanding the output:
• HA manager is running. The ha_diagnosis utility runs/opt/qradar/ha/bin/ha check to make certain HA manager is running
• Defines the system roles. You are on HA <Role:Primary|Secondary>Uses the /opt/qradar/ha/bin/ha cstate to determine the Role of the appliance.
• Checks the HA heartbeat /opt/qradar/ha/bin/ha cstate
to determine the HBC (or heart beat) between hosts
• Checks HA Virtual IP with /opt/qradar/ha/init.d/ha_ipaddr status to determine is the VIP is on the system
• Checks the HA State using /opt/qradar/ha/bin/ha cstate to determine the State of the system (i.e Active/Standby)
[support_lab]# /opt/qradar/support/ha_diagnosis.sh
HA manager is runningCurrently, You are on HA primary.Check the HA State> Currently, local HA state reaches ACTIVE state> Currently, remote HA state reaches STANDBY stateCheck the HA heartbeat [OK]Checking HA Virtual IP> HA Virtual Interface is UPChecking QRadar Services [OK]Checking HA Mount> HA Mount service is runningChecking HA DRBD> Local DRBD Role is primary> HA DRBD Connection Status is ConnectedChecking DRBD configuration files [OK]Checking 'drbdadm show-gi store' fields [OK]Check the hidden token [OK]
Diagnosis Summary:> All the HA check is PASSED [OK]
ha_diagnosis is a summary utility which completes a series of HA tests to output a summary of HA appliance checks to the administrator. New in 7.3.x is the Verbose (-V) flag which will hide the success messages and only print failure messages.

ha_diagnosis.sh (continued)
IBM Security / © 2019 IBM Corporation 14
• Checking QRadar Services• Checks the status of services (hostservices, hostcontext, tomcat (where applicable))
• Checking HA Mount• /opt/qradar/ha/init.d/ha_mount status to see if the proper HA filesystems are mounted
• Checking HA DRBD (This section does a lot. Looks for split brain scenarios, etc…)• /opt/qradar/ha/init.d/ha_drbd status to determine sync role• cat /proc/drbd to determine connection state (cs)
• Checking DRBD configuration files• diffs the drbd.conf files between local and remote hosts• Looks for keyboards in the config files to make certain the file hasn't been truncated
• Checking 'drbdadm show-gi store' fields• Runs drbdadm show-gi store to check data consistency and status
• Check the hidden token• Looks for hidden files in /opt/qradar/ha for failures in patching or HA in general
• Checking HA Gluster Filesystem Status• Check to make certain the glusterd daemon is running and the peer is connected
ha_diagnosis.sh - options
IBM Security / © 2019 IBM Corporation 15
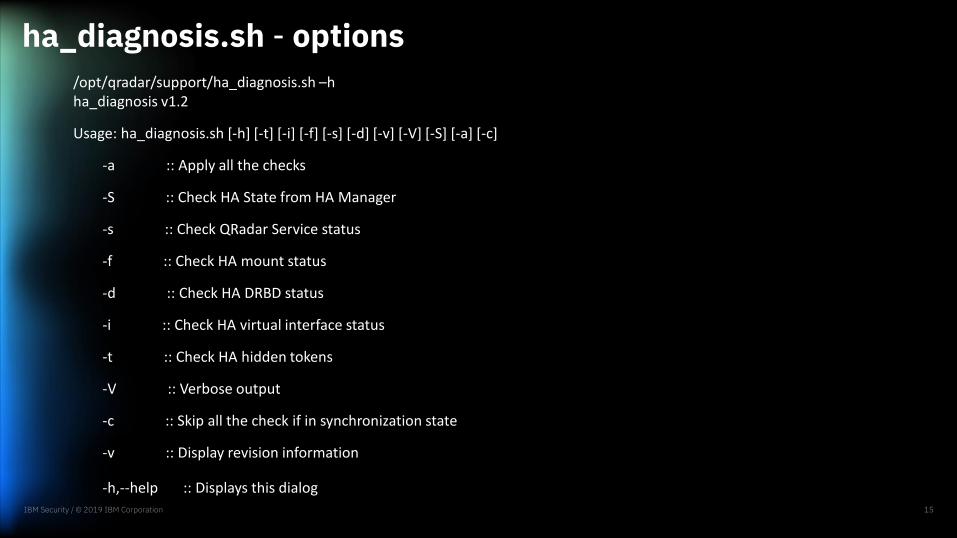
/opt/qradar/support/ha_diagnosis.sh –hha_diagnosis v1.2
Usage: ha_diagnosis.sh [-h] [-t] [-i] [-f] [-s] [-d] [-v] [-V] [-S] [-a] [-c]
-a :: Apply all the checks
-S :: Check HA State from HA Manager
-s :: Check QRadar Service status
-f :: Check HA mount status
-d :: Check HA DRBD status
-i :: Check HA virtual interface status
-t :: Check HA hidden tokens
-V :: Verbose output
-c :: Skip all the check if in synchronization state
-v :: Display revision information
-h,--help :: Displays this dialog
IBM Security / © 2019 IBM Corporation 16
iteam_support.sh
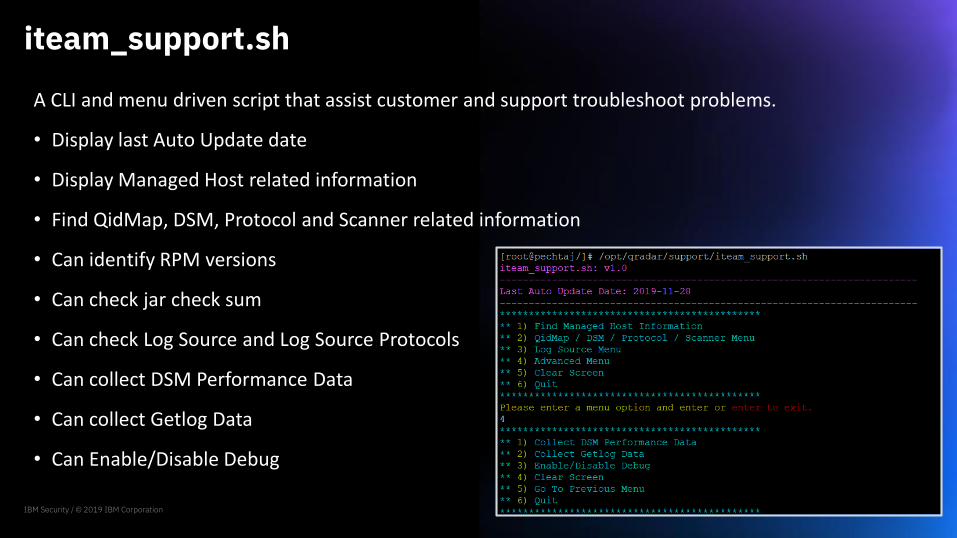
A CLI and menu driven script that assist customer and support troubleshoot problems.
• Display last Auto Update date
• Display Managed Host related information
• Find QidMap, DSM, Protocol and Scanner related information
• Can identify RPM versions
• Can check jar check sum
• Can check Log Source and Log Source Protocols
• Can collect DSM Performance Data
• Can collect Getlog Data
• Can Enable/Disable Debug
mod_log4j.pl
IBM Security / © 2019 IBM Corporation 17
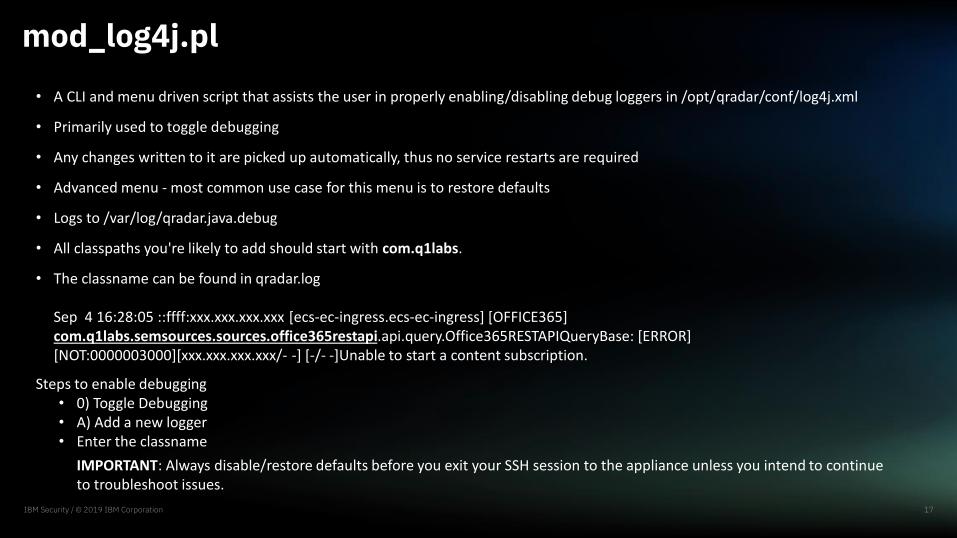
• A CLI and menu driven script that assists the user in properly enabling/disabling debug loggers in /opt/qradar/conf/log4j.xml
• Primarily used to toggle debugging
• Any changes written to it are picked up automatically, thus no service restarts are required
• Advanced menu - most common use case for this menu is to restore defaults
• Logs to /var/log/qradar.java.debug
• All classpaths you're likely to add should start with com.q1labs.
• The classname can be found in qradar.log
Sep 4 16:28:05 ::ffff:xxx.xxx.xxx.xxx [ecs-ec-ingress.ecs-ec-ingress] [OFFICE365] com.q1labs.semsources.sources.office365restapi.api.query.Office365RESTAPIQueryBase: [ERROR] [NOT:0000003000][xxx.xxx.xxx.xxx/- -] [-/- -]Unable to start a content subscription.
Steps to enable debugging• 0) Toggle Debugging• A) Add a new logger• Enter the classname
IMPORTANT: Always disable/restore defaults before you exit your SSH session to the appliance unless you intend to continue to troubleshoot issues.

mod_log4j.pl (continued)
IBM Security / © 2019 IBM Corporation 18
Useful class paths list:com.q1labs.vis.scanners.eEye [Retina eEye scanners]com.q1labs.semsources.sources.estreamer [Sourcefire/Firesight]com.q1labs.vis.scanners.qualys [Qualys Vulnerability Scanners]com.q1labs.vis.scanners.mcafee.vulnerabilitymanager [McAfee Vulnerability Manager]com.q1labs.core.shared.ldap [LDAP]com.q1labs.semsources.sources.jdbccom.q1labs.uiframeworks.auth [Authentication] com.q1labs.semsources.sources.windowseventlogcom.q1labs.configservices.capabilities.AddHostcom.q1labs.semsources.cre com.q1labs.hostcontext.backupcom.q1labs.semsources.sources.remote [FTP & SFTP remote connections]com.q1labs.ariel.ui.UIArielServices [Useful for Dashboard issues]com.q1labs.semsources.sources.jdbc com.q1labs.semsources.sources.jdbc.JdbcEventConnectorcom.q1labs.frameworks.crypto.Q1X509TrustManagercom.q1labs.semsources.sources.LEAcom.q1labs.vis.scanners.ip360com.q1labs.cve.resultsetcom.q1labs.reporting.charts com.q1labs.reporting.ReportServices com.q1labs.sem.semsources.wincollectconfigserver

IBM Security / © 2019 IBM Corporation 19
WinCollectHealthCheck.sh
This script run through a series of tests to help reduce support times by automating basic checks, identifying common problems, and facilitating the extraction of data. Understanding the output:
• Last Heartbeat Test (Agent Heartbeats)• Test will fail if heart beats are older than 30 mins, are not
there or agents are not deployed
• Version Test (Agent versions information, NOTE: 7.2.9 agents fail due to a logged issue)
• Log Source Test (Log Source Heartbeats) - Passes when all log sources have reported in the last 720 minutes
• Status Test (Agent Status: Not Communicating, Running, Stopped, Unavailable)
• Will only pass if all agents are running, and no agent is Dirty
• RPM Test (Currently passes only for 7.2.8 RPM files)• Compares the RPM files to the names of the required files
for each version
• Type YES at the end of the utility to view a table of agents that failed test conditions.

IBM Security / © 2019 IBM Corporation 20
WinCollectHealthCheck.sh (continued)
Within this tool, tuning tests can also be run to see if the WinCollect deployment is within supported tuning parameters.
• Tuning Test (-t option, can take a few minutes depending on the size of the deployment)• Checks that the managed hosts have less than 500 agents each• Checks that each agent does not have more than 500 log sources• Checks that the polling channels divided by their respective polling interval is below 30• Checks that there are no more than 30 Xpath queries (2 per agents)• For this test to pass all elements of the tuning must be within the supported range
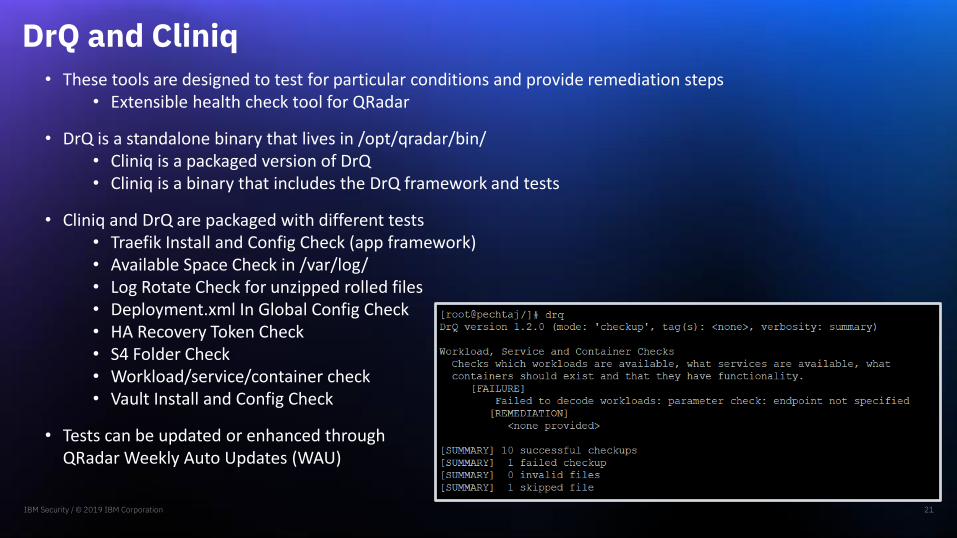
• These tools are designed to test for particular conditions and provide remediation steps• Extensible health check tool for QRadar
• DrQ is a standalone binary that lives in /opt/qradar/bin/• Cliniq is a packaged version of DrQ• Cliniq is a binary that includes the DrQ framework and tests
• Cliniq and DrQ are packaged with different tests• Traefik Install and Config Check (app framework)• Available Space Check in /var/log/• Log Rotate Check for unzipped rolled files• Deployment.xml In Global Config Check• HA Recovery Token Check• S4 Folder Check• Workload/service/container check• Vault Install and Config Check
• Tests can be updated or enhanced through QRadar Weekly Auto Updates (WAU)
DrQ and Cliniq
IBM Security / © 2019 IBM Corporation 21
IBM Security / © 2019 IBM Corporation 22
collectGvStats.sh• Useful to troubleshooting accumulated data issue, used by reports and time series graphs
• Enables you to get the timing on Event Processors to help identify which global view is falling behind
• Accumulator runs every 60 seconds• Total amount of time to load all GVs must be less than 60 seconds
• Accumulator rollup runs every hour and every morning (HOURLY and DAILY rollups)
• GVs can get expensive when large number of 'unique values' in the GV or search is not optimized• No filters - <criteria>• Payload searches
• When to use the utility (the customer may see the following system notifications)• "The accumulator was unable to aggregate all events or flows for this interval."• "The accumulator has fallen behind. See Aggregated Data Management for details."• "Interval processing time (XX seconds) exceeded threshold (60 seconds)"
• Most common switches are -c, -s and –M• -c prints the accumulator's running config to a file• -s option to print the Stats Report. This includes timings for all global views in the last interval.• -M option to view all GV ids, saved search and report title
IBM Security / © 2019 IBM Corporation 23
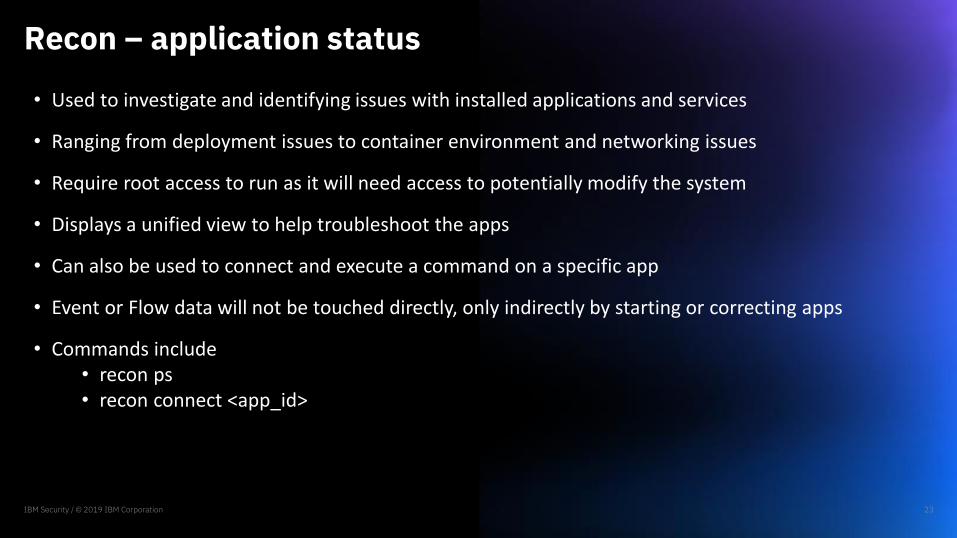
Recon – application status
• Used to investigate and identifying issues with installed applications and services
• Ranging from deployment issues to container environment and networking issues
• Require root access to run as it will need access to potentially modify the system
• Displays a unified view to help troubleshoot the apps
• Can also be used to connect and execute a command on a specific app
• Event or Flow data will not be touched directly, only indirectly by starting or correcting apps
• Commands include• recon ps• recon connect <app_id>
IBM Security / © 2019 IBM Corporation 24
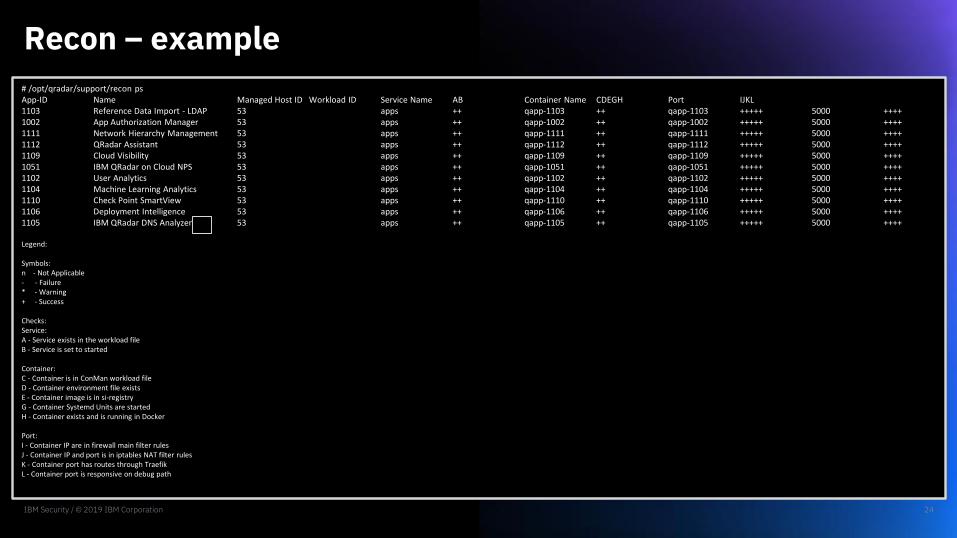
Recon – example
# /opt/qradar/support/recon psApp-ID Name Managed Host ID Workload ID Service Name AB Container Name CDEGH Port IJKL1103 Reference Data Import - LDAP 53 apps ++ qapp-1103 ++ qapp-1103 +++++ 5000 ++++1002 App Authorization Manager 53 apps ++ qapp-1002 ++ qapp-1002 +++++ 5000 ++++1111 Network Hierarchy Management 53 apps ++ qapp-1111 ++ qapp-1111 +++++ 5000 ++++1112 QRadar Assistant 53 apps ++ qapp-1112 ++ qapp-1112 +++++ 5000 ++++1109 Cloud Visibility 53 apps ++ qapp-1109 ++ qapp-1109 +++++ 5000 ++++1051 IBM QRadar on Cloud NPS 53 apps ++ qapp-1051 ++ qapp-1051 +++++ 5000 ++++1102 User Analytics 53 apps ++ qapp-1102 ++ qapp-1102 +++++ 5000 ++++1104 Machine Learning Analytics 53 apps ++ qapp-1104 ++ qapp-1104 +++++ 5000 ++++1110 Check Point SmartView 53 apps ++ qapp-1110 ++ qapp-1110 +++++ 5000 ++++1106 Deployment Intelligence 53 apps ++ qapp-1106 ++ qapp-1106 +++++ 5000 ++++1105 IBM QRadar DNS Analyzer 53 apps ++ qapp-1105 ++ qapp-1105 +++++ 5000 ++++
Legend:
Symbols:n - Not Applicable- - Failure* - Warning+ - Success
Checks:Service:A - Service exists in the workload fileB - Service is set to started
Container:C - Container is in ConMan workload fileD - Container environment file existsE - Container image is in si-registryG - Container Systemd Units are startedH - Container exists and is running in Docker
Port:I - Container IP are in firewall main filter rulesJ - Container IP and port is in iptables NAT filter rulesK - Container port has routes through TraefikL - Container port is responsive on debug path

QRadar Common System Notifications
IBM Security / © 2019 IBM Corporation 25
• Accumulator is falling behind
• Disk Usage System Notification
• Active high-availability (HA) system failure
IBM Security / © 2019 IBM Corporation 26
Accumulator is falling behind
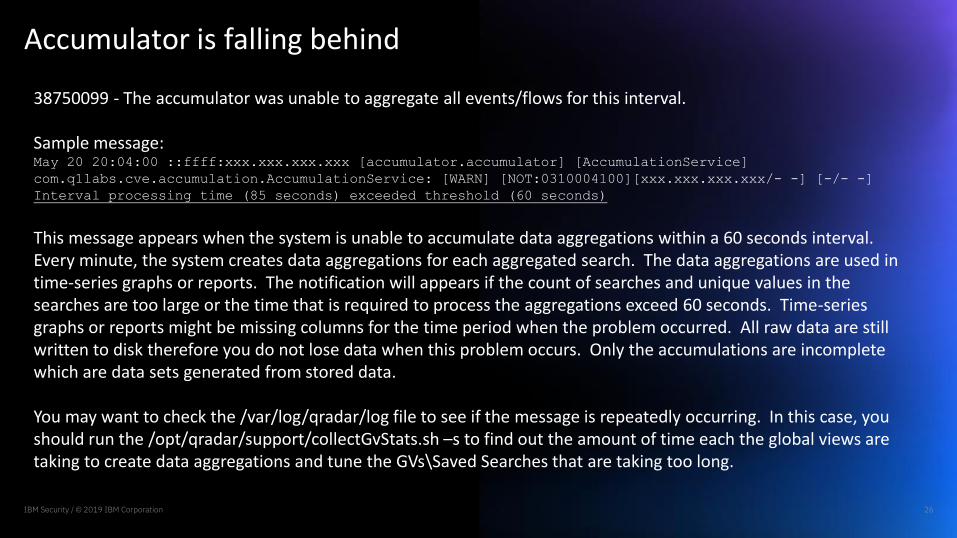
38750099 - The accumulator was unable to aggregate all events/flows for this interval.
Sample message:May 20 20:04:00 ::ffff:xxx.xxx.xxx.xxx [accumulator.accumulator] [AccumulationService]
com.q1labs.cve.accumulation.AccumulationService: [WARN] [NOT:0310004100][xxx.xxx.xxx.xxx/- -] [-/- -]
Interval processing time (85 seconds) exceeded threshold (60 seconds)
This message appears when the system is unable to accumulate data aggregations within a 60 seconds interval. Every minute, the system creates data aggregations for each aggregated search. The data aggregations are used in time-series graphs or reports. The notification will appears if the count of searches and unique values in the searches are too large or the time that is required to process the aggregations exceed 60 seconds. Time-series graphs or reports might be missing columns for the time period when the problem occurred. All raw data are still written to disk therefore you do not lose data when this problem occurs. Only the accumulations are incomplete which are data sets generated from stored data.
You may want to check the /var/log/qradar/log file to see if the message is repeatedly occurring. In this case, you should run the /opt/qradar/support/collectGvStats.sh –s to find out the amount of time each the global views are taking to create data aggregations and tune the GVs\Saved Searches that are taking too long.
IBM Security / © 2019 IBM Corporation 27
Disk Usage System Notification
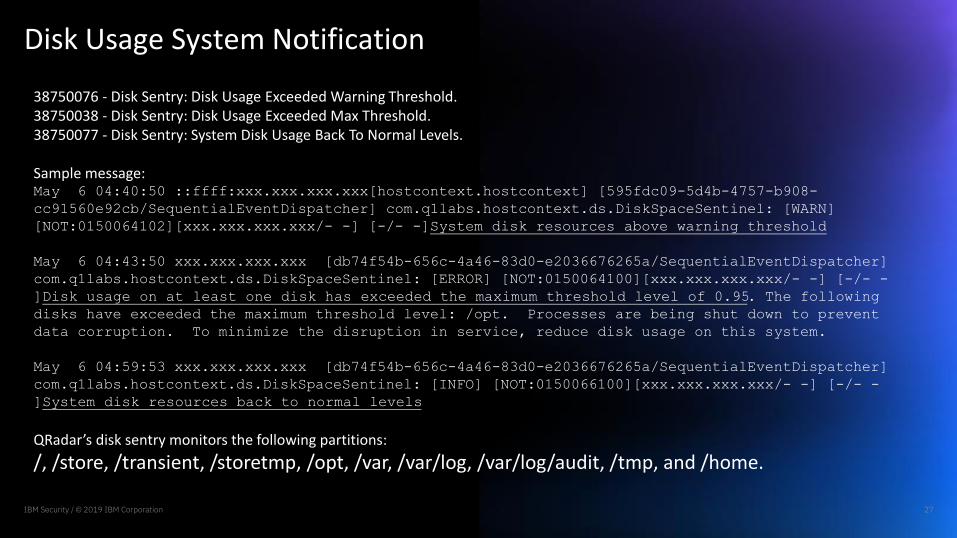
38750076 - Disk Sentry: Disk Usage Exceeded Warning Threshold.38750038 - Disk Sentry: Disk Usage Exceeded Max Threshold.38750077 - Disk Sentry: System Disk Usage Back To Normal Levels.
Sample message:May 6 04:40:50 ::ffff:xxx.xxx.xxx.xxx[hostcontext.hostcontext] [595fdc09-5d4b-4757-b908-
cc91560e92cb/SequentialEventDispatcher] com.q1labs.hostcontext.ds.DiskSpaceSentinel: [WARN]
[NOT:0150064102][xxx.xxx.xxx.xxx/- -] [-/- -]System disk resources above warning threshold
May 6 04:43:50 xxx.xxx.xxx.xxx [db74f54b-656c-4a46-83d0-e2036676265a/SequentialEventDispatcher]
com.q1labs.hostcontext.ds.DiskSpaceSentinel: [ERROR] [NOT:0150064100][xxx.xxx.xxx.xxx/- -] [-/- -
]Disk usage on at least one disk has exceeded the maximum threshold level of 0.95. The following
disks have exceeded the maximum threshold level: /opt. Processes are being shut down to prevent
data corruption. To minimize the disruption in service, reduce disk usage on this system.
May 6 04:59:53 xxx.xxx.xxx.xxx [db74f54b-656c-4a46-83d0-e2036676265a/SequentialEventDispatcher]
com.q1labs.hostcontext.ds.DiskSpaceSentinel: [INFO] [NOT:0150066100][xxx.xxx.xxx.xxx/- -] [-/- -
]System disk resources back to normal levels
QRadar’s disk sentry monitors the following partitions:
/, /store, /transient, /storetmp, /opt, /var, /var/log, /var/log/audit, /tmp, and /home.
IBM Security / © 2019 IBM Corporation 28
Disk Usage System Notification (Continued)
The first notification means that the disk usage on your system is greater than 90%. The operation of your QRadar system is not affected when the partition reaches this threshold.
The second notification means that the disk usage reaches 95% on any of the monitored partitions. QRadar data collection (ecs) and search processes (ariel) are shut down in order to protect the file system from reaching 100%. In this case, identify which partition is full and free some disk space by deleting files that are not needed or by changing your data retention policies.
The third notification means that the disk usage has returned back to below 90%. QRadarautomatically restarts data collection and search processes

IBM Security / © 2019 IBM Corporation 29
Active high-availability (HA) system failure
38750081 - Active HA System Failure
Sample Message:Mar 22 15:50:30 ::ffff:xxx.xxx.xxx.xxx [tomcat] [ServerHostServices_PersisterTimer]
com.q1labs.configservices.controller.IServerHostController: [INFO]
[NOT:0270004101][xxx.xxx.xxx.xxx/- -] [-/- -]Active system at xxx.xxx.xxx.xxx has failed.
Attempting fail over from xxx.xxx.xxx.xxx resources to xxx.xxx.xxx.xxx
This message appears when the active system cannot communicate with the standby system. This can be because the active system is unresponsive or failed. The standby system takes over operations from the failed active system.
In this case, you will want to inspect the active HA appliance to determine whether it is powered down or experienced a hardware failure. Otherwise you can run the /opt/qradar/support/ha_diagnosis.sh script on the failed system.
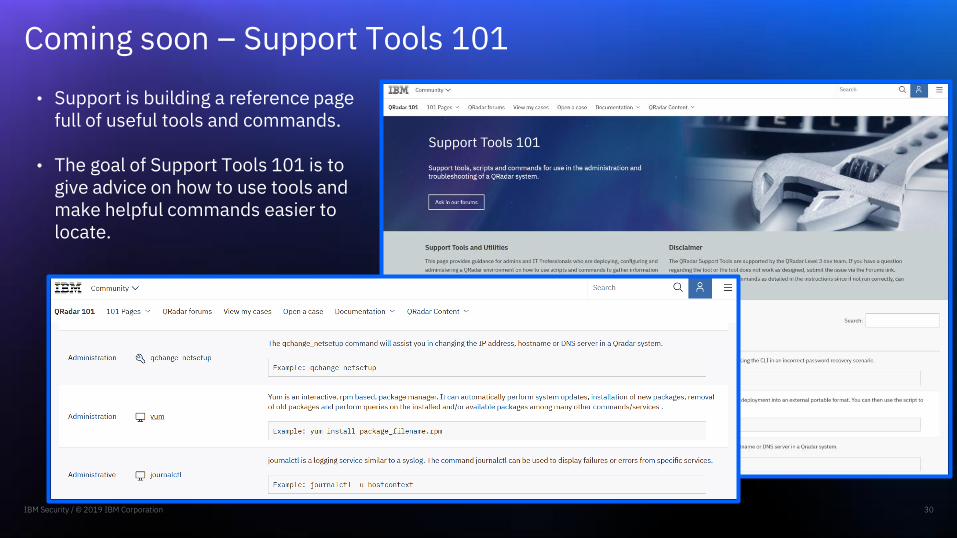
Coming soon – Support Tools 101
IBM Security / © 2019 IBM Corporation 30
• Support is building a reference page full of useful tools and commands.
• The goal of Support Tools 101 is to give advice on how to use tools and make helpful commands easier to locate.

Questions?
Ask in the Q&A panel

© Copyright IBM Corporation 2019. All rights reserved. The information contained in these materials is provided for informational purposes only, and is provided AS IS without warranty of any kind, express or implied. Any statement of direction represents IBM’s current intent, is subject to change or withdrawal, and represent only goals and objectives. IBM, the IBM logo, and other IBM products and services are trademarks of the International Business Machines Corporation, in the United States, other countries or both. Other company, product, or service names may be trademarks or service marks of others.
Statement of Good Security Practices: IT system security involves protecting systems and information through prevention, detection and response to improper access from within and outside your enterprise. Improper access can result in information being altered, destroyed, misappropriated or misused or can result in damage to or misuse of your systems, including for use in attacks on others. No IT system or product should be considered completely secure and no single product, service or security measure can be completely effective in preventing improper use or access. IBM systems, products and services are designed to be part of a lawful, comprehensive security approach, which will necessarily involve additional operational procedures, and may require other systems, products or services to be most effective. IBM does not warrant that any systems, products or services are immune from, or will make your enterprise immune from, the malicious or illegal conduct of any party.
Follow us on:
ibm.com/security
securityintelligence.com
ibm.com/security/community
xforce.ibmcloud.com
@ibmsecurity
youtube/user/ibmsecuritysolutions
Thank you