Embed Size (px)
Citation preview
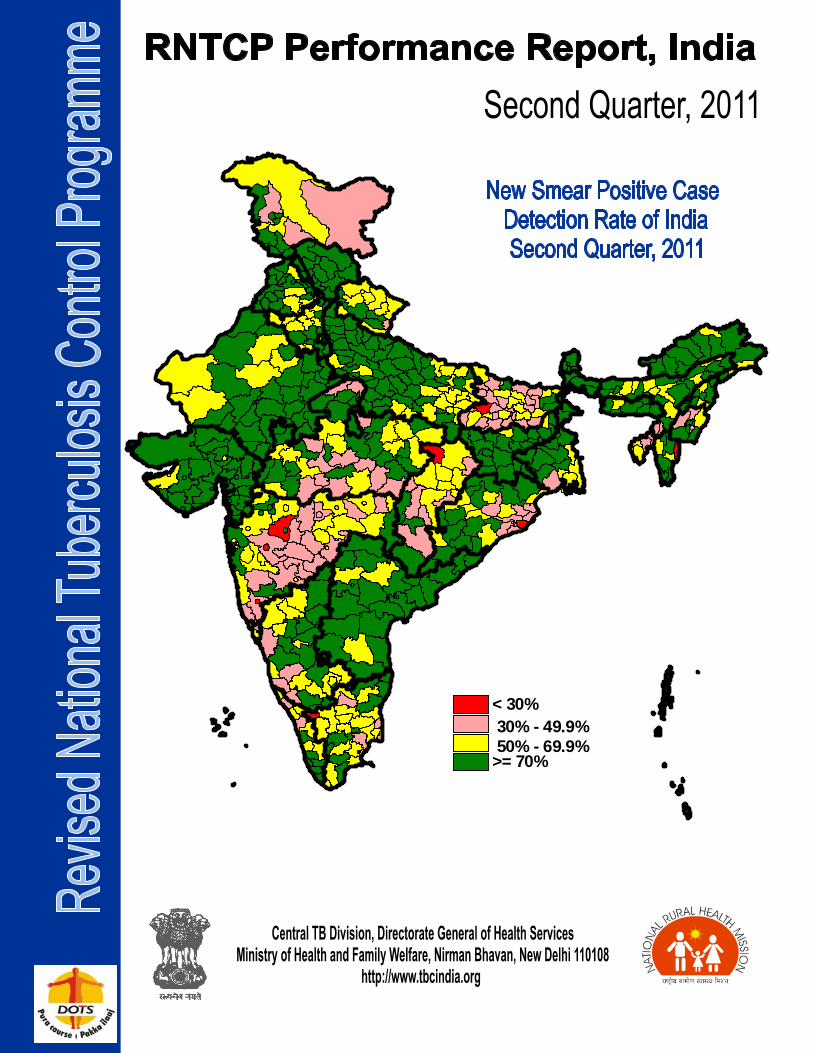
30% - 49.9%50% - 69.9%
>= 70%
< 30%
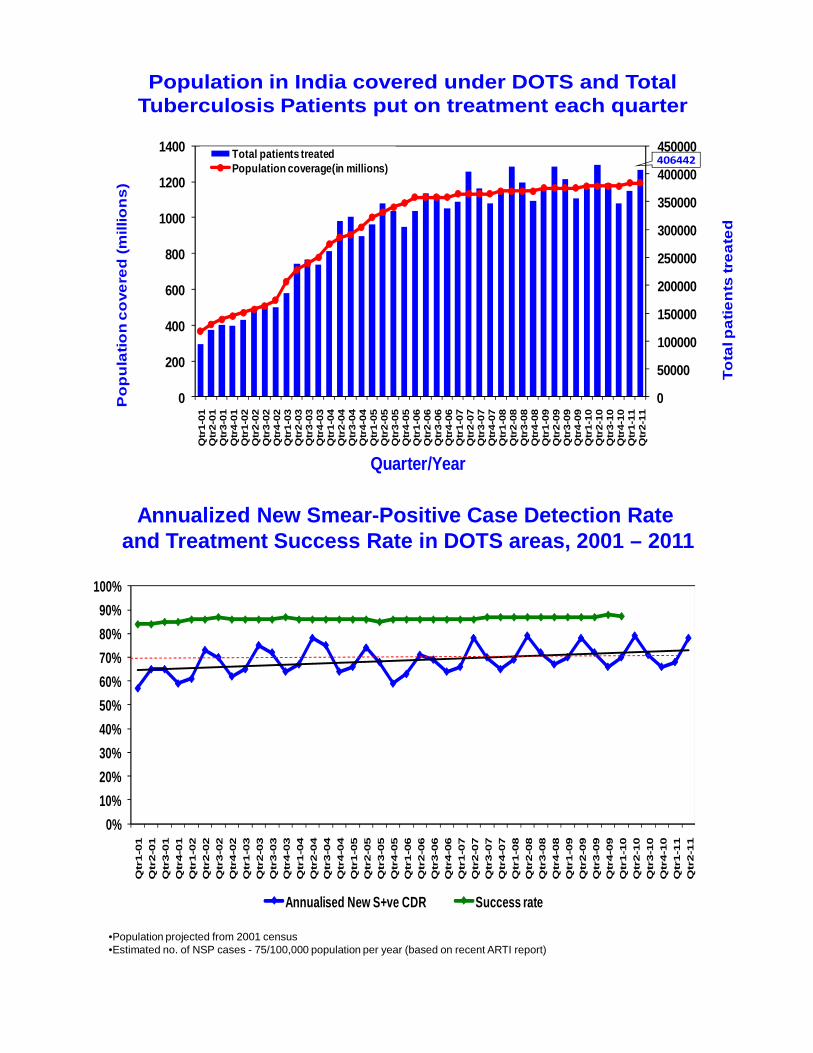
Population in India covered under DOTS and Total Tuberculosis Patients put on treatment each quarter
0
50000
100000
150000
200000
250000
300000
350000
400000
450000
0
200
400
600
800
1000
1200
1400
Qtr
1-01
Qtr
2-01
Qtr
3-01
Qtr
4-01
Qtr
1-02
Qtr
2-02
Qtr
3-02
Qtr
4-02
Qtr
1-03
Qtr
2-03
Qtr
3-03
Qtr
4-03
Qtr
1-04
Qtr
2-04
Qtr
3-04
Qtr
4-04
Qtr
1-05
Qtr
2-05
Qtr
3-05
Qtr
4-05
Qtr
1-06
Qtr
2-06
Qtr
3-06
Qtr
4-06
Qtr
1-07
Qtr
2-07
Qtr
3-07
Qtr
4-07
Qtr
1-08
Qtr
2-08
Qtr
3-08
Qtr
4-08
Qtr
1-09
Qtr
2-09
Qtr
3-09
Qtr
4-09
Qtr
1-10
Qtr
2-10
Qtr
3-10
Qtr
4-10
Qtr
1-11
Qtr
2-11
Tota
l pat
ien
ts tr
eate
d
Po
pu
latio
n c
ove
red
(mill
ion
s)
Quarter/Year
Total patients treatedPopulation coverage(in millions)
406442
Annualized New Smear-Positive Case Detection Rate and Treatment Success Rate in DOTS areas, 2001 – 2011
•Population projected from 2001 census•Estimated no. of NSP cases - 75/100,000 population per year (based on recent ARTI report)
0%10%20%30%40%50%60%70%80%90%
100%
Qtr
1-0
1Q
tr2-0
1Q
tr3-0
1Q
tr4-0
1Q
tr1-0
2Q
tr2-0
2Q
tr3-0
2Q
tr4-0
2Q
tr1-0
3Q
tr2-0
3Q
tr3-0
3Q
tr4-0
3Q
tr1-0
4Q
tr2-0
4Q
tr3-0
4Q
tr4-0
4Q
tr1-0
5Q
tr2-0
5Q
tr3-0
5Q
tr4-0
5Q
tr1-0
6Q
tr2-0
6Q
tr3-0
6Q
tr4-0
6Q
tr1-0
7Q
tr2-0
7Q
tr3-0
7Q
tr4-0
7Q
tr1-0
8Q
tr2-0
8Q
tr3-0
8Q
tr4-0
8Q
tr1-0
9Q
tr2-0
9Q
tr3-0
9Q
tr4-0
9Q
tr1-1
0Q
tr2-1
0Q
tr3-1
0Q
tr4-1
0Q
tr1-1
1Q
tr2-1
1
Annualised New S+ve CDR Success rate
Revised National Tuberculosis Control Programme, 2nd Quarter, 2011 Dear Colleagues,
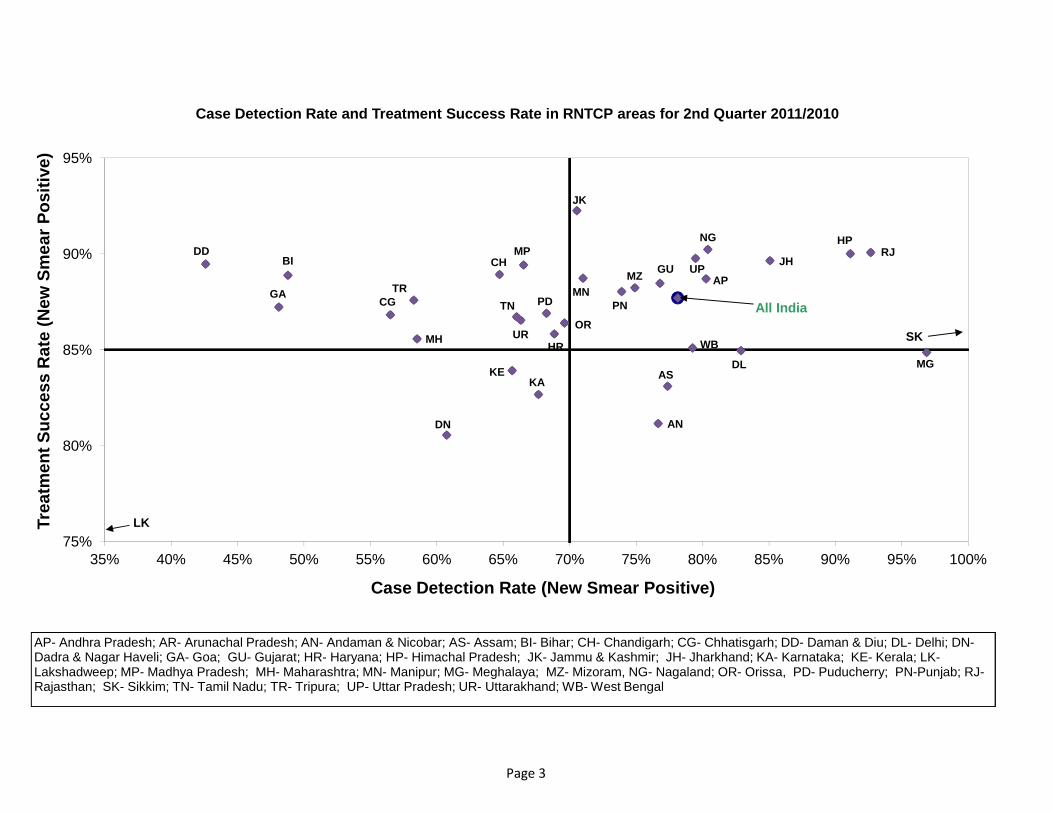
It is my great pleasure to inform you that Revised National TB Control Programme (RNTCP) has maintained NSP Case notification (detection) rate of 59/lakh (78%) in 2nd Quarter 2011 and treatment success rate of 87.7% in NSP patients registered in 2nd Quarter 2010 at the national level. The programme while consolidating and sustaining its past achievements is progressing well towards achieving the TB related Millennium Development Goals in terms of achieving the programme objectives. RNTCP performance in 2nd quarter 2011
During the quarter, over 1.9 million suspects were examined, 260,896 sputum positive cases were diagnosed, and 406,442 TB cases were registered for treatment. The annualized total case detection rate is 136 cases per 100,000 populations. With a total of 174,845 new smear positive cases being registered for treatment, the new smear positive TB case notification rate (annualized) for the 2nd quarter 2011 is 59 per lakh pop. In addition to this, 89,468 new smear negative cases, 62,892 new extra pulmonary cases, 53,611 smear positive re-treatment cases and 25,132 re-treatment Others’ were also registered for treatment in this quarter. The treatment success rate amongst the new smear positive Pulmonary TB cases registered in the 2nd quarter 2010 is 87.7% and the sputum conversion rate of patients registered during 1Q11 is 90.3%. The default rates among NSP (5.6%), NSN (6.7%) and re-treatment cases (14.3%) continues to show the declining trend over the past several quarters. Major Activities during the quarter
Programme review
The Biannual National Review Meeting for the State TB Officers and RNTCP Medical-Consultants was held from 18th to 20th May 2011 at Surajkund, Delhi NCR. The meeting was convened with the underlying theme of National scale up of DOTS plus (PMDT) services under RNTCP in India with the objectives of reviewing the performance and quality of RNTCP services, the progress and challenges in the expansion of DOTS Plus (PMDT) services in the country and to update the STOs and Consultants on newer initiatives, policy changes etc… The inaugural session of the meeting on 18th May 2011 was chaired by Sh.P.K.Pradhan, Special Secretary and Mission Director NRHM, Government of India and Dr.R.K.Srivastava, Director General Health Services, Government of India. The inaugural session was also attended by Dr.Sangay Thinley, Director (CDS), WHO-SEARO. Progress in Supervision, Monitoring and Training
Central Internal Evaluation of Meghalaya was conducted by Central TB Division (CTD) and a few state internal evaluations of various districts were also undertaken. Joint Donor Review Mission
A mission to review the Revised National Tuberculosis Control Program (RNTCP) was undertaken between May 30 and June 9, 2011. The Joint Review Mission, coordinated by CTD and the World Bank, included representatives of WHO, USAID, NIH, DFID, GFATM, the Bill and Melinda Gates Foundation, and the Clinton Health Access Initiative (CHAI) with emphasis on National Strategic Plan for RNTCP for next five year plan (2012-17); “Universal Access” to high-quality diagnosis and patient-friendly treatment under DOTS, including by expanding treatment and diagnosis of HIV-associated TB and MDR-TB; long term financing of RNTCP; distribution and quality assurance of anti-TB drugs; and human resource development. The mission conducted detailed discussions at CTD and also visited the states of Bihar, Madhya
Pradesh, Karnataka and Maharashtra and has provided recommendations for the National Strategic Plan for 2012-17. Progress in accreditation of Intermediate Reference Laboratories (IRL)
RNTCP has accredited 29 Culture and DST laboratories in the country which includes 4 National reference laboratories, 15 Intermediate Reference laboratories and 10 laboratories from other sectors like Medical Colleges, NGOs and Private sectors, the other laboratories are in different stages of accreditation. The Line Probe Assay (LPA) has been introduced in the programme and 2 NRL’s,3 IRLs and 3 Medical College Laboratories have been accredited and one laboratory in private sector with Liquid culture diagnostics has been accredited to deliver the services. Progress in the DOTS- Plus services for MDR TB cases.
DOTS Plus services for management of MDR TB are now available in 165 districts covering a population of 352 million in 17 states. Till date a total of around 4858 MDR-TB patients are on treatment at 28 DOTS Plus Sites functional in these states. Other states are in various stages of preparatory activities for rolling out DOTS-Plus services. Progress in PPM & ACSM activities
Regional ACSM Workshop held in Jaipur from 12th to 14th May, 2011 participants from States of Rajasthan, Gujrat, and Haryana. The group comprised of STO Rajasthan, DTOs, Consultants, and Communication Facilitators. The workshop focused on field activities and the participants prepared their sample district plans which listed strategic interventions to overcome the challenges faced by them in the field. Till 2nd Quarter 2011 under RNTCP, 1963 NGOs and 10230 PPs are involved under various NGO PP Schemes. Progress in TB HIV Collaborative Activities
Scale-up of Joint TB/HIV collaborative activities continues to progress impressively. As per the National Technical Working Group’s decision to roll out Intensified TB/HIV package of services to the remaining 6 states and UTs, training of master trainers have been planned in the month of October 2011 by CTD and NACO; this will take us a step closer to achieving nationwide coverage by the end of 2011. Though the performance is improving overall at national level and in selected high HIV prevalent states, the same is not true for low HIV prevalence states with gross mismatch at service delivery level between RNTCP and NACP. Addressing this would require a major scale-up of integration of NACP services in the general health system and this is being planned jointly by RNTCP and NACP in the next five years (2012-17). In addition, several new initiatives are being tested to enable early and improved diagnosis of HIV-infected TB patients - like ‘HIV testing among TB suspects’ and use of improved, rapid diagnostics to diagnose TB among PLHIV. These would be crucial to achieving universal access to TB/HIV care – All TB patients with known HIV status and all HIV-infected TB patients linked to CPT and ART – and thereby achieving the goal of reduced mortality and morbidity due to HIV-associated TB. The programme has made achieved many milestones over last one decade and is moving towards universal access to TB Care.
Dr. Ashok Kumar
Deputy Director General (TB) Dte. General of Health Services, MOHFW,
Government of India
AN
AP
AS
BI CH
CG
DN
DL
GA
GU
HR
HP
JK
JH
KAKE
MP
MH
MN
MG
MZ
NG
OR
PD PN
RJ
TNTR
UP
URWB
80%
85%
90%
95%
men
t Suc
cess
Rat
e (N
ew S
mea
r Pos
itive
)
Case Detection Rate and Treatment Success Rate in RNTCP areas for 2nd Quarter 2011/2010
DD
All India
SK
Page 3
75%35% 40% 45% 50% 55% 60% 65% 70% 75% 80% 85% 90% 95% 100%
Trea
tm
Case Detection Rate (New Smear Positive)
AP- Andhra Pradesh; AR- Arunachal Pradesh; AN- Andaman & Nicobar; AS- Assam; BI- Bihar; CH- Chandigarh; CG- Chhatisgarh; DD- Daman & Diu; DL- Delhi; DN-Dadra & Nagar Haveli; GA- Goa; GU- Gujarat; HR- Haryana; HP- Himachal Pradesh; JK- Jammu & Kashmir; JH- Jharkhand; KA- Karnataka; KE- Kerala; LK-Lakshadweep; MP- Madhya Pradesh; MH- Maharashtra; MN- Manipur; MG- Meghalaya; MZ- Mizoram, NG- Nagaland; OR- Orissa, PD- Puducherry; PN-Punjab; RJ-Rajasthan; SK- Sikkim; TN- Tamil Nadu; TR- Tripura; UP- Uttar Pradesh; UR- Uttarakhand; WB- West Bengal
AP- Andhra Pradesh; AR- Arunachal Pradesh; AN- Andaman & Nicobar; AS- Assam; BI- Bihar; CH- Chandigarh; CG- Chhatisgarh; DD- Daman & Diu; DL- Delhi; DN-Dadra & Nagar Haveli; GA- Goa; GU- Gujarat; HR- Haryana; HP- Himachal Pradesh; JK- Jammu & Kashmir; JH- Jharkhand; KA- Karnataka; KE- Kerala; LK-Lakshadweep; MP- Madhya Pradesh; MH- Maharashtra; MN- Manipur; MG- Meghalaya; MZ- Mizoram, NG- Nagaland; OR- Orissa, PD- Puducherry; PN-Punjab; RJ-Rajasthan; SK- Sikkim; TN- Tamil Nadu; TR- Tripura; UP- Uttar Pradesh; UR- Uttarakhand; WB- West Bengal
AP- Andhra Pradesh; AR- Arunachal Pradesh; AN- Andaman & Nicobar; AS- Assam; BI- Bihar; CH- Chandigarh; CG- Chhatisgarh; DD- Daman & Diu; DL- Delhi; DN-Dadra & Nagar Haveli; GA- Goa; GU- Gujarat; HR- Haryana; HP- Himachal Pradesh; JK- Jammu & Kashmir; JH- Jharkhand; KA- Karnataka; KE- Kerala; LK-Lakshadweep; MP- Madhya Pradesh; MH- Maharashtra; MN- Manipur; MG- Meghalaya; MZ- Mizoram, NG- Nagaland; OR- Orissa, PD- Puducherry; PN-Punjab; RJ-Rajasthan; SK- Sikkim; TN- Tamil Nadu; TR- Tripura; UP- Uttar Pradesh; UR- Uttarakhand; WB- West Bengal
LK
AP- Andhra Pradesh; AR- Arunachal Pradesh; AN- Andaman & Nicobar; AS- Assam; BI- Bihar; CH- Chandigarh; CG- Chhatisgarh; DD- Daman & Diu; DL- Delhi; DN-Dadra & Nagar Haveli; GA- Goa; GU- Gujarat; HR- Haryana; HP- Himachal Pradesh; JK- Jammu & Kashmir; JH- Jharkhand; KA- Karnataka; KE- Kerala; LK-Lakshadweep; MP- Madhya Pradesh; MH- Maharashtra; MN- Manipur; MG- Meghalaya; MZ- Mizoram, NG- Nagaland; OR- Orissa, PD- Puducherry; PN-Punjab; RJ-Rajasthan; SK- Sikkim; TN- Tamil Nadu; TR- Tripura; UP- Uttar Pradesh; UR- Uttarakhand; WB- West Bengal
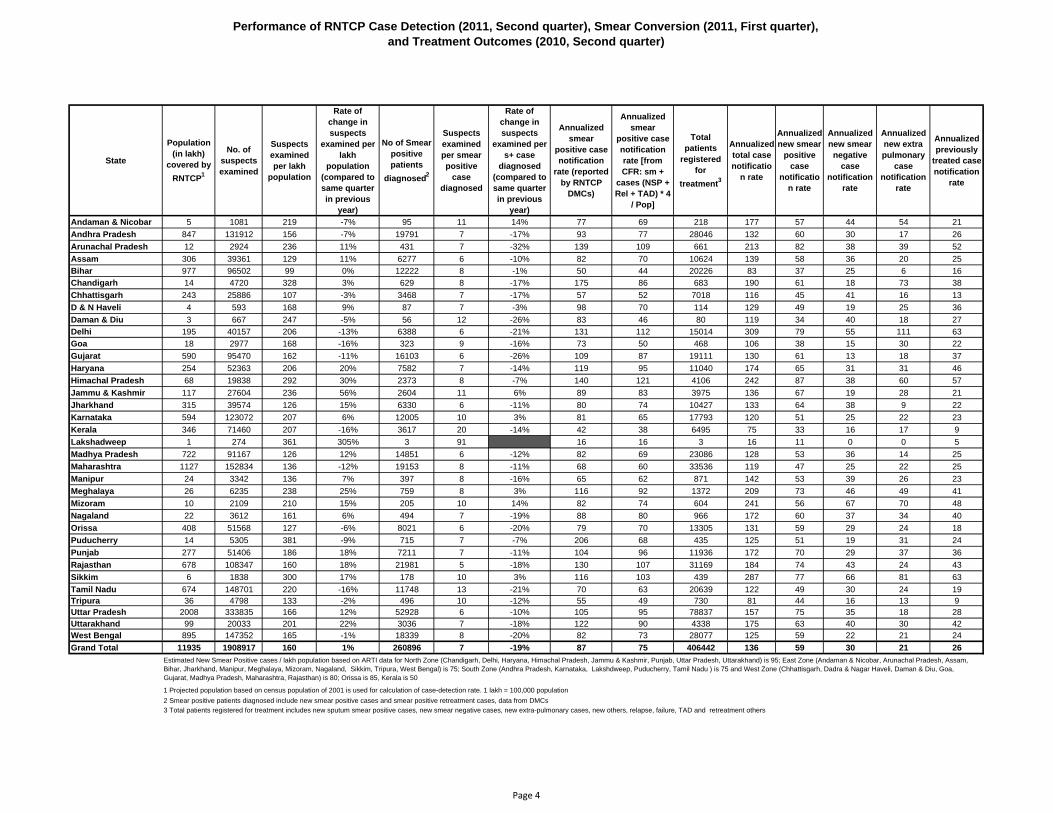
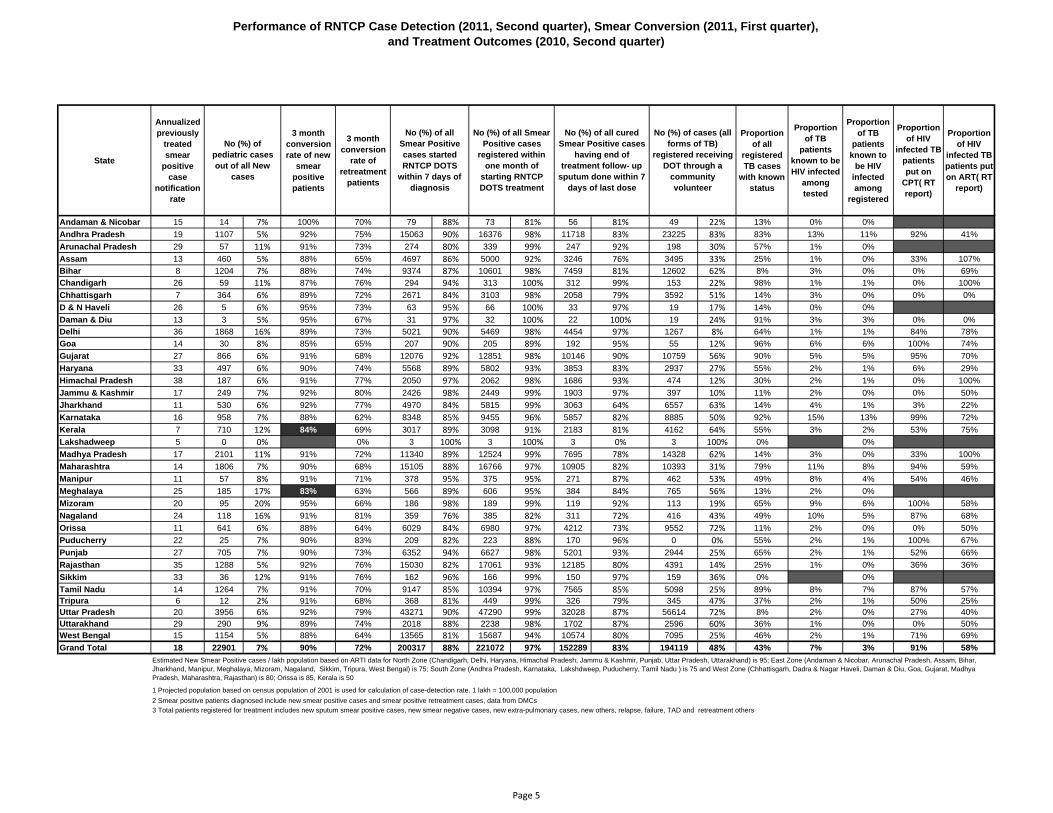
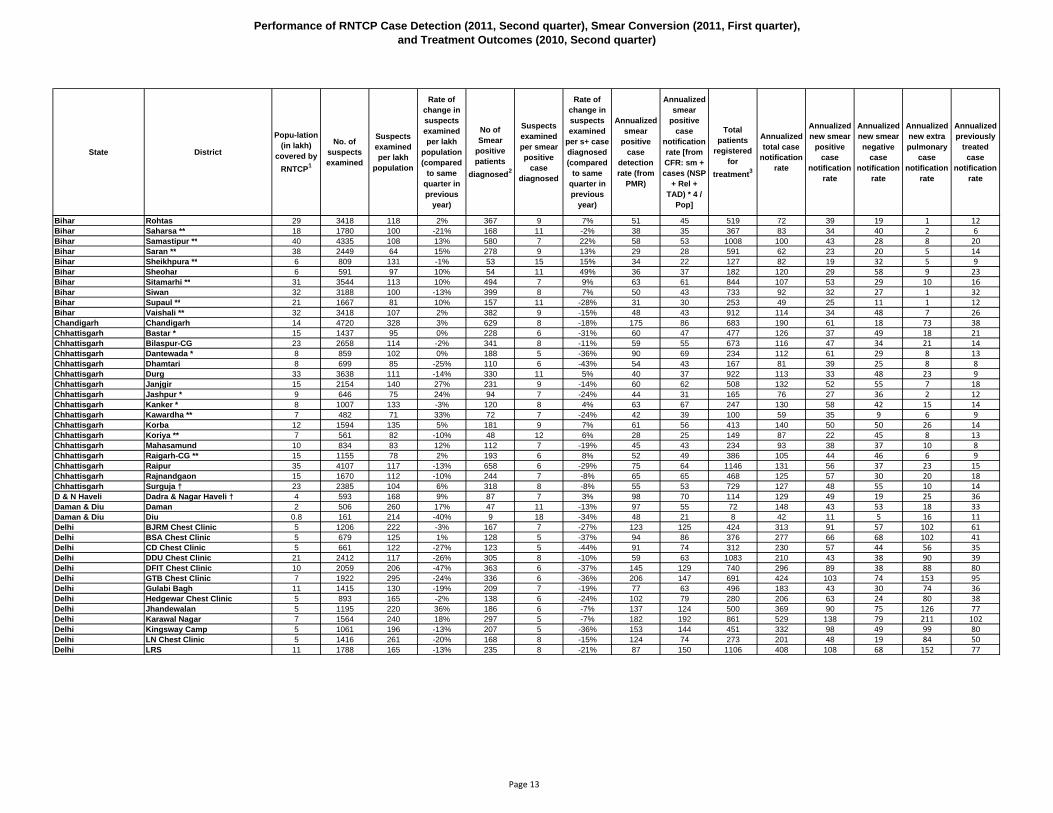
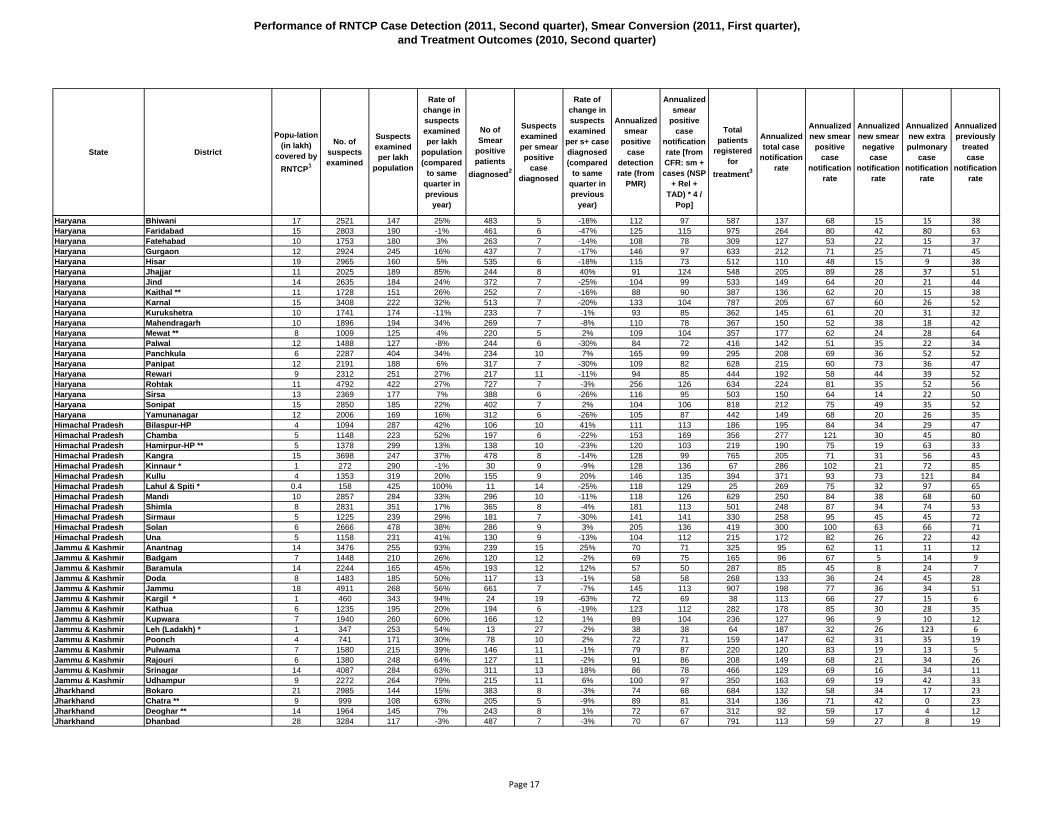
Performance of RNTCP Case Detection (2011, Second quarter), Smear Conversion (2011, First quarter), and Treatment Outcomes (2010, Second quarter)
State
Population (in lakh)
covered by RNTCP1
No. of suspects examined
Suspects examined per lakh
population
Rate of change in suspects
examined per lakh
population (compared to same quarter in previous
year)
No of Smear positive patients
diagnosed2
Suspects examined per smear positive
case diagnosed
Rate of change in suspects
examined per s+ case
diagnosed (compared to same quarter in previous
year)
Annualized smear
positive case notification
rate (reported by RNTCP
DMCs)
Annualized smear
positive case notification rate [from CFR: sm +
cases (NSP + Rel + TAD) * 4
/ Pop]
Total patients
registered for
treatment3
Annualized total case notificatio
n rate
Annualized new smear
positive case
notification rate
Annualized new smear
negative case
notification rate
Annualized new extra pulmonary
case notification
rate
Annualized previously
treated case notification
rate
Andaman & Nicobar 5 1081 219 -7% 95 11 14% 77 69 218 177 57 44 54 21Andhra Pradesh 847 131912 156 -7% 19791 7 -17% 93 77 28046 132 60 30 17 26Arunachal Pradesh 12 2924 236 11% 431 7 -32% 139 109 661 213 82 38 39 52Assam 306 39361 129 11% 6277 6 -10% 82 70 10624 139 58 36 20 25Bihar 977 96502 99 0% 12222 8 -1% 50 44 20226 83 37 25 6 16Chandigarh 14 4720 328 3% 629 8 -17% 175 86 683 190 61 18 73 38Chhattisgarh 243 25886 107 -3% 3468 7 -17% 57 52 7018 116 45 41 16 13D & N Haveli 4 593 168 9% 87 7 -3% 98 70 114 129 49 19 25 36Daman & Diu 3 667 247 -5% 56 12 -26% 83 46 80 119 34 40 18 27Delhi 195 40157 206 -13% 6388 6 -21% 131 112 15014 309 79 55 111 63Goa 18 2977 168 -16% 323 9 -16% 73 50 468 106 38 15 30 22Gujarat 590 95470 162 -11% 16103 6 -26% 109 87 19111 130 61 13 18 37Haryana 254 52363 206 20% 7582 7 -14% 119 95 11040 174 65 31 31 46Himachal Pradesh 68 19838 292 30% 2373 8 -7% 140 121 4106 242 87 38 60 57Jammu & Kashmir 117 27604 236 56% 2604 11 6% 89 83 3975 136 67 19 28 21Jharkhand 315 39574 126 15% 6330 6 -11% 80 74 10427 133 64 38 9 22Karnataka 594 123072 207 6% 12005 10 3% 81 65 17793 120 51 25 22 23Kerala 346 71460 207 -16% 3617 20 -14% 42 38 6495 75 33 16 17 9Lakshadweep 1 274 361 305% 3 91 16 16 3 16 11 0 0 5Madhya Pradesh 722 91167 126 12% 14851 6 -12% 82 69 23086 128 53 36 14 25Maharashtra 1127 152834 136 -12% 19153 8 -11% 68 60 33536 119 47 25 22 25Manipur 24 3342 136 7% 397 8 -16% 65 62 871 142 53 39 26 23Meghalaya 26 6235 238 25% 759 8 3% 116 92 1372 209 73 46 49 41Mizoram 10 2109 210 15% 205 10 14% 82 74 604 241 56 67 70 48Nagaland 22 3612 161 6% 494 7 -19% 88 80 966 172 60 37 34 40Orissa 408 51568 127 -6% 8021 6 -20% 79 70 13305 131 59 29 24 18Puducherry 14 5305 381 -9% 715 7 -7% 206 68 435 125 51 19 31 24Punjab 277 51406 186 18% 7211 7 -11% 104 96 11936 172 70 29 37 36Rajasthan 678 108347 160 18% 21981 5 -18% 130 107 31169 184 74 43 24 43Sikkim 6 1838 300 17% 178 10 3% 116 103 439 287 77 66 81 63Tamil Nadu 674 148701 220 -16% 11748 13 -21% 70 63 20639 122 49 30 24 19Tripura 36 4798 133 -2% 496 10 -12% 55 49 730 81 44 16 13 9Uttar Pradesh 2008 333835 166 12% 52928 6 -10% 105 95 78837 157 75 35 18 28Uttarakhand 99 20033 201 22% 3036 7 -18% 122 90 4338 175 63 40 30 42West Bengal 895 147352 165 -1% 18339 8 -20% 82 73 28077 125 59 22 21 24Grand Total 11935 1908917 160 1% 260896 7 -19% 87 75 406442 136 59 30 21 26
1 Projected population based on census population of 2001 is used for calculation of case-detection rate. 1 lakh = 100,000 population2 Smear positive patients diagnosed include new smear positive cases and smear positive retreatment cases, data from DMCs
Estimated New Smear Positive cases / lakh population based on ARTI data for North Zone (Chandigarh, Delhi, Haryana, Himachal Pradesh, Jammu & Kashmir, Punjab, Uttar Pradesh, Uttarakhand) is 95; East Zone (Andaman & Nicobar, Arunachal Pradesh, Assam, Bihar, Jharkhand, Manipur, Meghalaya, Mizoram, Nagaland, Sikkim, Tripura, West Bengal) is 75; South Zone (Andhra Pradesh, Karnataka, Lakshdweep, Puducherry, Tamil Nadu ) is 75 and West Zone (Chhattisgarh, Dadra & Nagar Haveli, Daman & Diu, Goa, Gujarat, Madhya Pradesh, Maharashtra, Rajasthan) is 80; Orissa is 85, Kerala is 50
3 Total patients registered for treatment includes new sputum smear positive cases, new smear negative cases, new extra-pulmonary cases, new others, relapse, failure, TAD and retreatment others
Page 4
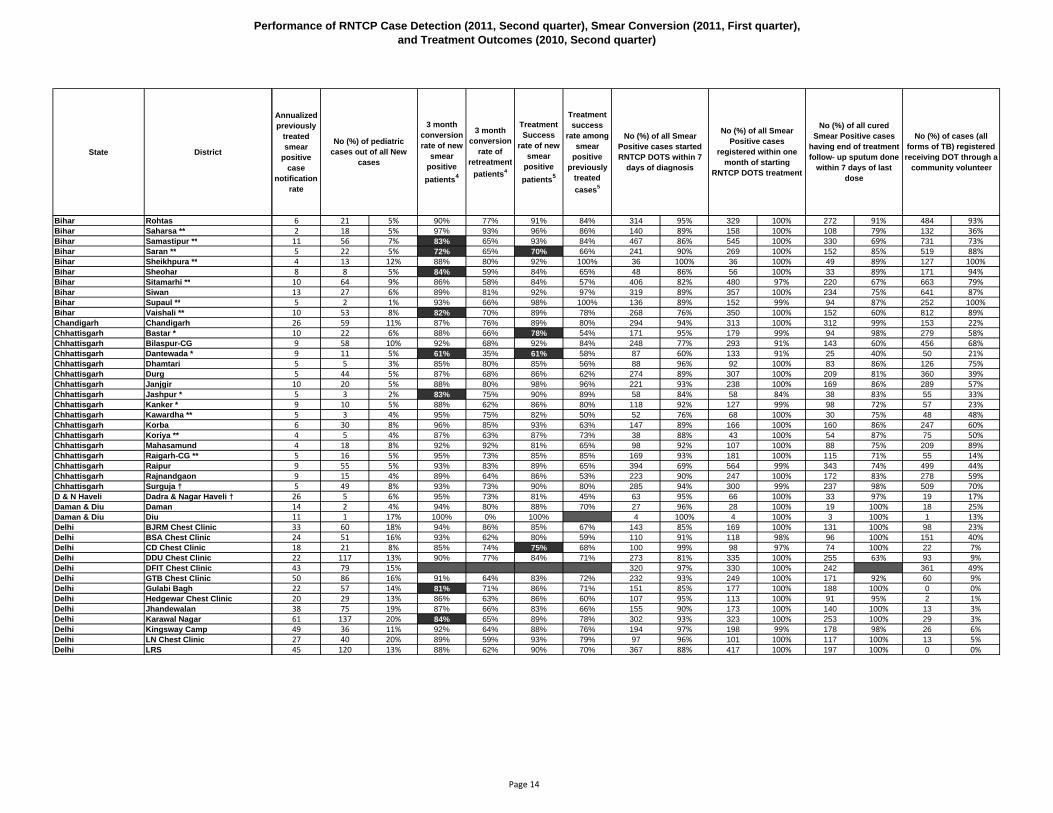
Performance of RNTCP Case Detection (2011, Second quarter), Smear Conversion (2011, First quarter), and Treatment Outcomes (2010, Second quarter)
State
Andaman & NicobarAndhra PradeshArunachal PradeshAssamBiharChandigarhChhattisgarhD & N HaveliDaman & DiuDelhiGoaGujaratHaryanaHimachal PradeshJammu & KashmirJharkhandKarnatakaKeralaLakshadweepMadhya PradeshMaharashtraManipurMeghalayaMizoramNagalandOrissaPuducherryPunjabRajasthanSikkimTamil NaduTripuraUttar PradeshUttarakhandWest BengalGrand Total
Annualized previously
treated smear
positive case
notification rate
3 month conversion rate of new
smear positive patients
3 month conversion
rate of retreatment
patients
Proportion of all
registered TB cases
with known status
Proportion of TB
patients known to be HIV infected
among tested
Proportion of TB
patients known to
be HIV infected among
registered
Proportion of HIV
infected TB patients put on
CPT( RT report)
Proportion of HIV
infected TB patients put on ART( RT
report)
15 14 7% 100% 70% 79 88% 73 81% 56 81% 49 22% 13% 0% 0%19 1107 5% 92% 75% 15063 90% 16376 98% 11718 83% 23225 83% 83% 13% 11% 92% 41%29 57 11% 91% 73% 274 80% 339 99% 247 92% 198 30% 57% 1% 0%13 460 5% 88% 65% 4697 86% 5000 92% 3246 76% 3495 33% 25% 1% 0% 33% 107%8 1204 7% 88% 74% 9374 87% 10601 98% 7459 81% 12602 62% 8% 3% 0% 0% 69%26 59 11% 87% 76% 294 94% 313 100% 312 99% 153 22% 98% 1% 1% 0% 100%7 364 6% 89% 72% 2671 84% 3103 98% 2058 79% 3592 51% 14% 3% 0% 0% 0%26 5 6% 95% 73% 63 95% 66 100% 33 97% 19 17% 14% 0% 0%13 3 5% 95% 67% 31 97% 32 100% 22 100% 19 24% 91% 3% 3% 0% 0%36 1868 16% 89% 73% 5021 90% 5469 98% 4454 97% 1267 8% 64% 1% 1% 84% 78%14 30 8% 85% 65% 207 90% 205 89% 192 95% 55 12% 96% 6% 6% 100% 74%27 866 6% 91% 68% 12076 92% 12851 98% 10146 90% 10759 56% 90% 5% 5% 95% 70%33 497 6% 90% 74% 5568 89% 5802 93% 3853 83% 2937 27% 55% 2% 1% 6% 29%38 187 6% 91% 77% 2050 97% 2062 98% 1686 93% 474 12% 30% 2% 1% 0% 100%17 249 7% 92% 80% 2426 98% 2449 99% 1903 97% 397 10% 11% 2% 0% 0% 50%11 530 6% 92% 77% 4970 84% 5815 99% 3063 64% 6557 63% 14% 4% 1% 3% 22%16 958 7% 88% 62% 8348 85% 9455 96% 5857 82% 8885 50% 92% 15% 13% 99% 72%7 710 12% 84% 69% 3017 89% 3098 91% 2183 81% 4162 64% 55% 3% 2% 53% 75%5 0 0% 0% 3 100% 3 100% 3 0% 3 100% 0% 0%17 2101 11% 91% 72% 11340 89% 12524 99% 7695 78% 14328 62% 14% 3% 0% 33% 100%14 1806 7% 90% 68% 15105 88% 16766 97% 10905 82% 10393 31% 79% 11% 8% 94% 59%11 57 8% 91% 71% 378 95% 375 95% 271 87% 462 53% 49% 8% 4% 54% 46%25 185 17% 83% 63% 566 89% 606 95% 384 84% 765 56% 13% 2% 0%20 95 20% 95% 66% 186 98% 189 99% 119 92% 113 19% 65% 9% 6% 100% 58%24 118 16% 91% 81% 359 76% 385 82% 311 72% 416 43% 49% 10% 5% 87% 68%11 641 6% 88% 64% 6029 84% 6980 97% 4212 73% 9552 72% 11% 2% 0% 0% 50%22 25 7% 90% 83% 209 82% 223 88% 170 96% 0 0% 55% 2% 1% 100% 67%27 705 7% 90% 73% 6352 94% 6627 98% 5201 93% 2944 25% 65% 2% 1% 52% 66%35 1288 5% 92% 76% 15030 82% 17061 93% 12185 80% 4391 14% 25% 1% 0% 36% 36%33 36 12% 91% 76% 162 96% 166 99% 150 97% 159 36% 0% 0%14 1264 7% 91% 70% 9147 85% 10394 97% 7565 85% 5098 25% 89% 8% 7% 87% 57%6 12 2% 91% 68% 368 81% 449 99% 326 79% 345 47% 37% 2% 1% 50% 25%20 3956 6% 92% 79% 43271 90% 47290 99% 32028 87% 56614 72% 8% 2% 0% 27% 40%29 290 9% 89% 74% 2018 88% 2238 98% 1702 87% 2596 60% 36% 1% 0% 0% 50%15 1154 5% 88% 64% 13565 81% 15687 94% 10574 80% 7095 25% 46% 2% 1% 71% 69%18 22901 7% 90% 72% 200317 88% 221072 97% 152289 83% 194119 48% 43% 7% 3% 91% 58%
1 Projected population based on census population of 2001 is used for calculation of case-detection rate. 1 lakh = 100,000 population2 Smear positive patients diagnosed include new smear positive cases and smear positive retreatment cases, data from DMCs
No (%) of pediatric cases out of all New
cases
Estimated New Smear Positive cases / lakh population based on ARTI data for North Zone (Chandigarh, Delhi, Haryana, Himachal Pradesh, Jammu & Kashmir, Punjab, Uttar Pradesh, Uttarakhand) is 95; East Zone (Andaman & Nicobar, Arunachal Pradesh, Assam, Bihar, Jharkhand, Manipur, Meghalaya, Mizoram, Nagaland, Sikkim, Tripura, West Bengal) is 75; South Zone (Andhra Pradesh, Karnataka, Lakshdweep, Puducherry, Tamil Nadu ) is 75 and West Zone (Chhattisgarh, Dadra & Nagar Haveli, Daman & Diu, Goa, Gujarat, Madhya Pradesh, Maharashtra, Rajasthan) is 80; Orissa is 85, Kerala is 50
3 Total patients registered for treatment includes new sputum smear positive cases, new smear negative cases, new extra-pulmonary cases, new others, relapse, failure, TAD and retreatment others
No (%) of all Smear Positive cases started RNTCP DOTS
within 7 days of diagnosis
No (%) of all Smear Positive cases
registered within one month of
starting RNTCP DOTS treatment
No (%) of all cured Smear Positive cases
having end of treatment follow- up
sputum done within 7 days of last dose
No (%) of cases (all forms of TB)
registered receiving DOT through a
community volunteer
Page 5
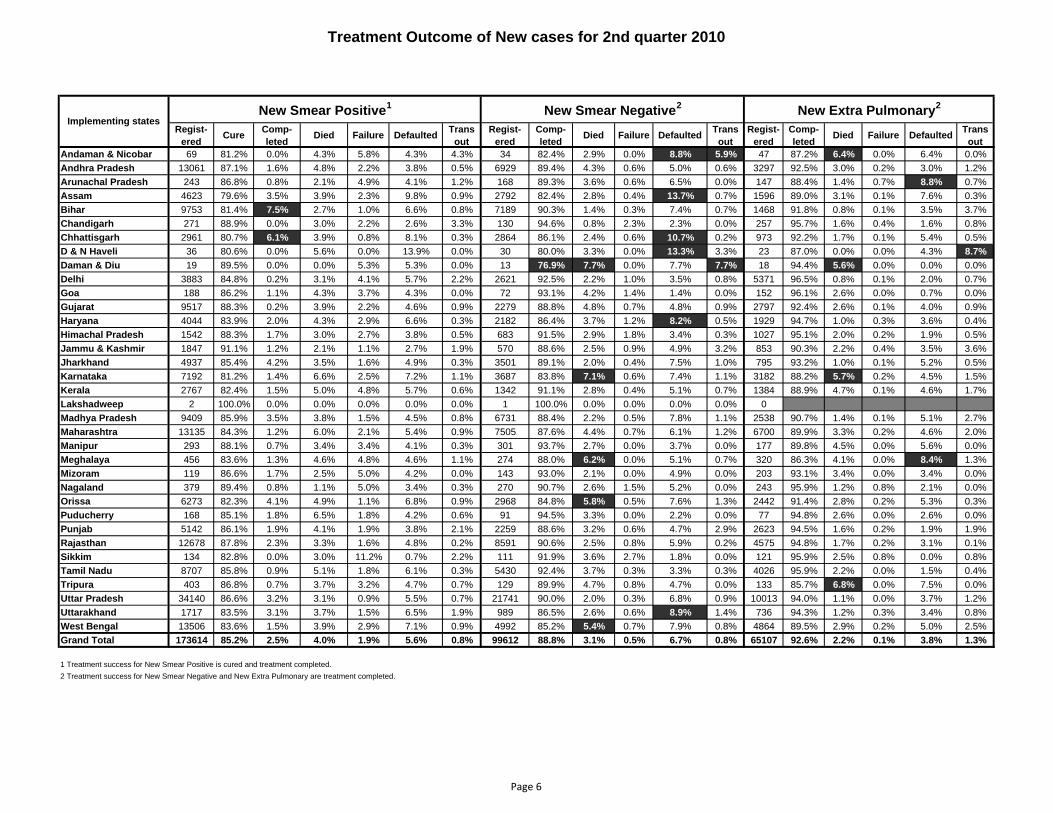
Treatment Outcome of New cases for 2nd quarter 2010
Regist-ered Cure Comp-
leted Died Failure Defaulted Trans out
Regist-ered
Comp-leted Died Failure Defaulted Trans
outRegist-
eredComp-leted Died Failure Defaulted Trans
outAndaman & Nicobar 69 81.2% 0.0% 4.3% 5.8% 4.3% 4.3% 34 82.4% 2.9% 0.0% 8.8% 5.9% 47 87.2% 6.4% 0.0% 6.4% 0.0%Andhra Pradesh 13061 87.1% 1.6% 4.8% 2.2% 3.8% 0.5% 6929 89.4% 4.3% 0.6% 5.0% 0.6% 3297 92.5% 3.0% 0.2% 3.0% 1.2%Arunachal Pradesh 243 86.8% 0.8% 2.1% 4.9% 4.1% 1.2% 168 89.3% 3.6% 0.6% 6.5% 0.0% 147 88.4% 1.4% 0.7% 8.8% 0.7%Assam 4623 79.6% 3.5% 3.9% 2.3% 9.8% 0.9% 2792 82.4% 2.8% 0.4% 13.7% 0.7% 1596 89.0% 3.1% 0.1% 7.6% 0.3%Bihar 9753 81.4% 7.5% 2.7% 1.0% 6.6% 0.8% 7189 90.3% 1.4% 0.3% 7.4% 0.7% 1468 91.8% 0.8% 0.1% 3.5% 3.7%Chandigarh 271 88.9% 0.0% 3.0% 2.2% 2.6% 3.3% 130 94.6% 0.8% 2.3% 2.3% 0.0% 257 95.7% 1.6% 0.4% 1.6% 0.8%Chhattisgarh 2961 80.7% 6.1% 3.9% 0.8% 8.1% 0.3% 2864 86.1% 2.4% 0.6% 10.7% 0.2% 973 92.2% 1.7% 0.1% 5.4% 0.5%D & N Haveli 36 80.6% 0.0% 5.6% 0.0% 13.9% 0.0% 30 80.0% 3.3% 0.0% 13.3% 3.3% 23 87.0% 0.0% 0.0% 4.3% 8.7%Daman & Diu 19 89.5% 0.0% 0.0% 5.3% 5.3% 0.0% 13 76.9% 7.7% 0.0% 7.7% 7.7% 18 94.4% 5.6% 0.0% 0.0% 0.0%Delhi 3883 84.8% 0.2% 3.1% 4.1% 5.7% 2.2% 2621 92.5% 2.2% 1.0% 3.5% 0.8% 5371 96.5% 0.8% 0.1% 2.0% 0.7%Goa 188 86.2% 1.1% 4.3% 3.7% 4.3% 0.0% 72 93.1% 4.2% 1.4% 1.4% 0.0% 152 96.1% 2.6% 0.0% 0.7% 0.0%Gujarat 9517 88.3% 0.2% 3.9% 2.2% 4.6% 0.9% 2279 88.8% 4.8% 0.7% 4.8% 0.9% 2797 92.4% 2.6% 0.1% 4.0% 0.9%Haryana 4044 83.9% 2.0% 4.3% 2.9% 6.6% 0.3% 2182 86.4% 3.7% 1.2% 8.2% 0.5% 1929 94.7% 1.0% 0.3% 3.6% 0.4%Himachal Pradesh 1542 88.3% 1.7% 3.0% 2.7% 3.8% 0.5% 683 91.5% 2.9% 1.8% 3.4% 0.3% 1027 95.1% 2.0% 0.2% 1.9% 0.5%Jammu & Kashmir 1847 91.1% 1.2% 2.1% 1.1% 2.7% 1.9% 570 88.6% 2.5% 0.9% 4.9% 3.2% 853 90.3% 2.2% 0.4% 3.5% 3.6%Jharkhand 4937 85.4% 4.2% 3.5% 1.6% 4.9% 0.3% 3501 89.1% 2.0% 0.4% 7.5% 1.0% 795 93.2% 1.0% 0.1% 5.2% 0.5%Karnataka 7192 81.2% 1.4% 6.6% 2.5% 7.2% 1.1% 3687 83.8% 7.1% 0.6% 7.4% 1.1% 3182 88.2% 5.7% 0.2% 4.5% 1.5%Kerala 2767 82.4% 1.5% 5.0% 4.8% 5.7% 0.6% 1342 91.1% 2.8% 0.4% 5.1% 0.7% 1384 88.9% 4.7% 0.1% 4.6% 1.7%Lakshadweep 2 100.0% 0.0% 0.0% 0.0% 0.0% 0.0% 1 100.0% 0.0% 0.0% 0.0% 0.0% 0Madhya Pradesh 9409 85.9% 3.5% 3.8% 1.5% 4.5% 0.8% 6731 88.4% 2.2% 0.5% 7.8% 1.1% 2538 90.7% 1.4% 0.1% 5.1% 2.7%Maharashtra 13135 84.3% 1.2% 6.0% 2.1% 5.4% 0.9% 7505 87.6% 4.4% 0.7% 6.1% 1.2% 6700 89.9% 3.3% 0.2% 4.6% 2.0%Manipur 293 88.1% 0.7% 3.4% 3.4% 4.1% 0.3% 301 93.7% 2.7% 0.0% 3.7% 0.0% 177 89.8% 4.5% 0.0% 5.6% 0.0%Meghalaya 456 83.6% 1.3% 4.6% 4.8% 4.6% 1.1% 274 88.0% 6.2% 0.0% 5.1% 0.7% 320 86.3% 4.1% 0.0% 8.4% 1.3%Mizoram 119 86.6% 1.7% 2.5% 5.0% 4.2% 0.0% 143 93.0% 2.1% 0.0% 4.9% 0.0% 203 93.1% 3.4% 0.0% 3.4% 0.0%Nagaland 379 89.4% 0.8% 1.1% 5.0% 3.4% 0.3% 270 90.7% 2.6% 1.5% 5.2% 0.0% 243 95.9% 1.2% 0.8% 2.1% 0.0%Orissa 6273 82.3% 4.1% 4.9% 1.1% 6.8% 0.9% 2968 84.8% 5.8% 0.5% 7.6% 1.3% 2442 91.4% 2.8% 0.2% 5.3% 0.3%Puducherry 168 85.1% 1.8% 6.5% 1.8% 4.2% 0.6% 91 94.5% 3.3% 0.0% 2.2% 0.0% 77 94.8% 2.6% 0.0% 2.6% 0.0%Punjab 5142 86.1% 1.9% 4.1% 1.9% 3.8% 2.1% 2259 88.6% 3.2% 0.6% 4.7% 2.9% 2623 94.5% 1.6% 0.2% 1.9% 1.9%Rajasthan 12678 87.8% 2.3% 3.3% 1.6% 4.8% 0.2% 8591 90.6% 2.5% 0.8% 5.9% 0.2% 4575 94.8% 1.7% 0.2% 3.1% 0.1%Sikkim 134 82.8% 0.0% 3.0% 11.2% 0.7% 2.2% 111 91.9% 3.6% 2.7% 1.8% 0.0% 121 95.9% 2.5% 0.8% 0.0% 0.8%Tamil Nadu 8707 85.8% 0.9% 5.1% 1.8% 6.1% 0.3% 5430 92.4% 3.7% 0.3% 3.3% 0.3% 4026 95.9% 2.2% 0.0% 1.5% 0.4%Tripura 403 86.8% 0.7% 3.7% 3.2% 4.7% 0.7% 129 89.9% 4.7% 0.8% 4.7% 0.0% 133 85.7% 6.8% 0.0% 7.5% 0.0%Uttar Pradesh 34140 86.6% 3.2% 3.1% 0.9% 5.5% 0.7% 21741 90.0% 2.0% 0.3% 6.8% 0.9% 10013 94.0% 1.1% 0.0% 3.7% 1.2%Uttarakhand 1717 83.5% 3.1% 3.7% 1.5% 6.5% 1.9% 989 86.5% 2.6% 0.6% 8.9% 1.4% 736 94.3% 1.2% 0.3% 3.4% 0.8%West Bengal 13506 83.6% 1.5% 3.9% 2.9% 7.1% 0.9% 4992 85.2% 5.4% 0.7% 7.9% 0.8% 4864 89.5% 2.9% 0.2% 5.0% 2.5%Grand Total 173614 85.2% 2.5% 4.0% 1.9% 5.6% 0.8% 99612 88.8% 3.1% 0.5% 6.7% 0.8% 65107 92.6% 2.2% 0.1% 3.8% 1.3%
2 Treatment success for New Smear Negative and New Extra Pulmonary are treatment completed.
Implementing statesNew Smear Positive1 New Smear Negative2 New Extra Pulmonary2
1 Treatment success for New Smear Positive is cured and treatment completed.
Page 6
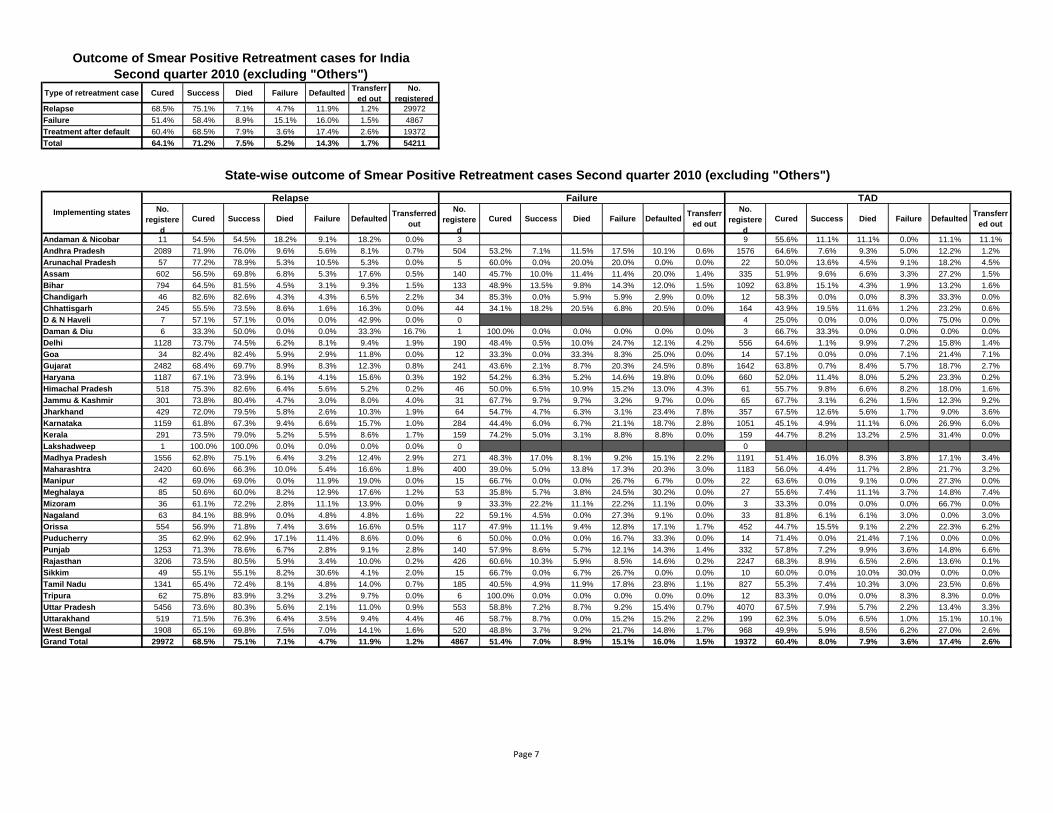
Type of retreatment case Cured Success Died Failure Defaulted Transferred out
No. registered
Relapse 68.5% 75.1% 7.1% 4.7% 11.9% 1.2% 29972Failure 51.4% 58.4% 8.9% 15.1% 16.0% 1.5% 4867Treatment after default 60.4% 68.5% 7.9% 3.6% 17.4% 2.6% 19372Total 64.1% 71.2% 7.5% 5.2% 14.3% 1.7% 54211
No. registere
dCured Success Died Failure Defaulted Transferred
out
No. registere
dCured Success Died Failure Defaulted Transferr
ed out
No. registere
dCured Success Died Failure Defaulted Transferr
ed out
Andaman & Nicobar 11 54.5% 54.5% 18.2% 9.1% 18.2% 0.0% 3 9 55.6% 11.1% 11.1% 0.0% 11.1% 11.1%Andhra Pradesh 2089 71.9% 76.0% 9.6% 5.6% 8.1% 0.7% 504 53.2% 7.1% 11.5% 17.5% 10.1% 0.6% 1576 64.6% 7.6% 9.3% 5.0% 12.2% 1.2%Arunachal Pradesh 57 77.2% 78.9% 5.3% 10.5% 5.3% 0.0% 5 60.0% 0.0% 20.0% 20.0% 0.0% 0.0% 22 50.0% 13.6% 4.5% 9.1% 18.2% 4.5%Assam 602 56.5% 69.8% 6.8% 5.3% 17.6% 0.5% 140 45.7% 10.0% 11.4% 11.4% 20.0% 1.4% 335 51.9% 9.6% 6.6% 3.3% 27.2% 1.5%Bihar 794 64.5% 81.5% 4.5% 3.1% 9.3% 1.5% 133 48.9% 13.5% 9.8% 14.3% 12.0% 1.5% 1092 63.8% 15.1% 4.3% 1.9% 13.2% 1.6%Chandigarh 46 82.6% 82.6% 4.3% 4.3% 6.5% 2.2% 34 85.3% 0.0% 5.9% 5.9% 2.9% 0.0% 12 58.3% 0.0% 0.0% 8.3% 33.3% 0.0%Chhattisgarh 245 55.5% 73.5% 8.6% 1.6% 16.3% 0.0% 44 34.1% 18.2% 20.5% 6.8% 20.5% 0.0% 164 43.9% 19.5% 11.6% 1.2% 23.2% 0.6%D & N Haveli 7 57.1% 57.1% 0.0% 0.0% 42.9% 0.0% 0 4 25.0% 0.0% 0.0% 0.0% 75.0% 0.0%Daman & Diu 6 33.3% 50.0% 0.0% 0.0% 33.3% 16.7% 1 100.0% 0.0% 0.0% 0.0% 0.0% 0.0% 3 66.7% 33.3% 0.0% 0.0% 0.0% 0.0%Delhi 1128 73.7% 74.5% 6.2% 8.1% 9.4% 1.9% 190 48.4% 0.5% 10.0% 24.7% 12.1% 4.2% 556 64.6% 1.1% 9.9% 7.2% 15.8% 1.4%Goa 34 82.4% 82.4% 5.9% 2.9% 11.8% 0.0% 12 33.3% 0.0% 33.3% 8.3% 25.0% 0.0% 14 57.1% 0.0% 0.0% 7.1% 21.4% 7.1%Gujarat 2482 68.4% 69.7% 8.9% 8.3% 12.3% 0.8% 241 43.6% 2.1% 8.7% 20.3% 24.5% 0.8% 1642 63.8% 0.7% 8.4% 5.7% 18.7% 2.7%Haryana 1187 67.1% 73.9% 6.1% 4.1% 15.6% 0.3% 192 54.2% 6.3% 5.2% 14.6% 19.8% 0.0% 660 52.0% 11.4% 8.0% 5.2% 23.3% 0.2%Himachal Pradesh 518 75.3% 82.6% 6.4% 5.6% 5.2% 0.2% 46 50.0% 6.5% 10.9% 15.2% 13.0% 4.3% 61 55.7% 9.8% 6.6% 8.2% 18.0% 1.6%Jammu & Kashmir 301 73.8% 80.4% 4.7% 3.0% 8.0% 4.0% 31 67.7% 9.7% 9.7% 3.2% 9.7% 0.0% 65 67.7% 3.1% 6.2% 1.5% 12.3% 9.2%Jharkhand 429 72.0% 79.5% 5.8% 2.6% 10.3% 1.9% 64 54.7% 4.7% 6.3% 3.1% 23.4% 7.8% 357 67.5% 12.6% 5.6% 1.7% 9.0% 3.6%Karnataka 1159 61.8% 67.3% 9.4% 6.6% 15.7% 1.0% 284 44.4% 6.0% 6.7% 21.1% 18.7% 2.8% 1051 45.1% 4.9% 11.1% 6.0% 26.9% 6.0%Kerala 291 73.5% 79.0% 5.2% 5.5% 8.6% 1.7% 159 74.2% 5.0% 3.1% 8.8% 8.8% 0.0% 159 44.7% 8.2% 13.2% 2.5% 31.4% 0.0%Lakshadweep 1 100.0% 100.0% 0.0% 0.0% 0.0% 0.0% 0 0Madhya Pradesh 1556 62.8% 75.1% 6.4% 3.2% 12.4% 2.9% 271 48.3% 17.0% 8.1% 9.2% 15.1% 2.2% 1191 51.4% 16.0% 8.3% 3.8% 17.1% 3.4%Maharashtra 2420 60.6% 66.3% 10.0% 5.4% 16.6% 1.8% 400 39.0% 5.0% 13.8% 17.3% 20.3% 3.0% 1183 56.0% 4.4% 11.7% 2.8% 21.7% 3.2%Manipur 42 69.0% 69.0% 0.0% 11.9% 19.0% 0.0% 15 66.7% 0.0% 0.0% 26.7% 6.7% 0.0% 22 63.6% 0.0% 9.1% 0.0% 27.3% 0.0%Meghalaya 85 50.6% 60.0% 8.2% 12.9% 17.6% 1.2% 53 35.8% 5.7% 3.8% 24.5% 30.2% 0.0% 27 55.6% 7.4% 11.1% 3.7% 14.8% 7.4%Mizoram 36 61.1% 72.2% 2.8% 11.1% 13.9% 0.0% 9 33.3% 22.2% 11.1% 22.2% 11.1% 0.0% 3 33.3% 0.0% 0.0% 0.0% 66.7% 0.0%Nagaland 63 84.1% 88.9% 0.0% 4.8% 4.8% 1.6% 22 59.1% 4.5% 0.0% 27.3% 9.1% 0.0% 33 81.8% 6.1% 6.1% 3.0% 0.0% 3.0%Orissa 554 56.9% 71.8% 7.4% 3.6% 16.6% 0.5% 117 47.9% 11.1% 9.4% 12.8% 17.1% 1.7% 452 44.7% 15.5% 9.1% 2.2% 22.3% 6.2%Puducherry 35 62.9% 62.9% 17.1% 11.4% 8.6% 0.0% 6 50.0% 0.0% 0.0% 16.7% 33.3% 0.0% 14 71.4% 0.0% 21.4% 7.1% 0.0% 0.0%Punjab 1253 71.3% 78.6% 6.7% 2.8% 9.1% 2.8% 140 57.9% 8.6% 5.7% 12.1% 14.3% 1.4% 332 57.8% 7.2% 9.9% 3.6% 14.8% 6.6%Rajasthan 3206 73.5% 80.5% 5.9% 3.4% 10.0% 0.2% 426 60.6% 10.3% 5.9% 8.5% 14.6% 0.2% 2247 68.3% 8.9% 6.5% 2.6% 13.6% 0.1%Sikkim 49 55.1% 55.1% 8.2% 30.6% 4.1% 2.0% 15 66.7% 0.0% 6.7% 26.7% 0.0% 0.0% 10 60.0% 0.0% 10.0% 30.0% 0.0% 0.0%Tamil Nadu 1341 65.4% 72.4% 8.1% 4.8% 14.0% 0.7% 185 40.5% 4.9% 11.9% 17.8% 23.8% 1.1% 827 55.3% 7.4% 10.3% 3.0% 23.5% 0.6%Tripura 62 75.8% 83.9% 3.2% 3.2% 9.7% 0.0% 6 100.0% 0.0% 0.0% 0.0% 0.0% 0.0% 12 83.3% 0.0% 0.0% 8.3% 8.3% 0.0%Uttar Pradesh 5456 73.6% 80.3% 5.6% 2.1% 11.0% 0.9% 553 58.8% 7.2% 8.7% 9.2% 15.4% 0.7% 4070 67.5% 7.9% 5.7% 2.2% 13.4% 3.3%Uttarakhand 519 71.5% 76.3% 6.4% 3.5% 9.4% 4.4% 46 58.7% 8.7% 0.0% 15.2% 15.2% 2.2% 199 62.3% 5.0% 6.5% 1.0% 15.1% 10.1%West Bengal 1908 65.1% 69.8% 7.5% 7.0% 14.1% 1.6% 520 48.8% 3.7% 9.2% 21.7% 14.8% 1.7% 968 49.9% 5.9% 8.5% 6.2% 27.0% 2.6%Grand Total 29972 68.5% 75.1% 7.1% 4.7% 11.9% 1.2% 4867 51.4% 7.0% 8.9% 15.1% 16.0% 1.5% 19372 60.4% 8.0% 7.9% 3.6% 17.4% 2.6%
Outcome of Smear Positive Retreatment cases for IndiaSecond quarter 2010 (excluding "Others")
Relapse Failure TADImplementing states
State-wise outcome of Smear Positive Retreatment cases Second quarter 2010 (excluding "Others")
Page 7
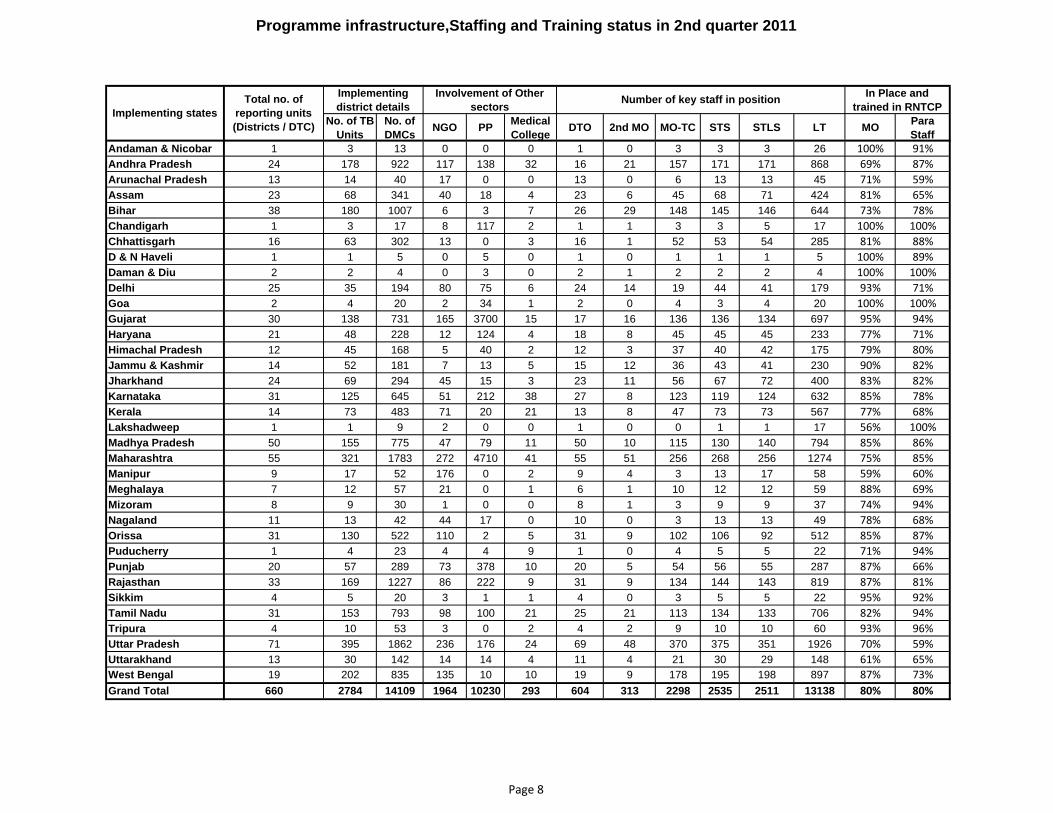
Programme infrastructure,Staffing and Training status in 2nd quarter 2011
No. of TB Units
No. of DMCs NGO PP Medical
College DTO 2nd MO MO-TC STS STLS LT MO Para Staff
Andaman & Nicobar 1 3 13 0 0 0 1 0 3 3 3 26 100% 91%Andhra Pradesh 24 178 922 117 138 32 16 21 157 171 171 868 69% 87%Arunachal Pradesh 13 14 40 17 0 0 13 0 6 13 13 45 71% 59%Assam 23 68 341 40 18 4 23 6 45 68 71 424 81% 65%Bihar 38 180 1007 6 3 7 26 29 148 145 146 644 73% 78%Chandigarh 1 3 17 8 117 2 1 1 3 3 5 17 100% 100%Chhattisgarh 16 63 302 13 0 3 16 1 52 53 54 285 81% 88%D & N Haveli 1 1 5 0 5 0 1 0 1 1 1 5 100% 89%Daman & Diu 2 2 4 0 3 0 2 1 2 2 2 4 100% 100%Delhi 25 35 194 80 75 6 24 14 19 44 41 179 93% 71%Goa 2 4 20 2 34 1 2 0 4 3 4 20 100% 100%Gujarat 30 138 731 165 3700 15 17 16 136 136 134 697 95% 94%Haryana 21 48 228 12 124 4 18 8 45 45 45 233 77% 71%Himachal Pradesh 12 45 168 5 40 2 12 3 37 40 42 175 79% 80%Jammu & Kashmir 14 52 181 7 13 5 15 12 36 43 41 230 90% 82%Jharkhand 24 69 294 45 15 3 23 11 56 67 72 400 83% 82%Karnataka 31 125 645 51 212 38 27 8 123 119 124 632 85% 78%Kerala 14 73 483 71 20 21 13 8 47 73 73 567 77% 68%Lakshadweep 1 1 9 2 0 0 1 0 0 1 1 17 56% 100%Madhya Pradesh 50 155 775 47 79 11 50 10 115 130 140 794 85% 86%Maharashtra 55 321 1783 272 4710 41 55 51 256 268 256 1274 75% 85%Manipur 9 17 52 176 0 2 9 4 3 13 17 58 59% 60%Meghalaya 7 12 57 21 0 1 6 1 10 12 12 59 88% 69%Mizoram 8 9 30 1 0 0 8 1 3 9 9 37 74% 94%Nagaland 11 13 42 44 17 0 10 0 3 13 13 49 78% 68%Orissa 31 130 522 110 2 5 31 9 102 106 92 512 85% 87%Puducherry 1 4 23 4 4 9 1 0 4 5 5 22 71% 94%Punjab 20 57 289 73 378 10 20 5 54 56 55 287 87% 66%Rajasthan 33 169 1227 86 222 9 31 9 134 144 143 819 87% 81%Sikkim 4 5 20 3 1 1 4 0 3 5 5 22 95% 92%Tamil Nadu 31 153 793 98 100 21 25 21 113 134 133 706 82% 94%Tripura 4 10 53 3 0 2 4 2 9 10 10 60 93% 96%Uttar Pradesh 71 395 1862 236 176 24 69 48 370 375 351 1926 70% 59%Uttarakhand 13 30 142 14 14 4 11 4 21 30 29 148 61% 65%West Bengal 19 202 835 135 10 10 19 9 178 195 198 897 87% 73%Grand Total 660 2784 14109 1964 10230 293 604 313 2298 2535 2511 13138 80% 80%
In Place and trained in RNTCPImplementing states
Total no. of reporting units (Districts / DTC)
Implementing district details
Involvement of Other sectors Number of key staff in position
Page 8
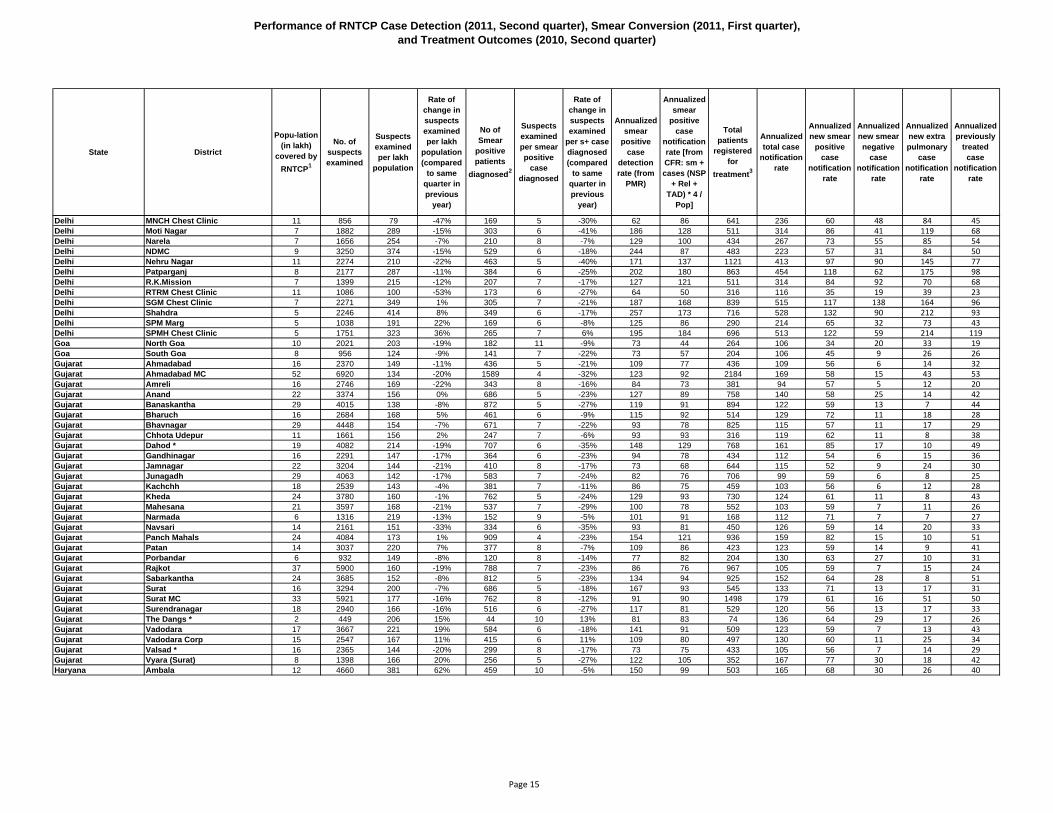
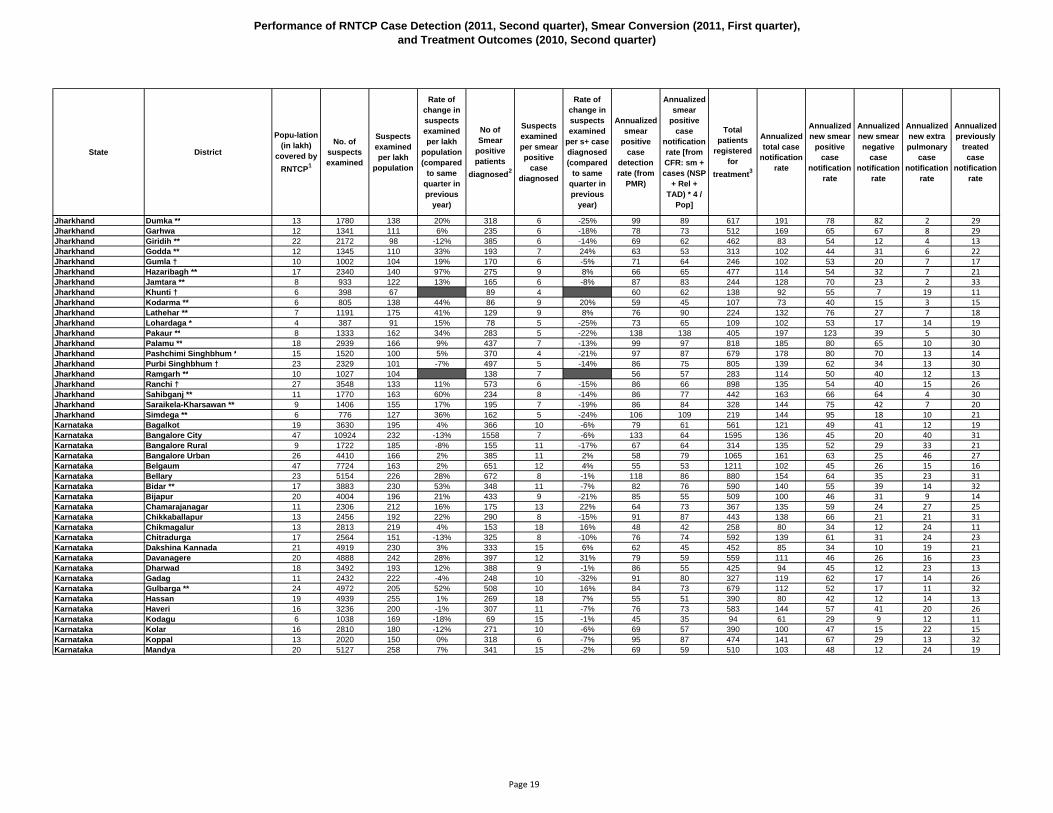
Performance of RNTCP Case Detection (2011, Second quarter), Smear Conversion (2011, First quarter), and Treatment Outcomes (2010, Second quarter)
State District
Popu-lation (in lakh)
covered by RNTCP1
No. of suspects examined
Suspects examined per lakh
population
Rate of change in suspects examined per lakh
population (compared
to same quarter in previous
year)
No of Smear
positive patients
diagnosed2
Suspects examined per smear positive
case diagnosed
Rate of change in suspects examined
per s+ case diagnosed (compared
to same quarter in previous
year)
Annualized smear
positive case
detection rate (from
PMR)
Annualized smear
positive case
notification rate [from CFR: sm + cases (NSP
+ Rel + TAD) * 4 /
Pop]
Total patients
registered for
treatment3
Annualized total case
notification rate
Annualized new smear
positive case
notification rate
Annualized new smear negative
case notification
rate
Annualized new extra pulmonary
case notification
rate
Annualized previously
treated case
notification rate
Andaman & Nicobar Andaman & Nicobar Islands * 5 1081 219 -7% 95 11 14% 77 69 218 177 57 44 54 21Andhra Pradesh Adilabad * 28 2825 102 -3% 585 5 -12% 84 79 939 135 65 41 11 18Andhra Pradesh Anantapur 41 6436 158 -13% 999 6 -17% 98 77 1335 131 63 27 19 23Andhra Pradesh Bhadrachalam 9 1594 183 -11% 309 5 -17% 142 121 382 175 103 31 11 31Andhra Pradesh Chittoor 42 6557 157 4% 1048 6 -9% 100 65 1183 113 54 20 17 21Andhra Pradesh Cuddapah 29 4578 159 -1% 508 9 9% 71 69 966 134 50 36 17 31Andhra Pradesh East Godavari 55 10558 194 -2% 1102 10 -6% 81 74 1934 142 61 35 22 24Andhra Pradesh Guntur 49 8889 180 -29% 1498 6 -30% 122 94 1894 154 72 35 15 31Andhra Pradesh Hyderabad 41 10287 249 1% 1674 6 -11% 162 77 1822 177 61 31 55 29Andhra Pradesh Karimnagar 39 5468 141 -1% 855 6 -18% 88 74 1112 114 54 26 8 26Andhra Pradesh Khammam 20 3190 160 -11% 616 5 -9% 123 98 787 157 74 36 12 35Andhra Pradesh Krishna 47 6688 142 -15% 941 7 -10% 80 69 1374 116 54 28 15 20Andhra Pradesh Kurnool 39 5210 133 -6% 743 7 -9% 76 69 1337 136 53 39 14 30Andhra Pradesh Mahbubnagar 39 4745 121 -9% 782 6 -20% 80 74 1102 112 57 19 12 24Andhra Pradesh Medak 30 2822 95 -9% 447 6 5% 60 64 678 91 50 13 11 17Andhra Pradesh Nalgonda 36 3551 98 -9% 822 4 -15% 91 76 1041 115 55 20 15 25Andhra Pradesh Nellore 30 4830 162 -5% 726 7 -11% 98 83 965 130 60 29 8 33Andhra Pradesh Nizamabad 26 5586 213 40% 544 10 23% 83 80 816 125 69 29 11 16Andhra Pradesh Prakasam 34 4805 141 -6% 665 7 -14% 78 77 1041 122 58 26 8 29Andhra Pradesh Rangareddi 39 5102 130 -7% 992 5 -15% 101 87 1516 155 64 29 32 30Andhra Pradesh Srikakulam 28 4627 164 5% 517 9 -4% 73 67 994 141 56 55 9 21Andhra Pradesh Visakhapatnam 42 7401 175 -18% 973 8 -14% 92 77 1465 138 62 33 21 23Andhra Pradesh Vizianagaram 25 4476 178 -8% 606 7 -20% 96 89 999 159 73 30 30 25Andhra Pradesh Warangal 36 4947 137 -14% 958 5 -26% 106 72 953 105 50 18 8 30Andhra Pradesh West Godavari 42 6740 159 6% 881 8 -3% 83 81 1411 133 65 33 9 26Arunachal Pradesh Changlang ** 1 296 208 54% 23 13 -32% 65 65 46 129 48 25 31 25Arunachal Pradesh Dibang Valley 1 149 228 5% 25 6 -49% 153 147 30 183 86 18 18 61Arunachal Pradesh East Kameng * 1 135 208 47% 33 4 -77% 203 142 51 314 74 62 31 148Arunachal Pradesh East Siang * 1 248 249 -4% 31 8 -27% 125 121 58 233 93 64 28 48Arunachal Pradesh Lohit ** 2 266 163 21% 56 5 -30% 137 140 71 174 127 7 10 29Arunachal Pradesh Lower Subansiri * 1 187 168 53% 23 8 -32% 83 90 40 144 54 22 22 47Arunachal Pradesh Papum Pare * 1 863 623 -2% 145 6 -34% 419 173 175 506 130 124 113 139Arunachal Pradesh Tawang * 0.4 111 281 26% 10 11 -48% 101 91 17 172 71 41 20 41Arunachal Pradesh Tirap † 1 218 191 -2% 22 10 -9% 77 77 58 204 53 35 74 42Arunachal Pradesh Upper Siang * 0.4 104 276 26% 5 21 80% 53 53 11 117 42 21 42 11Arunachal Pradesh Upper Subansiri * 1 129 206 24% 22 6 -37% 141 128 40 256 102 38 51 64Arunachal Pradesh West Kameng * 1 108 127 -7% 18 6 -26% 85 85 26 123 75 5 33 9Arunachal Pradesh West Siang * 1 110 93 -9% 18 6 -33% 61 75 38 129 61 17 17 17Assam Barpeta 19 1874 99 10% 254 7 -9% 54 53 517 110 44 30 10 26Assam Bongaigaon 10 1590 153 0% 226 7 -4% 87 68 331 127 55 41 7 25Assam Cachar 17 2517 152 2% 357 7 -8% 86 68 668 161 61 51 37 13Assam Darrang 17 2023 117 8% 291 7 -7% 67 60 512 119 50 36 10 23Assam Dhemaji 7 793 121 28% 105 8 56% 64 60 181 111 51 32 13 15Assam Dhubri 19 1984 106 13% 374 5 -22% 80 66 611 130 56 42 3 29
Page 9
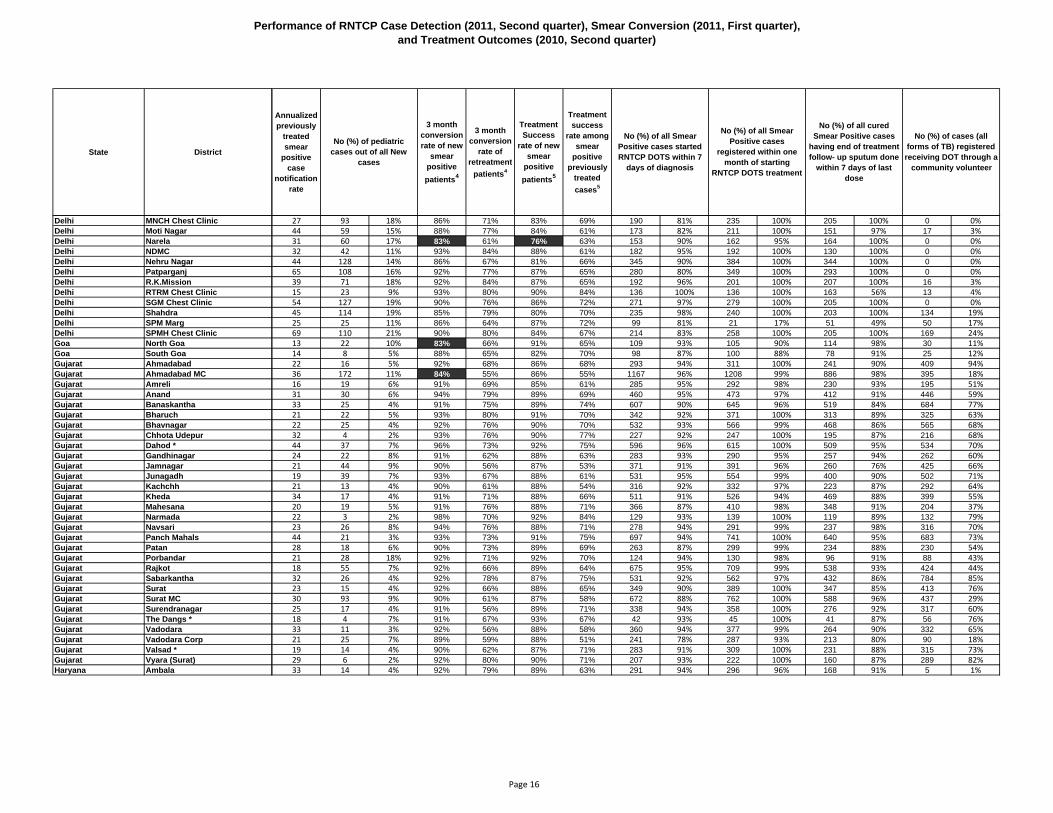
Performance of RNTCP Case Detection (2011, Second quarter), Smear Conversion (2011, First quarter), and Treatment Outcomes (2010, Second quarter)
State District
Andaman & Nicobar Andaman & Nicobar Islands *Andhra Pradesh Adilabad *Andhra Pradesh AnantapurAndhra Pradesh BhadrachalamAndhra Pradesh ChittoorAndhra Pradesh CuddapahAndhra Pradesh East GodavariAndhra Pradesh GunturAndhra Pradesh HyderabadAndhra Pradesh KarimnagarAndhra Pradesh KhammamAndhra Pradesh KrishnaAndhra Pradesh KurnoolAndhra Pradesh MahbubnagarAndhra Pradesh MedakAndhra Pradesh NalgondaAndhra Pradesh NelloreAndhra Pradesh NizamabadAndhra Pradesh PrakasamAndhra Pradesh RangareddiAndhra Pradesh SrikakulamAndhra Pradesh VisakhapatnamAndhra Pradesh VizianagaramAndhra Pradesh WarangalAndhra Pradesh West GodavariArunachal Pradesh Changlang **Arunachal Pradesh Dibang ValleyArunachal Pradesh East Kameng *Arunachal Pradesh East Siang *Arunachal Pradesh Lohit **Arunachal Pradesh Lower Subansiri *Arunachal Pradesh Papum Pare *Arunachal Pradesh Tawang *Arunachal Pradesh Tirap †Arunachal Pradesh Upper Siang *Arunachal Pradesh Upper Subansiri *Arunachal Pradesh West Kameng *Arunachal Pradesh West Siang *Assam BarpetaAssam BongaigaonAssam CacharAssam DarrangAssam DhemajiAssam Dhubri
Annualized previously
treated smear
positive case
notification rate
3 month conversion rate of new
smear positive patients4
3 month conversion
rate of retreatment
patients4
Treatment Success
rate of new smear
positive patients5
Treatment success
rate among smear
positive previously
treated cases5
15 14 7% 100% 70% 81% 61% 79 88% 73 81% 56 81% 49 22%16 30 4% 91% 59% 90% 69% 493 87% 565 100% 373 84% 921 98%16 39 4% 86% 67% 85% 64% 707 88% 782 97% 574 77% 1247 93%22 4 1% 89% 74% 92% 82% 253 93% 268 98% 138 62% 258 68%13 35 4% 91% 70% 86% 67% 657 93% 694 99% 491 80% 1053 89%21 21 3% 91% 68% 89% 77% 425 84% 481 95% 340 79% 857 89%14 65 4% 97% 89% 90% 73% 909 89% 998 98% 730 91% 1836 95%25 46 3% 94% 84% 92% 74% 1104 93% 1187 100% 893 88% 1474 78%18 169 11% 93% 71% 88% 68% 783 96% 812 100% 653 94% 745 41%22 23 3% 91% 76% 90% 75% 662 89% 719 97% 531 88% 893 80%28 16 3% 91% 84% 88% 79% 451 88% 513 100% 372 81% 679 86%16 50 4% 93% 70% 90% 68% 723 88% 793 96% 563 81% 663 48%19 62 6% 90% 70% 84% 66% 592 83% 714 100% 403 66% 1274 95%20 41 5% 90% 74% 86% 72% 700 93% 737 97% 547 84% 1043 95%15 26 5% 88% 62% 86% 62% 412 86% 443 92% 297 71% 569 84%21 45 6% 90% 69% 91% 71% 602 87% 635 92% 440 75% 959 92%26 19 3% 89% 62% 85% 61% 571 90% 634 100% 406 87% 965 100%13 35 5% 91% 74% 88% 75% 504 94% 520 97% 388 86% 734 90%22 22 3% 91% 72% 89% 78% 566 83% 681 99% 536 92% 1022 98%24 87 7% 90% 74% 86% 75% 816 94% 865 100% 660 92% 1205 79%12 50 6% 94% 85% 94% 79% 403 84% 444 93% 303 73% 852 86%18 84 7% 94% 84% 91% 79% 778 93% 841 100% 612 88% 1312 90%18 77 9% 94% 79% 91% 77% 509 90% 554 98% 408 85% 918 92%24 18 3% 91% 82% 88% 75% 598 90% 631 95% 512 82% 953 100%17 43 4% 95% 86% 92% 83% 845 97% 865 100% 548 73% 793 56%17 4 11% 83% 75% 89% 67% 18 78% 22 96% 17 89% 22 48%61 3 15% 89% 100% 87% 100% 24 100% 24 100% 22 100% 4 13%68 6 22% 83% 100% 100% 50% 20 87% 23 100% 4 57% 2 4%36 4 9% 100% 63% 89% 60% 32 100% 30 94% 27 90% 17 29%15 2 3% 83% 100% 81% 62% 2 3% 58 100% 32 100% 7 10%40 3 11% 78% 50% 100% 75% 26 100% 26 100% 18 90% 5 13%46 20 16% 97% 67% 91% 71% 59 97% 61 100% 50 89% 103 59%20 1 8% 100% 100% 80% 100% 9 100% 9 100% 6 86% 3 18%25 6 13% 95% 60% 91% 100% 20 91% 20 91% 24 100% 25 43%11 1 10% 70% 50% 67% 100% 5 100% 5 100% 4 57% 0 0%32 0 0% 100% 83% 78% 19 90% 21 100% 14 100% 3 8%9 2 8% 100% 92% 100% 18 100% 18 100% 11 85% 7 27%14 5 15% 91% 83% 84% 40% 22 100% 22 100% 18 100% 0 0%10 17 4% 81% 50% 82% 55% 218 86% 250 98% 113 63% 17 3%16 8 3% 89% 78% 86% 67% 161 87% 168 91% 59 39% 63 19%8 29 5% 88% 75% 81% 67% 256 89% 282 98% 152 70% 333 50%11 10 2% 86% 58% 83% 56% 241 92% 258 98% 176 83% 228 45%9 9 6% 92% 73% 93% 82% 89 91% 98 100% 79 76% 74 41%13 19 4% 90% 66% 88% 72% 240 75% 230 72% 153 63% 382 63%
No (%) of all Smear Positive cases started RNTCP DOTS within 7
days of diagnosis
No (%) of cases (all forms of TB) registered
receiving DOT through a community volunteer
No (%) of all Smear Positive cases
registered within one month of starting
RNTCP DOTS treatment
No (%) of pediatric cases out of all New
cases
No (%) of all cured Smear Positive cases
having end of treatment follow- up sputum done
within 7 days of last dose
Page 10
Performance of RNTCP Case Detection (2011, Second quarter), Smear Conversion (2011, First quarter), and Treatment Outcomes (2010, Second quarter)
State District
Popu-lation (in lakh)
covered by RNTCP1
No. of suspects examined
Suspects examined per lakh
population
Rate of change in suspects examined per lakh
population (compared
to same quarter in previous
year)
No of Smear
positive patients
diagnosed2
Suspects examined per smear positive
case diagnosed
Rate of change in suspects examined
per s+ case diagnosed (compared
to same quarter in previous
year)
Annualized smear
positive case
detection rate (from
PMR)
Annualized smear
positive case
notification rate [from CFR: sm + cases (NSP
+ Rel + TAD) * 4 /
Pop]
Total patients
registered for
treatment3
Annualized total case
notification rate
Annualized new smear
positive case
notification rate
Annualized new smear negative
case notification
rate
Annualized new extra pulmonary
case notification
rate
Annualized previously
treated case
notification rate
Assam Dibrugarh 13 1985 148 15% 423 5 -2% 126 84 660 196 72 31 73 20Assam Goalpara 9 1062 113 12% 153 7 18% 65 61 233 99 51 25 5 18Assam Golaghat 11 1238 114 15% 196 6 -2% 72 65 390 144 57 48 24 15Assam Hailakandi 6 1048 168 10% 94 11 20% 60 45 150 96 37 28 17 15Assam Jorhat 12 1731 149 39% 218 8 15% 75 66 406 140 51 37 32 19Assam Kamrup 29 4130 143 8% 745 6 -11% 103 80 1139 158 56 37 19 46Assam Karbi Anglong * 9 1110 119 14% 199 6 -29% 85 77 435 187 71 74 15 26Assam Karimganj 12 1297 113 -13% 155 8 -11% 54 43 283 98 36 23 22 17Assam Kokrajhar 11 1157 108 20% 215 5 24% 81 81 386 145 72 40 5 27Assam Lakhimpur 10 946 93 7% 196 5 -33% 77 66 250 98 53 18 8 19Assam Marigaon 9 1196 134 32% 156 8 -17% 70 58 279 125 52 46 4 23Assam Nagaon 27 3382 127 16% 446 8 -7% 67 58 688 104 50 26 9 18Assam Nalbari 13 1323 101 33% 192 7 -8% 59 58 372 114 50 27 17 20Assam North Cachar Hills * 2 349 163 8% 39 9 -19% 73 64 62 116 43 34 11 28Assam Sibsagar 12 1419 117 11% 256 6 -11% 85 89 503 167 68 31 35 32Assam Sonitpur 19 2991 155 12% 541 6 -3% 112 101 888 184 87 45 22 30Assam Tinsukia 13 2216 168 -6% 446 5 -19% 135 104 680 206 88 31 59 28Bihar Araria ** 25 2324 93 31% 310 7 -12% 49 42 510 81 40 33 2 6Bihar Arwal 7 734 102 -12% 81 9 39% 45 41 124 69 31 19 1 18Bihar Aurangabad-BI ** 24 2326 98 10% 285 8 -14% 48 42 397 67 34 14 4 14Bihar Banka ** 19 1861 98 -7% 172 11 11% 36 42 372 78 36 21 2 19Bihar Begusarai ** 28 3343 121 10% 427 8 9% 62 60 823 119 49 45 6 20Bihar Bhagalpur ** 29 4640 162 -11% 517 9 -3% 72 62 877 122 52 38 13 19Bihar Bhojpur ** 26 1809 69 7% 204 9 -32% 31 27 351 53 20 12 3 18Bihar Buxar 17 1479 89 -17% 141 10 -11% 34 33 251 61 23 20 3 15Bihar Darbhanga ** 39 4405 114 13% 615 7 -23% 64 52 870 90 42 15 15 18Bihar Gaya ** 41 2154 53 3% 423 5 -26% 41 33 980 96 27 39 6 17Bihar Gopalganj ** 25 2412 95 5% 249 10 27% 39 36 367 58 27 11 3 16Bihar Jamui ** 16 1076 65 -20% 125 9 52% 30 31 306 74 25 30 2 18Bihar Jehanabad ** 11 1148 108 -8% 148 8 2% 56 51 292 110 38 42 7 23Bihar Kaimur ** 15 1165 77 18% 151 8 -8% 40 35 249 66 26 20 1 18Bihar Katihar ** 28 3148 112 5% 512 6 -5% 73 62 587 83 53 12 4 15Bihar Khagaria ** 15 1445 96 -23% 159 9 -21% 42 37 202 54 34 11 2 7Bihar Kishanganj ** 15 1620 106 18% 209 8 -6% 55 53 284 74 48 10 4 12Bihar Lakhisarai ** 9 882 93 -20% 96 9 -24% 41 38 175 74 31 19 3 20Bihar Madhepura ** 18 2168 121 19% 221 10 0% 49 43 259 58 36 10 2 9Bihar Madhubani ** 42 4119 98 -14% 508 8 -2% 48 41 600 57 36 11 2 8Bihar Munger ** 13 1681 126 3% 210 8 11% 63 59 339 101 48 24 12 17Bihar Muzaffarpur ** 44 5075 115 9% 707 7 -16% 64 53 1285 116 45 44 7 20Bihar Nalanda ** 28 2091 75 -10% 294 7 -4% 42 40 482 69 39 23 5 2Bihar Nawada ** 21 1323 62 10% 164 8 37% 31 30 263 49 25 11 3 10Bihar Pashchim Champaran ** 36 3051 85 -22% 465 7 -21% 52 48 551 61 42 8 2 8Bihar Patna 56 6185 111 0% 884 7 -17% 64 42 1606 116 33 41 18 25Bihar Purba Champaran ** 46 3159 68 11% 428 7 -12% 37 32 520 45 28 9 2 6Bihar Purnia ** 30 4480 150 -15% 585 8 -15% 78 66 768 103 55 28 3 16
Page 11
Performance of RNTCP Case Detection (2011, Second quarter), Smear Conversion (2011, First quarter), and Treatment Outcomes (2010, Second quarter)
State District
Assam DibrugarhAssam GoalparaAssam GolaghatAssam HailakandiAssam JorhatAssam KamrupAssam Karbi Anglong *Assam KarimganjAssam KokrajharAssam LakhimpurAssam MarigaonAssam NagaonAssam NalbariAssam North Cachar Hills *Assam SibsagarAssam SonitpurAssam TinsukiaBihar Araria **Bihar ArwalBihar Aurangabad-BI **Bihar Banka **Bihar Begusarai **Bihar Bhagalpur **Bihar Bhojpur **Bihar BuxarBihar Darbhanga **Bihar Gaya **Bihar Gopalganj **Bihar Jamui **Bihar Jehanabad **Bihar Kaimur **Bihar Katihar **Bihar Khagaria **Bihar Kishanganj **Bihar Lakhisarai **Bihar Madhepura **Bihar Madhubani **Bihar Munger **Bihar Muzaffarpur **Bihar Nalanda **Bihar Nawada **Bihar Pashchim Champaran **Bihar PatnaBihar Purba Champaran **Bihar Purnia **
Annualized previously
treated smear
positive case
notification rate
3 month conversion rate of new
smear positive patients4
3 month conversion
rate of retreatment
patients4
Treatment Success
rate of new smear
positive patients5
Treatment success
rate among smear
positive previously
treated cases5
No (%) of all Smear Positive cases started RNTCP DOTS within 7
days of diagnosis
No (%) of cases (all forms of TB) registered
receiving DOT through a community volunteer
No (%) of all Smear Positive cases
registered within one month of starting
RNTCP DOTS treatment
No (%) of pediatric cases out of all New
cases
No (%) of all cured Smear Positive cases
having end of treatment follow- up sputum done
within 7 days of last dose
13 67 11% 89% 76% 91% 78% 269 94% 259 91% 210 88% 193 29%11 6 3% 87% 53% 79% 39% 138 94% 147 100% 125 93% 67 29%8 19 5% 88% 65% 80% 56% 155 88% 171 97% 115 85% 100 26%9 7 6% 94% 54% 80% 88% 47 65% 71 99% 47 59% 34 23%15 27 8% 89% 63% 79% 59% 188 98% 192 100% 147 94% 146 36%27 20 2% 87% 66% 86% 66% 514 85% 567 94% 362 82% 244 21%8 9 2% 86% 74% 79% 43% 161 87% 177 96% 42 44% 156 36%8 8 3% 84% 64% 83% 67% 107 85% 125 99% 86 80% 106 37%10 11 4% 79% 47% 80% 63% 190 88% 179 82% 136 78% 144 37%14 9 4% 89% 74% 92% 68% 157 92% 170 100% 138 85% 217 87%7 12 5% 88% 42% 76% 51% 114 86% 128 97% 77 75% 48 17%8 10 2% 93% 67% 87% 78% 301 78% 368 95% 278 82% 165 24%10 10 3% 86% 69% 79% 69% 177 91% 195 100% 93 63% 151 41%22 0 0% 84% 60% 82% 50% 33 94% 35 100% 15 58% 19 31%21 29 7% 87% 50% 77% 51% 178 66% 223 83% 106 71% 183 36%16 48 6% 83% 58% 79% 65% 451 91% 487 98% 301 84% 249 28%17 76 13% 91% 81% 85% 75% 312 90% 220 64% 236 78% 176 26%3 46 10% 88% 65% 87% 57% 187 70% 257 96% 158 77% 57 11%11 3 3% 83% 94% 97% 95% 70 95% 74 100% 52 81% 100 81%9 17 5% 84% 72% 77% 60% 231 90% 258 100% 137 85% 170 43%6 7 2% 73% 60% 80% 91% 176 88% 174 87% 61 75% 153 41%11 63 9% 91% 90% 93% 89% 382 92% 417 100% 379 89% 774 94%10 72 10% 91% 83% 91% 77% 426 95% 447 100% 357 93% 175 20%8 21 9% 84% 73% 80% 68% 146 80% 158 86% 119 74% 40 11%10 18 9% 92% 90% 91% 76% 132 95% 137 99% 92 81% 246 98%11 72 10% 91% 75% 87% 76% 481 94% 509 100% 318 90% 784 90%5 36 4% 84% 73% 94% 83% 252 75% 329 98% 191 74% 559 57%9 17 6% 95% 78% 93% 96% 178 78% 228 100% 160 87% 350 95%7 19 8% 70% 45% 79% 86% 119 92% 129 100% 56 66% 274 90%14 19 8% 90% 88% 88% 80% 132 97% 133 98% 111 90% 240 82%10 7 4% 87% 79% 84% 62% 128 94% 136 100% 78 78% 95 38%10 38 8% 87% 65% 81% 67% 357 81% 443 100% 363 100% 446 76%4 14 8% 87% 72% 86% 83% 120 85% 142 100% 108 66% 6 3%5 10 4% 89% 48% 90% 84% 185 91% 203 100% 175 85% 257 90%8 10 8% 83% 63% 79% 92% 91 98% 91 98% 55 82% 72 41%7 16 7% 90% 73% 96% 91% 185 95% 194 99% 214 89% 9 3%5 27 5% 88% 70% 85% 76% 393 91% 429 100% 329 74% 486 81%11 27 10% 85% 65% 87% 76% 182 93% 196 100% 93 56% 171 50%8 56 5% 91% 78% 88% 81% 431 74% 524 89% 348 75% 870 68%1 29 6% 92% 74% 93% 88% 260 93% 269 96% 219 86% 432 90%5 9 4% 98% 77% 98% 96% 158 99% 159 100% 149 82% 145 55%6 20 4% 95% 84% 94% 88% 362 83% 409 94% 420 86% 3 1%10 193 15% 89% 75% 89% 69% 483 81% 559 94% 401 76% 121 8%4 17 4% 90% 74% 96% 95% 298 80% 370 100% 252 81% 302 58%11 37 6% 90% 75% 90% 81% 454 91% 495 100% 420 93% 733 95%
Page 12
Performance of RNTCP Case Detection (2011, Second quarter), Smear Conversion (2011, First quarter), and Treatment Outcomes (2010, Second quarter)
State District
Popu-lation (in lakh)
covered by RNTCP1
No. of suspects examined
Suspects examined per lakh
population
Rate of change in suspects examined per lakh
population (compared
to same quarter in previous
year)
No of Smear
positive patients
diagnosed2
Suspects examined per smear positive
case diagnosed
Rate of change in suspects examined
per s+ case diagnosed (compared
to same quarter in previous
year)
Annualized smear
positive case
detection rate (from
PMR)
Annualized smear
positive case
notification rate [from CFR: sm + cases (NSP
+ Rel + TAD) * 4 /
Pop]
Total patients
registered for
treatment3
Annualized total case
notification rate
Annualized new smear
positive case
notification rate
Annualized new smear negative
case notification
rate
Annualized new extra pulmonary
case notification
rate
Annualized previously
treated case
notification rate
Bihar Rohtas 29 3418 118 2% 367 9 7% 51 45 519 72 39 19 1 12Bihar Saharsa ** 18 1780 100 -21% 168 11 -2% 38 35 367 83 34 40 2 6Bihar Samastipur ** 40 4335 108 13% 580 7 22% 58 53 1008 100 43 28 8 20Bihar Saran ** 38 2449 64 15% 278 9 13% 29 28 591 62 23 20 5 14Bihar Sheikhpura ** 6 809 131 -1% 53 15 15% 34 22 127 82 19 32 5 9Bihar Sheohar 6 591 97 10% 54 11 49% 36 37 182 120 29 58 9 23Bihar Sitamarhi ** 31 3544 113 10% 494 7 9% 63 61 844 107 53 29 10 16Bihar Siwan 32 3188 100 -13% 399 8 7% 50 43 733 92 32 27 1 32Bihar Supaul ** 21 1667 81 10% 157 11 -28% 31 30 253 49 25 11 1 12Bihar Vaishali ** 32 3418 107 2% 382 9 -15% 48 43 912 114 34 48 7 26Chandigarh Chandigarh 14 4720 328 3% 629 8 -18% 175 86 683 190 61 18 73 38Chhattisgarh Bastar * 15 1437 95 0% 228 6 -31% 60 47 477 126 37 49 18 21Chhattisgarh Bilaspur-CG 23 2658 114 -2% 341 8 -11% 59 55 673 116 47 34 21 14Chhattisgarh Dantewada * 8 859 102 0% 188 5 -36% 90 69 234 112 61 29 8 13Chhattisgarh Dhamtari 8 699 85 -25% 110 6 -43% 54 43 167 81 39 25 8 8Chhattisgarh Durg 33 3638 111 -14% 330 11 5% 40 37 922 113 33 48 23 9Chhattisgarh Janjgir 15 2154 140 27% 231 9 -14% 60 62 508 132 52 55 7 18Chhattisgarh Jashpur * 9 646 75 24% 94 7 -24% 44 31 165 76 27 36 2 12Chhattisgarh Kanker * 8 1007 133 -3% 120 8 4% 63 67 247 130 58 42 15 14Chhattisgarh Kawardha ** 7 482 71 33% 72 7 -24% 42 39 100 59 35 9 6 9Chhattisgarh Korba 12 1594 135 5% 181 9 7% 61 56 413 140 50 50 26 14Chhattisgarh Koriya ** 7 561 82 -10% 48 12 6% 28 25 149 87 22 45 8 13Chhattisgarh Mahasamund 10 834 83 12% 112 7 -19% 45 43 234 93 38 37 10 8Chhattisgarh Raigarh-CG ** 15 1155 78 2% 193 6 8% 52 49 386 105 44 46 6 9Chhattisgarh Raipur 35 4107 117 -13% 658 6 -29% 75 64 1146 131 56 37 23 15Chhattisgarh Rajnandgaon 15 1670 112 -10% 244 7 -8% 65 65 468 125 57 30 20 18Chhattisgarh Surguja † 23 2385 104 6% 318 8 -8% 55 53 729 127 48 55 10 14D & N Haveli Dadra & Nagar Haveli † 4 593 168 9% 87 7 3% 98 70 114 129 49 19 25 36Daman & Diu Daman 2 506 260 17% 47 11 -13% 97 55 72 148 43 53 18 33Daman & Diu Diu 0.8 161 214 -40% 9 18 -34% 48 21 8 42 11 5 16 11Delhi BJRM Chest Clinic 5 1206 222 -3% 167 7 -27% 123 125 424 313 91 57 102 61Delhi BSA Chest Clinic 5 679 125 1% 128 5 -37% 94 86 376 277 66 68 102 41Delhi CD Chest Clinic 5 661 122 -27% 123 5 -44% 91 74 312 230 57 44 56 35Delhi DDU Chest Clinic 21 2412 117 -26% 305 8 -10% 59 63 1083 210 43 38 90 39Delhi DFIT Chest Clinic 10 2059 206 -47% 363 6 -37% 145 129 740 296 89 38 88 80Delhi GTB Chest Clinic 7 1922 295 -24% 336 6 -36% 206 147 691 424 103 74 153 95Delhi Gulabi Bagh 11 1415 130 -19% 209 7 -19% 77 63 496 183 43 30 74 36Delhi Hedgewar Chest Clinic 5 893 165 -2% 138 6 -24% 102 79 280 206 63 24 80 38Delhi Jhandewalan 5 1195 220 36% 186 6 -7% 137 124 500 369 90 75 126 77Delhi Karawal Nagar 7 1564 240 18% 297 5 -7% 182 192 861 529 138 79 211 102Delhi Kingsway Camp 5 1061 196 -13% 207 5 -36% 153 144 451 332 98 49 99 80Delhi LN Chest Clinic 5 1416 261 -20% 168 8 -15% 124 74 273 201 48 19 84 50Delhi LRS 11 1788 165 -13% 235 8 -21% 87 150 1106 408 108 68 152 77
Page 13
Performance of RNTCP Case Detection (2011, Second quarter), Smear Conversion (2011, First quarter), and Treatment Outcomes (2010, Second quarter)
State District
Bihar RohtasBihar Saharsa **Bihar Samastipur **Bihar Saran **Bihar Sheikhpura **Bihar SheoharBihar Sitamarhi **Bihar SiwanBihar Supaul **Bihar Vaishali **Chandigarh ChandigarhChhattisgarh Bastar *Chhattisgarh Bilaspur-CGChhattisgarh Dantewada *Chhattisgarh DhamtariChhattisgarh DurgChhattisgarh JanjgirChhattisgarh Jashpur *Chhattisgarh Kanker *Chhattisgarh Kawardha **Chhattisgarh KorbaChhattisgarh Koriya **Chhattisgarh MahasamundChhattisgarh Raigarh-CG **Chhattisgarh RaipurChhattisgarh RajnandgaonChhattisgarh Surguja †D & N Haveli Dadra & Nagar Haveli †Daman & Diu DamanDaman & Diu DiuDelhi BJRM Chest ClinicDelhi BSA Chest ClinicDelhi CD Chest ClinicDelhi DDU Chest ClinicDelhi DFIT Chest ClinicDelhi GTB Chest ClinicDelhi Gulabi BaghDelhi Hedgewar Chest ClinicDelhi JhandewalanDelhi Karawal NagarDelhi Kingsway CampDelhi LN Chest ClinicDelhi LRS
Annualized previously
treated smear
positive case
notification rate
3 month conversion rate of new
smear positive patients4
3 month conversion
rate of retreatment
patients4
Treatment Success
rate of new smear
positive patients5
Treatment success
rate among smear
positive previously
treated cases5
No (%) of all Smear Positive cases started RNTCP DOTS within 7
days of diagnosis
No (%) of cases (all forms of TB) registered
receiving DOT through a community volunteer
No (%) of all Smear Positive cases
registered within one month of starting
RNTCP DOTS treatment
No (%) of pediatric cases out of all New
cases
No (%) of all cured Smear Positive cases
having end of treatment follow- up sputum done
within 7 days of last dose
6 21 5% 90% 77% 91% 84% 314 95% 329 100% 272 91% 484 93%2 18 5% 97% 93% 96% 86% 140 89% 158 100% 108 79% 132 36%11 56 7% 83% 65% 93% 84% 467 86% 545 100% 330 69% 731 73%5 22 5% 72% 65% 70% 66% 241 90% 269 100% 152 85% 519 88%4 13 12% 88% 80% 92% 100% 36 100% 36 100% 49 89% 127 100%8 8 5% 84% 59% 84% 65% 48 86% 56 100% 33 89% 171 94%10 64 9% 86% 58% 84% 57% 406 82% 480 97% 220 67% 663 79%13 27 6% 89% 81% 92% 97% 319 89% 357 100% 234 75% 641 87%5 2 1% 93% 66% 98% 100% 136 89% 152 99% 94 87% 252 100%10 53 8% 82% 70% 89% 78% 268 76% 350 100% 152 60% 812 89%26 59 11% 87% 76% 89% 80% 294 94% 313 100% 312 99% 153 22%10 22 6% 88% 66% 78% 54% 171 95% 179 99% 94 98% 279 58%9 58 10% 92% 68% 92% 84% 248 77% 293 91% 143 60% 456 68%9 11 5% 61% 35% 61% 58% 87 60% 133 91% 25 40% 50 21%5 5 3% 85% 80% 85% 56% 88 96% 92 100% 83 86% 126 75%5 44 5% 87% 68% 86% 62% 274 89% 307 100% 209 81% 360 39%10 20 5% 88% 80% 98% 96% 221 93% 238 100% 169 86% 289 57%5 3 2% 83% 75% 90% 89% 58 84% 58 84% 38 83% 55 33%9 10 5% 88% 62% 86% 80% 118 92% 127 99% 98 72% 57 23%5 3 4% 95% 75% 82% 50% 52 76% 68 100% 30 75% 48 48%6 30 8% 96% 85% 93% 63% 147 89% 166 100% 160 86% 247 60%4 5 4% 87% 63% 87% 73% 38 88% 43 100% 54 87% 75 50%4 18 8% 92% 92% 81% 65% 98 92% 107 100% 88 75% 209 89%5 16 5% 95% 73% 85% 85% 169 93% 181 100% 115 71% 55 14%9 55 5% 93% 83% 89% 65% 394 69% 564 99% 343 74% 499 44%9 15 4% 89% 64% 86% 53% 223 90% 247 100% 172 83% 278 59%5 49 8% 93% 73% 90% 80% 285 94% 300 99% 237 98% 509 70%26 5 6% 95% 73% 81% 45% 63 95% 66 100% 33 97% 19 17%14 2 4% 94% 80% 88% 70% 27 96% 28 100% 19 100% 18 25%11 1 17% 100% 0% 100% 4 100% 4 100% 3 100% 1 13%33 60 18% 94% 86% 85% 67% 143 85% 169 100% 131 100% 98 23%24 51 16% 93% 62% 80% 59% 110 91% 118 98% 96 100% 151 40%18 21 8% 85% 74% 75% 68% 100 99% 98 97% 74 100% 22 7%22 117 13% 90% 77% 84% 71% 273 81% 335 100% 255 63% 93 9%43 79 15% 320 97% 330 100% 242 361 49%50 86 16% 91% 64% 83% 72% 232 93% 249 100% 171 92% 60 9%22 57 14% 81% 71% 86% 71% 151 85% 177 100% 188 100% 0 0%20 29 13% 86% 63% 86% 60% 107 95% 113 100% 91 95% 2 1%38 75 19% 87% 66% 83% 66% 155 90% 173 100% 140 100% 13 3%61 137 20% 84% 65% 89% 78% 302 93% 323 100% 253 100% 29 3%49 36 11% 92% 64% 88% 76% 194 97% 198 99% 178 98% 26 6%27 40 20% 89% 59% 93% 79% 97 96% 101 100% 117 100% 13 5%45 120 13% 88% 62% 90% 70% 367 88% 417 100% 197 100% 0 0%
Page 14
Performance of RNTCP Case Detection (2011, Second quarter), Smear Conversion (2011, First quarter), and Treatment Outcomes (2010, Second quarter)
State District
Popu-lation (in lakh)
covered by RNTCP1
No. of suspects examined
Suspects examined per lakh
population
Rate of change in suspects examined per lakh
population (compared
to same quarter in previous
year)
No of Smear
positive patients
diagnosed2
Suspects examined per smear positive
case diagnosed
Rate of change in suspects examined
per s+ case diagnosed (compared
to same quarter in previous
year)
Annualized smear
positive case
detection rate (from
PMR)
Annualized smear
positive case
notification rate [from CFR: sm + cases (NSP
+ Rel + TAD) * 4 /
Pop]
Total patients
registered for
treatment3
Annualized total case
notification rate
Annualized new smear
positive case
notification rate
Annualized new smear negative
case notification
rate
Annualized new extra pulmonary
case notification
rate
Annualized previously
treated case
notification rate
Delhi MNCH Chest Clinic 11 856 79 -47% 169 5 -30% 62 86 641 236 60 48 84 45Delhi Moti Nagar 7 1882 289 -15% 303 6 -41% 186 128 511 314 86 41 119 68Delhi Narela 7 1656 254 -7% 210 8 -7% 129 100 434 267 73 55 85 54Delhi NDMC 9 3250 374 -15% 529 6 -18% 244 87 483 223 57 31 84 50Delhi Nehru Nagar 11 2274 210 -22% 463 5 -40% 171 137 1121 413 97 90 145 77Delhi Patparganj 8 2177 287 -11% 384 6 -25% 202 180 863 454 118 62 175 98Delhi R.K.Mission 7 1399 215 -12% 207 7 -17% 127 121 511 314 84 92 70 68Delhi RTRM Chest Clinic 11 1086 100 -53% 173 6 -27% 64 50 316 116 35 19 39 23Delhi SGM Chest Clinic 7 2271 349 1% 305 7 -21% 187 168 839 515 117 138 164 96Delhi Shahdra 5 2246 414 8% 349 6 -17% 257 173 716 528 132 90 212 93Delhi SPM Marg 5 1038 191 22% 169 6 -8% 125 86 290 214 65 32 73 43Delhi SPMH Chest Clinic 5 1751 323 36% 265 7 6% 195 184 696 513 122 59 214 119Goa North Goa 10 2021 203 -19% 182 11 -9% 73 44 264 106 34 20 33 19Goa South Goa 8 956 124 -9% 141 7 -22% 73 57 204 106 45 9 26 26Gujarat Ahmadabad 16 2370 149 -11% 436 5 -21% 109 77 436 109 56 6 14 32Gujarat Ahmadabad MC 52 6920 134 -20% 1589 4 -32% 123 92 2184 169 58 15 43 53Gujarat Amreli 16 2746 169 -22% 343 8 -16% 84 73 381 94 57 5 12 20Gujarat Anand 22 3374 156 0% 686 5 -23% 127 89 758 140 58 25 14 42Gujarat Banaskantha 29 4015 138 -8% 872 5 -27% 119 91 894 122 59 13 7 44Gujarat Bharuch 16 2684 168 5% 461 6 -9% 115 92 514 129 72 11 18 28Gujarat Bhavnagar 29 4448 154 -7% 671 7 -22% 93 78 825 115 57 11 17 29Gujarat Chhota Udepur 11 1661 156 2% 247 7 -6% 93 93 316 119 62 11 8 38Gujarat Dahod * 19 4082 214 -19% 707 6 -35% 148 129 768 161 85 17 10 49Gujarat Gandhinagar 16 2291 147 -17% 364 6 -23% 94 78 434 112 54 6 15 36Gujarat Jamnagar 22 3204 144 -21% 410 8 -17% 73 68 644 115 52 9 24 30Gujarat Junagadh 29 4063 142 -17% 583 7 -24% 82 76 706 99 59 6 8 25Gujarat Kachchh 18 2539 143 -4% 381 7 -11% 86 75 459 103 56 6 12 28Gujarat Kheda 24 3780 160 -1% 762 5 -24% 129 93 730 124 61 11 8 43Gujarat Mahesana 21 3597 168 -21% 537 7 -29% 100 78 552 103 59 7 11 26Gujarat Narmada 6 1316 219 -13% 152 9 -5% 101 91 168 112 71 7 7 27Gujarat Navsari 14 2161 151 -33% 334 6 -35% 93 81 450 126 59 14 20 33Gujarat Panch Mahals 24 4084 173 1% 909 4 -23% 154 121 936 159 82 15 10 51Gujarat Patan 14 3037 220 7% 377 8 -7% 109 86 423 123 59 14 9 41Gujarat Porbandar 6 932 149 -8% 120 8 -14% 77 82 204 130 63 27 10 31Gujarat Rajkot 37 5900 160 -19% 788 7 -23% 86 76 967 105 59 7 15 24Gujarat Sabarkantha 24 3685 152 -8% 812 5 -23% 134 94 925 152 64 28 8 51Gujarat Surat 16 3294 200 -7% 686 5 -18% 167 93 545 133 71 13 17 31Gujarat Surat MC 33 5921 177 -16% 762 8 -12% 91 90 1498 179 61 16 51 50Gujarat Surendranagar 18 2940 166 -16% 516 6 -27% 117 81 529 120 56 13 17 33Gujarat The Dangs * 2 449 206 15% 44 10 13% 81 83 74 136 64 29 17 26Gujarat Vadodara 17 3667 221 19% 584 6 -18% 141 91 509 123 59 7 13 43Gujarat Vadodara Corp 15 2547 167 11% 415 6 11% 109 80 497 130 60 11 25 34Gujarat Valsad * 16 2365 144 -20% 299 8 -17% 73 75 433 105 56 7 14 29Gujarat Vyara (Surat) 8 1398 166 20% 256 5 -27% 122 105 352 167 77 30 18 42Haryana Ambala 12 4660 381 62% 459 10 -5% 150 99 503 165 68 30 26 40
Page 15
Performance of RNTCP Case Detection (2011, Second quarter), Smear Conversion (2011, First quarter), and Treatment Outcomes (2010, Second quarter)
State District
Delhi MNCH Chest ClinicDelhi Moti NagarDelhi NarelaDelhi NDMCDelhi Nehru NagarDelhi PatparganjDelhi R.K.MissionDelhi RTRM Chest ClinicDelhi SGM Chest ClinicDelhi ShahdraDelhi SPM MargDelhi SPMH Chest ClinicGoa North GoaGoa South GoaGujarat AhmadabadGujarat Ahmadabad MCGujarat AmreliGujarat AnandGujarat BanaskanthaGujarat BharuchGujarat BhavnagarGujarat Chhota UdepurGujarat Dahod *Gujarat GandhinagarGujarat JamnagarGujarat JunagadhGujarat KachchhGujarat KhedaGujarat MahesanaGujarat NarmadaGujarat NavsariGujarat Panch MahalsGujarat PatanGujarat PorbandarGujarat RajkotGujarat SabarkanthaGujarat SuratGujarat Surat MCGujarat SurendranagarGujarat The Dangs *Gujarat VadodaraGujarat Vadodara CorpGujarat Valsad *Gujarat Vyara (Surat)Haryana Ambala
Annualized previously
treated smear
positive case
notification rate
3 month conversion rate of new
smear positive patients4
3 month conversion
rate of retreatment
patients4
Treatment Success
rate of new smear
positive patients5
Treatment success
rate among smear
positive previously
treated cases5
No (%) of all Smear Positive cases started RNTCP DOTS within 7
days of diagnosis
No (%) of cases (all forms of TB) registered
receiving DOT through a community volunteer
No (%) of all Smear Positive cases
registered within one month of starting
RNTCP DOTS treatment
No (%) of pediatric cases out of all New
cases
No (%) of all cured Smear Positive cases
having end of treatment follow- up sputum done
within 7 days of last dose
27 93 18% 86% 71% 83% 69% 190 81% 235 100% 205 100% 0 0%44 59 15% 88% 77% 84% 61% 173 82% 211 100% 151 97% 17 3%31 60 17% 83% 61% 76% 63% 153 90% 162 95% 164 100% 0 0%32 42 11% 93% 84% 88% 61% 182 95% 192 100% 130 100% 0 0%44 128 14% 86% 67% 81% 66% 345 90% 384 100% 344 100% 0 0%65 108 16% 92% 77% 87% 65% 280 80% 349 100% 293 100% 0 0%39 71 18% 92% 84% 87% 65% 192 96% 201 100% 207 100% 16 3%15 23 9% 93% 80% 90% 84% 136 100% 136 100% 163 56% 13 4%54 127 19% 90% 76% 86% 72% 271 97% 279 100% 205 100% 0 0%45 114 19% 85% 79% 80% 70% 235 98% 240 100% 203 100% 134 19%25 25 11% 86% 64% 87% 72% 99 81% 21 17% 51 49% 50 17%69 110 21% 90% 80% 84% 67% 214 83% 258 100% 205 100% 169 24%13 22 10% 83% 66% 91% 65% 109 93% 105 90% 114 98% 30 11%14 8 5% 88% 65% 82% 70% 98 87% 100 88% 78 91% 25 12%22 16 5% 92% 68% 86% 68% 293 94% 311 100% 241 90% 409 94%36 172 11% 84% 55% 86% 55% 1167 96% 1208 99% 886 98% 395 18%16 19 6% 91% 69% 85% 61% 285 95% 292 98% 230 93% 195 51%31 30 6% 94% 79% 89% 69% 460 95% 473 97% 412 91% 446 59%33 25 4% 91% 75% 89% 74% 607 90% 645 96% 519 84% 684 77%21 22 5% 93% 80% 91% 70% 342 92% 371 100% 313 89% 325 63%22 25 4% 92% 76% 90% 70% 532 93% 566 99% 468 86% 565 68%32 4 2% 93% 76% 90% 77% 227 92% 247 100% 195 87% 216 68%44 37 7% 96% 73% 92% 75% 596 96% 615 100% 509 95% 534 70%24 22 8% 91% 62% 88% 63% 283 93% 290 95% 257 94% 262 60%21 44 9% 90% 56% 87% 53% 371 91% 391 96% 260 76% 425 66%19 39 7% 93% 67% 88% 61% 531 95% 554 99% 400 90% 502 71%21 13 4% 90% 61% 88% 54% 316 92% 332 97% 223 87% 292 64%34 17 4% 91% 71% 88% 66% 511 91% 526 94% 469 88% 399 55%20 19 5% 91% 76% 88% 71% 366 87% 410 98% 348 91% 204 37%22 3 2% 98% 70% 92% 84% 129 93% 139 100% 119 89% 132 79%23 26 8% 94% 76% 88% 71% 278 94% 291 99% 237 98% 316 70%44 21 3% 93% 73% 91% 75% 697 94% 741 100% 640 95% 683 73%28 18 6% 90% 73% 89% 69% 263 87% 299 99% 234 88% 230 54%21 28 18% 92% 71% 92% 70% 124 94% 130 98% 96 91% 88 43%18 55 7% 92% 66% 89% 64% 675 95% 709 99% 538 93% 424 44%32 26 4% 92% 78% 87% 75% 531 92% 562 97% 432 86% 784 85%23 15 4% 92% 66% 88% 65% 349 90% 389 100% 347 85% 413 76%30 93 9% 90% 61% 87% 58% 672 88% 762 100% 588 96% 437 29%25 17 4% 91% 56% 89% 71% 338 94% 358 100% 276 92% 317 60%18 4 7% 91% 67% 93% 67% 42 93% 45 100% 41 87% 56 76%33 11 3% 92% 56% 88% 58% 360 94% 377 99% 264 90% 332 65%21 25 7% 89% 59% 88% 51% 241 78% 287 93% 213 80% 90 18%19 14 4% 90% 62% 87% 71% 283 91% 309 100% 231 88% 315 73%29 6 2% 92% 80% 90% 71% 207 93% 222 100% 160 87% 289 82%33 14 4% 92% 79% 89% 63% 291 94% 296 96% 168 91% 5 1%
Page 16
Performance of RNTCP Case Detection (2011, Second quarter), Smear Conversion (2011, First quarter), and Treatment Outcomes (2010, Second quarter)
State District
Popu-lation (in lakh)
covered by RNTCP1
No. of suspects examined
Suspects examined per lakh
population
Rate of change in suspects examined per lakh
population (compared
to same quarter in previous
year)
No of Smear
positive patients
diagnosed2
Suspects examined per smear positive
case diagnosed
Rate of change in suspects examined
per s+ case diagnosed (compared
to same quarter in previous
year)
Annualized smear
positive case
detection rate (from
PMR)
Annualized smear
positive case
notification rate [from CFR: sm + cases (NSP
+ Rel + TAD) * 4 /
Pop]
Total patients
registered for
treatment3
Annualized total case
notification rate
Annualized new smear
positive case
notification rate
Annualized new smear negative
case notification
rate
Annualized new extra pulmonary
case notification
rate
Annualized previously
treated case
notification rate
Haryana Bhiwani 17 2521 147 25% 483 5 -18% 112 97 587 137 68 15 15 38Haryana Faridabad 15 2803 190 -1% 461 6 -47% 125 115 975 264 80 42 80 63Haryana Fatehabad 10 1753 180 3% 263 7 -14% 108 78 309 127 53 22 15 37Haryana Gurgaon 12 2924 245 16% 437 7 -17% 146 97 633 212 71 25 71 45Haryana Hisar 19 2965 160 5% 535 6 -18% 115 73 512 110 48 15 9 38Haryana Jhajjar 11 2025 189 85% 244 8 40% 91 124 548 205 89 28 37 51Haryana Jind 14 2635 184 24% 372 7 -25% 104 99 533 149 64 20 21 44Haryana Kaithal ** 11 1728 151 26% 252 7 -16% 88 90 387 136 62 20 15 38Haryana Karnal 15 3408 222 32% 513 7 -20% 133 104 787 205 67 60 26 52Haryana Kurukshetra 10 1741 174 -11% 233 7 -1% 93 85 362 145 61 20 31 32Haryana Mahendragarh 10 1896 194 34% 269 7 -8% 110 78 367 150 52 38 18 42Haryana Mewat ** 8 1009 125 4% 220 5 2% 109 104 357 177 62 24 28 64Haryana Palwal 12 1488 127 -8% 244 6 -30% 84 72 416 142 51 35 22 34Haryana Panchkula 6 2287 404 34% 234 10 7% 165 99 295 208 69 36 52 52Haryana Panipat 12 2191 188 6% 317 7 -30% 109 82 628 215 60 73 36 47Haryana Rewari 9 2312 251 27% 217 11 -11% 94 85 444 192 58 44 39 52Haryana Rohtak 11 4792 422 27% 727 7 -3% 256 126 634 224 81 35 52 56Haryana Sirsa 13 2369 177 7% 388 6 -26% 116 95 503 150 64 14 22 50Haryana Sonipat 15 2850 185 22% 402 7 2% 104 106 818 212 75 49 35 52Haryana Yamunanagar 12 2006 169 16% 312 6 -26% 105 87 442 149 68 20 26 35Himachal Pradesh Bilaspur-HP 4 1094 287 42% 106 10 41% 111 113 186 195 84 34 29 47Himachal Pradesh Chamba 5 1148 223 52% 197 6 -22% 153 169 356 277 121 30 45 80Himachal Pradesh Hamirpur-HP ** 5 1378 299 13% 138 10 -23% 120 103 219 190 75 19 63 33Himachal Pradesh Kangra 15 3698 247 37% 478 8 -14% 128 99 765 205 71 31 56 43Himachal Pradesh Kinnaur * 1 272 290 -1% 30 9 -9% 128 136 67 286 102 21 72 85Himachal Pradesh Kullu 4 1353 319 20% 155 9 20% 146 135 394 371 93 73 121 84Himachal Pradesh Lahul & Spiti * 0.4 158 425 100% 11 14 -25% 118 129 25 269 75 32 97 65Himachal Pradesh Mandi 10 2857 284 33% 296 10 -11% 118 126 629 250 84 38 68 60Himachal Pradesh Shimla 8 2831 351 17% 365 8 -4% 181 113 501 248 87 34 74 53Himachal Pradesh Sirmaur 5 1225 239 29% 181 7 -30% 141 141 330 258 95 45 45 72Himachal Pradesh Solan 6 2666 478 38% 286 9 3% 205 136 419 300 100 63 66 71Himachal Pradesh Una 5 1158 231 41% 130 9 -13% 104 112 215 172 82 26 22 42Jammu & Kashmir Anantnag 14 3476 255 93% 239 15 25% 70 71 325 95 62 11 11 12Jammu & Kashmir Badgam 7 1448 210 26% 120 12 -2% 69 75 165 96 67 5 14 9Jammu & Kashmir Baramula 14 2244 165 45% 193 12 12% 57 50 287 85 45 8 24 7Jammu & Kashmir Doda 8 1483 185 50% 117 13 -1% 58 58 268 133 36 24 45 28Jammu & Kashmir Jammu 18 4911 268 56% 661 7 -7% 145 113 907 198 77 36 34 51Jammu & Kashmir Kargil * 1 460 343 94% 24 19 -63% 72 69 38 113 66 27 15 6Jammu & Kashmir Kathua 6 1235 195 20% 194 6 -19% 123 112 282 178 85 30 28 35Jammu & Kashmir Kupwara 7 1940 260 60% 166 12 1% 89 104 236 127 96 9 10 12Jammu & Kashmir Leh (Ladakh) * 1 347 253 54% 13 27 -2% 38 38 64 187 32 26 123 6Jammu & Kashmir Poonch 4 741 171 30% 78 10 2% 72 71 159 147 62 31 35 19Jammu & Kashmir Pulwama 7 1580 215 39% 146 11 -1% 79 87 220 120 83 19 13 5Jammu & Kashmir Rajouri 6 1380 248 64% 127 11 -2% 91 86 208 149 68 21 34 26Jammu & Kashmir Srinagar 14 4087 284 63% 311 13 18% 86 78 466 129 69 16 34 11Jammu & Kashmir Udhampur 9 2272 264 79% 215 11 6% 100 97 350 163 69 19 42 33Jharkhand Bokaro 21 2985 144 15% 383 8 -3% 74 68 684 132 58 34 17 23Jharkhand Chatra ** 9 999 108 63% 205 5 -9% 89 81 314 136 71 42 0 23Jharkhand Deoghar ** 14 1964 145 7% 243 8 1% 72 67 312 92 59 17 4 12Jharkhand Dhanbad 28 3284 117 -3% 487 7 -3% 70 67 791 113 59 27 8 19
Page 17
Performance of RNTCP Case Detection (2011, Second quarter), Smear Conversion (2011, First quarter), and Treatment Outcomes (2010, Second quarter)
State District
Haryana BhiwaniHaryana FaridabadHaryana FatehabadHaryana GurgaonHaryana HisarHaryana JhajjarHaryana JindHaryana Kaithal **Haryana KarnalHaryana KurukshetraHaryana MahendragarhHaryana Mewat **Haryana PalwalHaryana PanchkulaHaryana PanipatHaryana RewariHaryana RohtakHaryana SirsaHaryana SonipatHaryana YamunanagarHimachal Pradesh Bilaspur-HPHimachal Pradesh ChambaHimachal Pradesh Hamirpur-HP **Himachal Pradesh KangraHimachal Pradesh Kinnaur *Himachal Pradesh KulluHimachal Pradesh Lahul & Spiti *Himachal Pradesh MandiHimachal Pradesh ShimlaHimachal Pradesh SirmaurHimachal Pradesh SolanHimachal Pradesh UnaJammu & Kashmir AnantnagJammu & Kashmir BadgamJammu & Kashmir BaramulaJammu & Kashmir DodaJammu & Kashmir JammuJammu & Kashmir Kargil *Jammu & Kashmir KathuaJammu & Kashmir KupwaraJammu & Kashmir Leh (Ladakh) *Jammu & Kashmir PoonchJammu & Kashmir PulwamaJammu & Kashmir RajouriJammu & Kashmir SrinagarJammu & Kashmir UdhampurJharkhand BokaroJharkhand Chatra **Jharkhand Deoghar **Jharkhand Dhanbad
Annualized previously
treated smear
positive case
notification rate
3 month conversion rate of new
smear positive patients4
3 month conversion
rate of retreatment
patients4
Treatment Success
rate of new smear
positive patients5
Treatment success
rate among smear
positive previously
treated cases5
No (%) of all Smear Positive cases started RNTCP DOTS within 7
days of diagnosis
No (%) of cases (all forms of TB) registered
receiving DOT through a community volunteer
No (%) of all Smear Positive cases
registered within one month of starting
RNTCP DOTS treatment
No (%) of pediatric cases out of all New
cases
No (%) of all cured Smear Positive cases
having end of treatment follow- up sputum done
within 7 days of last dose
32 15 4% 85% 71% 86% 64% 345 80% 302 70% 166 58% 21 4%37 82 11% 91% 73% 85% 65% 392 91% 396 91% 226 85% 66 7%29 14 6% 87% 85% 85% 77% 171 86% 164 82% 146 81% 55 18%28 36 7% 86% 64% 83% 66% 265 90% 273 92% 210 91% 280 44%29 14 4% 91% 77% 86% 68% 324 91% 335 94% 275 87% 107 21%41 31 8% 90% 72% 84% 73% 329 94% 350 100% 192 86% 122 22%38 16 4% 89% 84% 86% 75% 336 91% 339 92% 175 59% 184 35%31 3 1% 92% 81% 79% 71% 252 95% 265 100% 167 93% 67 17%40 28 5% 93% 69% 88% 76% 381 92% 410 99% 261 99% 332 42%26 15 5% 92% 75% 91% 75% 210 96% 205 94% 181 94% 164 45%28 17 6% 89% 73% 82% 62% 181 92% 182 92% 110 85% 105 29%48 31 14% 93% 60% 93% 58% 183 83% 220 100% 139 79% 58 16%22 35 11% 88% 78% 84% 71% 140 65% 145 67% 123 0% 0 0%32 21 9% 93% 88% 85% 63% 130 92% 133 94% 99 95% 102 35%24 33 7% 91% 82% 86% 77% 185 76% 244 100% 168 84% 349 56%29 14 4% 91% 83% 82% 65% 177 89% 193 97% 125 85% 168 38%46 27 6% 89% 72% 89% 73% 324 90% 351 98% 227 76% 90 14%40 12 4% 90% 56% 83% 66% 324 93% 327 94% 194 76% 178 35%33 23 4% 91% 83% 89% 78% 381 91% 409 98% 290 94% 120 15%23 16 5% 88% 60% 85% 66% 247 91% 263 97% 211 92% 364 82%33 6 4% 88% 55% 90% 83% 107 96% 110 99% 111 100% 1 1%57 11 4% 90% 83% 89% 77% 227 99% 223 97% 125 88% 1 0%29 4 2% 95% 78% 86% 77% 115 97% 117 98% 124 95% 21 10%31 51 8% 91% 84% 92% 85% 372 98% 380 100% 321 94% 201 26%43 6 13% 94% 57% 89% 75% 34 100% 34 100% 30 91% 6 9%44 31 10% 93% 78% 91% 87% 138 95% 145 99% 137 88% 14 4%54 0 0% 80% 100% 100% 0% 12 100% 12 100% 10 100% 0 0%45 20 4% 93% 72% 87% 77% 314 96% 323 99% 260 95% 45 7%28 30 8% 94% 78% 94% 87% 216 93% 204 88% 196 98% 15 3%51 9 4% 90% 77% 88% 76% 183 98% 182 97% 112 77% 78 24%39 12 4% 91% 74% 88% 72% 190 98% 190 98% 130 95% 50 12%33 7 4% 87% 84% 93% 64% 142 99% 142 99% 130 100% 42 20%11 38 13% 92% 95% 95% 96% 246 100% 246 100% 238 95% 34 10%9 6 4% 93% 100% 92% 80% 131 100% 131 100% 115 96% 30 18%6 22 8% 93% 80% 92% 82% 164 95% 170 98% 127 98% 16 6%23 21 10% 93% 81% 94% 87% 120 100% 120 100% 120 100% 0 0%39 36 5% 91% 78% 87% 73% 519 98% 520 98% 332 97% 263 29%3 1 3% 100% 100% 83% 0% 23 100% 23 100% 10 100% 7 18%28 14 6% 93% 88% 91% 78% 164 92% 178 100% 105 85% 0 0%11 18 8% 93% 75% 95% 88% 199 100% 199 100% 164 99% 6 3%6 1 2% 83% 60% 86% 50% 13 100% 13 100% 12 92% 5 8%10 5 4% 84% 60% 89% 79% 78 100% 78 100% 47 92% 0 0%4 21 10% 95% 100% 99% 75% 161 100% 161 100% 137 100% 7 3%20 16 9% 88% 74% 89% 91% 122 100% 122 100% 95 100% 0 0%9 36 8% 92% 76% 94% 65% 283 100% 283 100% 250 100% 16 3%29 14 5% 95% 85% 90% 76% 203 96% 205 97% 151 93% 13 4%12 32 6% 88% 60% 86% 71% 346 96% 361 100% 240 73% 548 80%12 9 3% 95% 93% 92% 83% 160 84% 191 100% 144 89% 298 95%8 20 7% 96% 91% 96% 94% 209 92% 227 100% 184 86% 193 62%8 51 8% 93% 87% 90% 83% 416 88% 462 98% 290 77% 441 56%
Page 18
Performance of RNTCP Case Detection (2011, Second quarter), Smear Conversion (2011, First quarter), and Treatment Outcomes (2010, Second quarter)
State District
Popu-lation (in lakh)
covered by RNTCP1
No. of suspects examined
Suspects examined per lakh
population
Rate of change in suspects examined per lakh
population (compared
to same quarter in previous
year)
No of Smear
positive patients
diagnosed2
Suspects examined per smear positive
case diagnosed
Rate of change in suspects examined
per s+ case diagnosed (compared
to same quarter in previous
year)
Annualized smear
positive case
detection rate (from
PMR)
Annualized smear
positive case
notification rate [from CFR: sm + cases (NSP
+ Rel + TAD) * 4 /
Pop]
Total patients
registered for
treatment3
Annualized total case
notification rate
Annualized new smear
positive case
notification rate
Annualized new smear negative
case notification
rate
Annualized new extra pulmonary
case notification
rate
Annualized previously
treated case
notification rate
Jharkhand Dumka ** 13 1780 138 20% 318 6 -25% 99 89 617 191 78 82 2 29Jharkhand Garhwa 12 1341 111 6% 235 6 -18% 78 73 512 169 65 67 8 29Jharkhand Giridih ** 22 2172 98 -12% 385 6 -14% 69 62 462 83 54 12 4 13Jharkhand Godda ** 12 1345 110 33% 193 7 24% 63 53 313 102 44 31 6 22Jharkhand Gumla † 10 1002 104 19% 170 6 -5% 71 64 246 102 53 20 7 17Jharkhand Hazaribagh ** 17 2340 140 97% 275 9 8% 66 65 477 114 54 32 7 21Jharkhand Jamtara ** 8 933 122 13% 165 6 -8% 87 83 244 128 70 23 2 33Jharkhand Khunti † 6 398 67 89 4 60 62 138 92 55 7 19 11Jharkhand Kodarma ** 6 805 138 44% 86 9 20% 59 45 107 73 40 15 3 15Jharkhand Lathehar ** 7 1191 175 41% 129 9 8% 76 90 224 132 76 27 7 18Jharkhand Lohardaga * 4 387 91 15% 78 5 -25% 73 65 109 102 53 17 14 19Jharkhand Pakaur ** 8 1333 162 34% 283 5 -22% 138 138 405 197 123 39 5 30Jharkhand Palamu ** 18 2939 166 9% 437 7 -13% 99 97 818 185 80 65 10 30Jharkhand Pashchimi Singhbhum * 15 1520 100 5% 370 4 -21% 97 87 679 178 80 70 13 14Jharkhand Purbi Singhbhum † 23 2329 101 -7% 497 5 -14% 86 75 805 139 62 34 13 30Jharkhand Ramgarh ** 10 1027 104 138 7 56 57 283 114 50 40 12 13Jharkhand Ranchi † 27 3548 133 11% 573 6 -15% 86 66 898 135 54 40 15 26Jharkhand Sahibganj ** 11 1770 163 60% 234 8 -14% 86 77 442 163 66 64 4 30Jharkhand Saraikela-Kharsawan ** 9 1406 155 17% 195 7 -19% 86 84 328 144 75 42 7 20Jharkhand Simdega ** 6 776 127 36% 162 5 -24% 106 109 219 144 95 18 10 21Karnataka Bagalkot 19 3630 195 4% 366 10 -6% 79 61 561 121 49 41 12 19Karnataka Bangalore City 47 10924 232 -13% 1558 7 -6% 133 64 1595 136 45 20 40 31Karnataka Bangalore Rural 9 1722 185 -8% 155 11 -17% 67 64 314 135 52 29 33 21Karnataka Bangalore Urban 26 4410 166 2% 385 11 2% 58 79 1065 161 63 25 46 27Karnataka Belgaum 47 7724 163 2% 651 12 4% 55 53 1211 102 45 26 15 16Karnataka Bellary 23 5154 226 28% 672 8 -1% 118 86 880 154 64 35 23 31Karnataka Bidar ** 17 3883 230 53% 348 11 -7% 82 76 590 140 55 39 14 32Karnataka Bijapur 20 4004 196 21% 433 9 -21% 85 55 509 100 46 31 9 14Karnataka Chamarajanagar 11 2306 212 16% 175 13 22% 64 73 367 135 59 24 27 25Karnataka Chikkaballapur 13 2456 192 22% 290 8 -15% 91 87 443 138 66 21 21 31Karnataka Chikmagalur 13 2813 219 4% 153 18 16% 48 42 258 80 34 12 24 11Karnataka Chitradurga 17 2564 151 -13% 325 8 -10% 76 74 592 139 61 31 24 23Karnataka Dakshina Kannada 21 4919 230 3% 333 15 6% 62 45 452 85 34 10 19 21Karnataka Davanagere 20 4888 242 28% 397 12 31% 79 59 559 111 46 26 16 23Karnataka Dharwad 18 3492 193 12% 388 9 -1% 86 55 425 94 45 12 23 13Karnataka Gadag 11 2432 222 -4% 248 10 -32% 91 80 327 119 62 17 14 26Karnataka Gulbarga ** 24 4972 205 52% 508 10 16% 84 73 679 112 52 17 11 32Karnataka Hassan 19 4939 255 1% 269 18 7% 55 51 390 80 42 12 14 13Karnataka Haveri 16 3236 200 -1% 307 11 -7% 76 73 583 144 57 41 20 26Karnataka Kodagu 6 1038 169 -18% 69 15 -1% 45 35 94 61 29 9 12 11Karnataka Kolar 16 2810 180 -12% 271 10 -6% 69 57 390 100 47 15 22 15Karnataka Koppal 13 2020 150 0% 318 6 -7% 95 87 474 141 67 29 13 32Karnataka Mandya 20 5127 258 7% 341 15 -2% 69 59 510 103 48 12 24 19
Page 19
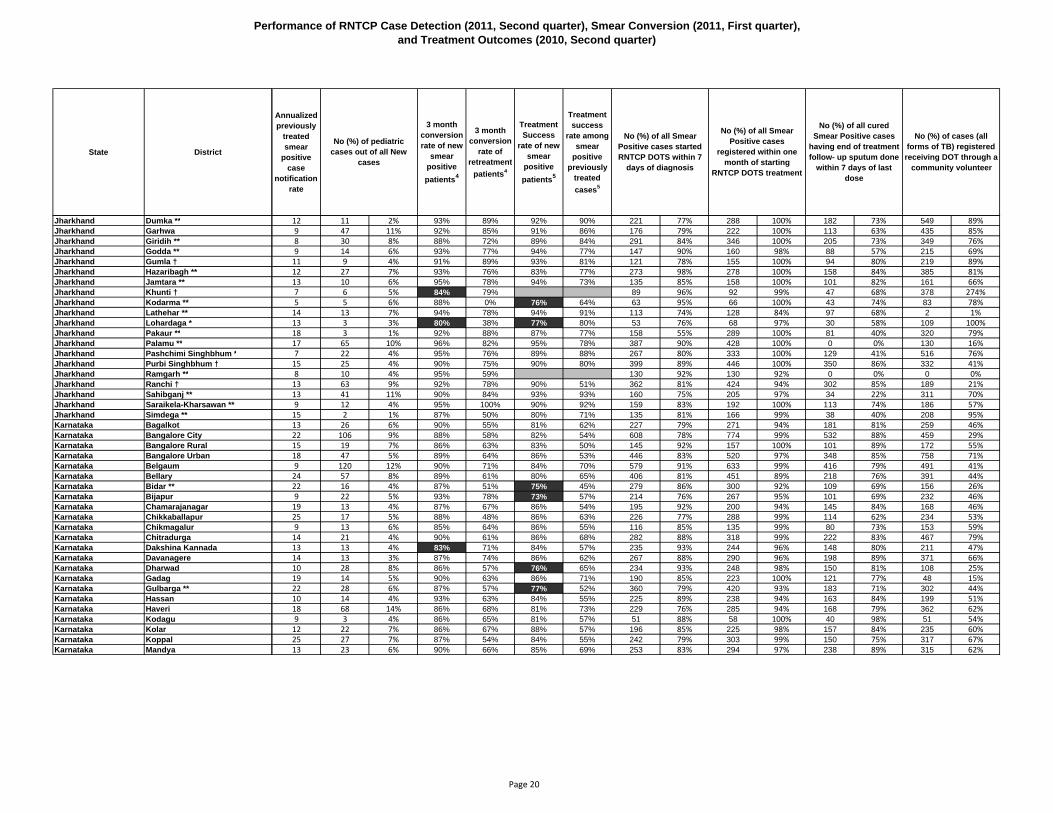
Performance of RNTCP Case Detection (2011, Second quarter), Smear Conversion (2011, First quarter), and Treatment Outcomes (2010, Second quarter)
State District
Jharkhand Dumka **Jharkhand GarhwaJharkhand Giridih **Jharkhand Godda **Jharkhand Gumla †Jharkhand Hazaribagh **Jharkhand Jamtara **Jharkhand Khunti †Jharkhand Kodarma **Jharkhand Lathehar **Jharkhand Lohardaga *Jharkhand Pakaur **Jharkhand Palamu **Jharkhand Pashchimi Singhbhum *Jharkhand Purbi Singhbhum †Jharkhand Ramgarh **Jharkhand Ranchi †Jharkhand Sahibganj **Jharkhand Saraikela-Kharsawan **Jharkhand Simdega **Karnataka BagalkotKarnataka Bangalore CityKarnataka Bangalore RuralKarnataka Bangalore UrbanKarnataka BelgaumKarnataka BellaryKarnataka Bidar **Karnataka BijapurKarnataka ChamarajanagarKarnataka ChikkaballapurKarnataka ChikmagalurKarnataka ChitradurgaKarnataka Dakshina KannadaKarnataka DavanagereKarnataka DharwadKarnataka GadagKarnataka Gulbarga **Karnataka HassanKarnataka HaveriKarnataka KodaguKarnataka KolarKarnataka KoppalKarnataka Mandya
Annualized previously
treated smear
positive case
notification rate
3 month conversion rate of new
smear positive patients4
3 month conversion
rate of retreatment
patients4
Treatment Success
rate of new smear
positive patients5
Treatment success
rate among smear
positive previously
treated cases5
No (%) of all Smear Positive cases started RNTCP DOTS within 7
days of diagnosis
No (%) of cases (all forms of TB) registered
receiving DOT through a community volunteer
No (%) of all Smear Positive cases
registered within one month of starting
RNTCP DOTS treatment
No (%) of pediatric cases out of all New
cases
No (%) of all cured Smear Positive cases
having end of treatment follow- up sputum done
within 7 days of last dose
12 11 2% 93% 89% 92% 90% 221 77% 288 100% 182 73% 549 89%9 47 11% 92% 85% 91% 86% 176 79% 222 100% 113 63% 435 85%8 30 8% 88% 72% 89% 84% 291 84% 346 100% 205 73% 349 76%9 14 6% 93% 77% 94% 77% 147 90% 160 98% 88 57% 215 69%11 9 4% 91% 89% 93% 81% 121 78% 155 100% 94 80% 219 89%12 27 7% 93% 76% 83% 77% 273 98% 278 100% 158 84% 385 81%13 10 6% 95% 78% 94% 73% 135 85% 158 100% 101 82% 161 66%7 6 5% 84% 79% 89 96% 92 99% 47 68% 378 274%5 5 6% 88% 0% 76% 64% 63 95% 66 100% 43 74% 83 78%14 13 7% 94% 78% 94% 91% 113 74% 128 84% 97 68% 2 1%13 3 3% 80% 38% 77% 80% 53 76% 68 97% 30 58% 109 100%18 3 1% 92% 88% 87% 77% 158 55% 289 100% 81 40% 320 79%17 65 10% 96% 82% 95% 78% 387 90% 428 100% 0 0% 130 16%7 22 4% 95% 76% 89% 88% 267 80% 333 100% 129 41% 516 76%15 25 4% 90% 75% 90% 80% 399 89% 446 100% 350 86% 332 41%8 10 4% 95% 59% 130 92% 130 92% 0 0% 0 0%13 63 9% 92% 78% 90% 51% 362 81% 424 94% 302 85% 189 21%13 41 11% 90% 84% 93% 93% 160 75% 205 97% 34 22% 311 70%9 12 4% 95% 100% 90% 92% 159 83% 192 100% 113 74% 186 57%15 2 1% 87% 50% 80% 71% 135 81% 166 99% 38 40% 208 95%13 26 6% 90% 55% 81% 62% 227 79% 271 94% 181 81% 259 46%22 106 9% 88% 58% 82% 54% 608 78% 774 99% 532 88% 459 29%15 19 7% 86% 63% 83% 50% 145 92% 157 100% 101 89% 172 55%18 47 5% 89% 64% 86% 53% 446 83% 520 97% 348 85% 758 71%9 120 12% 90% 71% 84% 70% 579 91% 633 99% 416 79% 491 41%24 57 8% 89% 61% 80% 65% 406 81% 451 89% 218 76% 391 44%22 16 4% 87% 51% 75% 45% 279 86% 300 92% 109 69% 156 26%9 22 5% 93% 78% 73% 57% 214 76% 267 95% 101 69% 232 46%19 13 4% 87% 67% 86% 54% 195 92% 200 94% 145 84% 168 46%25 17 5% 88% 48% 86% 63% 226 77% 288 99% 114 62% 234 53%9 13 6% 85% 64% 86% 55% 116 85% 135 99% 80 73% 153 59%14 21 4% 90% 61% 86% 68% 282 88% 318 99% 222 83% 467 79%13 13 4% 83% 71% 84% 57% 235 93% 244 96% 148 80% 211 47%14 13 3% 87% 74% 86% 62% 267 88% 290 96% 198 89% 371 66%10 28 8% 86% 57% 76% 65% 234 93% 248 98% 150 81% 108 25%19 14 5% 90% 63% 86% 71% 190 85% 223 100% 121 77% 48 15%22 28 6% 87% 57% 77% 52% 360 79% 420 93% 183 71% 302 44%10 14 4% 93% 63% 84% 55% 225 89% 238 94% 163 84% 199 51%18 68 14% 86% 68% 81% 73% 229 76% 285 94% 168 79% 362 62%9 3 4% 86% 65% 81% 57% 51 88% 58 100% 40 98% 51 54%12 22 7% 86% 67% 88% 57% 196 85% 225 98% 157 84% 235 60%25 27 7% 87% 54% 84% 55% 242 79% 303 99% 150 75% 317 67%13 23 6% 90% 66% 85% 69% 253 83% 294 97% 238 89% 315 62%
Page 20
Performance of RNTCP Case Detection (2011, Second quarter), Smear Conversion (2011, First quarter), and Treatment Outcomes (2010, Second quarter)
State District
Popu-lation (in lakh)
covered by RNTCP1
No. of suspects examined
Suspects examined per lakh
population
Rate of change in suspects examined per lakh
population (compared
to same quarter in previous
year)
No of Smear
positive patients
diagnosed2
Suspects examined per smear positive
case diagnosed
Rate of change in suspects examined
per s+ case diagnosed (compared
to same quarter in previous
year)
Annualized smear
positive case
detection rate (from
PMR)
Annualized smear
positive case
notification rate [from CFR: sm + cases (NSP
+ Rel + TAD) * 4 /
Pop]
Total patients
registered for
treatment3
Annualized total case
notification rate
Annualized new smear
positive case
notification rate
Annualized new smear negative
case notification
rate
Annualized new extra pulmonary
case notification
rate
Annualized previously
treated case
notification rate
Karnataka Mysore 30 8053 272 -5% 924 9 -23% 125 70 1011 137 54 29 29 24Karnataka Raichur 19 3404 183 -2% 477 7 -1% 103 86 754 162 66 44 16 36Karnataka Ramanagara 12 2814 237 47% 211 13 18% 71 71 373 126 55 19 27 25Karnataka Shimoga 18 3711 201 7% 289 13 -1% 63 60 488 106 53 22 21 10Karnataka Tumkur 29 6041 208 15% 570 11 19% 78 66 957 132 54 31 25 21Karnataka Udupi 13 2737 219 -3% 216 13 -16% 69 54 276 88 43 14 14 18Karnataka Uttara Kannada 15 2742 180 -11% 172 16 -8% 45 40 315 83 34 22 13 14Karnataka Yadgiri ** 11 2107 192 186 11 68 69 351 128 51 32 9 37Kerala Alappuzha 23 5236 229 -13% 222 24 -11% 39 44 485 85 38 23 15 8Kerala Ernakulam 34 5566 165 -33% 432 13 -34% 51 42 680 81 35 22 12 12Kerala Idukki 12 3659 299 -22% 93 39 -19% 30 29 187 61 25 9 20 7Kerala Kannur 26 5185 198 -27% 216 24 -17% 33 29 398 61 23 11 16 11Kerala Kasaragod 13 1890 145 -37% 88 21 -8% 27 30 204 62 25 11 16 10Kerala Kollam 28 6059 216 16% 310 20 3% 44 42 552 79 38 20 13 8Kerala Kottayam 21 5976 282 -7% 268 22 2% 51 48 461 87 42 12 22 11Kerala Kozhikode 31 5452 174 -27% 287 19 -29% 37 29 550 70 25 16 23 6Kerala Malappuram 39 6772 172 -12% 293 23 -12% 30 28 613 62 25 18 14 6Kerala Palakkad 28 4277 151 -26% 299 14 -26% 42 40 556 78 34 12 21 11Kerala Pathanamthitta 13 2574 193 -1% 174 15 -9% 52 47 282 84 42 13 17 12Kerala Thiruvananthapuram 35 10755 306 -4% 462 23 -14% 53 44 694 79 39 14 17 9Kerala Thrissur 32 6386 198 -9% 406 16 3% 50 41 650 80 36 14 21 10Kerala Wayanad 9 1673 196 -12% 67 25 10% 31 33 183 86 30 24 27 6Lakshadweep Lakshadweep * 0.8 274 361 307% 3 91 16 16 3 16 11 0 0 5Madhya Pradesh Alirajpur † 7 453 68 89 5 53 54 136 81 38 17 5 21Madhya Pradesh Anuppur 9 783 89 101 8 46 47 165 75 41 23 4 8Madhya Pradesh Ashoknagar 10 732 75 147 5 60 64 264 108 51 29 7 22Madhya Pradesh Balaghat ** 17 790 46 -9% 208 4 -14% 48 47 308 71 40 14 6 12Madhya Pradesh Barwani † 13 2070 160 36% 289 7 -22% 89 70 327 101 54 18 9 20Madhya Pradesh Betul ** 17 2728 164 43% 225 12 4% 54 44 324 78 38 23 8 9Madhya Pradesh Bhind 17 1898 111 13% 222 9 -3% 52 43 570 134 33 72 14 14Madhya Pradesh Bhopal 22 5160 235 -32% 968 5 -49% 176 91 1042 190 66 56 20 47Madhya Pradesh Burhanpur ** 7 1375 185 161 9 86 84 267 143 70 44 12 18Madhya Pradesh Chhatarpur ** 18 5484 311 85% 755 7 14% 171 106 697 158 90 39 7 23Madhya Pradesh Chhindwara ** 22 1939 88 14% 384 5 -30% 69 58 497 90 43 21 8 19Madhya Pradesh Damoh ** 13 1703 132 4% 340 5 -11% 105 98 527 163 73 35 19 35Madhya Pradesh Datia 8 767 102 7% 189 4 -21% 101 87 309 165 63 44 18 39Madhya Pradesh Dewas 16 1438 92 2% 206 7 -24% 53 50 337 86 46 17 14 9Madhya Pradesh Dhar † 21 2593 125 -3% 364 7 -25% 70 71 691 133 57 46 10 19Madhya Pradesh Dindori † 7 964 139 22% 125 8 -33% 72 70 182 105 56 18 11 20Madhya Pradesh Guna 10 950 93 -3% 199 5 -39% 78 57 297 117 50 39 12 16Madhya Pradesh Gwalior 19 3826 196 3% 641 6 -17% 132 101 865 178 70 31 31 45Madhya Pradesh Harda ** 6 582 103 3% 84 7 -38% 59 53 155 109 35 37 16 22Madhya Pradesh Hoshangabad ** 13 1831 141 -18% 265 7 -20% 82 77 513 158 65 60 12 21Madhya Pradesh Indore 31 7151 231 0% 896 8 -12% 116 85 1235 160 59 29 31 41Madhya Pradesh Jabalpur 26 4135 160 55% 654 6 16% 101 77 942 145 60 32 24 30Madhya Pradesh Jhabua † 10 1001 100 -12% 195 5 -29% 78 72 343 137 63 53 6 14Madhya Pradesh Katni 13 929 73 -6% 235 4 -11% 74 67 495 156 53 78 9 15Madhya Pradesh Khandwa ** 13 1057 81 -12% 176 6 2% 54 46 283 87 39 33 4 12Madhya Pradesh Khargone ** 18 2363 129 32% 357 7 -12% 78 73 637 139 57 47 15 20
Page 21
Performance of RNTCP Case Detection (2011, Second quarter), Smear Conversion (2011, First quarter), and Treatment Outcomes (2010, Second quarter)
State District
Karnataka MysoreKarnataka RaichurKarnataka RamanagaraKarnataka ShimogaKarnataka TumkurKarnataka UdupiKarnataka Uttara KannadaKarnataka Yadgiri **Kerala AlappuzhaKerala ErnakulamKerala IdukkiKerala KannurKerala KasaragodKerala KollamKerala KottayamKerala KozhikodeKerala MalappuramKerala PalakkadKerala PathanamthittaKerala ThiruvananthapuramKerala ThrissurKerala WayanadLakshadweep Lakshadweep *Madhya Pradesh Alirajpur †Madhya Pradesh AnuppurMadhya Pradesh AshoknagarMadhya Pradesh Balaghat **Madhya Pradesh Barwani †Madhya Pradesh Betul **Madhya Pradesh BhindMadhya Pradesh BhopalMadhya Pradesh Burhanpur **Madhya Pradesh Chhatarpur **Madhya Pradesh Chhindwara **Madhya Pradesh Damoh **Madhya Pradesh DatiaMadhya Pradesh DewasMadhya Pradesh Dhar †Madhya Pradesh Dindori †Madhya Pradesh GunaMadhya Pradesh GwaliorMadhya Pradesh Harda **Madhya Pradesh Hoshangabad **Madhya Pradesh IndoreMadhya Pradesh JabalpurMadhya Pradesh Jhabua †Madhya Pradesh KatniMadhya Pradesh Khandwa **Madhya Pradesh Khargone **
Annualized previously
treated smear
positive case
notification rate
3 month conversion rate of new
smear positive patients4
3 month conversion
rate of retreatment
patients4
Treatment Success
rate of new smear
positive patients5
Treatment success
rate among smear
positive previously
treated cases5
No (%) of all Smear Positive cases started RNTCP DOTS within 7
days of diagnosis
No (%) of cases (all forms of TB) registered
receiving DOT through a community volunteer
No (%) of all Smear Positive cases
registered within one month of starting
RNTCP DOTS treatment
No (%) of pediatric cases out of all New
cases
No (%) of all cured Smear Positive cases
having end of treatment follow- up sputum done
within 7 days of last dose
18 65 8% 84% 59% 77% 53% 471 89% 492 93% 286 79% 262 26%22 55 9% 86% 59% 86% 44% 343 83% 353 86% 247 80% 574 76%17 13 4% 94% 65% 86% 62% 175 81% 210 98% 128 83% 222 60%8 21 5% 88% 73% 89% 76% 258 91% 274 97% 216 94% 230 47.1%14 34 4% 85% 57% 85% 62% 449 91% 488 98% 391 88% 581 61%14 11 5% 88% 61% 89% 66% 172 96% 176 98% 136 96% 182 66%8 21 8% 88% 61% 81% 68% 139 89% 151 96% 104 85% 171 54%21 8 3% 83% 52% 136 69% 169 86% 66 78% 204 58%7 82 19% 85% 65% 86% 68% 244 95% 245 95% 161 77% 367 76%8 85 15% 82% 56% 84% 70% 337 92% 339 93% 253 90% 447 66%5 20 12% 86% 71% 82% 93% 80 86% 91 98% 55 82% 147 79%8 42 13% 87% 71% 85% 70% 187 91% 194 95% 140 87% 213 54%6 5 3% 89% 64% 87% 67% 91 91% 95 95% 85 75% 161 79%5 48 10% 87% 80% 85% 82% 288 95% 303 100% 217 88% 253 46%8 37 9% 85% 67% 87% 67% 234 88% 228 86% 163 84% 172 37%5 84 17% 84% 68% 83% 78% 193 82% 224 95% 145 78% 386 70%5 104 19% 80% 72% 81% 77% 233 80% 260 89% 178 80% 499 81%8 31 7% 81% 66% 82% 75% 231 78% 232 78% 211 77% 393 71%8 27 11% 89% 63% 84% 63% 162 97% 165 99% 83 65% 155 55%7 47 8% 86% 79% 81% 73% 362 90% 364 91% 223 83% 395 57%7 76 13% 85% 65% 87% 64% 305 88% 291 84% 209 78% 446 69%5 22 13% 81% 83% 84% 87% 70 95% 67 91% 60 88% 128 70%5 0 0% 0% 100% 3 100% 3 100% 3 0% 3 100%17 10 10% 85 93% 87 96% 92 50 37%6 17 11% 82 80% 102 100% 14 8 5%14 7 3% 138 87% 159 100% 76 156 59%9 11 4% 90% 57% 88% 74% 179 85% 206 98% 110 64% 227 74%17 12 5% 91% 76% 91% 74% 216 94% 228 100% 137 68% 221 68%7 31 11% 91% 72% 84% 86% 169 90% 187 100% 98 188% 378 117%10 100 20% 87% 70% 80% 69% 160 86% 185 99% 90 62% 410 72%26 86 11% 92% 68% 84% 56% 475 94% 508 100% 399 97% 530 51%17 21 9% 91% 72% 158 98% 161 99% 114 216 81%20 80 13% 96% 79% 93% 73% 461 96% 481 100% 348 96% 627 90%17 8 2% 92% 64% 89% 72% 303 92% 318 97% 141 60% 255 51%26 40 10% 87% 62% 89% 77% 306 96% 313 98% 177 83% 153 29%25 41 17% 91% 49% 90% 70% 158 96% 163 99% 81 74% 151 49%6 24 8% 91% 69% 86% 63% 191 94% 203 100% 142 71% 150 45%15 106 18% 94% 73% 92% 72% 344 91% 364 97% 245 82% 441 64%18 16 11% 87% 67% 85% 60% 101 79% 126 98% 46 53% 144 79%12 11 4% 88% 75% 90% 75% 143 91% 158 100% 112 45% 101 34%33 129 20% 94% 68% 90% 66% 445 88% 504 100% 321 86% 541 63%19 29 23% 89% 47% 91% 42% 75 97% 77 100% 20 39% 71 46%16 74 17% 94% 81% 93% 88% 235 90% 262 100% 219 94% 294 57%28 153 17% 97% 84% 91% 81% 651 96% 674 100% 523 95% 746 60%19 83 11% 94% 66% 92% 59% 459 90% 509 100% 367 79% 640 68%11 48 16% 94% 90% 91% 83% 178 96% 183 99% 136 47% 180 52%14 29 6% 86% 78% 86% 76% 171 80% 211 98% 177 81% 444 90%9 28 11% 91% 86% 88% 73% 130 84% 151 98% 101 37% 240 85%17 79 15% 94% 80% 86% 70% 287 84% 340 100% 268 90% 221 35%
Page 22
Performance of RNTCP Case Detection (2011, Second quarter), Smear Conversion (2011, First quarter), and Treatment Outcomes (2010, Second quarter)
State District
Popu-lation (in lakh)
covered by RNTCP1
No. of suspects examined
Suspects examined per lakh
population
Rate of change in suspects examined per lakh
population (compared
to same quarter in previous
year)
No of Smear
positive patients
diagnosed2
Suspects examined per smear positive
case diagnosed
Rate of change in suspects examined
per s+ case diagnosed (compared
to same quarter in previous
year)
Annualized smear
positive case
detection rate (from
PMR)
Annualized smear
positive case
notification rate [from CFR: sm + cases (NSP
+ Rel + TAD) * 4 /
Pop]
Total patients
registered for
treatment3
Annualized total case
notification rate
Annualized new smear
positive case
notification rate
Annualized new smear negative
case notification
rate
Annualized new extra pulmonary
case notification
rate
Annualized previously
treated case
notification rate
Madhya Pradesh Mandla † 11 1083 101 6% 233 5 -9% 87 77 349 131 64 36 13 15Madhya Pradesh Mandsaur 14 2408 170 53% 358 7 0% 101 94 620 175 66 54 15 40Madhya Pradesh Morena 19 1800 95 14% 302 6 -31% 64 58 493 104 39 16 17 32Madhya Pradesh Narsinghpur ** 11 973 85 -29% 136 7 -28% 48 50 290 101 34 27 16 24Madhya Pradesh Neemuch 9 1486 171 5% 201 7 -15% 93 82 331 153 60 41 14 37Madhya Pradesh Panna ** 10 639 63 13% 197 3 -10% 77 68 251 98 54 18 6 20Madhya Pradesh Raisen ** 13 1067 80 31% 165 6 -15% 49 53 343 102 36 30 6 27Madhya Pradesh Rajgarh 15 1290 86 13% 199 6 -7% 53 48 415 111 35 38 8 30Madhya Pradesh Ratlam 15 1628 112 48% 314 5 -12% 86 76 588 162 49 55 15 44Madhya Pradesh Rewa 24 2908 123 -3% 487 6 -32% 83 72 919 156 59 47 24 25Madhya Pradesh Sagar ** 24 2528 105 7% 518 5 -14% 86 73 692 115 56 29 10 19Madhya Pradesh Satna 22 2857 128 68% 379 8 44% 68 60 853 153 53 57 21 22Madhya Pradesh Sehore ** 13 1009 78 -8% 122 8 -38% 38 38 276 86 31 33 5 17Madhya Pradesh Seoni ** 14 1141 82 101% 192 6 6% 55 50 279 80 35 15 8 22Madhya Pradesh Shahdol 10 882 88 7% 169 5 -23% 67 53 254 101 46 33 6 14Madhya Pradesh Shajapur 15 1295 84 3% 306 4 -26% 79 79 465 121 59 19 15 28Madhya Pradesh Sheopur 7 989 148 51% 276 4 -11% 165 130 331 198 103 47 9 38Madhya Pradesh Shivpuri 17 2385 138 35% 392 6 -10% 91 87 625 145 75 49 3 18Madhya Pradesh Sidhi 12 964 83 -23% 170 6 -34% 59 66 371 128 56 23 25 25Madhya Pradesh Singrauli 10 924 89 147 6 57 48 248 96 40 25 17 14Madhya Pradesh Tikamgarh ** 14 717 50 8% 134 5 -15% 37 32 215 60 26 24 3 6Madhya Pradesh Ujjain 20 2770 135 44% 586 5 -3% 115 82 731 143 56 30 23 34Madhya Pradesh Umaria 6 1318 214 333% 155 9 15% 101 91 220 143 80 27 10 26Madhya Pradesh Vidisha ** 15 1404 97 -13% 238 6 -29% 66 60 519 143 41 56 9 37Maharashtra Ahmadnagar 43 4504 104 -11% 410 11 -3% 38 40 822 76 35 16 13 11Maharashtra Ahmednagar MC 4 573 134 -6% 60 10 6% 56 28 76 71 17 18 16 21Maharashtra Akola 14 1840 128 15% 155 12 13% 43 52 319 88 38 13 16 21Maharashtra Akola MC 5 707 155 31% 163 4 -16% 143 53 116 102 38 13 30 21Maharashtra Amravati MC 6 1350 211 -21% 122 11 -18% 76 58 178 111 38 18 24 32Maharashtra Amravati Rural 24 3588 150 -19% 382 9 -27% 64 57 577 96 42 17 16 22Maharashtra Aurangabad MC 10 3151 310 89% 285 11 74% 112 138 467 184 114 26 16 29Maharashtra Aurangabad-MH ** 24 1348 57 -50% 248 5 -53% 42 23 258 43 17 3 13 10Maharashtra Bhandara 13 2042 154 7% 183 11 5% 55 51 332 100 38 20 17 25Maharashtra Bhiwandi Nizampur 11 969 91 -15% 201 5 -41% 75 65 408 153 48 39 30 36Maharashtra Bid ** 25 3536 141 35% 214 17 75% 34 31 450 72 26 16 19 10Maharashtra Buldana ** 26 3185 123 -7% 593 5 -23% 91 56 630 97 40 22 10 25Maharashtra Chandrapur 24 3147 130 -18% 377 8 -24% 62 49 558 92 41 23 13 15Maharashtra Dhule 16 2380 152 -2% 231 10 -9% 59 67 407 104 58 19 10 16Maharashtra Dhule MC 4 1045 249 -9% 185 6 -28% 176 74 128 122 57 10 26 30Maharashtra Gadchiroli ** 11 1417 125 -13% 243 6 -30% 86 69 331 117 60 24 16 18Maharashtra Gondiya 14 1781 127 -27% 227 8 -30% 65 50 300 86 41 19 13 13Maharashtra Hingoli ** 11 1073 93 -21% 151 7 -30% 53 54 292 102 45 30 12 16Maharashtra Jalgaon 38 3476 91 -14% 447 8 -17% 47 59 1102 115 48 36 13 18Maharashtra Jalgaon MC 5 1351 300 -6% 190 7 -14% 169 61 150 133 51 43 15 23Maharashtra Jalna ** 19 1289 69 -49% 224 6 -40% 48 43 378 81 31 20 11 19Maharashtra Kalyan Dombivli MC 14 1635 118 9% 246 7 16% 71 64 499 144 51 28 29 37Maharashtra Kolhapur 35 4683 133 -33% 395 12 -8% 45 42 650 74 36 15 11 11Maharashtra Kolhapur MC 6 493 87 -27% 46 11 -8% 33 25 97 69 20 18 23 8Maharashtra Latur ** 24 3329 138 -21% 284 12 -25% 47 42 493 81 33 18 14 16
Page 23
Performance of RNTCP Case Detection (2011, Second quarter), Smear Conversion (2011, First quarter), and Treatment Outcomes (2010, Second quarter)
State District
Madhya Pradesh Mandla †Madhya Pradesh MandsaurMadhya Pradesh MorenaMadhya Pradesh Narsinghpur **Madhya Pradesh NeemuchMadhya Pradesh Panna **Madhya Pradesh Raisen **Madhya Pradesh RajgarhMadhya Pradesh RatlamMadhya Pradesh RewaMadhya Pradesh Sagar **Madhya Pradesh SatnaMadhya Pradesh Sehore **Madhya Pradesh Seoni **Madhya Pradesh ShahdolMadhya Pradesh ShajapurMadhya Pradesh SheopurMadhya Pradesh ShivpuriMadhya Pradesh SidhiMadhya Pradesh SingrauliMadhya Pradesh Tikamgarh **Madhya Pradesh UjjainMadhya Pradesh UmariaMadhya Pradesh Vidisha **Maharashtra AhmadnagarMaharashtra Ahmednagar MCMaharashtra AkolaMaharashtra Akola MCMaharashtra Amravati MCMaharashtra Amravati RuralMaharashtra Aurangabad MCMaharashtra Aurangabad-MH **Maharashtra BhandaraMaharashtra Bhiwandi NizampurMaharashtra Bid **Maharashtra Buldana **Maharashtra ChandrapurMaharashtra DhuleMaharashtra Dhule MCMaharashtra Gadchiroli **Maharashtra GondiyaMaharashtra Hingoli **Maharashtra JalgaonMaharashtra Jalgaon MCMaharashtra Jalna **Maharashtra Kalyan Dombivli MCMaharashtra KolhapurMaharashtra Kolhapur MCMaharashtra Latur **
Annualized previously
treated smear
positive case
notification rate
3 month conversion rate of new
smear positive patients4
3 month conversion
rate of retreatment
patients4
Treatment Success
rate of new smear
positive patients5
Treatment success
rate among smear
positive previously
treated cases5
No (%) of all Smear Positive cases started RNTCP DOTS within 7
days of diagnosis
No (%) of cases (all forms of TB) registered
receiving DOT through a community volunteer
No (%) of all Smear Positive cases
registered within one month of starting
RNTCP DOTS treatment
No (%) of pediatric cases out of all New
cases
No (%) of all cured Smear Positive cases
having end of treatment follow- up sputum done
within 7 days of last dose
15 31 10% 92% 70% 90% 81% 136 65% 206 99% 137 70% 286 82%29 43 9% 90% 70% 94% 82% 305 90% 338 100% 194 85% 226 36%21 48 14% 92% 57% 89% 61% 242 84% 277 97% 125 63% 423 86%17 25 11% 88% 65% 87% 73% 100 68% 146 99% 91 66% 232 80%23 10 4% 91% 81% 90% 75% 164 91% 180 100% 114 77% 226 68%14 10 5% 92% 71% 88% 70% 157 90% 175 100% 117 87% 10 4%18 15 6% 86% 76% 86% 83% 108 60% 180 100% 51 48% 25 7%14 22 7% 88% 54% 87% 75% 179 97% 184 100% 106 81% 344 83%30 46 11% 90% 75% 83% 57% 267 93% 271 94% 122 71% 410 70%16 53 7% 89% 77% 92% 84% 418 95% 438 100% 290 93% 738 80%18 46 8% 91% 80% 88% 70% 378 85% 440 98% 234 61% 368 53%9 60 8% 91% 64% 91% 72% 311 90% 328 95% 250 81% 452 53%7 19 9% 90% 80% 87% 84% 116 94% 123 100% 90 89% 206 75%17 10 5% 94% 66% 90% 58% 154 86% 164 91% 82 57% 239 86%8 14 6% 91% 68% 95% 76% 131 96% 135 99% 44 20% 179 70%21 45 13% 92% 92% 88% 91% 297 97% 307 100% 189 91% 363 78%27 38 14% 85% 37% 91% 80% 162 74% 212 97% 94 58% 300 91%13 48 9% 93% 83% 93% 73% 358 95% 373 99% 243 85% 512 82%13 54 18% 85% 61% 90% 87% 136 68% 179 90% 105 53% 213 57%8 22 10% 93 75% 123 99% 34 124 50%6 6 3% 89% 75% 86% 75% 94 81% 115 99% 65 64% 111 52%29 89 16% 91% 67% 91% 71% 406 94% 431 100% 199 85% 447 61%12 11 6% 92% 80% 91% 69% 126 89% 137 96% 30 64% 210 95%20 63 16% 85% 74% 90% 68% 202 92% 202 92% 135 87% 89 17%5 45 6% 90% 62% 89% 56% 400 92% 433 100% 320 88% 107 13%12 1 2% 59% 57% 71% 40% 26 84% 31 100% 12 0% 0 0%17 13 5% 84% 62% 73% 52% 145 73% 199 100% 94 82% 236 74%18 8 9% 73% 25% 65% 50% 55 87% 63 100% 23 0% 7 6%22 4 3% 89% 73% 84% 57% 91 96% 95 100% 68 91% 63 35%16 18 4% 88% 60% 85% 67% 290 83% 350 100% 176 67% 293 51%24 15 4% 94% 77% 90% 78% 324 92% 351 100% 183 66% 191 41%6 15 8% 92% 65% 85% 63% 122 87% 141 100% 116 89% 0 0%15 13 5% 89% 63% 77% 53% 148 85% 174 100% 98 75% 175 53%18 49 16% 84% 55% 80% 39% 154 88% 176 100% 75 95% 113 28%5 12 3% 89% 73% 83% 62% 184 93% 196 99% 145 80% 179 40%18 14 3% 87% 59% 77% 60% 301 81% 366 98% 177 67% 177 28%8 19 4% 90% 67% 87% 61% 249 84% 296 99% 249 86% 238 43%9 13 4% 92% 77% 88% 67% 239 90% 262 98% 188 84% 285 70%17 9 9% 98% 78% 93% 73% 75 96% 78 100% 71 0% 17 13%10 11 4% 86% 63% 87% 52% 169 86% 181 92% 118 84% 143 43%10 12 5% 88% 69% 83% 49% 149 84% 177 100% 135 78% 164 55%12 6 2% 88% 72% 85% 67% 149 91% 152 93% 96 89% 183 63%11 34 4% 89% 74% 85% 64% 466 82% 566 99% 259 69% 492 45%14 8 6% 90% 55% 85% 53% 69 93% 74 100% 47 0% 8 5%14 1 0% 91% 76% 92% 71% 203 97% 209 100% 157 94% 163 43%15 33 9% 89% 61% 82% 50% 207 91% 227 100% 145 89% 38 8%6 35 6% 90% 62% 88% 56% 330 89% 371 100% 236 79% 192 30%6 7 8% 82% 56% 76% 36% 31 86% 33 92% 29 94% 3 3%11 15 4% 90% 50% 85% 43% 240 91% 263 99% 175 85% 212 43%
Page 24
Performance of RNTCP Case Detection (2011, Second quarter), Smear Conversion (2011, First quarter), and Treatment Outcomes (2010, Second quarter)
State District
Popu-lation (in lakh)
covered by RNTCP1
No. of suspects examined
Suspects examined per lakh
population
Rate of change in suspects examined per lakh
population (compared
to same quarter in previous
year)
No of Smear
positive patients
diagnosed2
Suspects examined per smear positive
case diagnosed
Rate of change in suspects examined
per s+ case diagnosed (compared
to same quarter in previous
year)
Annualized smear
positive case
detection rate (from
PMR)
Annualized smear
positive case
notification rate [from CFR: sm + cases (NSP
+ Rel + TAD) * 4 /
Pop]
Total patients
registered for
treatment3
Annualized total case
notification rate
Annualized new smear
positive case
notification rate
Annualized new smear negative
case notification
rate
Annualized new extra pulmonary
case notification
rate
Annualized previously
treated case
notification rate
Maharashtra Malegoan Corporation 5 878 176 36% 147 6 -18% 118 94 244 195 73 38 54 30Maharashtra Mira Bhayander 10 810 81 9% 156 5 -17% 62 59 241 96 40 9 20 27Maharashtra Mumbai 139 21159 153 -13% 3394 6 -3% 98 88 7371 213 59 43 47 63Maharashtra Nagpur MC 24 3340 140 -25% 553 6 -23% 93 70 858 144 55 23 34 31Maharashtra Nagpur Rural 23 3427 147 11% 429 8 -9% 74 62 618 106 53 26 11 15Maharashtra Nanded ** 28 2473 87 -29% 327 8 -15% 46 43 605 85 35 22 16 12Maharashtra Nanded Waghela MC 5 818 163 6% 113 7 -11% 90 53 124 99 46 18 26 10Maharashtra Nandurbar * 15 1679 110 -16% 301 6 -38% 79 69 480 126 56 35 13 22Maharashtra Nashik 41 4768 118 -2% 534 9 -15% 53 50 865 85 45 22 9 10Maharashtra Nashik Corp 13 1556 124 -9% 234 7 -8% 75 62 348 111 54 33 10 13Maharashtra Navi Mumbai 8 2192 267 -13% 341 6 -10% 166 111 477 233 85 28 61 59Maharashtra Osmanabad ** 17 1716 100 -12% 197 9 -26% 46 46 338 79 39 17 11 11Maharashtra Parbhani ** 17 2075 120 -7% 197 11 8% 45 48 426 98 36 29 17 16Maharashtra Pimpri Chinchwad 12 1834 156 -26% 234 8 -14% 80 65 445 152 51 22 51 29Maharashtra Pune 30 3296 111 -4% 395 8 -14% 53 63 966 131 52 17 38 24Maharashtra Pune Rural 43 6950 162 -18% 825 8 -2% 77 53 938 88 44 14 15 15Maharashtra Raigarh-Mh 26 3227 126 -27% 510 6 -23% 79 73 848 132 56 25 22 29Maharashtra Ratnagiri 20 3474 176 -7% 331 10 -5% 67 68 698 141 55 45 14 27Maharashtra Sangli 25 5561 223 5% 452 12 -20% 72 64 708 113 57 24 13 20Maharashtra Sangli MC 5 380 75 -45% 40 10 5% 31 39 125 98 31 24 17 9Maharashtra Satara 33 5522 170 -13% 431 13 -5% 53 49 796 98 40 22 18 19Maharashtra Sindhudurg 10 1687 168 -31% 116 15 -16% 46 46 257 102 39 26 22 16Maharashtra Solapur 35 4443 128 -32% 372 12 -8% 43 44 611 70 37 13 8 12Maharashtra Solapur MC 10 1215 120 -28% 248 5 -27% 98 67 309 122 50 24 23 25Maharashtra Thane 32 4813 152 7% 643 7 8% 81 84 1464 185 69 50 32 35Maharashtra Thane MC 15 2030 138 -20% 406 5 -33% 111 83 721 196 57 34 50 55Maharashtra Ulhasnagar MC 6 648 118 -22% 128 5 2% 93 60 196 142 44 34 16 48Maharashtra Wardha 14 2265 158 -13% 219 10 -12% 61 50 334 93 39 15 21 17Maharashtra Washim 12 1083 91 688% 153 7 533% 52 54 285 96 44 23 16 13Maharashtra Yavatmal ** 29 3623 126 -5% 465 8 -22% 65 62 822 115 47 26 21 21Manipur Bishnupur 2 239 113 28% 48 5 -24% 91 93 73 138 76 19 19 25Manipur Chandel * 1 200 159 6% 17 12 -8% 54 67 39 124 54 25 13 32Manipur Churachandpur * 2 702 299 24% 54 13 -24% 92 87 152 259 65 104 31 60Manipur Imphal East 4 435 108 -34% 44 10 6% 44 66 194 192 59 60 44 29Manipur Imphal West 5 887 197 16% 127 7 -18% 113 79 169 150 75 33 29 12Manipur Senapati * 4 262 67 -7% 33 8 -45% 34 33 69 71 26 10 23 12Manipur Tamenglong * 1 112 98 12% 11 10 -7% 38 38 13 45 35 3 0 7Manipur Thoubal 4 353 94 32% 47 8 -9% 50 46 122 130 36 48 24 21Manipur Ukhrul * 1 152 105 25% 16 10 22% 44 53 40 111 47 22 19 22Meghalaya East Garo Hills * 3 410 146 82% 39 11 52% 55 50 60 85 38 23 7 17Meghalaya East Khasi Hills * 8 2889 385 31% 357 8 6% 190 115 554 295 88 58 83 63Meghalaya Jaintia Hills * 3 505 150 -1% 64 8 -18% 76 75 196 233 54 93 44 43Meghalaya Ri Bhoi * 2 468 214 8% 53 9 12% 97 108 136 248 84 22 78 58Meghalaya South Garo Hills * 1 125 111 30% 11 11 -64% 39 78 34 121 67 18 14 21Meghalaya West Garo Hills * 6 1185 202 9% 158 8 0% 108 87 181 123 78 12 18 15Meghalaya West Khasi Hills * 3 653 195 62% 77 8 -10% 92 92 211 252 71 74 57 50
Page 25
Performance of RNTCP Case Detection (2011, Second quarter), Smear Conversion (2011, First quarter), and Treatment Outcomes (2010, Second quarter)
State District
Maharashtra Malegoan CorporationMaharashtra Mira BhayanderMaharashtra MumbaiMaharashtra Nagpur MCMaharashtra Nagpur RuralMaharashtra Nanded **Maharashtra Nanded Waghela MCMaharashtra Nandurbar *Maharashtra NashikMaharashtra Nashik CorpMaharashtra Navi MumbaiMaharashtra Osmanabad **Maharashtra Parbhani **Maharashtra Pimpri ChinchwadMaharashtra PuneMaharashtra Pune RuralMaharashtra Raigarh-MhMaharashtra RatnagiriMaharashtra SangliMaharashtra Sangli MCMaharashtra SataraMaharashtra SindhudurgMaharashtra SolapurMaharashtra Solapur MCMaharashtra ThaneMaharashtra Thane MCMaharashtra Ulhasnagar MCMaharashtra WardhaMaharashtra WashimMaharashtra Yavatmal **Manipur BishnupurManipur Chandel *Manipur Churachandpur *Manipur Imphal EastManipur Imphal WestManipur Senapati *Manipur Tamenglong *Manipur ThoubalManipur Ukhrul *Meghalaya East Garo Hills *Meghalaya East Khasi Hills *Meghalaya Jaintia Hills *Meghalaya Ri Bhoi *Meghalaya South Garo Hills *Meghalaya West Garo Hills *Meghalaya West Khasi Hills *
Annualized previously
treated smear
positive case
notification rate
3 month conversion rate of new
smear positive patients4
3 month conversion
rate of retreatment
patients4
Treatment Success
rate of new smear
positive patients5
Treatment success
rate among smear
positive previously
treated cases5
No (%) of all Smear Positive cases started RNTCP DOTS within 7
days of diagnosis
No (%) of cases (all forms of TB) registered
receiving DOT through a community volunteer
No (%) of all Smear Positive cases
registered within one month of starting
RNTCP DOTS treatment
No (%) of pediatric cases out of all New
cases
No (%) of all cured Smear Positive cases
having end of treatment follow- up sputum done
within 7 days of last dose
22 19 9% 87% 81% 86% 71% 117 98% 119 100% 86 0% 75 31%20 13 8% 93% 67% 86% 70% 145 96% 151 100% 116 0% 151 63%31 501 10% 90% 67% 86% 65% 2825 90% 3044 97% 1964 85% 0 0%16 33 5% 91% 79% 85% 52% 314 74% 329 78% 242 74% 46 5%9 35 7% 92% 77% 87% 80% 329 90% 364 100% 299 90% 238 39%9 12 2% 90% 65% 88% 86% 281 90% 309 99% 204 75% 298 49%7 7 6% 90% 73% 85% 56% 55 82% 58 87% 40 67% 70 56%15 24 6% 91% 82% 86% 62% 224 83% 267 99% 116 63% 360 75%6 69 9% 94% 93% 90% 85% 462 90% 512 100% 295 56% 352 41%8 35 11% 89% 67% 86% 54% 183 94% 195 100% 153 97% 37 11%32 52 15% 90% 56% 83% 50% 226 95% 239 100% 173 98% 309 65%8 17 6% 87% 68% 84% 67% 169 84% 201 100% 101 80% 139 41%13 9 3% 89% 69% 86% 62% 189 90% 211 100% 128 82% 116 27%17 36 10% 89% 71% 87% 58% 187 94% 194 98% 188 95% 5 1%12 48 6% 94% 80% 87% 56% 433 92% 449 95% 342 92% 109 11%10 43 6% 91% 68% 85% 64% 501 87% 541 94% 359 76% 212 23%18 55 8% 90% 77% 83% 63% 400 84% 470 99% 309 86% 506 60%14 11 2% 92% 67% 88% 59% 313 92% 338 99% 215 87% 512 73%8 20 3% 93% 67% 85% 59% 357 88% 403 100% 250 90% 151 21%9 11 10% 86% 82% 91% 53% 43 84% 50 98% 26 57% 6 5%11 32 5% 89% 62% 84% 56% 378 92% 409 100% 265 80% 465 58%9 7 3% 92% 77% 87% 63% 113 94% 119 99% 103 86% 171 67%8 21 4% 92% 65% 86% 65% 327 84% 353 91% 304 82% 126 21%18 27 11% 93% 67% 84% 51% 152 88% 172 100% 95 96% 11 4%17 110 9% 91% 72% 86% 67% 563 82% 673 99% 442 82% 958 65%28 80 15% 86% 54% 86% 59% 272 87% 308 99% 196 93% 285 40%17 11 8% 84% 75% 79% 70% 70 83% 82 98% 66 99% 12 6%12 18 7% 85% 74% 77% 57% 148 81% 165 90% 95 75% 189 57%10 6 2% 85% 53% 83% 49% 142 88% 153 94% 78 76% 203 71%17 34 5% 91% 67% 90% 72% 371 82% 424 93% 263 81% 602 73%25 1 2% 100% 60% 86% 50% 45 85% 53 100% 24 89% 68 93%13 2 7% 100% 100% 95% 75% 17 81% 21 100% 14 67% 26 67%27 40 34% 89% 50% 93% 78% 54 100% 54 100% 47 100% 71 47%9 9 5% 93% 75% 88% 91% 63 91% 64 93% 50 85% 161 83%4 1 1% 91% 82% 85% 55% 90 100% 74 82% 46 74% 66 39%8 3 5% 89% 67% 90% 67% 33 100% 33 100% 26 100% 0 0%3 0 0% 100% 50% 100% 100% 11 100% 11 100% 13 87% 8 62%11 1 1% 84% 100% 88% 50% 44 100% 44 100% 28 90% 37 30%11 0 0% 81% 70% 84% 64% 21 100% 21 100% 23 100% 25 63%11 4 8% 88% 67% 92% 75% 32 91% 24 69% 26 68% 33 55%39 63 14% 74% 56% 77% 49% 216 90% 230 96% 120 82% 269 49%23 57 36% 81% 80% 79% 50% 41 64% 64 100% 14 50% 196 100%33 16 15% 81% 63% 89% 63% 55 86% 56 88% 54 100% 119 88%11 0 0% 100% 100% 86% 67% 14 64% 18 82% 9 64% 23 68%10 7 4% 89% 82% 91% 78% 127 98% 129 100% 116 94% 31 17%31 38 22% 93% 73% 88% 43% 81 95% 85 100% 45 83% 94 45%
Page 26
Performance of RNTCP Case Detection (2011, Second quarter), Smear Conversion (2011, First quarter), and Treatment Outcomes (2010, Second quarter)
State District
Popu-lation (in lakh)
covered by RNTCP1
No. of suspects examined
Suspects examined per lakh
population
Rate of change in suspects examined per lakh
population (compared
to same quarter in previous
year)
No of Smear
positive patients
diagnosed2
Suspects examined per smear positive
case diagnosed
Rate of change in suspects examined
per s+ case diagnosed (compared
to same quarter in previous
year)
Annualized smear
positive case
detection rate (from
PMR)
Annualized smear
positive case
notification rate [from CFR: sm + cases (NSP
+ Rel + TAD) * 4 /
Pop]
Total patients
registered for
treatment3
Annualized total case
notification rate
Annualized new smear
positive case
notification rate
Annualized new smear negative
case notification
rate
Annualized new extra pulmonary
case notification
rate
Annualized previously
treated case
notification rate
Mizoram Aizawl * 4 975 255 20% 97 10 13% 101 83 313 327 62 87 112 67Mizoram Champhai * 1 204 179 33% 4 51 269% 14 18 28 98 14 18 56 11Mizoram Kolasib * 1 206 300 52% 17 12 72% 99 99 43 250 70 47 70 64Mizoram Lawngtlai * 1 108 131 12% 11 10 -38% 53 73 53 258 58 112 15 73Mizoram Lunglei * 2 281 182 -4% 47 6 10% 122 98 75 194 80 41 47 26Mizoram Mamit * 1 111 158 -11% 9 12 -50% 51 46 18 103 40 34 17 11Mizoram Saiha * 1 144 210 9% 13 11 2% 76 93 58 339 53 128 88 70Mizoram Serchhip * 1 80 128 3% 7 11 -41% 45 51 16 102 45 26 13 19Nagaland Dimapur * 3 944 271 18% 176 5 -16% 202 156 268 308 103 60 34 110Nagaland Kiphire * 1 187 177 52% 16 12 -13% 61 64 48 182 38 61 42 42Nagaland Kohima * 3 400 158 20% 64 6 12% 101 79 105 166 55 19 41 51Nagaland Longleng* 1 76 60 -41% 9 8 -47% 28 25 15 47 16 13 6 13Nagaland Mokokchung * 3 305 120 4% 37 8 35% 58 51 61 96 38 22 14 22Nagaland Mon * 3 630 215 -13% 62 10 -37% 84 108 149 203 84 37 44 38Nagaland Peren * 1 87 86 10% 6 15 67% 24 20 19 75 20 39 16 0Nagaland Phek * 2 152 90 68% 24 6 -15% 57 50 42 99 40 17 24 19Nagaland Tuensang * 2 413 173 65% 45 9 19% 75 75 178 298 62 79 109 49Nagaland Wokha * 2 316 174 -20% 30 11 -3% 66 66 37 81 64 11 4 2Nagaland Zunheboto * 2 102 58 -48% 25 4 -83% 56 56 44 99 56 34 5 5Orissa Anugul 13 1812 143 -6% 205 9 -18% 65 50 289 91 40 24 14 12Orissa Balangir ** 15 1909 129 5% 291 7 -18% 78 70 623 168 65 50 27 23Orissa Baleshwar 22 2704 120 16% 370 7 -6% 66 53 515 92 46 22 13 10Orissa Bargarh 15 1692 113 6% 208 8 -12% 56 56 450 120 51 33 26 10Orissa Bhadrak 15 1131 76 -23% 134 8 -42% 36 33 226 61 28 9 16 9Orissa Bhubaneshwar MC 7 956 133 -18% 164 6 -28% 91 44 201 112 33 17 35 25Orissa Boudh 4 368 89 -9% 61 6 -32% 59 67 106 102 59 12 16 15Orissa Cuttack 26 2235 86 -11% 352 6 -16% 54 32 460 71 26 11 25 10Orissa Debagarh 3 306 101 0% 41 7 -21% 54 54 83 109 53 29 18 9Orissa Dhenkanal 12 1517 128 -22% 187 8 -22% 63 64 281 95 51 13 14 18Orissa Gajapati † 6 761 132 -16% 148 5 1% 103 101 299 208 92 51 38 26Orissa Ganjam 35 4802 138 1% 727 7 -15% 84 77 1442 166 59 38 37 32Orissa Jagatsinghpur 12 970 83 -34% 52 19 -22% 18 20 130 44 18 8 15 3Orissa Jajapur 18 1204 67 -22% 168 7 -17% 37 42 379 84 36 15 22 11Orissa Jharsuguda 6 835 148 -30% 111 8 -26% 79 79 212 150 61 33 28 28Orissa Kalahandi ** 15 1994 135 8% 326 6 -3% 88 85 586 158 75 34 27 22Orissa Kandhamal † 7 1175 163 -11% 187 6 -29% 104 98 300 167 86 28 29 23Orissa Kendrapara 14 1467 102 -9% 123 12 -4% 34 37 222 61 31 9 12 9Orissa Kendujhar 17 2962 171 5% 485 6 -10% 112 95 783 181 82 48 28 23Orissa Khordha 14 894 66 -23% 129 7 -15% 38 39 267 78 34 17 18 10Orissa Koraput † 13 1787 137 -14% 326 5 -3% 100 88 437 134 74 26 14 20Orissa Malkangiri * 5 713 134 -33% 198 4 -41% 149 164 300 225 136 30 29 30Orissa Mayurbhanj † 25 4431 180 1% 917 5 -19% 149 139 1393 226 124 49 28 25Orissa Nabarangapur † 11 915 81 14% 179 5 0% 63 59 266 94 54 30 3 7Orissa Nayagarh 10 1356 141 -21% 271 5 -28% 113 88 383 160 66 35 20 39Orissa Nuapada † 6 995 169 16% 167 6 -15% 113 101 264 179 88 54 20 18Orissa Puri 17 1388 83 -22% 188 7 -32% 45 41 352 85 33 16 19 16Orissa Rayagada † 9 1640 179 -6% 284 6 -16% 124 112 435 190 96 44 24 27
Page 27
Performance of RNTCP Case Detection (2011, Second quarter), Smear Conversion (2011, First quarter), and Treatment Outcomes (2010, Second quarter)
State District
Mizoram Aizawl *Mizoram Champhai *Mizoram Kolasib *Mizoram Lawngtlai *Mizoram Lunglei *Mizoram Mamit *Mizoram Saiha *Mizoram Serchhip *Nagaland Dimapur *Nagaland Kiphire *Nagaland Kohima *Nagaland Longleng*Nagaland Mokokchung *Nagaland Mon *Nagaland Peren *Nagaland Phek *Nagaland Tuensang *Nagaland Wokha *Nagaland Zunheboto *Orissa AnugulOrissa Balangir **Orissa BaleshwarOrissa BargarhOrissa BhadrakOrissa Bhubaneshwar MCOrissa BoudhOrissa CuttackOrissa DebagarhOrissa DhenkanalOrissa Gajapati †Orissa GanjamOrissa JagatsinghpurOrissa JajapurOrissa JharsugudaOrissa Kalahandi **Orissa Kandhamal †Orissa KendraparaOrissa KendujharOrissa KhordhaOrissa Koraput †Orissa Malkangiri *Orissa Mayurbhanj †Orissa Nabarangapur †Orissa NayagarhOrissa Nuapada †Orissa PuriOrissa Rayagada †
Annualized previously
treated smear
positive case
notification rate
3 month conversion rate of new
smear positive patients4
3 month conversion
rate of retreatment
patients4
Treatment Success
rate of new smear
positive patients5
Treatment success
rate among smear
positive previously
treated cases5
No (%) of all Smear Positive cases started RNTCP DOTS within 7
days of diagnosis
No (%) of cases (all forms of TB) registered
receiving DOT through a community volunteer
No (%) of all Smear Positive cases
registered within one month of starting
RNTCP DOTS treatment
No (%) of pediatric cases out of all New
cases
No (%) of all cured Smear Positive cases
having end of treatment follow- up sputum done
within 7 days of last dose
22 45 18% 95% 58% 91% 56% 80 100% 80 100% 49 94% 26 8%7 6 24% 78% 67% 75% 75% 5 83% 6 100% 10 100% 9 32%29 1 3% 100% 50% 70% 100% 17 100% 17 100% 8 80% 5 12%15 7 18% 100% 100% 33% 14 93% 15 100% 5 71% 32 60%18 16 25% 96% 100% 95% 100% 38 100% 38 100% 23 100% 18 24%11 4 25% 88% 100% 75% 50% 8 89% 9 100% 7 100% 11 61%41 13 28% 100% 100% 100% 100% 15 94% 15 94% 13 100% 9 16%13 3 23% 100% 100% 86% 100% 9 100% 9 100% 4 57% 3 19%65 14 8% 90% 75% 85% 81% 125 85% 147 100% 86 76% 135 50%30 9 24% 90% 80% 100% 100% 16 89% 16 89% 24 100% 15 31%28 4 5% 91% 91% 93% 81% 53 100% 53 100% 52 100% 98 93%13 0 0% 100% 100% 92% 100% 9 100% 9 100% 13 100% 0 0%21 11 23% 91% 83% 83% 76% 36 97% 37 100% 42 100% 15 25%23 21 17% 88% 79% 96% 95% 0 0% 0 0% 0 0% 0 0%0 2 11% 100% 100% 86% 0 0% 0 0% 0 0% 0 0%17 3 9% 94% 80% 83% 60% 20 83% 23 96% 5 63% 15 36%13 44 30% 92% 82% 94% 86% 45 100% 45 100% 48 84% 100 56%2 2 6% 97% 100% 100% 100% 30 100% 30 100% 29 100% 30 81%0 8 19% 85% 71% 67% 25 100% 25 100% 12 86% 8 18%10 10 4% 95% 78% 91% 70% 138 86% 161 100% 137 82% 217 75%6 36 7% 87% 46% 85% 87% 219 83% 262 99% 98 53% 566 91%8 15 3% 89% 79% 88% 75% 271 89% 300 99% 200 81% 509 99%5 20 5% 89% 67% 89% 73% 178 85% 206 98% 152 86% 428 95%6 8 4% 88% 100% 89% 79% 103 83% 123 99% 64 82% 226 100%11 15 10% 81% 59% 81% 56% 74 94% 72 91% 54 95% 55 27%8 8 9% 91% 69% 81% 70% 60 87% 69 100% 57 85% 102 96%7 19 5% 86% 60% 85% 49% 156 73% 213 100% 105 64% 363 79%5 8 11% 92% 25% 88% 50% 44 100% 44 100% 30 100% 80 96%14 14 6% 93% 84% 94% 71% 164 86% 190 100% 117 76% 247 88%11 38 15% 91% 47% 76% 50% 118 80% 128 86% 88 78% 261 87%20 87 7% 87% 50% 81% 55% 563 82% 672 98% 268 63% 1227 85%2 3 2% 86% 81% 89% 75% 50 85% 59 100% 56 90% 130 100%6 16 5% 92% 71% 91% 77% 174 91% 184 96% 150 79% 304 80%21 11 6% 90% 63% 79% 68% 102 89% 109 95% 88 85% 202 95%11 20 4% 83% 73% 86% 63% 278 88% 310 98% 164 62% 33 6%13 21 8% 89% 57% 88% 77% 140 79% 171 96% 72 56% 259 86%6 11 6% 96% 95% 95% 81% 121 90% 134 100% 107 91% 206 93%14 48 7% 83% 55% 84% 66% 353 85% 414 100% 278 83% 10 1%6 15 6% 86% 65% 84% 75% 118 87% 134 99% 79 82% 14 5%14 27 7% 88% 74% 89% 65% 231 80% 276 96% 179 67% 393 90%28 17 7% 85% 50% 86% 76% 161 74% 184 84% 110 60% 109 36%15 40 3% 90% 76% 88% 70% 734 86% 854 100% 615 80% 1225 88%5 2 1% 90% 71% 88% 86% 146 87% 156 93% 110 74% 254 95%25 21 7% 56% 29% 66% 26% 205 94% 202 93% 37 39% 13 3%14 16 7% 90% 59% 92% 71% 131 87% 148 99% 92 83% 71 27%8 23 8% 89% 62% 90% 77% 166 97% 172 100% 91 78% 295 84%18 29 8% 90% 82% 87% 76% 189 73% 257 99% 173 69% 367 84%
Page 28
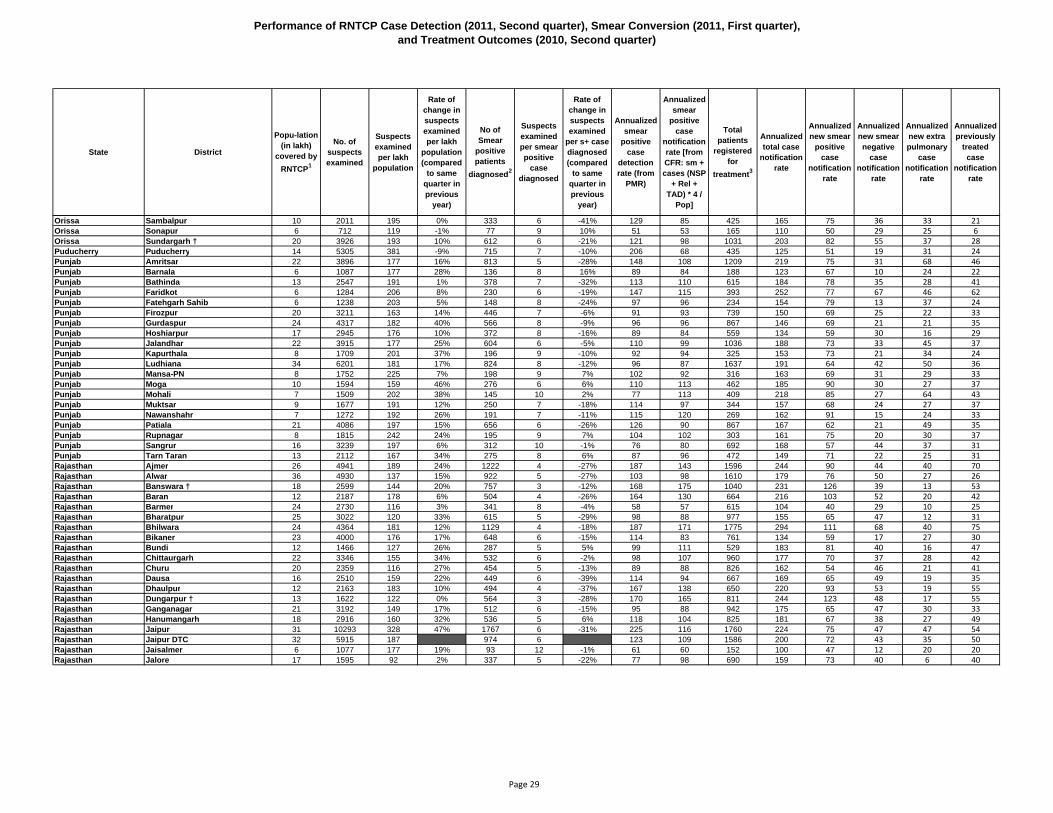
Performance of RNTCP Case Detection (2011, Second quarter), Smear Conversion (2011, First quarter), and Treatment Outcomes (2010, Second quarter)
State District
Popu-lation (in lakh)
covered by RNTCP1
No. of suspects examined
Suspects examined per lakh
population
Rate of change in suspects examined per lakh
population (compared
to same quarter in previous
year)
No of Smear
positive patients
diagnosed2
Suspects examined per smear positive
case diagnosed
Rate of change in suspects examined
per s+ case diagnosed (compared
to same quarter in previous
year)
Annualized smear
positive case
detection rate (from
PMR)
Annualized smear
positive case
notification rate [from CFR: sm + cases (NSP
+ Rel + TAD) * 4 /
Pop]
Total patients
registered for
treatment3
Annualized total case
notification rate
Annualized new smear
positive case
notification rate
Annualized new smear negative
case notification
rate
Annualized new extra pulmonary
case notification
rate
Annualized previously
treated case
notification rate
Orissa Sambalpur 10 2011 195 0% 333 6 -41% 129 85 425 165 75 36 33 21Orissa Sonapur 6 712 119 -1% 77 9 10% 51 53 165 110 50 29 25 6Orissa Sundargarh † 20 3926 193 10% 612 6 -21% 121 98 1031 203 82 55 37 28Puducherry Puducherry 14 5305 381 -9% 715 7 -10% 206 68 435 125 51 19 31 24Punjab Amritsar 22 3896 177 16% 813 5 -28% 148 108 1209 219 75 31 68 46Punjab Barnala 6 1087 177 28% 136 8 16% 89 84 188 123 67 10 24 22Punjab Bathinda 13 2547 191 1% 378 7 -32% 113 110 615 184 78 35 28 41Punjab Faridkot 6 1284 206 8% 230 6 -19% 147 115 393 252 77 67 46 62Punjab Fatehgarh Sahib 6 1238 203 5% 148 8 -24% 97 96 234 154 79 13 37 24Punjab Firozpur 20 3211 163 14% 446 7 -6% 91 93 739 150 69 25 22 33Punjab Gurdaspur 24 4317 182 40% 566 8 -9% 96 96 867 146 69 21 21 35Punjab Hoshiarpur 17 2945 176 10% 372 8 -16% 89 84 559 134 59 30 16 29Punjab Jalandhar 22 3915 177 25% 604 6 -5% 110 99 1036 188 73 33 45 37Punjab Kapurthala 8 1709 201 37% 196 9 -10% 92 94 325 153 73 21 34 24Punjab Ludhiana 34 6201 181 17% 824 8 -12% 96 87 1637 191 64 42 50 36Punjab Mansa-PN 8 1752 225 7% 198 9 7% 102 92 316 163 69 31 29 33Punjab Moga 10 1594 159 46% 276 6 6% 110 113 462 185 90 30 27 37Punjab Mohali 7 1509 202 38% 145 10 2% 77 113 409 218 85 27 64 43Punjab Muktsar 9 1677 191 12% 250 7 -18% 114 97 344 157 68 24 27 37Punjab Nawanshahr 7 1272 192 26% 191 7 -11% 115 120 269 162 91 15 24 33Punjab Patiala 21 4086 197 15% 656 6 -26% 126 90 867 167 62 21 49 35Punjab Rupnagar 8 1815 242 24% 195 9 7% 104 102 303 161 75 20 30 37Punjab Sangrur 16 3239 197 6% 312 10 -1% 76 80 692 168 57 44 37 31Punjab Tarn Taran 13 2112 167 34% 275 8 6% 87 96 472 149 71 22 25 31Rajasthan Ajmer 26 4941 189 24% 1222 4 -27% 187 143 1596 244 90 44 40 70Rajasthan Alwar 36 4930 137 15% 922 5 -27% 103 98 1610 179 76 50 27 26Rajasthan Banswara † 18 2599 144 20% 757 3 -12% 168 175 1040 231 126 39 13 53Rajasthan Baran 12 2187 178 6% 504 4 -26% 164 130 664 216 103 52 20 42Rajasthan Barmer 24 2730 116 3% 341 8 -4% 58 57 615 104 40 29 10 25Rajasthan Bharatpur 25 3022 120 33% 615 5 -29% 98 88 977 155 65 47 12 31Rajasthan Bhilwara 24 4364 181 12% 1129 4 -18% 187 171 1775 294 111 68 40 75Rajasthan Bikaner 23 4000 176 17% 648 6 -15% 114 83 761 134 59 17 27 30Rajasthan Bundi 12 1466 127 26% 287 5 5% 99 111 529 183 81 40 16 47Rajasthan Chittaurgarh 22 3346 155 34% 532 6 -2% 98 107 960 177 70 37 28 42Rajasthan Churu 20 2359 116 27% 454 5 -13% 89 88 826 162 54 46 21 41Rajasthan Dausa 16 2510 159 22% 449 6 -39% 114 94 667 169 65 49 19 35Rajasthan Dhaulpur 12 2163 183 10% 494 4 -37% 167 138 650 220 93 53 19 55Rajasthan Dungarpur † 13 1622 122 0% 564 3 -28% 170 165 811 244 123 48 17 55Rajasthan Ganganagar 21 3192 149 17% 512 6 -15% 95 88 942 175 65 47 30 33Rajasthan Hanumangarh 18 2916 160 32% 536 5 6% 118 104 825 181 67 38 27 49Rajasthan Jaipur 31 10293 328 47% 1767 6 -31% 225 116 1760 224 75 47 47 54Rajasthan Jaipur DTC 32 5915 187 974 6 123 109 1586 200 72 43 35 50Rajasthan Jaisalmer 6 1077 177 19% 93 12 -1% 61 60 152 100 47 12 20 20Rajasthan Jalore 17 1595 92 2% 337 5 -22% 77 98 690 159 73 40 6 40
Page 29
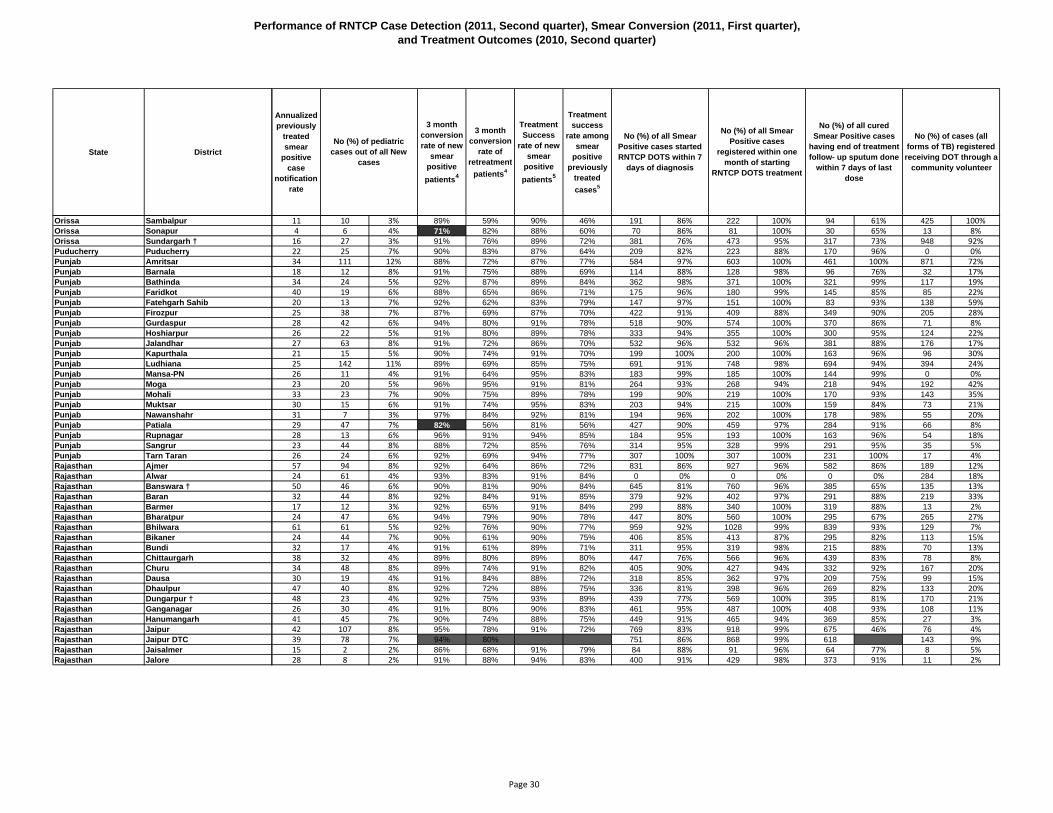
Performance of RNTCP Case Detection (2011, Second quarter), Smear Conversion (2011, First quarter), and Treatment Outcomes (2010, Second quarter)
State District
Orissa SambalpurOrissa SonapurOrissa Sundargarh †Puducherry PuducherryPunjab AmritsarPunjab BarnalaPunjab BathindaPunjab FaridkotPunjab Fatehgarh SahibPunjab FirozpurPunjab GurdaspurPunjab HoshiarpurPunjab JalandharPunjab KapurthalaPunjab LudhianaPunjab Mansa-PNPunjab MogaPunjab MohaliPunjab MuktsarPunjab NawanshahrPunjab PatialaPunjab RupnagarPunjab SangrurPunjab Tarn TaranRajasthan AjmerRajasthan AlwarRajasthan Banswara †Rajasthan BaranRajasthan BarmerRajasthan BharatpurRajasthan BhilwaraRajasthan BikanerRajasthan BundiRajasthan ChittaurgarhRajasthan ChuruRajasthan DausaRajasthan DhaulpurRajasthan Dungarpur †Rajasthan GanganagarRajasthan HanumangarhRajasthan JaipurRajasthan Jaipur DTCRajasthan JaisalmerRajasthan Jalore
Annualized previously
treated smear
positive case
notification rate
3 month conversion rate of new
smear positive patients4
3 month conversion
rate of retreatment
patients4
Treatment Success
rate of new smear
positive patients5
Treatment success
rate among smear
positive previously
treated cases5
No (%) of all Smear Positive cases started RNTCP DOTS within 7
days of diagnosis
No (%) of cases (all forms of TB) registered
receiving DOT through a community volunteer
No (%) of all Smear Positive cases
registered within one month of starting
RNTCP DOTS treatment
No (%) of pediatric cases out of all New
cases
No (%) of all cured Smear Positive cases
having end of treatment follow- up sputum done
within 7 days of last dose
11 10 3% 89% 59% 90% 46% 191 86% 222 100% 94 61% 425 100%4 6 4% 71% 82% 88% 60% 70 86% 81 100% 30 65% 13 8%16 27 3% 91% 76% 89% 72% 381 76% 473 95% 317 73% 948 92%22 25 7% 90% 83% 87% 64% 209 82% 223 88% 170 96% 0 0%34 111 12% 88% 72% 87% 77% 584 97% 603 100% 461 100% 871 72%18 12 8% 91% 75% 88% 69% 114 88% 128 98% 96 76% 32 17%34 24 5% 92% 87% 89% 84% 362 98% 371 100% 321 99% 117 19%40 19 6% 88% 65% 86% 71% 175 96% 180 99% 145 85% 85 22%20 13 7% 92% 62% 83% 79% 147 97% 151 100% 83 93% 138 59%25 38 7% 87% 69% 87% 70% 422 91% 409 88% 349 90% 205 28%28 42 6% 94% 80% 91% 78% 518 90% 574 100% 370 86% 71 8%26 22 5% 91% 80% 89% 78% 333 94% 355 100% 300 95% 124 22%27 63 8% 91% 72% 86% 70% 532 96% 532 96% 381 88% 176 17%21 15 5% 90% 74% 91% 70% 199 100% 200 100% 163 96% 96 30%25 142 11% 89% 69% 85% 75% 691 91% 748 98% 694 94% 394 24%26 11 4% 91% 64% 95% 83% 183 99% 185 100% 144 99% 0 0%23 20 5% 96% 95% 91% 81% 264 93% 268 94% 218 94% 192 42%33 23 7% 90% 75% 89% 78% 199 90% 219 100% 170 93% 143 35%30 15 6% 91% 74% 95% 83% 203 94% 215 100% 159 84% 73 21%31 7 3% 97% 84% 92% 81% 194 96% 202 100% 178 98% 55 20%29 47 7% 82% 56% 81% 56% 427 90% 459 97% 284 91% 66 8%28 13 6% 96% 91% 94% 85% 184 95% 193 100% 163 96% 54 18%23 44 8% 88% 72% 85% 76% 314 95% 328 99% 291 95% 35 5%26 24 6% 92% 69% 94% 77% 307 100% 307 100% 231 100% 17 4%57 94 8% 92% 64% 86% 72% 831 86% 927 96% 582 86% 189 12%24 61 4% 93% 83% 91% 84% 0 0% 0 0% 0 0% 284 18%50 46 6% 90% 81% 90% 84% 645 81% 760 96% 385 65% 135 13%32 44 8% 92% 84% 91% 85% 379 92% 402 97% 291 88% 219 33%17 12 3% 92% 65% 91% 84% 299 88% 340 100% 319 88% 13 2%24 47 6% 94% 79% 90% 78% 447 80% 560 100% 295 67% 265 27%61 61 5% 92% 76% 90% 77% 959 92% 1028 99% 839 93% 129 7%24 44 7% 90% 61% 90% 75% 406 85% 413 87% 295 82% 113 15%32 17 4% 91% 61% 89% 71% 311 95% 319 98% 215 88% 70 13%38 32 4% 89% 80% 89% 80% 447 76% 566 96% 439 83% 78 8%34 48 8% 89% 74% 91% 82% 405 90% 427 94% 332 92% 167 20%30 19 4% 91% 84% 88% 72% 318 85% 362 97% 209 75% 99 15%47 40 8% 92% 72% 88% 75% 336 81% 398 96% 269 82% 133 20%48 23 4% 92% 75% 93% 89% 439 77% 569 100% 395 81% 170 21%26 30 4% 91% 80% 90% 83% 461 95% 487 100% 408 93% 108 11%41 45 7% 90% 74% 88% 75% 449 91% 465 94% 369 85% 27 3%42 107 8% 95% 78% 91% 72% 769 83% 918 99% 675 46% 76 4%39 78 7% 94% 80% 751 86% 868 99% 618 143 9%15 2 2% 86% 68% 91% 79% 84 88% 91 96% 64 77% 8 5%28 8 2% 91% 88% 94% 83% 400 91% 429 98% 373 91% 11 2%
Page 30
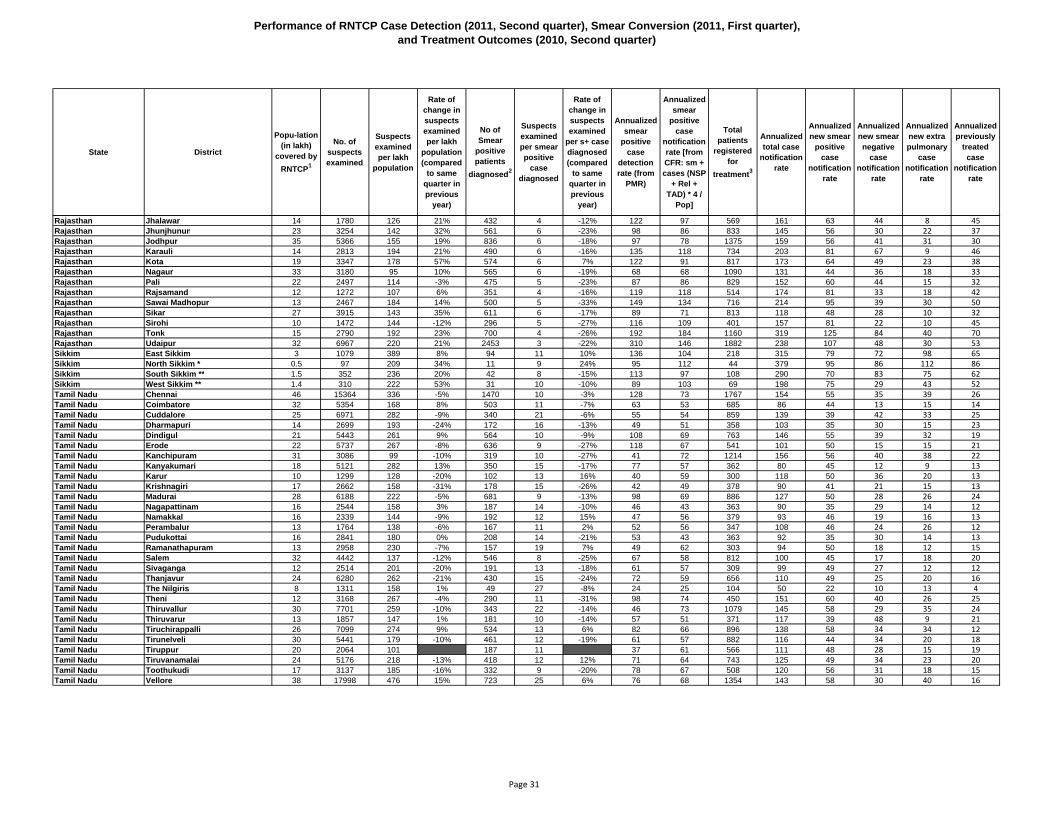
Performance of RNTCP Case Detection (2011, Second quarter), Smear Conversion (2011, First quarter), and Treatment Outcomes (2010, Second quarter)
State District
Popu-lation (in lakh)
covered by RNTCP1
No. of suspects examined
Suspects examined per lakh
population
Rate of change in suspects examined per lakh
population (compared
to same quarter in previous
year)
No of Smear
positive patients
diagnosed2
Suspects examined per smear positive
case diagnosed
Rate of change in suspects examined
per s+ case diagnosed (compared
to same quarter in previous
year)
Annualized smear
positive case
detection rate (from
PMR)
Annualized smear
positive case
notification rate [from CFR: sm + cases (NSP
+ Rel + TAD) * 4 /
Pop]
Total patients
registered for
treatment3
Annualized total case
notification rate
Annualized new smear
positive case
notification rate
Annualized new smear negative
case notification
rate
Annualized new extra pulmonary
case notification
rate
Annualized previously
treated case
notification rate
Rajasthan Jhalawar 14 1780 126 21% 432 4 -12% 122 97 569 161 63 44 8 45Rajasthan Jhunjhunun 23 3254 142 32% 561 6 -23% 98 86 833 145 56 30 22 37Rajasthan Jodhpur 35 5366 155 19% 836 6 -18% 97 78 1375 159 56 41 31 30Rajasthan Karauli 14 2813 194 21% 490 6 -16% 135 118 734 203 81 67 9 46Rajasthan Kota 19 3347 178 57% 574 6 7% 122 91 817 173 64 49 23 38Rajasthan Nagaur 33 3180 95 10% 565 6 -19% 68 68 1090 131 44 36 18 33Rajasthan Pali 22 2497 114 -3% 475 5 -23% 87 86 829 152 60 44 15 32Rajasthan Rajsamand 12 1272 107 6% 351 4 -16% 119 118 514 174 81 33 18 42Rajasthan Sawai Madhopur 13 2467 184 14% 500 5 -33% 149 134 716 214 95 39 30 50Rajasthan Sikar 27 3915 143 35% 611 6 -17% 89 71 813 118 48 28 10 32Rajasthan Sirohi 10 1472 144 -12% 296 5 -27% 116 109 401 157 81 22 10 45Rajasthan Tonk 15 2790 192 23% 700 4 -26% 192 184 1160 319 125 84 40 70Rajasthan Udaipur 32 6967 220 21% 2453 3 -22% 310 146 1882 238 107 48 30 53Sikkim East Sikkim 3 1079 389 8% 94 11 10% 136 104 218 315 79 72 98 65Sikkim North Sikkim * 0.5 97 209 34% 11 9 24% 95 112 44 379 95 86 112 86Sikkim South Sikkim ** 1.5 352 236 20% 42 8 -15% 113 97 108 290 70 83 75 62Sikkim West Sikkim ** 1.4 310 222 53% 31 10 -10% 89 103 69 198 75 29 43 52Tamil Nadu Chennai 46 15364 336 -5% 1470 10 -3% 128 73 1767 154 55 35 39 26Tamil Nadu Coimbatore 32 5354 168 8% 503 11 -7% 63 53 685 86 44 13 15 14Tamil Nadu Cuddalore 25 6971 282 -9% 340 21 -6% 55 54 859 139 39 42 33 25Tamil Nadu Dharmapuri 14 2699 193 -24% 172 16 -13% 49 51 358 103 35 30 15 23Tamil Nadu Dindigul 21 5443 261 9% 564 10 -9% 108 69 763 146 55 39 32 19Tamil Nadu Erode 22 5737 267 -8% 636 9 -27% 118 67 541 101 50 15 15 21Tamil Nadu Kanchipuram 31 3086 99 -10% 319 10 -27% 41 72 1214 156 56 40 38 22Tamil Nadu Kanyakumari 18 5121 282 13% 350 15 -17% 77 57 362 80 45 12 9 13Tamil Nadu Karur 10 1299 128 -20% 102 13 16% 40 59 300 118 50 36 20 13Tamil Nadu Krishnagiri 17 2662 158 -31% 178 15 -26% 42 49 378 90 41 21 15 13Tamil Nadu Madurai 28 6188 222 -5% 681 9 -13% 98 69 886 127 50 28 26 24Tamil Nadu Nagapattinam 16 2544 158 3% 187 14 -10% 46 43 363 90 35 29 14 12Tamil Nadu Namakkal 16 2339 144 -9% 192 12 15% 47 56 379 93 46 19 16 13Tamil Nadu Perambalur 13 1764 138 -6% 167 11 2% 52 56 347 108 46 24 26 12Tamil Nadu Pudukottai 16 2841 180 0% 208 14 -21% 53 43 363 92 35 30 14 13Tamil Nadu Ramanathapuram 13 2958 230 -7% 157 19 7% 49 62 303 94 50 18 12 15Tamil Nadu Salem 32 4442 137 -12% 546 8 -25% 67 58 812 100 45 17 18 20Tamil Nadu Sivaganga 12 2514 201 -20% 191 13 -18% 61 57 309 99 49 27 12 12Tamil Nadu Thanjavur 24 6280 262 -21% 430 15 -24% 72 59 656 110 49 25 20 16Tamil Nadu The Nilgiris 8 1311 158 1% 49 27 -8% 24 25 104 50 22 10 13 4Tamil Nadu Theni 12 3168 267 -4% 290 11 -31% 98 74 450 151 60 40 26 25Tamil Nadu Thiruvallur 30 7701 259 -10% 343 22 -14% 46 73 1079 145 58 29 35 24Tamil Nadu Thiruvarur 13 1857 147 1% 181 10 -14% 57 51 371 117 39 48 9 21Tamil Nadu Tiruchirappalli 26 7099 274 9% 534 13 6% 82 66 896 138 58 34 34 12Tamil Nadu Tirunelveli 30 5441 179 -10% 461 12 -19% 61 57 882 116 44 34 20 18Tamil Nadu Tiruppur 20 2064 101 187 11 37 61 566 111 48 28 15 19Tamil Nadu Tiruvanamalai 24 5176 218 -13% 418 12 12% 71 64 743 125 49 34 23 20Tamil Nadu Toothukudi 17 3137 185 -16% 332 9 -20% 78 67 508 120 56 31 18 15Tamil Nadu Vellore 38 17998 476 15% 723 25 6% 76 68 1354 143 58 30 40 16
Page 31
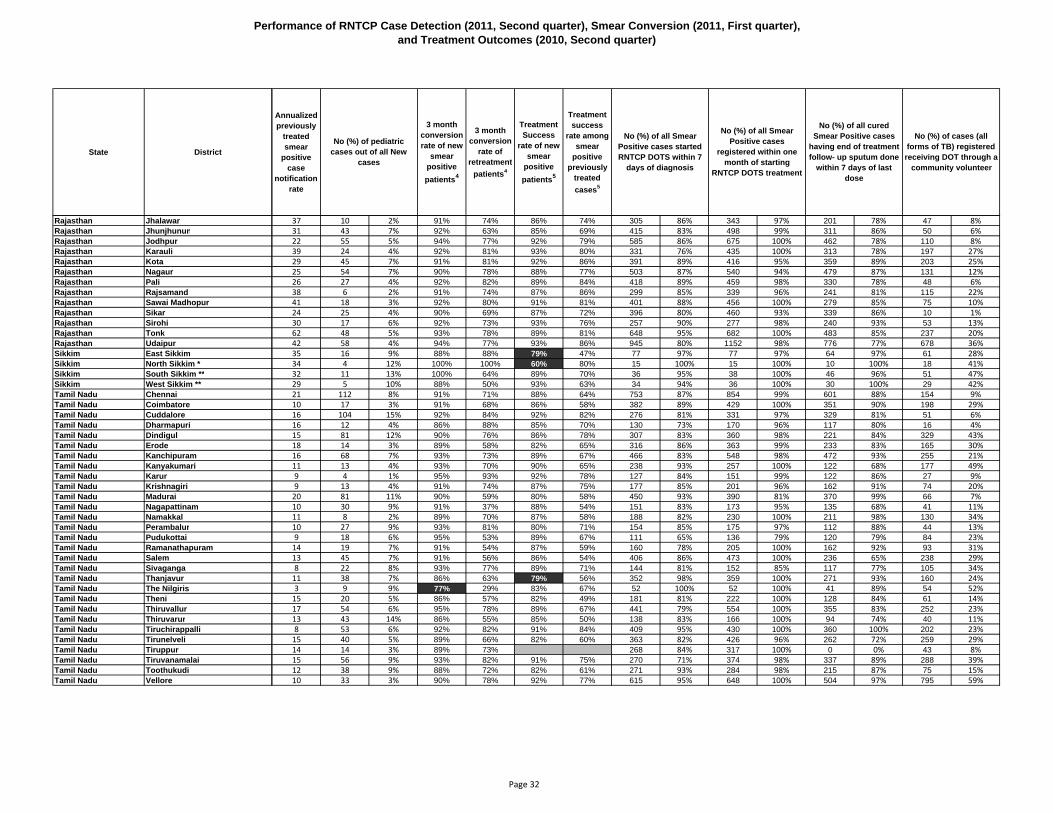
Performance of RNTCP Case Detection (2011, Second quarter), Smear Conversion (2011, First quarter), and Treatment Outcomes (2010, Second quarter)
State District
Rajasthan JhalawarRajasthan JhunjhununRajasthan JodhpurRajasthan KarauliRajasthan KotaRajasthan NagaurRajasthan PaliRajasthan RajsamandRajasthan Sawai MadhopurRajasthan SikarRajasthan SirohiRajasthan TonkRajasthan UdaipurSikkim East SikkimSikkim North Sikkim *Sikkim South Sikkim **Sikkim West Sikkim **Tamil Nadu ChennaiTamil Nadu CoimbatoreTamil Nadu CuddaloreTamil Nadu DharmapuriTamil Nadu DindigulTamil Nadu ErodeTamil Nadu KanchipuramTamil Nadu KanyakumariTamil Nadu KarurTamil Nadu KrishnagiriTamil Nadu MaduraiTamil Nadu NagapattinamTamil Nadu NamakkalTamil Nadu PerambalurTamil Nadu PudukottaiTamil Nadu RamanathapuramTamil Nadu SalemTamil Nadu SivagangaTamil Nadu ThanjavurTamil Nadu The NilgirisTamil Nadu TheniTamil Nadu ThiruvallurTamil Nadu ThiruvarurTamil Nadu TiruchirappalliTamil Nadu TirunelveliTamil Nadu TiruppurTamil Nadu TiruvanamalaiTamil Nadu ToothukudiTamil Nadu Vellore
Annualized previously
treated smear
positive case
notification rate
3 month conversion rate of new
smear positive patients4
3 month conversion
rate of retreatment
patients4
Treatment Success
rate of new smear
positive patients5
Treatment success
rate among smear
positive previously
treated cases5
No (%) of all Smear Positive cases started RNTCP DOTS within 7
days of diagnosis
No (%) of cases (all forms of TB) registered
receiving DOT through a community volunteer
No (%) of all Smear Positive cases
registered within one month of starting
RNTCP DOTS treatment
No (%) of pediatric cases out of all New
cases
No (%) of all cured Smear Positive cases
having end of treatment follow- up sputum done
within 7 days of last dose
37 10 2% 91% 74% 86% 74% 305 86% 343 97% 201 78% 47 8%31 43 7% 92% 63% 85% 69% 415 83% 498 99% 311 86% 50 6%22 55 5% 94% 77% 92% 79% 585 86% 675 100% 462 78% 110 8%39 24 4% 92% 81% 93% 80% 331 76% 435 100% 313 78% 197 27%29 45 7% 91% 81% 92% 86% 391 89% 416 95% 359 89% 203 25%25 54 7% 90% 78% 88% 77% 503 87% 540 94% 479 87% 131 12%26 27 4% 92% 82% 89% 84% 418 89% 459 98% 330 78% 48 6%38 6 2% 91% 74% 87% 86% 299 85% 339 96% 241 81% 115 22%41 18 3% 92% 80% 91% 81% 401 88% 456 100% 279 85% 75 10%24 25 4% 90% 69% 87% 72% 396 80% 460 93% 339 86% 10 1%30 17 6% 92% 73% 93% 76% 257 90% 277 98% 240 93% 53 13%62 48 5% 93% 78% 89% 81% 648 95% 682 100% 483 85% 237 20%42 58 4% 94% 77% 93% 86% 945 80% 1152 98% 776 77% 678 36%35 16 9% 88% 88% 79% 47% 77 97% 77 97% 64 97% 61 28%34 4 12% 100% 100% 60% 80% 15 100% 15 100% 10 100% 18 41%32 11 13% 100% 64% 89% 70% 36 95% 38 100% 46 96% 51 47%29 5 10% 88% 50% 93% 63% 34 94% 36 100% 30 100% 29 42%21 112 8% 91% 71% 88% 64% 753 87% 854 99% 601 88% 154 9%10 17 3% 91% 68% 86% 58% 382 89% 429 100% 351 90% 198 29%16 104 15% 92% 84% 92% 82% 276 81% 331 97% 329 81% 51 6%16 12 4% 86% 88% 85% 70% 130 73% 170 96% 117 80% 16 4%15 81 12% 90% 76% 86% 78% 307 83% 360 98% 221 84% 329 43%18 14 3% 89% 58% 82% 65% 316 86% 363 99% 233 83% 165 30%16 68 7% 93% 73% 89% 67% 466 83% 548 98% 472 93% 255 21%11 13 4% 93% 70% 90% 65% 238 93% 257 100% 122 68% 177 49%9 4 1% 95% 93% 92% 78% 127 84% 151 99% 122 86% 27 9%9 13 4% 91% 74% 87% 75% 177 85% 201 96% 162 91% 74 20%20 81 11% 90% 59% 80% 58% 450 93% 390 81% 370 99% 66 7%10 30 9% 91% 37% 88% 54% 151 83% 173 95% 135 68% 41 11%11 8 2% 89% 70% 87% 58% 188 82% 230 100% 211 98% 130 34%10 27 9% 93% 81% 80% 71% 154 85% 175 97% 112 88% 44 13%9 18 6% 95% 53% 89% 67% 111 65% 136 79% 120 79% 84 23%14 19 7% 91% 54% 87% 59% 160 78% 205 100% 162 92% 93 31%13 45 7% 91% 56% 86% 54% 406 86% 473 100% 236 65% 238 29%8 22 8% 93% 77% 89% 71% 144 81% 152 85% 117 77% 105 34%11 38 7% 86% 63% 79% 56% 352 98% 359 100% 271 93% 160 24%3 9 9% 77% 29% 83% 67% 52 100% 52 100% 41 89% 54 52%15 20 5% 86% 57% 82% 49% 181 81% 222 100% 128 84% 61 14%17 54 6% 95% 78% 89% 67% 441 79% 554 100% 355 83% 252 23%13 43 14% 86% 55% 85% 50% 138 83% 166 100% 94 74% 40 11%8 53 6% 92% 82% 91% 84% 409 95% 430 100% 360 100% 202 23%15 40 5% 89% 66% 82% 60% 363 82% 426 96% 262 72% 259 29%14 14 3% 89% 73% 268 84% 317 100% 0 0% 43 8%15 56 9% 93% 82% 91% 75% 270 71% 374 98% 337 89% 288 39%12 38 9% 88% 72% 82% 61% 271 93% 284 98% 215 87% 75 15%10 33 3% 90% 78% 92% 77% 615 95% 648 100% 504 97% 795 59%
Page 32

Performance of RNTCP Case Detection (2011, Second quarter), Smear Conversion (2011, First quarter), and Treatment Outcomes (2010, Second quarter)
State District
Popu-lation (in lakh)
covered by RNTCP1
No. of suspects examined
Suspects examined per lakh
population
Rate of change in suspects examined per lakh
population (compared
to same quarter in previous
year)
No of Smear
positive patients
diagnosed2
Suspects examined per smear positive
case diagnosed
Rate of change in suspects examined
per s+ case diagnosed (compared
to same quarter in previous
year)
Annualized smear
positive case
detection rate (from
PMR)
Annualized smear
positive case
notification rate [from CFR: sm + cases (NSP
+ Rel + TAD) * 4 /
Pop]
Total patients
registered for
treatment3
Annualized total case
notification rate
Annualized new smear
positive case
notification rate
Annualized new smear negative
case notification
rate
Annualized new extra pulmonary
case notification
rate
Annualized previously
treated case
notification rate
Tamil Nadu Villupuram 32 4148 130 -83% 433 10 -84% 54 86 1365 171 64 46 28 30Tamil Nadu Virudhunagar 19 3995 210 18% 404 10 -8% 85 65 676 142 55 55 16 16Tripura Dhalai * 3 425 122 -13% 29 15 17% 33 32 59 68 32 30 3 2Tripura North Tripura 7 613 92 -10% 60 10 -33% 36 38 119 71 32 19 12 9Tripura South Tripura 9 1144 132 14% 94 12 -4% 44 46 160 74 41 14 8 11Tripura West Tripura 17 2616 151 -5% 313 8 -19% 72 58 392 90 52 12 17 9Uttar Pradesh Agra 44 11204 257 19% 1860 6 -6% 170 131 2452 225 82 29 36 74Uttar Pradesh Aligarh 36 8249 228 17% 1111 7 -5% 123 103 1792 198 83 62 25 28Uttar Pradesh Allahabad 60 11825 198 10% 1651 7 -7% 111 87 2007 134 64 25 15 30Uttar Pradesh Ambedkar Nagar 24 2347 96 6% 430 5 -3% 70 65 547 89 59 14 9 7Uttar Pradesh Auraiya 14 2584 181 26% 410 6 3% 115 109 529 148 85 19 11 33Uttar Pradesh Azamgarh 48 5331 112 9% 782 7 -11% 65 62 1235 103 52 26 7 18Uttar Pradesh Baghpat 14 1970 140 -3% 407 5 -30% 116 112 571 162 79 23 22 38Uttar Pradesh Bahraich ** 32 4615 142 -7% 851 5 -23% 105 102 1464 181 79 59 19 24Uttar Pradesh Ballia 33 2935 88 14% 487 6 -13% 59 60 900 108 58 37 10 4Uttar Pradesh Balrampur 20 2384 117 -4% 354 7 -14% 70 67 637 125 62 44 9 9Uttar Pradesh Banda ** 18 2792 154 6% 476 6 -24% 105 91 660 146 62 22 21 39Uttar Pradesh Barabanki ** 37 5646 153 6% 1014 6 -20% 110 106 1632 177 84 42 22 29Uttar Pradesh Bareilly 44 9476 218 10% 1438 7 -17% 132 100 1843 169 74 39 17 40Uttar Pradesh Basti ** 25 3657 146 39% 566 6 -1% 91 78 836 134 68 36 14 16Uttar Pradesh Bijnor ** 38 6938 183 9% 910 8 -13% 96 95 1261 133 78 12 21 23Uttar Pradesh Budaun ** 37 9796 264 37% 1233 8 -6% 133 132 1791 193 98 41 8 46Uttar Pradesh Bulandshahar 35 6444 182 4% 956 7 -10% 108 108 2071 234 89 79 32 34Uttar Pradesh Chandauli 20 2040 103 -7% 373 5 -22% 75 69 491 99 60 10 11 15Uttar Pradesh Chitrakoot 10 1270 131 14% 192 7 -8% 79 71 376 155 53 41 30 31Uttar Pradesh Deoria 33 2806 85 9% 596 5 -41% 72 72 786 95 62 9 11 14Uttar Pradesh Etah 19 4671 249 31% 747 6 -22% 159 136 893 190 106 27 20 37Uttar Pradesh Etawah 16 3023 187 -20% 553 5 -22% 137 115 703 174 81 26 26 40Uttar Pradesh Faizabad 21 3578 174 29% 603 6 -23% 117 108 964 187 92 56 17 22Uttar Pradesh Farrukhabad 19 2764 145 1% 492 6 -20% 103 89 716 150 74 36 23 17Uttar Pradesh Fatehpur ** 28 4789 172 15% 648 7 -13% 93 86 947 136 68 30 13 24Uttar Pradesh Firozabad 25 3633 147 33% 736 5 -8% 119 103 1128 182 74 31 29 48Uttar Pradesh Gautam Budh Nagar 14 3154 219 17% 540 6 -25% 150 147 1062 295 117 53 79 46Uttar Pradesh Ghaziabad 40 9429 237 25% 1509 6 -10% 152 159 3404 342 124 76 79 63Uttar Pradesh Ghazipur 37 3096 84 -10% 639 5 -27% 69 66 815 88 58 13 5 12Uttar Pradesh Gonda 33 4216 126 39% 743 6 -9% 89 82 1517 181 71 77 17 17Uttar Pradesh Gorakhpur 46 7421 162 39% 1160 6 -16% 101 83 1144 100 77 6 7 10Uttar Pradesh Hamirpur-UP ** 13 2123 168 21% 303 7 -2% 96 84 409 130 75 35 9 11Uttar Pradesh Hardoi ** 41 6894 168 -5% 1187 6 -24% 116 112 2103 205 93 73 10 29Uttar Pradesh Hathras 16 2070 128 -16% 430 5 -31% 107 96 482 120 75 8 11 27Uttar Pradesh Jalaun ** 18 2753 156 1% 420 7 -19% 95 84 658 150 69 43 11 27Uttar Pradesh Jaunpur 47 4378 93 -8% 849 5 -15% 72 71 1596 135 64 40 20 11Uttar Pradesh Jhansi ** 21 3523 167 80% 676 5 -7% 128 96 775 147 72 28 9 38Uttar Pradesh Jyotiba Phule Nagar ** 18 4398 243 15% 554 8 -14% 122 120 760 168 94 36 8 30
Page 33
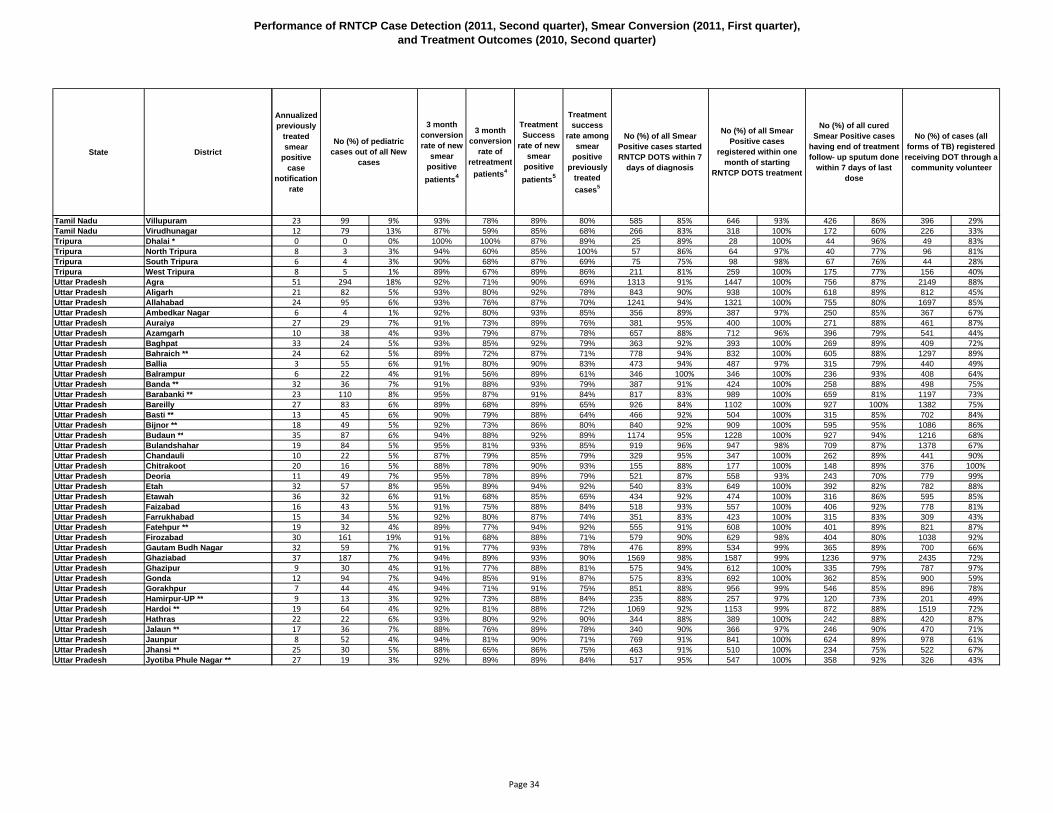
Performance of RNTCP Case Detection (2011, Second quarter), Smear Conversion (2011, First quarter), and Treatment Outcomes (2010, Second quarter)
State District
Tamil Nadu VillupuramTamil Nadu VirudhunagarTripura Dhalai *Tripura North TripuraTripura South TripuraTripura West TripuraUttar Pradesh AgraUttar Pradesh AligarhUttar Pradesh AllahabadUttar Pradesh Ambedkar NagarUttar Pradesh AuraiyaUttar Pradesh AzamgarhUttar Pradesh BaghpatUttar Pradesh Bahraich **Uttar Pradesh BalliaUttar Pradesh BalrampurUttar Pradesh Banda **Uttar Pradesh Barabanki **Uttar Pradesh BareillyUttar Pradesh Basti **Uttar Pradesh Bijnor **Uttar Pradesh Budaun **Uttar Pradesh BulandshaharUttar Pradesh ChandauliUttar Pradesh ChitrakootUttar Pradesh DeoriaUttar Pradesh EtahUttar Pradesh EtawahUttar Pradesh FaizabadUttar Pradesh FarrukhabadUttar Pradesh Fatehpur **Uttar Pradesh FirozabadUttar Pradesh Gautam Budh NagarUttar Pradesh GhaziabadUttar Pradesh GhazipurUttar Pradesh GondaUttar Pradesh GorakhpurUttar Pradesh Hamirpur-UP **Uttar Pradesh Hardoi **Uttar Pradesh HathrasUttar Pradesh Jalaun **Uttar Pradesh JaunpurUttar Pradesh Jhansi **Uttar Pradesh Jyotiba Phule Nagar **
Annualized previously
treated smear
positive case
notification rate
3 month conversion rate of new
smear positive patients4
3 month conversion
rate of retreatment
patients4
Treatment Success
rate of new smear
positive patients5
Treatment success
rate among smear
positive previously
treated cases5
No (%) of all Smear Positive cases started RNTCP DOTS within 7
days of diagnosis
No (%) of cases (all forms of TB) registered
receiving DOT through a community volunteer
No (%) of all Smear Positive cases
registered within one month of starting
RNTCP DOTS treatment
No (%) of pediatric cases out of all New
cases
No (%) of all cured Smear Positive cases
having end of treatment follow- up sputum done
within 7 days of last dose
23 99 9% 93% 78% 89% 80% 585 85% 646 93% 426 86% 396 29%12 79 13% 87% 59% 85% 68% 266 83% 318 100% 172 60% 226 33%0 0 0% 100% 100% 87% 89% 25 89% 28 100% 44 96% 49 83%8 3 3% 94% 60% 85% 100% 57 86% 64 97% 40 77% 96 81%6 4 3% 90% 68% 87% 69% 75 75% 98 98% 67 76% 44 28%8 5 1% 89% 67% 89% 86% 211 81% 259 100% 175 77% 156 40%51 294 18% 92% 71% 90% 69% 1313 91% 1447 100% 756 87% 2149 88%21 82 5% 93% 80% 92% 78% 843 90% 938 100% 618 89% 812 45%24 95 6% 93% 76% 87% 70% 1241 94% 1321 100% 755 80% 1697 85%6 4 1% 92% 80% 93% 85% 356 89% 387 97% 250 85% 367 67%27 29 7% 91% 73% 89% 76% 381 95% 400 100% 271 88% 461 87%10 38 4% 93% 79% 87% 78% 657 88% 712 96% 396 79% 541 44%33 24 5% 93% 85% 92% 79% 363 92% 393 100% 269 89% 409 72%24 62 5% 89% 72% 87% 71% 778 94% 832 100% 605 88% 1297 89%3 55 6% 91% 80% 90% 83% 473 94% 487 97% 315 79% 440 49%6 22 4% 91% 56% 89% 61% 346 100% 346 100% 236 93% 408 64%32 36 7% 91% 88% 93% 79% 387 91% 424 100% 258 88% 498 75%23 110 8% 95% 87% 91% 84% 817 83% 989 100% 659 81% 1197 73%27 83 6% 89% 68% 89% 65% 926 84% 1102 100% 927 100% 1382 75%13 45 6% 90% 79% 88% 64% 466 92% 504 100% 315 85% 702 84%18 49 5% 92% 73% 86% 80% 840 92% 909 100% 595 95% 1086 86%35 87 6% 94% 88% 92% 89% 1174 95% 1228 100% 927 94% 1216 68%19 84 5% 95% 81% 93% 85% 919 96% 947 98% 709 87% 1378 67%10 22 5% 87% 79% 85% 79% 329 95% 347 100% 262 89% 441 90%20 16 5% 88% 78% 90% 93% 155 88% 177 100% 148 89% 376 100%11 49 7% 95% 78% 89% 79% 521 87% 558 93% 243 70% 779 99%32 57 8% 95% 89% 94% 92% 540 83% 649 100% 392 82% 782 88%36 32 6% 91% 68% 85% 65% 434 92% 474 100% 316 86% 595 85%16 43 5% 91% 75% 88% 84% 518 93% 557 100% 406 92% 778 81%15 34 5% 92% 80% 87% 74% 351 83% 423 100% 315 83% 309 43%19 32 4% 89% 77% 94% 92% 555 91% 608 100% 401 89% 821 87%30 161 19% 91% 68% 88% 71% 579 90% 629 98% 404 80% 1038 92%32 59 7% 91% 77% 93% 78% 476 89% 534 99% 365 89% 700 66%37 187 7% 94% 89% 93% 90% 1569 98% 1587 99% 1236 97% 2435 72%9 30 4% 91% 77% 88% 81% 575 94% 612 100% 335 79% 787 97%12 94 7% 94% 85% 91% 87% 575 83% 692 100% 362 85% 900 59%7 44 4% 94% 71% 91% 75% 851 88% 956 99% 546 85% 896 78%9 13 3% 92% 73% 88% 84% 235 88% 257 97% 120 73% 201 49%19 64 4% 92% 81% 88% 72% 1069 92% 1153 99% 872 88% 1519 72%22 22 6% 93% 80% 92% 90% 344 88% 389 100% 242 88% 420 87%17 36 7% 88% 76% 89% 78% 340 90% 366 97% 246 90% 470 71%8 52 4% 94% 81% 90% 71% 769 91% 841 100% 624 89% 978 61%25 30 5% 88% 65% 86% 75% 463 91% 510 100% 234 75% 522 67%27 19 3% 92% 89% 89% 84% 517 95% 547 100% 358 92% 326 43%
Page 34
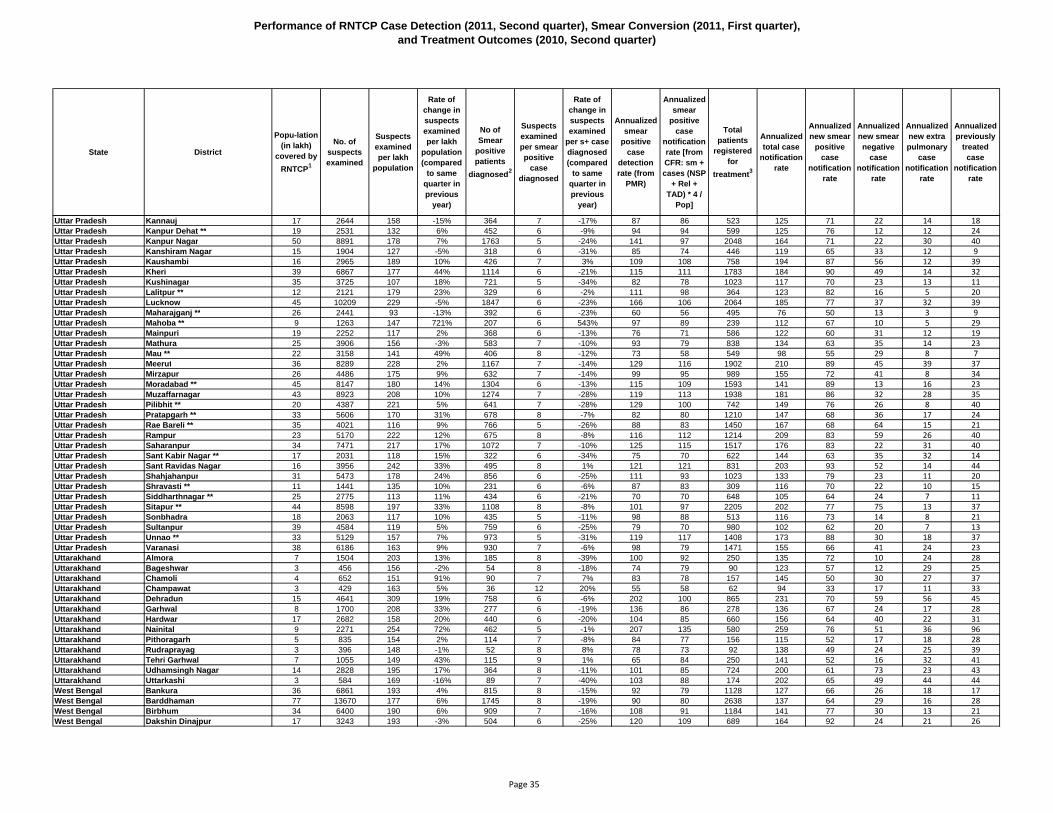
Performance of RNTCP Case Detection (2011, Second quarter), Smear Conversion (2011, First quarter), and Treatment Outcomes (2010, Second quarter)
State District
Popu-lation (in lakh)
covered by RNTCP1
No. of suspects examined
Suspects examined per lakh
population
Rate of change in suspects examined per lakh
population (compared
to same quarter in previous
year)
No of Smear
positive patients
diagnosed2
Suspects examined per smear positive
case diagnosed
Rate of change in suspects examined
per s+ case diagnosed (compared
to same quarter in previous
year)
Annualized smear
positive case
detection rate (from
PMR)
Annualized smear
positive case
notification rate [from CFR: sm + cases (NSP
+ Rel + TAD) * 4 /
Pop]
Total patients
registered for
treatment3
Annualized total case
notification rate
Annualized new smear
positive case
notification rate
Annualized new smear negative
case notification
rate
Annualized new extra pulmonary
case notification
rate
Annualized previously
treated case
notification rate
Uttar Pradesh Kannauj 17 2644 158 -15% 364 7 -17% 87 86 523 125 71 22 14 18Uttar Pradesh Kanpur Dehat ** 19 2531 132 6% 452 6 -9% 94 94 599 125 76 12 12 24Uttar Pradesh Kanpur Nagar 50 8891 178 7% 1763 5 -24% 141 97 2048 164 71 22 30 40Uttar Pradesh Kanshiram Nagar 15 1904 127 -5% 318 6 -31% 85 74 446 119 65 33 12 9Uttar Pradesh Kaushambi 16 2965 189 10% 426 7 3% 109 108 758 194 87 56 12 39Uttar Pradesh Kheri 39 6867 177 44% 1114 6 -21% 115 111 1783 184 90 49 14 32Uttar Pradesh Kushinagar 35 3725 107 18% 721 5 -34% 82 78 1023 117 70 23 13 11Uttar Pradesh Lalitpur ** 12 2121 179 23% 329 6 -2% 111 98 364 123 82 16 5 20Uttar Pradesh Lucknow 45 10209 229 -5% 1847 6 -23% 166 106 2064 185 77 37 32 39Uttar Pradesh Maharajganj ** 26 2441 93 -13% 392 6 -23% 60 56 495 76 50 13 3 9Uttar Pradesh Mahoba ** 9 1263 147 721% 207 6 543% 97 89 239 112 67 10 5 29Uttar Pradesh Mainpuri 19 2252 117 2% 368 6 -13% 76 71 586 122 60 31 12 19Uttar Pradesh Mathura 25 3906 156 -3% 583 7 -10% 93 79 838 134 63 35 14 23Uttar Pradesh Mau ** 22 3158 141 49% 406 8 -12% 73 58 549 98 55 29 8 7Uttar Pradesh Meerut 36 8289 228 2% 1167 7 -14% 129 116 1902 210 89 45 39 37Uttar Pradesh Mirzapur 26 4486 175 9% 632 7 -14% 99 95 989 155 72 41 8 34Uttar Pradesh Moradabad ** 45 8147 180 14% 1304 6 -13% 115 109 1593 141 89 13 16 23Uttar Pradesh Muzaffarnagar 43 8923 208 10% 1274 7 -28% 119 113 1938 181 86 32 28 35Uttar Pradesh Pilibhit ** 20 4387 221 5% 641 7 -28% 129 100 742 149 76 26 8 40Uttar Pradesh Pratapgarh ** 33 5606 170 31% 678 8 -7% 82 80 1210 147 68 36 17 24Uttar Pradesh Rae Bareli ** 35 4021 116 9% 766 5 -26% 88 83 1450 167 68 64 15 21Uttar Pradesh Rampur 23 5170 222 12% 675 8 -8% 116 112 1214 209 83 59 26 40Uttar Pradesh Saharanpur 34 7471 217 17% 1072 7 -10% 125 115 1517 176 83 22 31 40Uttar Pradesh Sant Kabir Nagar ** 17 2031 118 15% 322 6 -34% 75 70 622 144 63 35 32 14Uttar Pradesh Sant Ravidas Nagar 16 3956 242 33% 495 8 1% 121 121 831 203 93 52 14 44Uttar Pradesh Shahjahanpur 31 5473 178 24% 856 6 -25% 111 93 1023 133 79 23 11 20Uttar Pradesh Shravasti ** 11 1441 135 10% 231 6 -6% 87 83 309 116 70 22 10 15Uttar Pradesh Siddharthnagar ** 25 2775 113 11% 434 6 -21% 70 70 648 105 64 24 7 11Uttar Pradesh Sitapur ** 44 8598 197 33% 1108 8 -8% 101 97 2205 202 77 75 13 37Uttar Pradesh Sonbhadra 18 2063 117 10% 435 5 -11% 98 88 513 116 73 14 8 21Uttar Pradesh Sultanpur 39 4584 119 5% 759 6 -25% 79 70 980 102 62 20 7 13Uttar Pradesh Unnao ** 33 5129 157 7% 973 5 -31% 119 117 1408 173 88 30 18 37Uttar Pradesh Varanasi 38 6186 163 9% 930 7 -6% 98 79 1471 155 66 41 24 23Uttarakhand Almora 7 1504 203 13% 185 8 -39% 100 92 250 135 72 10 24 28Uttarakhand Bageshwar 3 456 156 -2% 54 8 -18% 74 79 90 123 57 12 29 25Uttarakhand Chamoli 4 652 151 91% 90 7 7% 83 78 157 145 50 30 27 37Uttarakhand Champawat 3 429 163 5% 36 12 20% 55 58 62 94 33 17 11 33Uttarakhand Dehradun 15 4641 309 19% 758 6 -6% 202 100 865 231 70 59 56 45Uttarakhand Garhwal 8 1700 208 33% 277 6 -19% 136 86 278 136 67 24 17 28Uttarakhand Hardwar 17 2682 158 20% 440 6 -20% 104 85 660 156 64 40 22 31Uttarakhand Nainital 9 2271 254 72% 462 5 -1% 207 135 580 259 76 51 36 96Uttarakhand Pithoragarh 5 835 154 2% 114 7 -8% 84 77 156 115 52 17 18 28Uttarakhand Rudraprayag 3 396 148 -1% 52 8 8% 78 73 92 138 49 24 25 39Uttarakhand Tehri Garhwal 7 1055 149 43% 115 9 1% 65 84 250 141 52 16 32 41Uttarakhand Udhamsingh Nagar 14 2828 195 17% 364 8 -11% 101 85 724 200 61 73 23 43Uttarakhand Uttarkashi 3 584 169 -16% 89 7 -40% 103 88 174 202 65 49 44 44West Bengal Bankura 36 6861 193 4% 815 8 -15% 92 79 1128 127 66 26 18 17West Bengal Barddhaman 77 13670 177 6% 1745 8 -19% 90 80 2638 137 64 29 16 28West Bengal Birbhum 34 6400 190 6% 909 7 -16% 108 91 1184 141 77 30 13 21West Bengal Dakshin Dinajpur 17 3243 193 -3% 504 6 -25% 120 109 689 164 92 24 21 26
Page 35
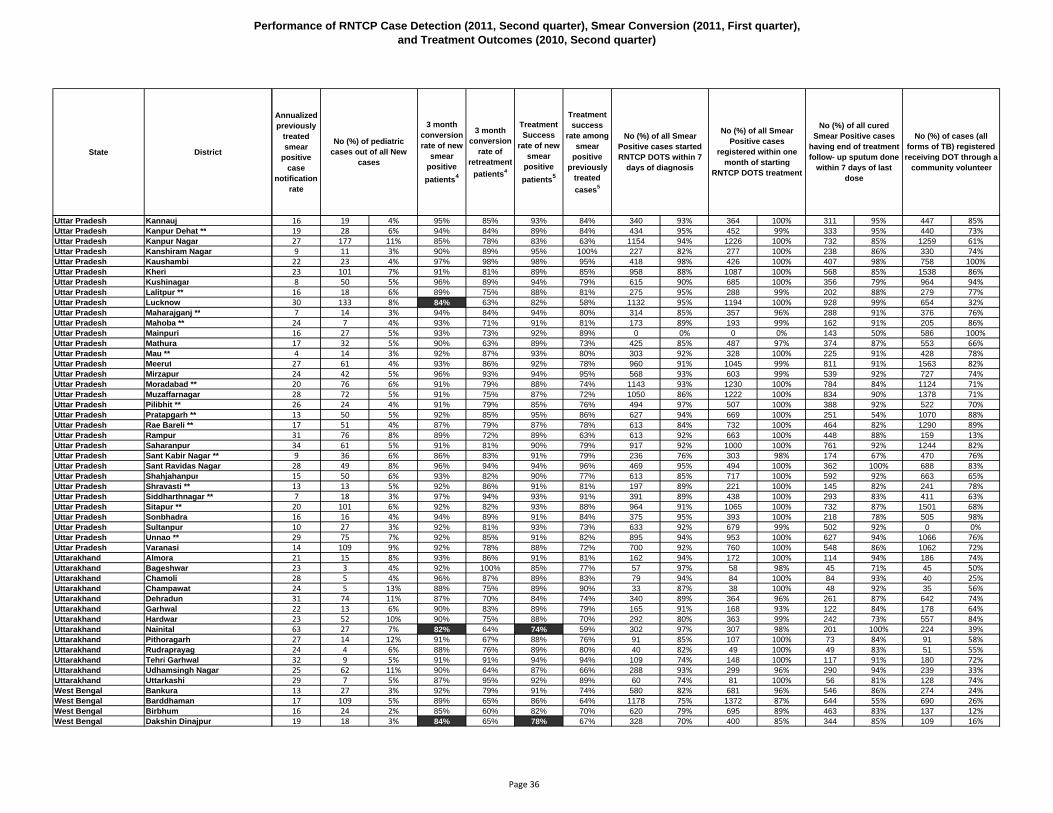
Performance of RNTCP Case Detection (2011, Second quarter), Smear Conversion (2011, First quarter), and Treatment Outcomes (2010, Second quarter)
State District
Uttar Pradesh KannaujUttar Pradesh Kanpur Dehat **Uttar Pradesh Kanpur NagarUttar Pradesh Kanshiram NagarUttar Pradesh KaushambiUttar Pradesh KheriUttar Pradesh KushinagarUttar Pradesh Lalitpur **Uttar Pradesh LucknowUttar Pradesh Maharajganj **Uttar Pradesh Mahoba **Uttar Pradesh MainpuriUttar Pradesh MathuraUttar Pradesh Mau **Uttar Pradesh MeerutUttar Pradesh MirzapurUttar Pradesh Moradabad **Uttar Pradesh MuzaffarnagarUttar Pradesh Pilibhit **Uttar Pradesh Pratapgarh **Uttar Pradesh Rae Bareli **Uttar Pradesh RampurUttar Pradesh SaharanpurUttar Pradesh Sant Kabir Nagar **Uttar Pradesh Sant Ravidas NagarUttar Pradesh ShahjahanpurUttar Pradesh Shravasti **Uttar Pradesh Siddharthnagar **Uttar Pradesh Sitapur **Uttar Pradesh SonbhadraUttar Pradesh SultanpurUttar Pradesh Unnao **Uttar Pradesh VaranasiUttarakhand AlmoraUttarakhand BageshwarUttarakhand ChamoliUttarakhand ChampawatUttarakhand DehradunUttarakhand GarhwalUttarakhand HardwarUttarakhand NainitalUttarakhand PithoragarhUttarakhand RudraprayagUttarakhand Tehri GarhwalUttarakhand Udhamsingh NagarUttarakhand UttarkashiWest Bengal BankuraWest Bengal BarddhamanWest Bengal BirbhumWest Bengal Dakshin Dinajpur
Annualized previously
treated smear
positive case
notification rate
3 month conversion rate of new
smear positive patients4
3 month conversion
rate of retreatment
patients4
Treatment Success
rate of new smear
positive patients5
Treatment success
rate among smear
positive previously
treated cases5
No (%) of all Smear Positive cases started RNTCP DOTS within 7
days of diagnosis
No (%) of cases (all forms of TB) registered
receiving DOT through a community volunteer
No (%) of all Smear Positive cases
registered within one month of starting
RNTCP DOTS treatment
No (%) of pediatric cases out of all New
cases
No (%) of all cured Smear Positive cases
having end of treatment follow- up sputum done
within 7 days of last dose
16 19 4% 95% 85% 93% 84% 340 93% 364 100% 311 95% 447 85%19 28 6% 94% 84% 89% 84% 434 95% 452 99% 333 95% 440 73%27 177 11% 85% 78% 83% 63% 1154 94% 1226 100% 732 85% 1259 61%9 11 3% 90% 89% 95% 100% 227 82% 277 100% 238 86% 330 74%22 23 4% 97% 98% 98% 95% 418 98% 426 100% 407 98% 758 100%23 101 7% 91% 81% 89% 85% 958 88% 1087 100% 568 85% 1538 86%8 50 5% 96% 89% 94% 79% 615 90% 685 100% 356 79% 964 94%16 18 6% 89% 75% 88% 81% 275 95% 288 99% 202 88% 279 77%30 133 8% 84% 63% 82% 58% 1132 95% 1194 100% 928 99% 654 32%7 14 3% 94% 84% 94% 80% 314 85% 357 96% 288 91% 376 76%24 7 4% 93% 71% 91% 81% 173 89% 193 99% 162 91% 205 86%16 27 5% 93% 73% 92% 89% 0 0% 0 0% 143 50% 586 100%17 32 5% 90% 63% 89% 73% 425 85% 487 97% 374 87% 553 66%4 14 3% 92% 87% 93% 80% 303 92% 328 100% 225 91% 428 78%27 61 4% 93% 86% 92% 78% 960 91% 1045 99% 811 91% 1563 82%24 42 5% 96% 93% 94% 95% 568 93% 603 99% 539 92% 727 74%20 76 6% 91% 79% 88% 74% 1143 93% 1230 100% 784 84% 1124 71%28 72 5% 91% 75% 87% 72% 1050 86% 1222 100% 834 90% 1378 71%26 24 4% 91% 79% 85% 76% 494 97% 507 100% 388 92% 522 70%13 50 5% 92% 85% 95% 86% 627 94% 669 100% 251 54% 1070 88%17 51 4% 87% 79% 87% 78% 613 84% 732 100% 464 82% 1290 89%31 76 8% 89% 72% 89% 63% 613 92% 663 100% 448 88% 159 13%34 61 5% 91% 81% 90% 79% 917 92% 1000 100% 761 92% 1244 82%9 36 6% 86% 83% 91% 79% 236 76% 303 98% 174 67% 470 76%28 49 8% 96% 94% 94% 96% 469 95% 494 100% 362 100% 688 83%15 50 6% 93% 82% 90% 77% 613 85% 717 100% 592 92% 663 65%13 13 5% 92% 86% 91% 81% 197 89% 221 100% 145 82% 241 78%7 18 3% 97% 94% 93% 91% 391 89% 438 100% 293 83% 411 63%20 101 6% 92% 82% 93% 88% 964 91% 1065 100% 732 87% 1501 68%16 16 4% 94% 89% 91% 84% 375 95% 393 100% 218 78% 505 98%10 27 3% 92% 81% 93% 73% 633 92% 679 99% 502 92% 0 0%29 75 7% 92% 85% 91% 82% 895 94% 953 100% 627 94% 1066 76%14 109 9% 92% 78% 88% 72% 700 92% 760 100% 548 86% 1062 72%21 15 8% 93% 86% 91% 81% 162 94% 172 100% 114 94% 186 74%23 3 4% 92% 100% 85% 77% 57 97% 58 98% 45 71% 45 50%28 5 4% 96% 87% 89% 83% 79 94% 84 100% 84 93% 40 25%24 5 13% 88% 75% 89% 90% 33 87% 38 100% 48 92% 35 56%31 74 11% 87% 70% 84% 74% 340 89% 364 96% 261 87% 642 74%22 13 6% 90% 83% 89% 79% 165 91% 168 93% 122 84% 178 64%23 52 10% 90% 75% 88% 70% 292 80% 363 99% 242 73% 557 84%63 27 7% 82% 64% 74% 59% 302 97% 307 98% 201 100% 224 39%27 14 12% 91% 67% 88% 76% 91 85% 107 100% 73 84% 91 58%24 4 6% 88% 76% 89% 80% 40 82% 49 100% 49 83% 51 55%32 9 5% 91% 91% 94% 94% 109 74% 148 100% 117 91% 180 72%25 62 11% 90% 64% 87% 66% 288 93% 299 96% 290 94% 239 33%29 7 5% 87% 95% 92% 89% 60 74% 81 100% 56 81% 128 74%13 27 3% 92% 79% 91% 74% 580 82% 681 96% 546 86% 274 24%17 109 5% 89% 65% 86% 64% 1178 75% 1372 87% 644 55% 690 26%16 24 2% 85% 60% 82% 70% 620 79% 695 89% 463 83% 137 12%19 18 3% 84% 65% 78% 67% 328 70% 400 85% 344 85% 109 16%
Page 36
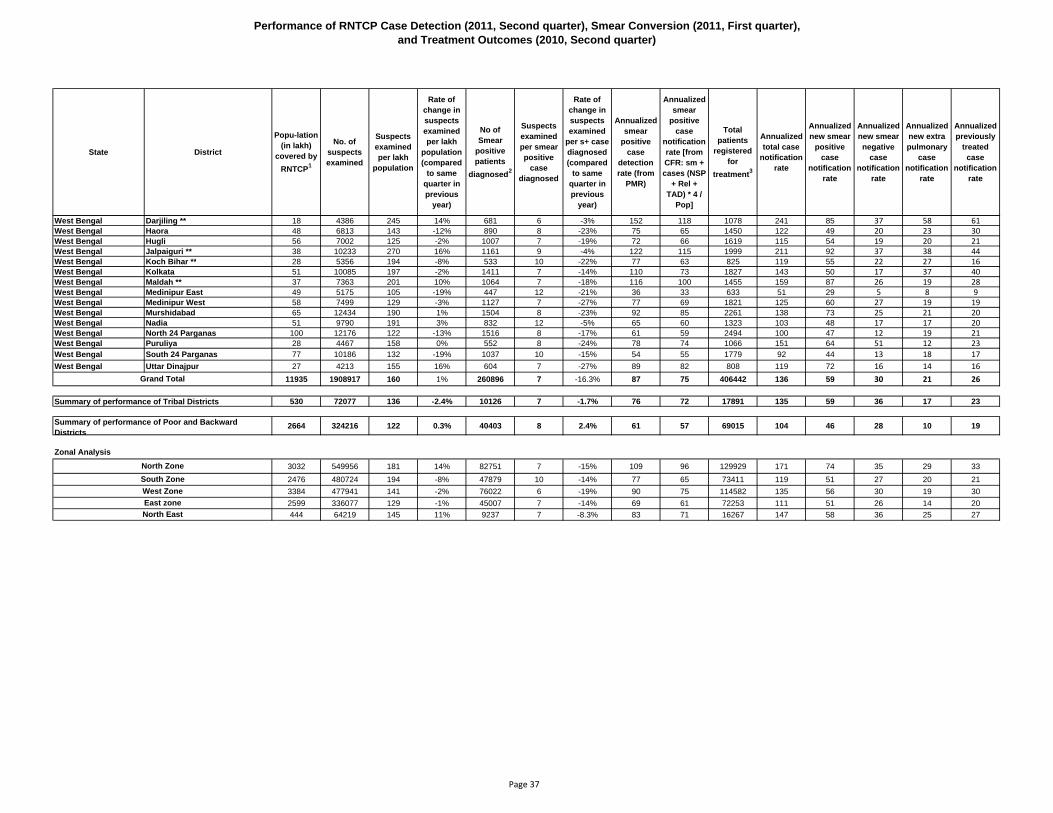
Performance of RNTCP Case Detection (2011, Second quarter), Smear Conversion (2011, First quarter), and Treatment Outcomes (2010, Second quarter)
State District
Popu-lation (in lakh)
covered by RNTCP1
No. of suspects examined
Suspects examined per lakh
population
Rate of change in suspects examined per lakh
population (compared
to same quarter in previous
year)
No of Smear
positive patients
diagnosed2
Suspects examined per smear positive
case diagnosed
Rate of change in suspects examined
per s+ case diagnosed (compared
to same quarter in previous
year)
Annualized smear
positive case
detection rate (from
PMR)
Annualized smear
positive case
notification rate [from CFR: sm + cases (NSP
+ Rel + TAD) * 4 /
Pop]
Total patients
registered for
treatment3
Annualized total case
notification rate
Annualized new smear
positive case
notification rate
Annualized new smear negative
case notification
rate
Annualized new extra pulmonary
case notification
rate
Annualized previously
treated case
notification rate
West Bengal Darjiling ** 18 4386 245 14% 681 6 -3% 152 118 1078 241 85 37 58 61West Bengal Haora 48 6813 143 -12% 890 8 -23% 75 65 1450 122 49 20 23 30West Bengal Hugli 56 7002 125 -2% 1007 7 -19% 72 66 1619 115 54 19 20 21West Bengal Jalpaiguri ** 38 10233 270 16% 1161 9 -4% 122 115 1999 211 92 37 38 44West Bengal Koch Bihar ** 28 5356 194 -8% 533 10 -22% 77 63 825 119 55 22 27 16West Bengal Kolkata 51 10085 197 -2% 1411 7 -14% 110 73 1827 143 50 17 37 40West Bengal Maldah ** 37 7363 201 10% 1064 7 -18% 116 100 1455 159 87 26 19 28West Bengal Medinipur East 49 5175 105 -19% 447 12 -21% 36 33 633 51 29 5 8 9West Bengal Medinipur West 58 7499 129 -3% 1127 7 -27% 77 69 1821 125 60 27 19 19West Bengal Murshidabad 65 12434 190 1% 1504 8 -23% 92 85 2261 138 73 25 21 20West Bengal Nadia 51 9790 191 3% 832 12 -5% 65 60 1323 103 48 17 17 20West Bengal North 24 Parganas 100 12176 122 -13% 1516 8 -17% 61 59 2494 100 47 12 19 21West Bengal Puruliya 28 4467 158 0% 552 8 -24% 78 74 1066 151 64 51 12 23West Bengal South 24 Parganas 77 10186 132 -19% 1037 10 -15% 54 55 1779 92 44 13 18 17West Bengal Uttar Dinajpur 27 4213 155 16% 604 7 -27% 89 82 808 119 72 16 14 16
11935 1908917 160 1% 260896 7 -16.3% 87 75 406442 136 59 30 21 26
530 72077 136 -2.4% 10126 7 -1.7% 76 72 17891 135 59 36 17 23
2664 324216 122 0.3% 40403 8 2.4% 61 57 69015 104 46 28 10 19
Zonal Analysis
3032 549956 181 14% 82751 7 -15% 109 96 129929 171 74 35 29 332476 480724 194 -8% 47879 10 -14% 77 65 73411 119 51 27 20 213384 477941 141 -2% 76022 6 -19% 90 75 114582 135 56 30 19 302599 336077 129 -1% 45007 7 -14% 69 61 72253 111 51 26 14 20444 64219 145 11% 9237 7 -8.3% 83 71 16267 147 58 36 25 27North East
West ZoneEast zone
Grand Total
Summary of performance of Tribal Districts
Summary of performance of Poor and Backward Districts
South ZoneNorth Zone
Page 37
Performance of RNTCP Case Detection (2011, Second quarter), Smear Conversion (2011, First quarter), and Treatment Outcomes (2010, Second quarter)
State District
West Bengal Darjiling **West Bengal HaoraWest Bengal HugliWest Bengal Jalpaiguri **West Bengal Koch Bihar **West Bengal KolkataWest Bengal Maldah **West Bengal Medinipur EastWest Bengal Medinipur WestWest Bengal MurshidabadWest Bengal NadiaWest Bengal North 24 ParganasWest Bengal PuruliyaWest Bengal South 24 ParganasWest Bengal Uttar Dinajpur
Zonal Analysis
North East
West ZoneEast zone
Grand Total
Summary of performance of Tribal Districts
Summary of performance of Poor and Backward Districts
South ZoneNorth Zone
Annualized previously
treated smear
positive case
notification rate
3 month conversion rate of new
smear positive patients4
3 month conversion
rate of retreatment
patients4
Treatment Success
rate of new smear
positive patients5
Treatment success
rate among smear
positive previously
treated cases5
No (%) of all Smear Positive cases started RNTCP DOTS within 7
days of diagnosis
No (%) of cases (all forms of TB) registered
receiving DOT through a community volunteer
No (%) of all Smear Positive cases
registered within one month of starting
RNTCP DOTS treatment
No (%) of pediatric cases out of all New
cases
No (%) of all cured Smear Positive cases
having end of treatment follow- up sputum done
within 7 days of last dose
38 61 8% 92% 54% 84% 53% 397 73% 489 89% 349 79% 497 46%19 88 8% 85% 71% 82% 61% 687 85% 787 97% 505 88% 602 42%13 47 4% 89% 63% 86% 63% 679 72% 935 99% 578 78% 436 27%29 127 8% 89% 66% 85% 64% 1071 93% 1131 98% 956 95% 161 8%10 16 2% 90% 70% 86% 56% 333 74% 421 94% 305 78% 147 18%26 151 11% 78% 56% 78% 56% 849 87% 974 100% 650 97% 539 30%18 73 6% 88% 73% 83% 68% 717 75% 847 88% 496 65% 161 11%5 12 2% 85% 62% 83% 55% 333 80% 390 94% 203 63% 78 12%10 42 3% 91% 71% 88% 70% 805 80% 740 73% 509 60% 384 21%14 97 5% 92% 68% 89% 69% 1131 79% 1385 97% 942 82% 421 19%13 39 4% 90% 66% 86% 64% 647 83% 776 99% 506 82% 270 20%14 91 5% 85% 58% 82% 58% 1435 94% 1520 99% 1117 95% 1445 58%10 34 4% 91% 73% 89% 66% 423 80% 487 93% 340 73% 117 11%13 68 5% 88% 62% 85% 67% 848 76% 1106 100% 738 82% 511 29%11 30 4% 87% 56% 87% 72% 504 89% 551 98% 383 88% 116 14%
18 22901 7% 90% 72% 88% 71% 200317 88% 221072 97% 152289 83% 194119 48%
15 910 6% 90% 74% 88% 72% 8281 85% 9330 96% 5836 77% 9560 53%
12 3198 6% 90% 74% 89% 75% 33662 87% 37659 97% 25037 80% 38279 55%
23 7811 7% 91% 77% 89% 75% 67000 91% 72250 98% 51139 89% 67382 52%15 4064 7% 90% 70% 86% 67% 35787 87% 39549 96% 27496 83% 41373 56%21 6463 7% 91% 71% 88% 70% 56523 87% 62608 96% 43236 82% 43556 38%11 3543 6% 89% 68% 87% 70% 34017 84% 39156 96% 25364 77% 35855 50%15 1020 8% 88% 67% 84% 67% 6990 86% 7509 93% 5054 79% 5953 37%
* Tribal Districts (more than 50% tribal population) ** Poor/Backward District † Tribal & Poor/Backward Districts
1 Projected population based on census population of 2001 is used for calculation of case-detection rate. 1 lakh = 100,000 population2 Smear positive patients diagnosed include new smear positive cases and smear positive retreatment cases3 Total patients registered for treatment includes new sputum smear positive cases, new smear negative cases, new extra-pulmonary cases, new others ,relapse,failure,TAD and retreatment others4 Sputum Conversion rate is not expected for new districts that began implementing RNTCP in 4th quarter 20105 Cure rate and Success rate are not expected for new districts that began implementing RNTCP after 4th quarter 2009Values for grey areas are not expected
Estimated New Smear Positive cases / lakh population based on ARTI data for North Zone (Chandigarh, Delhi, Haryana, Himachal Pradesh, Jammu & Kashmir, Punjab, Uttar Pradesh, Uttaranchal) is 95; East Zone (Andaman & Nicobar, Arunachal Pradesh, Assam, Bihar, Jharkhand, Manipur, Meghalaya, Mizoram, Nagaland, Sikkim, Tripura, West Bengal) is 75; South Zone (Andhra Pradesh, Karnataka, Lakshdweep, Pondicherry, Tamil Nadu ) is 75 and West Zone (Chhattisgarh, Dadra & Nagar Haveli, Daman & Diu, Goa, Gujarat, Madhya Pradesh, Maharashtra, Rajasthan) is 80; Orissa is 85, Kerala is 50
Page 38
Total Population (In lakhs)Total No. of districts
HIV Positive
HIV Negative
HIV Positive
HIV Negative
HIV Positive
HIV Negative
HIV Positive
HIV Negative
HIV Positive
HIV Negative
HIV Positive
HIV Negative
HIV Positive
HIV Negative
HIV Positive
HIV Negative
1. Number of TB suspects referred from VCTCs to RNTCP facilities*
9005 13325 6416 16900 9122 24586 391 164 184 13 102 314 4224 20388 29444 75690
2. Out of the above persons, number diagnosed as having TB: a) Sputum Positive TB 526 1521 373 1063 365 1973 4 11 2 0 4 20 160 1077 1434 5665b) Sputum Negative TB 269 301 162 203 267 683 0 4 1 0 3 6 142 218 844 1415c) Extra-Pulmonary TB 28 54 100 126 169 208 1 1 3 0 1 1 59 64 361 454
d) Total diagnosed TB patients 823 1876 635 1392 801 2864 5 16 6 0 8 27 361 1359 2639 7534
3. Out of above total diagnosedTB patients (d), numberreceiving DOTS
635 1649 567 1270 709 2635 5 16 1 0 7 27 306 1115 2230 6712
StateTotal TB patients
registered
Number with
known HIV
status
Number of TB
patients who are
HIV positive
Proportion with known
HIV status
Proportion of
tested TB patients who are
HIV positive
Proportion of
registered TB
patients who are
HIV positive
Andhra Pradesh 28046 23165 2997 83% 13% 10.7%Assam * 10624 2620 17 25% 1% 0.2%Chandigarh ** 683 670 7 98% 1% 1.0%Delhi 15014 9655 141 64% 1% 0.9%Goa 468 448 29 96% 6% 6.2%Gujarat 19111 17113 879 90% 5% 4.6%Haryana 11040 6120 94 55% 2% 0.9%Himachal Pradesh *** 4106 1251 21 30% 2% 0.5%Karnataka 17793 16322 2388 92% 15% 13.4%Kerala ** 6495 3583 108 55% 3% 1.7%Maharashtra 33536 26418 2832 79% 11% 8.4%Manipur 871 426 36 49% 8% 4.1%Mizoram 604 393 34 65% 9% 5.6%Nagaland 966 478 47 49% 10% 4.9%Pondicherry 435 238 4 55% 2% 0.9%Punjab ** 11936 7701 141 65% 2% 1.2%Tamil Nadu 20639 18346 1455 89% 8% 7.0%Uttaranchal *** 4338 1540 12 36% 1% 0.3%West Bengal ** 28077 13000 240 46% 2% 0.9%Grand Total 214782 149487 11482 70% 8% 5.3%
* REPORTING FROM 1Q10** REPORTING FROM 2Q10*** Reporting started from 4Q10
HIV status of the TB patients - 2nd Quarter 2011
24
Referral of TB Suspects from ICTCs to RNTCP diagnostic units (2nd quarter 2011)
326510 22
(Reported by Phase-I states implementing Joint TB-HIV Action Plan
31 55 9 8 11 31840 588 1111 24
Andhra Pradesh Karnataka Maharashtra Manipur
169
Nagaland TotalMizoram Tamil Nadu670
Page 39
States All TB‐HIV NSP Total Case Registered
Treatment Success
Died Failure Default Transferred Out
Andhra Pradesh 1240 79% 14% 3% 4% 1%Goa 10 80% 10% 0% 10% 0%Gujarat 160 77% 13% 1% 8% 1%Karnataka 683 74% 17% 3% 6% 1%Maharashtra 948 74% 17% 2% 4% 2%Manipur 21 90% 5% 5% 0% 0%Mizoram 9 89% 0% 0% 11% 0%Nagaland 10 60% 0% 10% 20% 10%Pondicherry 1 0% 100% 0% 0% 0%Tamil Nadu 380 79% 14% 0% 8% ‐1%Grand Total 3462 76% 15% 2% 5% 1%
States All TB‐HIV Total Case Registered
Treatment Success
Died Failure Default Transferred out
Andhra Pradesh 3077 80% 13% 2% 3% 1%Goa 42 81% 14% 0% 5% 0%Gujarat 765 76% 12% 1% 8% 2%Karnataka 2244 73% 16% 1% 7% 2%Maharashtra 3155 75% 13% 1% 6% 5%Manipur 55 49% 11% 0% 4% 36%Mizoram 52 83% 8% 0% 10% 0%Nagaland 31 81% 3% 3% 6% 6%Pondicherry 6 50% 50% 0% 0% 0%Tamil Nadu 1450 81% 11% 1% 7% 1%Grand Total 10877 77% 13% 1% 6% 3%
States % CPT % ARTAndhra Pradesh 92% 41%
Goa 100% 74%Gujarat 95% 70%
Karnataka 99% 72%Maharashtra 94% 60%Manipur 56% 47%Mizoram 102% 60%Nagaland 87% 68%
Pondicherry 100% 67%Tamil Nadu 87% 57%Grand Total 94% 57%
Treatment Outcome of HIV positive TB patients registered in Second quarter 2010
Proportion of HIV positive TB patients receiving CPT and ART during TB treatment, Second quarter 2010
DOTS Plus Implementation, Diagnosis, 6 months interim, 12 months Culture Conversion and Treatment Outcome of MDR TB Case(Reported by DOTS Plus Sites of Implementing States - 2nd Quarter 2011)
Total Population (In lacs)
Total number of districts
Number of districts implementing DOTS Plus
Population of districts implementing DOTS Plus (in lacs)
% population with access to MDR TB services under RNTCP in 2Q11
Number of DOTS Plus Sites functional in the state
Number of S+ Re-treatment cases registered in districts implementing DOTS Plus in 2Q11
Number of MDR TB Suspects subjected to C-DST in 2Q11
Proportion of S+ RT cases registered in districts implementing DOTS Plus who were tested for MDR-TB $
Number of MDR TB Cases detected in 2Q11
Number of MDR TB Cases detected that were registered and initiated on Cat-IV treatment in 2Q11 #
Number of MDR TB Case registered and initiated on Cat IV in the 4 cohorts 6-9 months prior (3Q10) (a)
Andhra Pradesh 847.35 24 11 435.8 51% 3 3993 396 10% 117 82 97 55 57% 4 4% 12 12%Delhi 184.5 24 24 184.5 100% 4 1757 491 28% 117 98 117 87 74% 7 6% 13 11%
Gujarat* (+DD) 592.9 32 25 499.7 84% 2 4030 574 14% 162 143 186 96 52% 15 8% 20 11%Haryana 254.39 21 7 95.89 38% 1 2093 77 4% 22 13 19 13 68% 2 11% 0 0%
Himachal Pradesh 67.9 12 2 20.5 30% 2 639 64 10% 38 20
Jharkhand 314.7 24 2 54.6 17% 1 880 85 10% 19 2Karnataka 594.19 31 5 127.5 21% 1 2339 97 4% 0 0
Kerala 345.63 14 14 345.6 100% 2 569 229 40% 12 23 36 20 56% 0 0% 1 3%Madhya Pradesh 722.0 50 2 51.7 7% 1 3103 42 1% 2 0
Mahara-shtra 1126.6 55 21 399.2 35% 4 4039 695 17% 126 101 58 31 53% 6 10% 4 7%Orissa 407.5 31 4 81.6 20% 1 1139 13 1% 19 13 17 8 47% 2 12% 0 0%
Puducherry 1.4 1 1 1.4 100% 1 76 31 41% 0 1Rajasthan 678.3 33 16 377.2 56% 1 5862 239 4% 66 35 56 33 59% 7 13% 1 2%
Tamil Nadu 674.4 31 25 553.3 82% 1 2368 417 18% 62 52 38 30 79% 2 5% 1 3%Uttar Pradesh 2007.6 71 1 43.7 2% 1 10041 46 0.5% 9 13West Bengal 895.0 19 5 234.3 26% 2 3435 148 4% 72 44 61 48 79% 2 3% 3 5%
State
Indicators on Coverage of MDR TB Services Indicators on MDR TB Case Finding Indicators on 6 months interim report
Out of a, No. (%) who are alive, on treatment and culture negative
Out of a, No. (%) who died
Out of a, No. (%) who defaulted
West Bengal 895.0 19 5 234.3 26% 2 3435 148 4% 72 44 61 48 79% 2 3% 3 5%India Total 11925.1 659 165 3519.1 30% 28 46363 3644 8% 843 640 685 421 61% 47 7% 55 8%
* Data from Daman & Diu is included in Gujarat
$ This indicator will be more relevant when S+ve RT cases are considered as MDR TB suspects in all districts in the state
# For 2010, these numbers are NOT from the same cohort of patients from which MDR diagnosed are reported, but rather from treatment initiation registers only.
The current DOTS Plus information system does not allow for cohort‐based reporting of MDR TB suspects, hence this should not yet be taken as a proportion of MDR TB diagnosed and used as an indicator for efficiency of initiation on treatment.
Future versions of the DOTS Plus reporting system will be based on cohorts of patients tested in laboratories, and will be used for monitoring of timeliness and efficiency of diagnosis and initiation on treatment
Andhra PradeshDelhi
Gujarat* (+DD)Haryana
Himachal Pradesh
JharkhandKarnataka
KeralaMadhya Pradesh
Mahara-shtraOrissa
PuducherryRajasthan
Tamil NaduUttar PradeshWest Bengal
State
DOTS Plus Implementation, Diagnosis, 6 months interim, 12 months Culture Conversion and Treatment Outcome of MDR TB Case
Number of MDR TB cases registered in the cohort, 12-15 months prior (1Q10) (b)
Number of MDR TB cases registered in the cohort, 31-33 months prior (4Q08) ©
Out of c, No. reported as Cured
Out of c, No. reported as Treatment Completed
Out of c, Success Rate
23 10 43% 4 17% 1 4% 4 17% 4 17% 25 9 2 44% 8 32% 6 24% 0 0%101 58 57% 6 6% 3 3% 11 11% 20 20% 4 2 0 50% 1 25% 1 25% 0 0%67 28 42% 15 22% 6 9% 7 10% 11 16% 18 8 2 56% 1 6% 3 17% 4 22%8 5 63% 2 25% 0 0% 0 0% 1 13% 5 0 0 0% 4 80% 0 0% 1 20%
39 19 49% 5 13% 8 21% 2 5% 5 13% 1 1 0 100% 0 0% 0 0% 0 0%
36 13 36% 10 28% 1 3% 4 11% 8 22% 16 7 1 50% 2 13% 5 31% 0 0%1 1 100% 0 0% 0 0% 0 0% 0 0%
53 27 51% 3 6% 14 26% 5 9% 4 8%32 15 47% 6 19% 0 0% 8 25% 3 9%
49 31 63% 7 14% 0 0% 5 10% 5 10% 1 0 0 0% 0 0% 1 100% 0 0%
Indicators on 12 months Culture Conversion Report Indicators on Treatment Outcome of MDR TB Cases
Out of b, No. (%) who are alive, on treatment and culture positive
Out of b, No. (%) who are alive, on treatment and culture not known
Out of b, No. (%) who died
Out of b, No. (%) who are alive, on treatment and culture negative
Out of b, No. (%) who defaulted
Out of c, No. (%) who died
Out of c, No. (%) who defaulted
Out of c, No. (%) who failed treatment
West BengalIndia Total
49 31 63% 7 14% 0 0% 5 10% 5 10% 1 0 0 0% 0 0% 1 100% 0 0%409 207 51% 58 14% 33 8% 46 11% 61 15% 70 27 5 46% 16 23% 16 23% 5 7%
* Data from Daman & Diu is included in Gujarat
$ This indicator will be more relevant when S+ve RT cases are considered as MDR TB suspects in all districts in the state
# For 2010, these numbers are NOT from the same cohort of patients from which MDR diagnosed are reported, but rather from treatment initiation registers only.
The current DOTS Plus information system does not allow for cohort‐based reporting of MDR TB suspects, hence this should not yet be taken as a proportion of MDR TB diagnosed and used as an indicator for efficiency of initiation on treatment.
Future versions of the DOTS Plus reporting system will be based on cohorts of patients tested in laboratories, and will be used for monitoring of timeliness and efficiency of diagnosis and initiation on treatment
Diagnostic Sputum
SPECIMENS inoculated
Follow-Up SPECIMENS inoculated
Solid DST Processed
Liquid DST Done
LPA DST done
Total H+R Sens
Total H+R Res
Total H only Res
Total R only Res Number % Number % Number %
1 BPHRC,Andhra Pradesh 110 348 33 0 0 12 15 2 0 63 97 1 0.5 30 912 IRL,Gujarat 842 2132 369 0 233 209 211 38 25 572 80 142 5 213 713 IRL, Andhra Pradesh 724 698 187 0 245 160 47 20 5 528 87 39 3 289 804 IRL,Kerala 342 314 41 0 0 10 27 2 0 72 42 136 21 8 55 IRL, Nagpur 986 602 113 0 407 203 47 59 14 484 76 151 10 79 696 IRL, Orrissa 64 108 20 0 0 3 13 0 1 56 33 8 5 15 887 SMS,Jaipur 190 402 50 0 0 10 34 5 1 50 82 11 2 46 928 IRL,Chennai 201 301 29 0 0 14 7 4 1 72 70 46 13 23 339 IRL, West Bengal 348 764 71 0 0 6 60 0 5 42 74 30 3 29 4910 CMC,Vellore 13 17 5 0 0 0 0 0 0 7 70 5 100 0 011 Hinduja, Mumbai 142 71 0 126 0 47 72 7 0 116 91 0 0 124 9812 IRL,Jarkhand 96 0 37 0 0 17 1 13 6 30 89 2 2 29 7913 IRL,Delhi 536 884 103 0 0 20 62 12 1 175 83 82 6 84 8214 IRL Ajmer 160 238 45 0 0 9 20 16 0 90 75 64 16 43 9615 IRL Puducherry 106 11 31 0 0 29 0 2 0 92 87 2 2 106 106
Laboratory Performance Indicators ‐ 1Q11
S.No Name of the Culture & DST Laboratory
Culture workload (from culture register) [DST results summary combined all methods]
Propotion of smear positive diagnositic specimens reported as culture positive
Proportion of all specimens with
culture 'contaminated'
results
Patients (with diagnostic
specimens) with DST completed
within the benchmark turn-
around time*
Page 43
Data not available< 50%50% - 79.9%>= 80%
Proportion of registered TB patients with known HIV status, 2Q 11
Data not available0% - 0.9%1% - 4.9%5% - 9.9%>= 10%
Proportion of registered TB patients who are HIV positive, 2Q 11
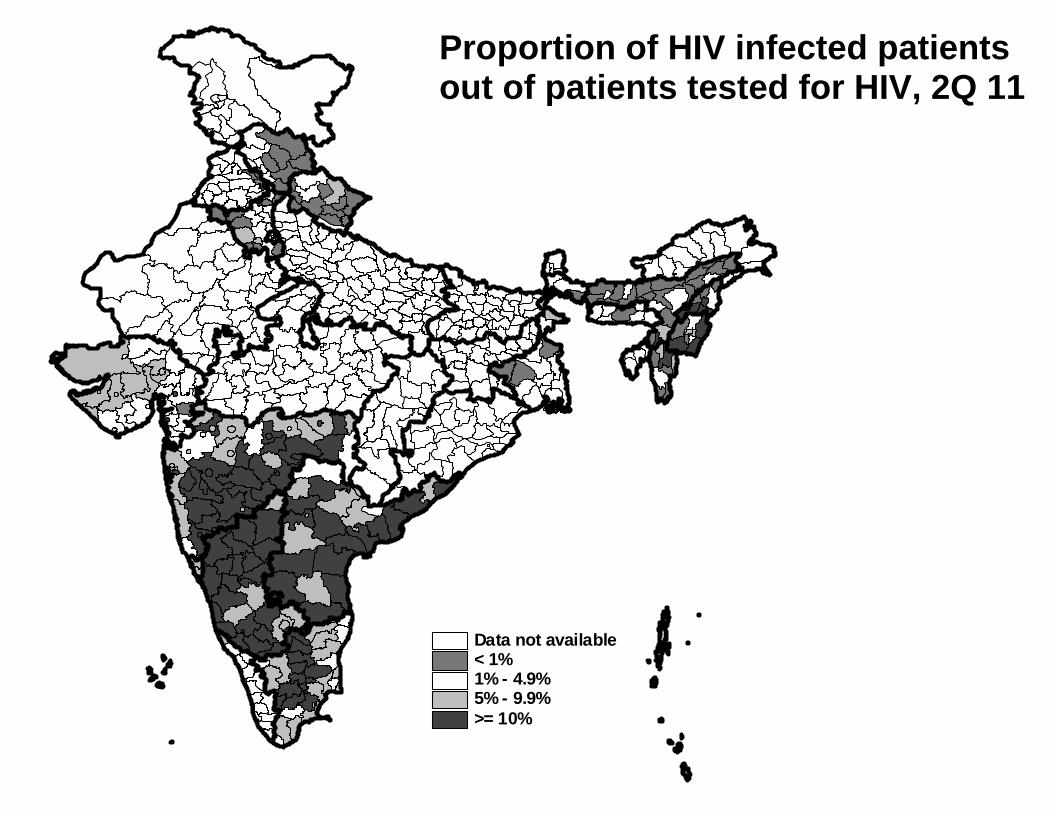
Data not available< 1%1% - 4.9%5% - 9.9%>= 10%
Proportion of HIV infected patients out of patients tested for HIV, 2Q 11
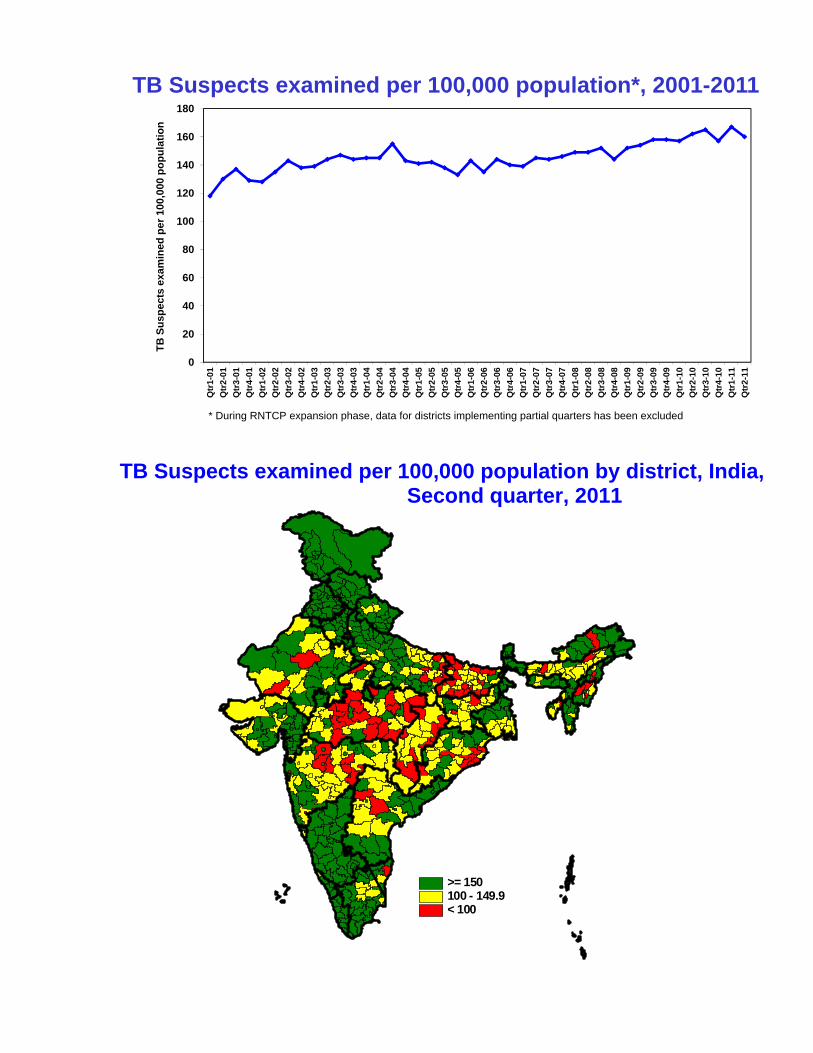
TB Suspects examined per 100,000 population*, 2001-2011
* During RNTCP expansion phase, data for districts implementing partial quarters has been excluded TB Suspects examined per 100,000 population by district, India,
Second quarter, 2011
>= 150100 - 149.9< 100
0
20
40
60
80
100
120
140
160
180
Qtr
1-01
Qtr
2-01
Qtr
3-01
Qtr
4-01
Qtr
1-02
Qtr
2-02
Qtr
3-02
Qtr
4-02
Qtr
1-03
Qtr
2-03
Qtr
3-03
Qtr
4-03
Qtr
1-04
Qtr
2-04
Qtr
3-04
Qtr
4-04
Qtr
1-05
Qtr
2-05
Qtr
3-05
Qtr
4-05
Qtr
1-06
Qtr
2-06
Qtr
3-06
Qtr
4-06
Qtr
1-07
Qtr
2-07
Qtr
3-07
Qtr
4-07
Qtr
1-08
Qtr
2-08
Qtr
3-08
Qtr
4-08
Qtr
1-09
Qtr
2-09
Qtr
3-09
Qtr
4-09
Qtr
1-10
Qtr
2-10
Qtr
3-10
Qtr
4-10
Qtr
1-11
Qtr
2-11
TB S
uspe
cts
exam
ined
per
100
,000
pop
ulat
ion
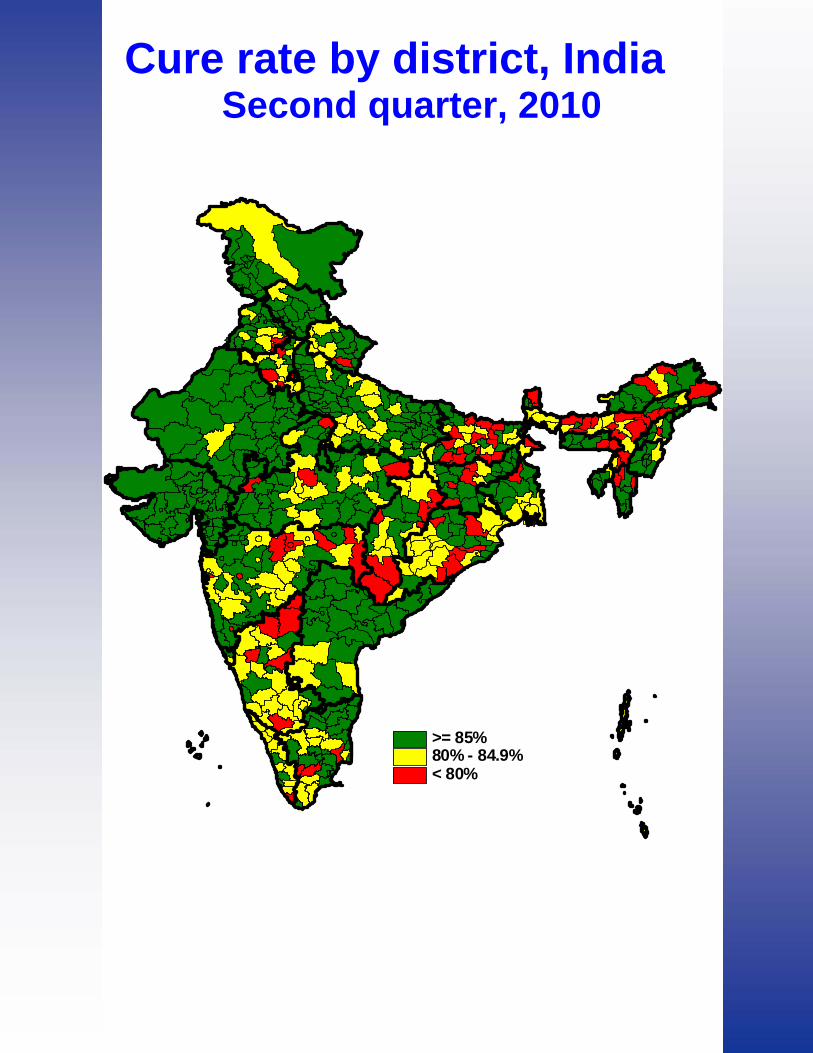
>= 85%80% - 84.9%< 80%
Cure rate by district, India Second quarter, 2010


![RESEARCHNOTE Fine-scalepopulationgeneticstructure of arcticfoxes( Vulpes lagopus… · 2018-01-18 · 0.823(0.848) 2 49.9 0.031 0.003 r:ttgatctgaatagtcctctgcg cxx140[13] f:fam-cagaggtggcatagggtgat](https://img.pdfslide.us/doc/110x75/5f89a7c847af153b3f0ecdd5/researchnote-fine-scalepopulationgeneticstructure-of-arcticfoxes-vulpes-lagopus.jpg)