Embed Size (px)
Citation preview

8/6/2019 LSM1102_Cryo-electron Microscopy Images Does Not Support 30-Nm Chromatin Fibers
http://slidepdf.com/reader/full/lsm1102cryo-electron-microscopy-images-does-not-support-30-nm-chromatin-fibers 1/6
Analysis of cryo-electron microscopy images does notsupport the existence of 30-nm chromatin fibers inmitotic chromosomes in situMikhail Eltsova,b,1,2, Kirsty M. MacLellana,c,1, Kazuhiro Maeshimad,1, Achilleas S. Frangakisb,e, and Jacques Dubocheta,f
aLaboratoire d’Analyse Ultrastructurale, Universite de Lausanne, Biophore, CH-1015, Lausanne, Switzerland; dCellular Dynamics Laboratory, RIKEN, 2-1,Hirosawa, Wako-shi, Saitama, 351-0198, Japan; bEuropean Molecular Biology Laboratory, Meyerhofstrasse 1, D-69117 Heidelberg, Germany; cInstitutde Mineralogie et de Physique des Milieux Condenses, Universite Pierre et Marie Curie, IMPMC-UMR7590, Paris F-75005, France; and fDepartementd’Ecologie et d’Evolution, Universite de Lausanne, Biophore, CH-1015, Lausanne, Switzerland; and eCluster of Excellence Macromolecular Complexes,Johann Wolfgang Goethe University, Max-von-Laue-Strasse 1, Frankfurt D-60438, Germany
Communicated by Nancy Kleckner, Harvard University, Cambridge, MA, October 10, 2008 (received for review August 5, 2008)
Although the formation of 30-nm chromatin fibers is thought to be
the most basic event of chromatin compaction, it remains contro-
versial because high-resolution imaging of chromatin in living
eukaryotic cells had not been possible until now. Cryo-electron
microscopy of vitreous sections is a relatively new technique,
which enables direct high-resolution observation of the cell struc-
tures in a close-to-native state. We used cryo-electron microscopy
and image processing to further investigate the presence of 30-nm
chromatin fibers in human mitotic chromosomes. HeLa S3 cellswere vitrified by high-pressure freezing, thin-sectioned, and then
imaged under the cryo-electron microscope without any further
chemical treatment or staining. For an unambiguous interpretation
of the images, the effects of the contrast transfer function were
computationally corrected. The mitotic chromosomes of the HeLa
S3 cells appeared as compact structures with a homogeneous
grainy texture, in which there were no visible 30-nm fibers. Power
spectra of the chromosome images also gave no indication of
30-nm chromatin folding. These results, together with our obser-
vations of the effects of chromosome swelling, strongly suggest
that, within the bulk of compact metaphase chromosomes, the
nucleosomal fiber does not undergo 30-nm folding, but exists in a
highly disordered and interdigitated state, which is, on the local
scale, comparable with a polymer melt.
chromatin compaction polymer melt chromosome structure
vitreous sections contrast transfer function
The degree of mitotic DNA c ompaction, which is essential forsuccessful segregation of chromatids between daughter cells,
is remarkable in that the mitotic chromatid in humans is 10,000times shorter than the original DNA molecule (1). The mostbasic DNA compaction in eukaryotes occurs through the wrap-ping of DNA around octamers of core histone proteins (H2A,H2B, H3, and H4) (2, 3). This step results in a repetitive motif that is composed of nucleosomes alternated with naked ‘‘linkerDNA,’’ which is classified as the basic chromatin unit or the firstlevel of DNA compaction (4). The subsequent folding of the
basic chromatin fiber into the 0.7-m thick chromatid seen atmetaphase remains unclear, although it is known that condensinsand topoisomerase II are implicated in this process (for recentreviews, see refs. 5–7). These proteins are variously assumed tomediate the folding of chromatin fibers into radially orientedloops (8–10), a hierarchy of helical structures (11, 12), or anirregular network (13). Despite their disparities, all of thesehypotheses assume that before higher-order compaction, thenucleosome chain forms a 30-nm chromatin fiber as the secondlevel of DNA folding.
The concept of the 30-nm fiber in mitotic chromosomes isbased on the following 2 observations: (i) fibers of 30 nm indiameter have been observed in chromosomes by conventionaltransmission electron microscopy (TEM) (14, 15); and (ii) X-ray
scattering analysis of isolated mitotic chromosomes reveals adiffraction peak that is characteristic of a structure of 30-nm size(16, 17). However, in classical TEM studies, mitotic chromo-somes were swollen in hypotonic buffers, and then chemicallyfixed, dehydrated with alcohol, and embedded into plastic (6, 7).These harsh nonphysiological treatments might have generatedartificial de novo folding of chromatin. Also, X-ray scatteringexperiments have failed to provide unequivocal evidence that
the 30-nm signal is derived from chromatin, rather than con-taminating cytoplasmic material. Hence, these observations donot provide c onclusive evidence for the existence of 30-nmchromatin fibers in chromosomes in vivo.
Cryo-EM of vitreous sections has made it possible to over-come the limitations of the methods described above (18).Cryo-EM is based on vitrification of the water by rapid cooling,
which ensures immobilization of all of the macromolecules in thespecimen in a close-to-native state (19). Thin vitrified samples,such as layers of macromolecule suspensions, are then directlyobserved under a cryo-EM without any chemical fixation orstaining (19). Bulky samples, like the majority of eukar yotic cellsor tissues, must be cut into thin vitreous sections before obser-
vation (18). This approach enables a direct high-resolutionimaging of cell structures at close-to-native state. However, the
interpretation of cryo-EM images is hampered by the effects of the contrast transfer function (CTF), which may cause certainstructural features to be artificially amplified or suppressed (20).
Although 30-nm chromatin fiberscan be routinely observed bycryo-EM in chromatin suspensions in vitro (21, 22), cryo-EMstudies of HeLa S3 cells did not reveal this structural feature inmitotic chromosomes (23). Nevertheless, because the influenceof the CTF was not compensated for, it remained unclear
whether the absence of 30-nm fibers in cryo-EM images of mitotic chromosomes is characteristic of the native chromatin oran artifact of the imaging properties.
In the present study, we address this uncertainty by analyzingthe CTF-corrected cryo-EM images of vitreous sections of human mitotic chromosomes in situ after isolation. We show that
within the bulk of the mitotic chromosome, the chromatin fiberexists in a highly disordered and interdigitated state, c omparable
with a polymer melt. We will also demonstrate that chromosomeswelling by reduction of Mg2 concentration in the buffer results
Author contributions: M.E., K.M., and J.D. designed research; M.E., K.M.M., and K.M.
performed research; K.M.M. and K.M. contributed new reagents/analytic tools; M.E.,
K.M.M.,and A.S.F. analyzeddata; and M.E., K.M.M.,K.M., A.S.F., andJ.D. wrotethe paper.
The authors declare no conflict of interest.
1M.E., K.M.M, and K.M. contributed equally to this work.
2To whom correspondence should be addressed. E-mail: [email protected].
This article contains supporting information online at www.pnas.org/cgi/content/full/
0810057105/DCSupplemental.
© 2008 by The National Academy of Sciences of the USA
19732–19737 PNAS December 16, 2008 vol. 105 no. 50 www.pnas.orgcgidoi10.1073pnas.0810057105

8/6/2019 LSM1102_Cryo-electron Microscopy Images Does Not Support 30-Nm Chromatin Fibers
http://slidepdf.com/reader/full/lsm1102cryo-electron-microscopy-images-does-not-support-30-nm-chromatin-fibers 2/6
in segregation of the compact structure of the native chromo-some into 30-nm fibers.
Results
The Uniform Homogeneous Grainy Texture of Chromosome Images Is
Maintained After CTF Correction. The general appearance of a vitreous section of a mitotic HeLa S3 cell is shown in Fig. 1. Thecytoplasm contains grains and various membranous organelles,such as cisterns of the endoplasmic reticulum and mitochondria.The homogeneous domains in the central region of the cell,excluding the globular macromolecular complexes and mem-branes, are chromosomes.
The homogeneous grainy texture enables the identification of theHeLa S3 chromosomes at a higher magnification (Fig. 2 A, rawimage). The figure shows 3 regions of condensed chromosomesseparated by a thin branched zone of cytoplasm, which is recog-nizable by the presence of numerous globular macromolecularcomplexes. The chromosomes are well delineated, with smoothsurfaces that are devoid of complicated convolutions. In addition,the characteristic homogenous grainy texture of the chromosomesbecomes better visible at this magnification (25,500).
The image was taken with an objective lens that was defocusedat 6.6 m, to generate sufficient phase contrast. Consequently, thisimage, as with any phase-contrast TEM image, is affected by theCTF. The CTF results in artificial amplification or suppression of the signal intensity, which, depending on the defocus value, affectsdifferent structural features. Although this effect is not easy todiscern in the real-space image, it is evident in its computed
diffraction pattern. Because the macromolecules are arbitrarilyoriented within the sample, for general evaluation the diffractionpattern presented as a power spectrum can be rotationally aver-aged. The resulting graph [rotationally averaged power spectrum(1-DRAPS)] plots the averaged amplitudes on the y axis and thespacings on the x axis.
The 1-DRAPS of the entire image (Fig. 2 A, raw image) had thehighest signal peak at 11-nm spacing, indicating that structuralfeatures of this size predominate. However, because of CTF, theaverage amplitude dropped dramatically for the 30-nm spacing,
which might have resulted in putative 30-nm fibers being hidden.To compensate for the signal distortions caused by the CTF,
several images of the same area were taken at different defocusing values and merged into a single image. This technique is used
routinely with single particle cryo-EM to minimize the effects of CTF (24). In the present study, we applied this technique to searchmore sensitively for any possible higher-order chromatin structure.This type of deconvoluted focal series reconstruction (Fig. 2 A,CTF-corrected image) combines the information from 5 images of a mitotic HeLa S3 cell taken at defocus values of between 6.6 and26.8 m. The recovery of the 30-nm features was apparent in the1-DRAPSas a rise of average amplitude for the 30-nm spacing (Fig.2 A, 1-DRAPS of CTF-corrected image). Consistently, the 30-nm
features of the cytoplasm, which were faint in the raw image,including globular macromolecular complexes [which most proba-bly correspond to ribosomes (arrows), because of their dimensions],
were clearly visible in the reconstructed image (Fig. 2 A, CTF-corrected image).
However, no structures of this size were discernible in thechromosomes. The CTF-corrected grainy pattern of the chro-mosome image consisted of dense dots, which had a next-neighbor distance, directly estimated in the image, of 10 –15 nm.The same CTF-correction procedure was per formed for other 4areas of the size of Fig. 2, which were randomly picked indifferent mitotic HeLa S3 cells. We found no difference in theCTF-corrected texture of chromosomes between the cells. Theimages did not reveal any obvious higher-order arrangement of the grains. The grainy pattern was essentially homogenous; there
were no characteristic grain arrangements extending over dis-tances significantly longer than 15 nm (Fig. 2 B).
Because the images in Fig. 2 A represent projections of asection of 50-nm thickness, which is much thicker than the sizeof a single nucleosome (10-nm diameter and 6-nm thickness),the grains seen in the image are superimpositions of perhaps 4 – 8nucleosomes. If these nucleosomes were to be arranged in aregular order, some favorable orientations would reveal char-acteristic patterns in theimages. For example, topviews of 30-nmchromatin filaments of a length similar to our section thickness,modeled on thebasisof in vitro observations (22), would give riseto characteristic rosette patterns (Fig. 2 B Inset). The volume of such a chromatin patch (40,000 nm3) corresponds to 1/1000 of the chromatin volume of the section presented in Fig. 2. Given
that chromosomes consist of randomly oriented 30-nm filaments,it provides a good chance for 30-nm fibers, if they exist, to beimaged as the characteristic top views. However, these or otherordered patterns were never observed in the condensed chro-mosomes; we found no authentic 30-nm filaments regularlyarranged over a dimension of the order of the section thicknessin this or any other section that we viewed (Fig. 2 B).
Quantitative Analysis by 1-DRAPS Reveals Characteristic Spacing
Peaks that Distinguish Textures of Chromosomes and Cytoplasm. Toquantitatively analyze the chromosome texture, we obtained1-DRAPS selectively for chromosomal and cytoplasmic areasover a number of images. These spectra were CTF-corrected andaveraged into 1 graph to improve the signal-to-noise ratio [fordetails, see Materials and Methods and supporting information
(SI) Text and Fig. S1].The resulting 1-DRAPS images are shown in Fig. 3. A broad
peak of spacing with a maximum of 11.3 nm was observed forthe chromosomes (Fig. 3 A, red), whereas no peak in this range
was seen for the cytoplasm (Fig. 3 A, blue). The 11.3-nm peak inthe chromosomes is consistent with previous studies usingoptical diffraction (23). There was no evidence of a peak in the20–80 nm range (Fig. 3 B, red) in the chromosomes. However,the 1-DRAPS of the cytoplasm showed a peak of 30– 40 nm (Fig.3 B, blue), which may correspond to the dimensions of theglobular complexes, which are abundant in the cytoplasm.
The single peak for the 11-nm spacing and absence of otherpeaks in the chromosomes reveal the predominance of an 11-nmstructural feature in chromosomes. To understand more clearly
Fig. 1. Cryo-EM view of a vitreous section of a mitotic HeLa S3 cell. Chro-
mosomes are recognized by their elongated aspect and uniform texture.
Numerous granules, membrane cisterns (mc), vesicles, and mitochondria (m)
areevident in the cytoplasm, whichis borderedby the cytoplasmic membrane
(cm). Oblique striations of the image intensity are the result of knife marks
during the sectioning process. A surface contamination withhexagonal ice(h)
is also seen. The section thickness is 60 nm. (Scale bar, 1 m.)
Eltsov et al. PNAS December 16, 2008 vol. 105 no. 50 19733

8/6/2019 LSM1102_Cryo-electron Microscopy Images Does Not Support 30-Nm Chromatin Fibers
http://slidepdf.com/reader/full/lsm1102cryo-electron-microscopy-images-does-not-support-30-nm-chromatin-fibers 3/6
Fig. 2. The characteristic grainy texture of thechromosome is maintained after CTF correction. ( A) Anarea ofa mitotic HeLa S3 cell section that contains3 parts
of chromosomes(outlined in white)separated by thecytoplasm, is shown beforeand after CTFcorrection. Thecorresponding 1-DRAPS shown on therightside.
Theamplitudesare plotted as arbitraryunitsby using logarithmic scale on the y axis.The y axisunits are the samein bothplots. (B) A magnified segment of the
CTF-correctedchromosomal texture. The inset in B shows simulated top views of 30-nm fibers assembled the interdigitated solenoid (leftinset) (22), and 2-start
helix (right inset) (27). The simulation was low-pass filtered to make it compatible with the CTF-corrected image of the chromosome. (Scale bars, 200 nm in A
and 30 nm in B.)
19734 www.pnas.orgcgidoi10.1073pnas.0810057105 Eltsov et al.

8/6/2019 LSM1102_Cryo-electron Microscopy Images Does Not Support 30-Nm Chromatin Fibers
http://slidepdf.com/reader/full/lsm1102cryo-electron-microscopy-images-does-not-support-30-nm-chromatin-fibers 4/6
the organization underlying the 11-nm peak, we carried outgradual swelling of the mitotic chromatin in vitro.
Swelling of Chromosomes Reveals That the 11-nm Spacing Peak
Results from the Close-Neighbor Distance Between Nucleosomes.
Isolated metaphase HeLa S3 chromosomes frozen in the pres-ence of 5 mM Mg2 were compact and showed a homogeneousgrainy texture (Fig. 4, 5 mM), which was very similar to thatobserved in mitotic cells (Fig. 2). Consistent with that observedin situ, this texture was characterized by a 11-nm spacing peakand by the absence of peaks of large spacing. Decreasing theMg2 concentration in the incubation buffer resulted in gradualswelling of the chromosomes. At 1.5 mM Mg2, there were nosignificant global changes in chromosome structure, althoughthe peak spacing was slightly displaced (11.8 nm) (Fig. 4, 1.5mM). At 0.7 mM Mg2, the mitotic chromosomes were no longer
compacted but c onsisted of irregular chromatin patches extend-ing over regions of 100 nm (Fig. 4, 0.7 mM). The peakmaximum was further displaced toward the larger dimension(13.7 nm). Lastly, at 0.5 mM Mg2, the chromosome appearedas irregular filaments formed from discrete grains, which wereconsistent with nucleosomes in terms of their size and shape(Fig. 4, 0.5 mM). These filaments were reminiscent of theirregular 30-nm fibers observed in vitro (21). The peak in the7–20 nm range persisted in the 1-DRAPS, with the maximumlocated at 14.3 nm. This value is substantially larger than anydimension of nucleosome, which indicates that the peak resultsfrom nucleosome spacing. Because no particular order of spatialpositioning of nucleosomes was observed within the filaments,the peak reflects a general preferential distance between thecenters of neighboring nucleosomes. The gradual shift of thespacing peak with swelling suggests that the peak has the sameorigin in open fibers and in partially decompacted and fullycompacted native chromosomes. Therefore, the compact nativechromosome appears to be a chromatin mass in which nucleo-somes are packed in no particular order, albeit with a prefer-ential distance of 11 nm.
In addition to the 14.3-nm peak, the power spectrum of chromosomes swollen at 0.5 mM Mg2 is characterized by aspacing peak in the range of 40–50 nm (data not shown). Itappears that this peak is caused not only by the fiber thickness
(30 nm), but also by a complicated function of interfibrillarspacing, which shifts this peak to larger distances.
The complete removal of magnesium ions by 1 mM EDTAresulted in further swelling and complete loss of the peak (Fig.4, 1 mM EDTA). This state resembles the fully open isolatedchromatin fibers previously observed in the thin vitrified layer inlow-salt buffer (21).
Discussion
We demonstrate that after CTF c orrection, the images of humanmitotic chromosomes in the vitreous sections reflect a compact
Fig. 3. Averaged 1-DRAPS of chromosomes (red) and cytoplasm (blue) after
CTF correctionreveals characteristic spacing peaks. Two ranges of spacing are
shown:from 7to 30nm( A)andfrom20to100nm(B).A broadpeakof spacing
with a maximum of 11.3 nm is observed for the chromosomes, whereas no
peaks within this range are detected for the cytoplasm. In the 20–80 nm
range, the chromosomal texture shows no spacing peaks. In contrast, a peak
with maximum at 30 nm is detected in the cytoplasm.
Fig. 4. Swelling of isolated mitotic HeLa S3 chromosomes in vitro by decreasing the Mg2 concentration. The vertical columns of the images show the
appearanceof chromosomesat thecorrespondingMg2concentrationin theswelling buffer.Each column containsa cryo-EMimageof thevitreous sectiontaken
at lowmagnification(LM),high magnification(HM), andthe averagedCTF-corrected 1-DRAPSfor thespacingrangeof 8–30 nm.Note thatthe texture of isolated
chromosome in 5 mM Mg2 is very similar to that of native chromosomes observed in the mitotic cell section (see Fig. 2) and is consistently characterized by a
spacing peak with maximum at 11 nm. Also noteworthy is the gradual shift of this spacing peak that accompanies the gradual swelling of the chromosomes
with decreasing Mg2 concentration. Complete removal of Mg2 by EDTA results in fully decompacted chromatin fibers and loss of the spacing peak in the
observed range (1 mM EDTA). [Scale bars, 100 nm (LM) and 30 nm (HM).]
Eltsov et al. PNAS December 16, 2008 vol. 105 no. 50 19735

8/6/2019 LSM1102_Cryo-electron Microscopy Images Does Not Support 30-Nm Chromatin Fibers
http://slidepdf.com/reader/full/lsm1102cryo-electron-microscopy-images-does-not-support-30-nm-chromatin-fibers 5/6
uniform chromatin mass, in which 30-nm chromatin fibers arenot discernible by visual inspection; 1-DRAPS analysis of thechromosome images also gave no indication of 30-nm chromatinfibers.
The previous cryo-EM observations of star fish spermatozoidsor isolated chicken erythrocyte nuclei provided conclusive evi-dence that 30-nm fibers are maintained after the high-pressurefreezing and thin sectioning of v itreous material (25). Therefore,the absence of 30-nm fibers in images of chromosomes is not dueto a technical aspect of cryo-EM of vitreous sections, but ischaracteristic of native HeLa S3 metaphase chromosomes.
This phenomenon can be explained by a model that takes intoaccount internucleosome interactions. The formation of a com-pact 30-nm fiber requires the selective binding of nucleosomes,
which are close neighbors on the DNA strand. For example, if the side-to-side binding of a nucleosome to its first neighbor isstabilized, it will give rise to a 30-nm fiber that is organized asa 1-start helix, a solenoid (26). The second neighbor binding willresult in a 2-start helix or a zig-zag ribbon fiber (27). Such
selective intrafiber nucleosomal associations can be accom-plished under diluted conditions, as in in vitro systems, in whichinteractions between chromatin fibers or between distant seg-ments of the same nucleosome chain are negligible (Fig. 5,diluted). However, these interactions become common duringchromosome compaction in vivo and, thus, interfere with theformation and/or maintenance of selective intrafiber bonds (Fig.5, concentrated). In this typeof situation, 30-nm folding can existonly if the specific intrafiber nucleosomal binding has higheraffinity than other internucleosomal associations. In this case,chromosome swelling first disrupts the weaker bonds, leaving thestronger, specific, intrafiber bonds intact. Consequently, theswelling would give rise to segregation of the 30-nm fibers, whichremain compacted. However, this scenario is not compatible
with our observations. Initially, the chromosome swells as a
uniform mass, and then gradually dissociates into chromatinfilaments of rather irregular open zig-zag structures, rather thancompact 30-nm fibers. Thus, it appears that within the mitoticbulk of chromatin there is no crucial difference between theforces of interfiber and intrafiber nucleosomal associations. Anucleosome interacts with its neighbors irrespective of thenucleosomal array along the DNA strand. This state is known asa ‘‘melt’’ in polymer physics (28). It means that the nucleosomedoes not ‘‘know’’ to which fiber it belongs. In this case, no globalsecondary DNA folding exists, and 30-nm fibers, even if theyexisted before mitosis, would melt into the uniform mass andlose their structural identity (Fig. 5). The concept of the meltimplies dynamic polymer chains (28): polymer chains are con-stantly moving and rearranging at the local level. Given that it
is also valid for the mitotic chromatin, the melt model providesconclusive explanations of the 2 following observations, whichare difficult to be interpreted by 30-nm-fiber models.
The first is the unexpectedly high intra-chromosome diffusioncapabilities of many of the soluble factors (29–33). Of thesefactors, essential structural components of chromosomes, topo-isomerase II and condensins, are comparable with or largerthan nucleosomes. Accordingly, their diffusion within a staticchromatin structure would require a sufficient porosity that isnot compatible with the highly-dense metaphase chromatinpacking (34, 35). The dynamic melt overcomes this problem:constant local movements and rearrangements of the nucleo-somes by Brownian motion allow the protein complexes to enterand to move through the bulk of the chromosome. The previ-ously reported high mobility of linker histone H1 in the meta-phase chromosomes, suggesting a transient mode of H1 binding,is in agreement with the dynamic state of the chromatin (29).
Second, the melt state overcomes a packing problem. Accord-ing to available measurements, the local DNA concentration in
mammalian mitotic chromosomes is high at 170 mg/mL (34,35). Typical models of chromosome organization based on30-nm fibers face difficulties in reaching this value, because evena dense packing of 30-nm fibers unavoidably leaves a significantunoccupied space between the fibers (34, 35). The melt, whichis a homogeneous dense packing without any empty space, couldavoid this problem.
Because, in addition to human cells, similar disordered ho-mogeneous chromatin has been observed by cryo-EM in not onlythe mitotic, but also the interphase chromatins of rodents andplant cells, the melt may represent the predominant state of compacted chromatin in vivo in general (36, 37). When 30-nmchromatin folding is required locally (e.g., in specific loci) orglobally in the entire chromatin of specific cell types (e.g., in
starfish spermatozoids; see ref. 25), transition of the homoge-neous melt into 30-nm fibers may be caused in vivo throughincreasing of intrafiber nucleosome affinity (e.g., by histonemodifications or binding of specific proteins). A similar effectmay be caused by nonphysiological treatments used in conven-tional TEM, which may account for the 30-nm fibers observedin plastic-embedded chromosomes (9, 10).
Further refinement of the melt model will address the ques-tions of how the chromosome shape is formed and how thestructural integrity of the chromosome is maintained in thehighly dynamic chromatin state. These advances will be madepossible by improved computer modeling and in vivo moleculardynamic measurements, together with the 3D reconstruction of chromatin by using cryo-electron tomography.
Fig. 5. The melt model of mitotic chromosome structure. Under diluted conditions, the flexible nucleosomal fibers may compact through selective close
neighbor associations, thus forming the 30-nm chromatin fibers. An increase in chromatin concentration results in interfiber nucleosomal contacts, which
interfere with the intrafiber bonds. Nucleosomes of adjacent fibers interdigitate and intermix. The 30-nm folding is disrupted and the nucleosomal fibers melt
into a uniform mass. Because there is no difference between the intrafiber and interfiber nucleosome affinities, the nucleosomal filaments return to the open
disordered conformationof thediluted state beforecompaction. Note that thechromatin compaction eventsare linkedto thesequencein thefigureto better
illustrate the principle of the melt formation. The actual compaction pathway leading to the chromatin melt in vivo is unknown.
19736 www.pnas.orgcgidoi10.1073pnas.0810057105 Eltsov et al.
8/6/2019 LSM1102_Cryo-electron Microscopy Images Does Not Support 30-Nm Chromatin Fibers
http://slidepdf.com/reader/full/lsm1102cryo-electron-microscopy-images-does-not-support-30-nm-chromatin-fibers 6/6
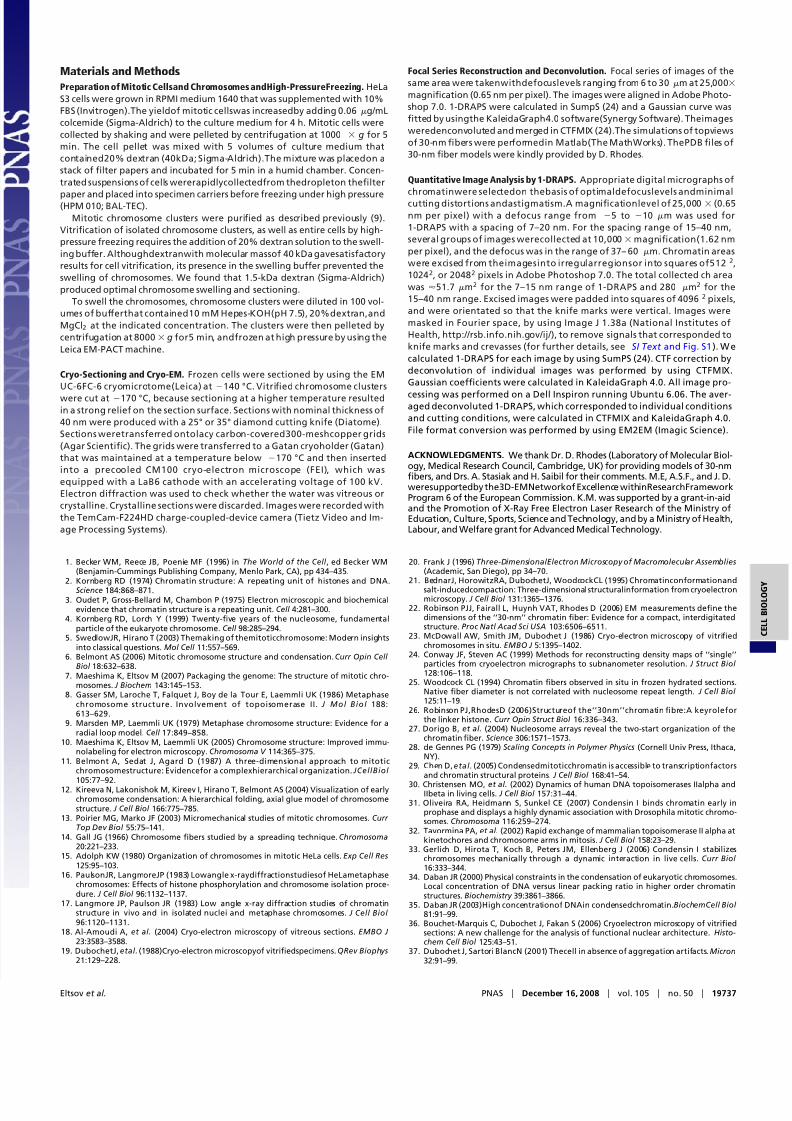
Materials and MethodsPreparation of Mitotic Cellsand Chromosomes andHigh-PressureFreezing. HeLa
S3 cells were grown in RPMI medium 1640 that was supplemented with 10%
FBS (Invitrogen).The yieldof mitotic cellswas increasedby adding 0.06g/mL
colcemide (Sigma-Aldrich) to the culture medium for 4 h. Mitotic cells were
collected by shaking and were pelleted by centrifugation at 1000 g for 5
min. The cell pellet was mixed with 5 volumes of culture medium that
contained20% dextran (40kDa; Sigma-Aldrich).The mixture was placedon a
stack of filter papers and incubated for 5 min in a humid chamber. Concen-
trated suspensions of cells wererapidlycollectedfrom thedropleton thefilter
paper and placed into specimen carriers before freezing under high pressure(HPM 010; BAL-TEC).
Mitotic chromosome clusters were purified as described previously (9).
Vitrification of isolated chromosome clusters, as well as entire cells by high-
pressure freezing requires the addition of 20% dextran solution to the swell-
ing buffer. Althoughdextranwith molecular massof 40 kDa gavesatisfactory
results for cell vitrification, its presence in the swelling buffer prevented the
swelling of chromosomes. We found that 1.5-kDa dextran (Sigma-Aldrich)
produced optimal chromosome swelling and sectioning.
To swell the chromosomes, chromosome clusters were diluted in 100 vol-
umes of bufferthat contained10 mM Hepes-KOH(pH 7.5), 20%dextran,and
MgCl2 at the indicated concentration. The clusters were then pelleted by
centrifugation at 8000g for5 min, andfrozen at high pressure by using the
Leica EM-PACT machine.
Cryo-Sectioning and Cryo-EM. Frozen cells were sectioned by using the EM
UC-6FC-6 cryomicrotome(Leica) at140 °C. Vitrified chromosome clusters
were cut at 170 °C, because sectioning at a higher temperature resulted
in a strong relief on the section surface. Sections with nominal thickness of
40 nm were produced with a 25° or 35° diamond cutting knife (Diatome).
Sections weretransferred ontolacy carbon-covered300-meshcopper grids
(Agar Scientific). The grids were transferred to a Gatan cryoholder (Gatan)
that was maintained at a temperature below 170 °C and then inserted
into a precooled CM100 cryo-electron microscope (FEI), which was
equipped with a LaB6 cathode with an accelerating voltage of 100 kV.
Electron diffraction was used to check whether the water was vitreous or
crystalline. Crystalline sections were discarded. Images were recorded with
the TemCam-F224HD charge-coupled-device camera (Tietz Video and Im-
age Processing Systems).
Focal Series Reconstruction and Deconvolution. Focal series of images of the
same area were takenwithdefocuslevels ranging from 6 to 30m at 25,000
magnification (0.65 nm per pixel). The images were aligned in Adobe Photo-
shop 7.0. 1-DRAPS were calculated in SumpS (24) and a Gaussian curve was
fitted by usingthe KaleidaGraph4.0 software(Synergy Software). Theimages
weredenconvoluted and merged in CTFMIX (24).The simulations of topviews
of 30-nm fibers were performedin Matlab(The MathWorks). ThePDB files of
30-nm fiber models were kindly provided by D. Rhodes.
Quantitative Image Analysis by 1-DRAPS. Appropriate digital micrographs of
chromatinwere selectedon thebasis of optimaldefocuslevels andminimalcutting distortions andastigmatism.A magnificationlevel of 25,000 (0.65
nm per pixel) with a defocus range from 5 to 10 m was used for
1-DRAPS with a spacing of 7–20 nm. For the spacing range of 15–40 nm,
several groups of images werecollected at 10,000magnification(1.62 nm
per pixel), and the defocus was in the range of 37– 60 m. Chromatin areas
were excised from theimagesinto irregularregionsor into squares of5122,
10242, or 20482 pixels in Adobe Photoshop 7.0. The total collected ch area
was 51.7 m2 for the 7–15 nm range of 1-DRAPS and 280 m2 for the
15–40 nm range. Excised images were padded into squares of 40962 pixels,
and were orientated so that the knife marks were vertical. Images were
masked in Fourier space, by using Image J 1.38a (National Institutes of
Health, http://rsb.info.nih.gov/ij/), to remove signals that corresponded to
knife marks and crevasses (for further details, see SI Text and Fig. S1). W e
calculated 1-DRAPS for each image by using SumPS (24). CTF correction by
deconvolution of individual images was performed by using CTFMIX.
Gaussian coefficients were calculated in KaleidaGraph 4.0. All image pro-
cessing was performed on a Dell Inspiron running Ubuntu 6.06. The aver-aged deconvoluted 1-DRAPS, which corresponded to individual conditions
and cutting conditions, were calculated in CTFMIX and KaleidaGraph 4.0.
File format conversion was performed by using EM2EM (Imagic Science).
ACKNOWLEDGMENTS. We thank Dr. D. Rhodes (Laboratory of Molecular Biol-ogy, Medical Research Council, Cambridge, UK) for providing models of 30-nmfibers, and Drs. A. Stasiak and H. Saibil for their comments. M.E, A.S.F., and J. D.weresupportedby the3D-EMNetworkof Excellence withinResearchFrameworkProgram 6 of the European Commission. K.M. was supported by a grant-in-aidand the Promotion of X-Ray Free Electron Laser Research of the Ministry ofEducation, Culture, Sports, Science and Technology, and by a Ministry of Health,Labour, and Welfare grant for Advanced Medical Technology.
1. Becker WM, Reece JB, Poenie MF (1996) in The World of the Cell , ed Becker WM(Benjamin-Cummings Publishing Company, Menlo Park, CA), pp 434–435.
2. Kornberg RD (1974) Chromatin structure: A repeating unit of histones and DNA.
Science 184:868–871.3. Oudet P, Gross-Bellard M, Chambon P (1975) Electron microscopic and biochemical
evidence that chromatin structure is a repeating unit. Cell 4:281–300.4. Kornberg RD, Lorch Y (1999) Twenty-five years of the nucleosome, fundamental
particle of the eukaryote chromosome. Cell 98:285–294.5. SwedlowJR, Hirano T (2003) Themaking of themitoticchromosome: Modern insights
into classical questions. Mol Cell 11:557–569.6. Belmont AS (2006) Mitotic chromosome structure and condensation. Curr Opin Cell
Biol 18:632–638.7. Maeshima K, Eltsov M (2007) Packaging the genome: The structure of mitotic chro-
mosomes. J Biochem 143:145–153.8. Gasser SM, Laroche T, Falquet J, Boy de la Tour E, Laemmli UK (1986) Metaphase
chromosome structure. Involvement of topoisomerase II. J Mol Biol 188:613–629.
9. Marsden MP, Laemmli UK (1979) Metaphase chromosome structure: Evidence for aradial loop model. Cell 17:849–858.
10. Maeshima K, Eltsov M, Laemmli UK (2005) Chromosome structure: Improved immu-nolabeling for electron microscopy. Chromosoma V 114:365–375.
11. Belmont A, Sedat J, Agard D (1987) A three-dimensional approach to mitoticchromosomestructure: Evidencefor a complexhierarchical organization. JCellBiol 105:77–92.
12. Kireeva N, Lakonishok M, Kireev I, Hirano T, Belmont AS (2004) Visualization of earlychromosome condensation: A hierarchical folding, axial glue model of chromosomestructure. J Cell Biol 166:775–785.
13. Poirier MG, Marko JF (2003) Micromechanical studies of mitotic chromosomes. Curr Top Dev Biol 55:75–141.
14. Gall JG (1966) Chromosome fibers studied by a spreading technique. Chromosoma20:221–233.
15. Adolph KW (1980) Organization of chromosomes in mitotic HeLa cells. Exp Cell Res125:95–103.
16. PaulsonJR, LangmoreJP (1983) Lowangle x-raydiffractionstudiesof HeLametaphasechromosomes: Effects of histone phosphorylation and chromosome isolation proce-dure. J Cell Biol 96:1132–1137.
17. Langmore JP, Paulson JR (1983) Low angle x-ray diffraction studies of chromatinstructure in vivo and in isolated nuclei and metaphase chromosomes. J Cell Biol 96:1120–1131.
18. Al-Amoudi A, et al. (2004) Cryo-electron microscopy of vitreous sections. EMBO J23:3583–3588.
19. DubochetJ, etal. (1988)Cryo-electron microscopyof vitrifiedspecimens. QRev Biophys21:129–228.
20. Frank J (1996) Three-DimensionalElectron Microscopy of Macromolecular Assemblies(Academic, San Diego), pp 34–70.
21. BednarJ, HorowitzRA, DubochetJ, WoodcockCL (1995) Chromatinconformationand
salt-inducedcompaction: Three-dimensional structuralinformation from cryoelectronmicroscopy. J Cell Biol 131:1365–1376.
22. Robinson PJJ, Fairall L, Huynh VAT, Rhodes D (2006) EM measurements define thedimensions of the ‘‘30-nm’’ chromatin fiber: Evidence for a compact, interdigitatedstructure. Proc Natl Acad Sci USA 103:6506–6511.
23. McDowall AW, Smith JM, Dubochet J (1986) Cryo-electron microscopy of vitrifiedchromosomes in situ. EMBO J 5:1395–1402.
24. Conway JF, Steven AC (1999) Methods for reconstructing density maps of ‘‘single’’particles from cryoelectron micrographs to subnanometer resolution. J Struct Biol 128:106–118.
25. Woodcock CL (1994) Chromatin fibers observed in situ in frozen hydrated sections.Native fiber diameter is not correlated with nucleosome repeat length. J Cell Biol 125:11–19.
26. Robinson PJ,RhodesD (2006)Structureof the‘‘30nm’’chromatin fibre:A keyroleforthe linker histone. Curr Opin Struct Biol 16:336–343.
27. Dorigo B, et al. (2004) Nucleosome arrays reveal the two-start organization of thechromatin fiber. Science 306:1571–1573.
28. de Gennes PG (1979) Scaling Concepts in Polymer Physics (Cornell Univ Press, Ithaca,NY).
29. Chen D, etal. (2005) Condensedmitoticchromatin is accessible to transcriptionfactorsand chromatin structural proteins. J Cell Biol 168:41–54.
30. Christensen MO, et al. (2002) Dynamics of human DNA topoisomerases IIalpha andIIbeta in living cells. J Cell Biol 157:31–44.
31. Oliveira RA, Heidmann S, Sunkel CE (2007) Condensin I binds chromatin early inprophase and displays a highly dynamic association with Drosophila mitotic chromo-somes. Chromosoma 116:259–274.
32. Tavormina PA, et al. (2002) Rapid exchange of mammalian topoisomerase II alpha atkinetochores and chromosome arms in mitosis. J Cell Biol 158:23–29.
33. Gerlich D, Hirota T, Koch B, Peters JM, Ellenberg J (2006) Condensin I stabilizeschromosomes mechanically through a dynamic interaction in live cells. Curr Biol 16:333–344.
34. Daban JR (2000) Physical constraints in the condensation of eukaryotic chromosomes.Local concentration of DNA versus linear packing ratio in higher order chromatinstructures. Biochemistry 39:3861–3866.
35. Daban JR (2003)High concentrationof DNAin condensedchromatin.BiochemCell Biol 81:91–99.
36. Bouchet-Marquis C, Dubochet J, Fakan S (2006) Cryoelectron microscopy of vitrifiedsections: A new challenge for the analysis of functional nuclear architecture. Histo-chem Cell Biol 125:43–51.
37. Dubochet J, Sartori BlancN (2001) Thecell in absence of aggregation artifacts. Micron32:91–99.
Eltsov et al. PNAS December 16, 2008 vol. 105 no. 50 19737