Embed Size (px)
DESCRIPTION
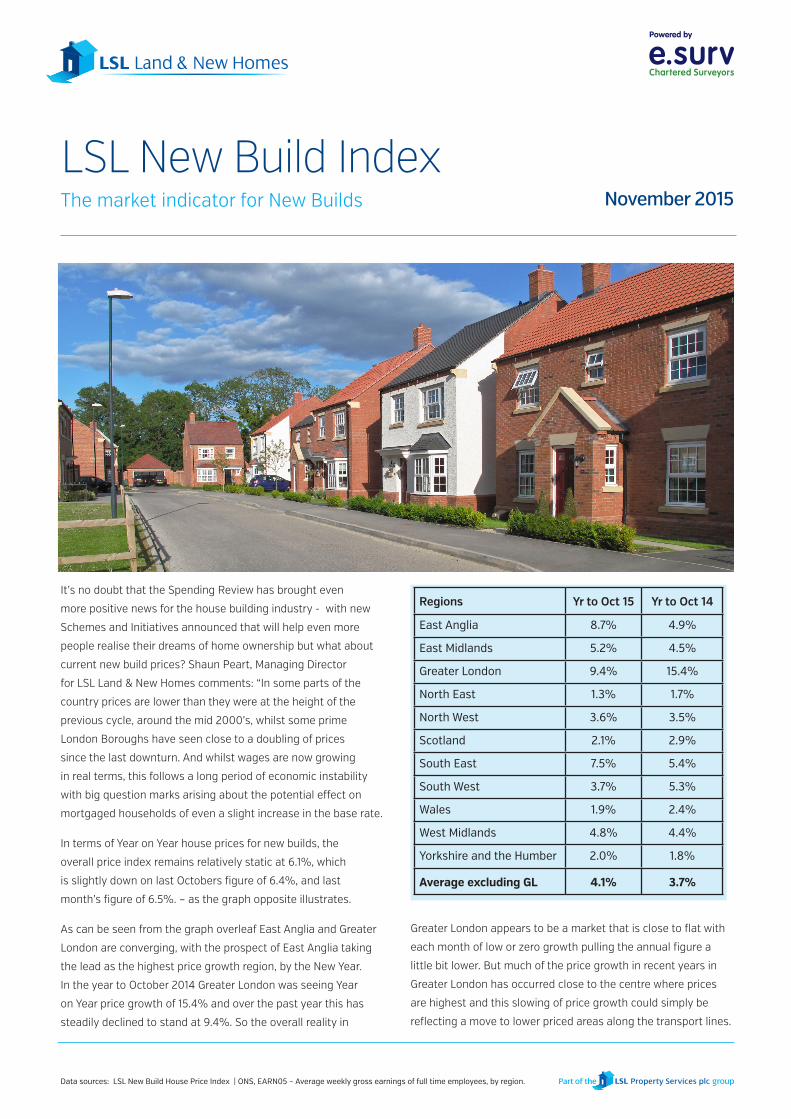
It’s no doubt that the Spending Review has brought even more positive news for the house building industry - with new Schemes and Initiatives announced that will help even more people realise their dreams of home ownership but what about current new build prices?
Citation preview
It’s no doubt that the Spending Review has brought even
more positive news for the house building industry - with new
Schemes and Initiatives announced that will help even more
people realise their dreams of home ownership but what about
current new build prices? Shaun Peart, Managing Director
for LSL Land & New Homes comments: “In some parts of the
country prices are lower than they were at the height of the
previous cycle, around the mid 2000’s, whilst some prime
London Boroughs have seen close to a doubling of prices
since the last downturn. And whilst wages are now growing
in real terms, this follows a long period of economic instability
with big question marks arising about the potential effect on
mortgaged households of even a slight increase in the base rate.
In terms of Year on Year house prices for new builds, the
overall price index remains relatively static at 6.1%, which
is slightly down on last Octobers figure of 6.4%, and last
month’s figure of 6.5%. – as the graph opposite illustrates.
As can be seen from the graph overleaf East Anglia and Greater
London are converging, with the prospect of East Anglia taking
the lead as the highest price growth region, by the New Year.
In the year to October 2014 Greater London was seeing Year
on Year price growth of 15.4% and over the past year this has
steadily declined to stand at 9.4%. So the overall reality in
Greater London appears to be a market that is close to flat with
each month of low or zero growth pulling the annual figure a
little bit lower. But much of the price growth in recent years in
Greater London has occurred close to the centre where prices
are highest and this slowing of price growth could simply be
reflecting a move to lower priced areas along the transport lines.
Powered by
Data sources: LSL New Build House Price Index | ONS, EARN05 – Average weekly gross earnings of full time employees, by region.
LSL New Build IndexThe market indicator for New Builds November 2015
Regions Yr to Oct 15 Yr to Oct 14
East Anglia 8.7% 4.9%
East Midlands 5.2% 4.5%
Greater London 9.4% 15.4%
North East 1.3% 1.7%
North West 3.6% 3.5%
Scotland 2.1% 2.9%
South East 7.5% 5.4%
South West 3.7% 5.3%
Wales 1.9% 2.4%
West Midlands 4.8% 4.4%
Yorkshire and the Humber 2.0% 1.8%
Average excluding GL 4.1% 3.7%

Powered by
What is certain though is that the
three regions adjoining Greater
London are now seeing the
strongest increases in price growth.
East Anglia, the East Midlands
and the South East are the three
healthiest looking regions in terms
of house price inflation and the
market wave effect now seems to
have rolled out to those regions.
Other regions are showing less
drive, but despite this the average
price growth, excluding Greater
London is 4.1% this year which is
up on last year’s figure of 3.7%.
Considering First Time Buyers, our HPE Index looks at the
average cost of buying a 70 sq m 2 bed home in each region.
It compares this with the average earnings of a full time
employee in that region. On average a 70 sq m home costs
the equivalent of 5 years and 4 month’s gross earnings.
But there is a wide regional variation in this figure.
Our figures suggest that in Greater London you would need to
be paying 11 years and 3 months Gross Earnings (before tax and
other deductions are made) to buy your starter home. So this will
translate into a large mortgage being paid off over a long period
of time. If however you lived in the East Midlands, you would
be paying Gross Earnings worth 3 years and 10 months to buy
your starter home. This of course translates into a far smaller
mortgage which can be paid off relatively easily by someone on
average earnings. The relative affordability within areas such as
Leicester and Newcastle may go some way towards explaining
why these postcode areas have so many developments in them.
We wait with interest to see the impact of the Chancellors
Spending Review – and in particular what impact this has
to those buying for the first time - but it’s no doubt going
to be an interesting and busy few months to come.
Powered by
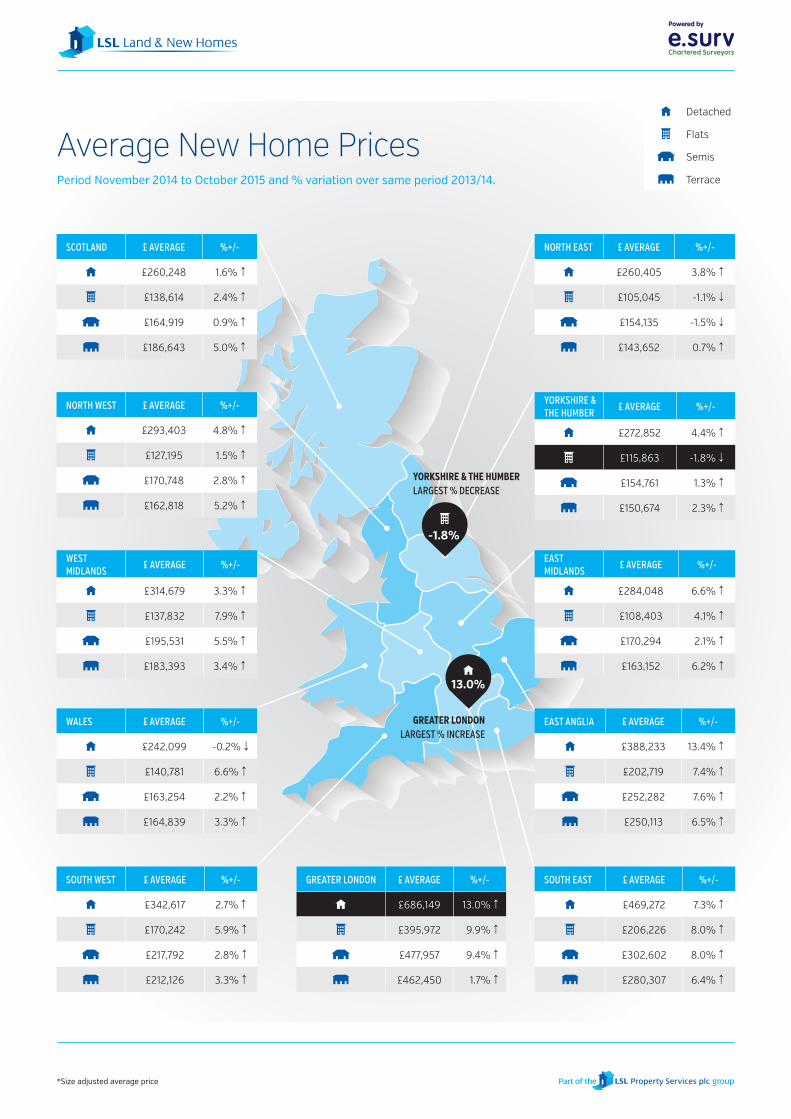
Average New Home Prices
*Size adjusted average price
Period November 2014 to October 2015 and % variation over same period 2013/14.
SCOTLAND £ AVERAGE %+/-
£260,248 1.6% ↑
£138,614 2.4% ↑
£164,919 0.9% ↑
£186,643 5.0% ↑
NORTH EAST £ AVERAGE %+/-
£260,405 3.8% ↑
£105,045 -1.1% ↓
£154,135 -1.5% ↓
£143,652 0.7% ↑
NORTH WEST £ AVERAGE %+/-
£293,403 4.8% ↑
£127,195 1.5% ↑
£170,748 2.8% ↑
£162,818 5.2% ↑
YORKSHIRE & THE HUMBER £ AVERAGE %+/-
£272,852 4.4% ↑
£115,863 -1.8% ↓
£154,761 1.3% ↑
£150,674 2.3% ↑
WEST MIDLANDS £ AVERAGE %+/-
£314,679 3.3% ↑
£137,832 7.9% ↑
£195,531 5.5% ↑
£183,393 3.4% ↑
EAST MIDLANDS £ AVERAGE %+/-
£284,048 6.6% ↑
£108,403 4.1% ↑
£170,294 2.1% ↑
£163,152 6.2% ↑
-1.8%
WALES £ AVERAGE %+/-
£242,099 -0.2% ↓
£140,781 6.6% ↑
£163,254 2.2% ↑
£164,839 3.3% ↑
EAST ANGLIA £ AVERAGE %+/-
£388,233 13.4% ↑
£202,719 7.4% ↑
£252,282 7.6% ↑
£250,113 6.5% ↑
SOUTH WEST £ AVERAGE %+/-
£342,617 2.7% ↑
£170,242 5.9% ↑
£217,792 2.8% ↑
£212,126 3.3% ↑
GREATER LONDON £ AVERAGE %+/-
£686,149 13.0% ↑
£395,972 9.9% ↑
£477,957 9.4% ↑
£462,450 1.7% ↑
SOUTH EAST £ AVERAGE %+/-
£469,272 7.3% ↑
£206,226 8.0% ↑
£302,602 8.0% ↑
£280,307 6.4% ↑
Detached
Flats
Semis
Terrace
13.0%
LARGEST % DECREASEYORKSHIRE & THE HUMBER
GREATER LONDONLARGEST % INCREASE

Powered by
This Index has been prepared by e.surv using anonymised data
based on a proportion of all new build valuations provided for lending
purposes. Figures represent 12 month rolling averages for each
period. The copyright and all other intellectual property rights in the
Index belong to e.surv. Reproduction in whole or part is not permitted
unless an acknowledgement to e.surv as the source is included. No
modification is permitted without e.surv’s prior written consent.
Whilst care is taken in the compilation of the Index no representation
or assurances are made as to its accuracy or completeness. e.surv
reserves the right to vary the methodology and to edit or discontinue
the Index in whole or in part at anytime.
e.surv (www.esurv.co.uk) is the Valuation business of LSL Property
Services plc (www.lslps.co.uk) and is the UK’s largest residential
valuation practice, acting for lenders, developers, Social Housing
organisations and other stakeholders in the residential property
market.
The business employs circa 450 chartered surveyors and covers the
entire UK.
LSL Land & New Homes is a trading style for members of the LSL
Property Services Group Estate Agency Division, one of the leading
residential property services groups in the UK. It’s strategy is to create
partnerships with developers and builders to support their objectives
and add value to their businesses.
It can provide integrated solutions for their benefit drawing on the
expertise of companies who are also under the LSL Group umbrella
including valuation services (e.surv), rental portfolio services, asset
management services and estate agency services fronted by well-
known high street estate agency brands like Your Move and Reeds
Rains. Services can be tailored to suite individual needs from bespoke
site sales and marketing, agency referral to the disposal of part
exchange, assisted schemes and new build stock, land sales and
acquisitions.
Data for the LSL New Build Database is collected off the web sites of over 300 house builders on a rolling quarterly basis so giving a rough timeline of when sites start and finish and how many units have been built.
PLEASE NOTE: The majority of new build market activity data is quite historic, being based on returns made via the NHBC or Local Authority completions data. The LSL New Build Database tracks the new build activity of over 300 leading house builders with data collected from their websites on a rolling quarterly basis so giving a rough time line when sites start and finish and how many units have been built.
Disclaimer: The data is provided by LSL Land & New Homes and is based on data provided as described above. While reasonable skill and care has been taken in the preparation of the data – the copyright and all other intellectual property rights of which belong to e.surv limited - neither e.surv Limited nor LSL Land & New Homes can accept liability for the accuracy or completeness of the data provided.
Reproduction in whole or part is not permitted unless an acknowledgment to e.surv Limited is included. No modification is permitted without e.surv Limited’s prior written consent.
No warranty of the figures is given and no responsibility or liability of any nature to you or any third party for the whole or any part of its content is accepted. It is assumed that you will carry out your own due diligence before proceeding with any proposals or making any financial commitments.
For further information or enquiries regarding the underlying data of the
LSL New Build Index, please contact Richard Sexton via email
[email protected] or by phoning 07968 932118.
For further information about the LSL Property Services Group including
LSL Land & New Homes and e.surv, visit www.lslps.co.uk
Notes