Embed Size (px)
Citation preview
LSAC RESEARCH REPORT SERIES
An Overview of Research on the Testlet Effect: Associated Features, Implications for Test Assembly, and the Impact of Model Choice on Ability Estimates Muirne C. S. Paap Cees A. W. Glas Bernard P. Veldkamp University of Twente, Enschede, the Netherlands
Law School Admission Council Research Report 13-03 March 2013
A Publication of the Law School Admission Council

The Law School Admission Council (LSAC) is a nonprofit corporation whose members are more than 200 law schools in the United States, Canada, and Australia. Headquartered in Newtown, PA, USA, the Council was founded in 1947 to facilitate the law school admission process. The Council has grown to provide numerous products and services to law schools and to more than 85,000 law school applicants each year. All law schools approved by the American Bar Association (ABA) are LSAC members. Canadian law schools recognized by a provincial or territorial law society or government agency are also members. Accredited law schools outside of the United States and Canada are eligible for membership at the discretion of the LSAC Board of Trustees. © 2013 by Law School Admission Council, Inc. All rights reserved. No part of this work, including information, data, or other portions of the work published in electronic form, may be reproduced or transmitted in any form or by any means, electronic or mechanical, including photocopying and recording, or by any information storage and retrieval system, without permission of the publisher. For information, write: Communications, Law School Admission Council, 662 Penn Street, PO Box 40, Newtown, PA, 18940-0040. This study is published and distributed by LSAC. The opinions and conclusions contained in this report are those of the author(s) and do not necessarily reflect the position or policy of LSAC.

i
Table of Contents
Executive Summary ...................................................................................................... 1 Introduction ................................................................................................................... 1 Testlet Framework Part I: Explanatory Modeling ....................................................... 2
An Explanatory Testlet Response Model .............................................................. 2 Testing the Feasibility of the ETRM Using a Real Data Sample ........................... 4 Is the Predictive Value of the Testlet Features Confounded With Average Item Difficulty? .............................................................................................................. 6
Testlet Framework Part II: Consequences of Testlet Effects on Fisher Information and Theta Estimates ..................................................................................................... 6
Robust Automated Test Assembly: Taking Into Account the Uncertainty in Information............................................................................................................ 6 Theta Estimates and Their Standard Errors ......................................................... 8
Conclusion and Discussion ....................................................................................... 12 References ................................................................................................................... 13


1
Executive Summary
A mathematical model called item response theory is often applied to high-stakes tests to estimate test-taker ability level and to determine the characteristics of test questions (i.e., items). Often, these tests contain subsets of items (testlets) grouped around a common stimulus. This grouping often leads to items within one testlet being more strongly correlated among themselves than among items from other testlets, which can result in moderate to strong testlet effects.
A series of research projects was undertaken to investigate the theoretical and practical implications of the testlet effect for high-stakes tests such as the Law School Admission Test. These projects explored areas such as the development of a testlet response model to account for the testlet effect and the development of model fit statistics to accompany the model. The model was also applied to investigate the relationship between the stimulus features and the statistics used to describe individual test items, as well as the impact of the testlet effect on the assembly of test forms.
The current paper begins by summarizing findings across the series of research projects and goes on to investigate the impact of model choice on test assembly and estimates of test-taker ability. Finally, important topics that need to be addressed by future studies are discussed.
Introduction
Many standardized tests have a testlet structure: The items in the test consist of subgroups (testlets) that pertain to a common stimulus, such as a text passage. This creates a dependency between the items belonging to the same stimulus; this kind of dependency is not accounted for in standard item response theory (IRT) models. If the dependency is substantial, one of the key assumptions (local independence) of the standard IRT model could be violated. Although testlet response theory (TRT) models are available (Wainer, Bradlow, & Wang, 2007), they are not widely used. This is mainly due to their complexity and the need for special software to estimate them. To estimate the latent ability of the test takers, testing agencies typically prefer to use standard IRT models, such as the Rasch model or the two- or three-parameter logistic model (2PL and 3PL, respectively). Since the ability scores produced by these tests are often used to make decisions that have important consequences for the test takers, it is of the utmost importance that the ability scores be estimated as accurately as possible. Therefore, it is desirable to establish the effects of ignoring this inter-item dependency (testlet effect), if any. In practice, many testing agencies are already trying to diminish the possible negative consequences of large testlet effects by excluding these kinds of testlets from operational tests; after all, the purpose of the test is to obtain an estimate of the test taker’s overall proficiency score, not their ability to do well on one particular testlet.
We developed a framework to address both theoretical and practical aspects of the role of the testlet effect in high-stakes testing. More specifically, we aimed to identify features that are related to the size of the testlet effect, as well as to assess the consequences of ignoring the testlet effect (and its associated features) on both test assembly and theta parameter estimation in high-stakes testing. We hope that our framework and preliminary results can provide test developers with some useful tools that they can employ at the test design stage as well as at the test assembly

2
stage. Bits and pieces of the aforementioned framework were presented in five previous publications. An explanatory testlet response model (ETRM) was presented in Glas (2012a), in which the testlet parameter was estimated using a structural equation. In a subsequent report, Glas (2012b) presented model fit statistics and differential item functioning (DIF) statistics for this model, using a real data example as an illustration. In Paap, Glas, He, and Veldkamp (2012), the model introduced by Glas was tested using testlet features as covariates that had been selected using a real data sample. Paap and Veldkamp (2012a) then investigated the relationship between stimulus features and the difficulty, discrimination, and guessing parameters. In the fifth publication, Veldkamp and Paap (2012) investigated the potential impact of the uncertainty contained in the testlet effect on automated test assembly (ATA). In the current paper, we will summarize the findings presented in the previous five publications, investigate the impact of model choice on test assembly and on theta estimates, and discuss some important topics that need to be addressed by future studies.
Testlet Framework Part I: Explanatory Modeling
Our framework consists of two parts: The first part focuses on modeling the testlet effect and the associated testlet features, as well as different aspects of model fit of the calibrated models. The second part focuses on the applications of our findings in a high-stakes context; more specifically, we address the consequences for test assembly and the estimated ability values.
An Explanatory Testlet Response Model
In Glas (2012a) and Paap et al. (2012), an ETRM was introduced, which is an extension of the existing TRT model introduced by Bradlow, Wainer, and Wang (1999). In the three-parameter normal ogive testlet (3PNO-T) model, the probability
of a correct response, denoted by Yni = 1, is given by
( ) ( ) ( ), (1)
where is the cumulative normal distribution, that is
( ) ( ) ∫ (
)
, (2)
and
( ). (3)
The key feature of explanatory IRT models is that they contain a structural
component (comparable to a regression model) for one or more of the parameters in the IRT model. However, thus far these models mainly focus on person and/or item features. Consider for example the linear logistic test model (LLTM, Fischer, 1973, 1983). In this model, differences among item parameters are predicted by replacing the b-parameter in the Rasch model (Rasch, 1960) with a structural equation,
defining as follows:
3
∑ (4)
where is the regression coefficient associated with feature q, and is the value
of feature q on item i. For a comprehensive overview of explanatory IRT models we refer to De Boeck and Wilson (2004). In the ETRM we introduced, a linear model was added to the TRT model so that predictors could be added on the testlet level.
Two extensions of the 3PNO-T model can be formulated, one where the testlet features remained fixed effects and did not depend on respondents, and one where these effects were made random, resulting in a variance component that models the variation in the effects of the testlet features over respondents. Before these models are presented, it is important to note that there are several ways to interpret the
testlet parameter (Glas, Wainer, & Bradlow, 2000). For our framework, the following conceptualization works best. Respondents are identified by a latent
variable . For every testlet, the respondent n independently draws an ability parameter from a normal distribution with mean and within-person ability
variance . Thus, the model for the ability parameter for person n on testlet t is
given by
(5)
with ( ) Note that
models the dependence of item responses within
testlet t. We assume that the ability parameter follows a normal distribution, that
is, ( )
For the first extension of the 3PNO-T model, we added a linear model to with
testlet features as predictors. For the 3PNO version of this model, define as
∑ ( )
where ( ) are covariates for describing the tth testlet on feature q, and are
regression coefficients (q = 1, …, Q, and Q < T). For the second extension where a
random effect to the covariate slopes was added, is defined as
∑ ( )
where , and ( ) To understand the dependence
structure implied by this model, assume that could be directly observed. Now, if
( ) ( ) , then ( ) ( ) ( )
∑ ( )
∑
and if ( ) ( ), then ( )
. So models the variation in the effects of the testlet features over
respondents.

4
The extensions of TRT models with fixed/random effects for predictor variables apply to one-, two-, and three-parameter models as well as to different parameterizations of IRT models (e.g., logistic models or normal ogive models). Glas (2012a, 2012b) and Paap et al. (2012) discussed the two-parameter normal ogive (2PNO) model and the 3PNO model, respectively. Glas (2012a) discussed several estimation procedures, including frequentist procedures such as marginal maximum likelihood (MML), Bayesian procedures, and a combination of both. MML facilitates a straightforward and comprehensive set of model fit statistics, whereas Bayesian modeling has important advantages when estimating highly complex models. Simulations showed that the three estimation procedures resulted in highly similar outcomes. However, the fully Bayesian method was deemed to be best suited for estimating complex extended models such as the ETRM because of the flexibility of these methods for parameter estimation. In a subsequent report, Glas (2012b) described Bayesian modification indices (BMIs) that can be used to check the fit of TRT models. These BMIs are closely related to the modification index used in structural equation modeling (Sörbom, 1989) and the Lagrange multiplier (LM) based method proposed by Glas (1999) for the evaluation of the assumptions of IRT models in an MML framework. The advantage of the latter procedure is that a whole range of item- and testlet-oriented fit statistics can be computed using estimates of the parameters of the null-model only. This feature is preserved in the BMI; the Markov chain Monte Carlo (MCMC) algorithm is run as usual for the null-model, but in every step of the algorithm, BMIs are sampled, given the sampled values of the parameters of the null-model (Glas, 2012b). BMIs can be computed to check for differential testlet functioning as well as general model fit (targeted at the response functions and local independence).
Testing the Feasibility of the ETRM Using a Real Data Sample
The next step was to apply the model to a real data sample: a subtest from a high-stakes test consisting entirely of testlets. Before the feasibility of the ETRM could be assessed, relevant testlet features needed to be identified. As described in Paap et al. (2012), a number of testlet features were extracted, and then the features with the strongest relationship to the size of the testlet effect were selected to be plugged into the ETRM. The latter can be viewed as an iterative process: The testlet effect is first estimated by a regular testlet model and then used in a predictive model to select relevant features; these features can subsequently be incorporated into the ETRM. Paap et al. (2012) used the responses of 49,256 students to 594 items nested within 100 total testlets (stimuli) administered on the Analytical Reasoning section of the Law School Admission Test (LSAT) to test the feasibility of the ETRM. The items are designed to test the ability of the test taker to reason within a given set of circumstances, which are described in the stimulus (i.e., testlet-specific text passage). The stimulus contains information about a number of elements (people, places, objects, tasks, and so on) along with a set of conditions imposing a structure on the elements (e.g., ordering them, assigning elements of one set to elements of another set, and so on). The stimuli always permit more than one acceptable outcome satisfying all of the requirements in the stimulus text. Four testlets were available per respondent. Paap et al. extracted three types of features: structural variables, a theme variable, and surface linguistic variables (Table 1). The latter type was scored using text-mining software, and the first two were coded by hand by two of the authors. Relevant testlet features were identified by means of tree-based
5
regression (TBR), in which the testlet effect size ( ) served as a dependent variable. TBR could be seen as a special case of regression modeling, where an underlying regression function is approximated by splitting the “predictor space” recursively into disjointed regions and subsequently fitting constant models to each region; this results in a piecewise-constant approximation to the underlying regression function for the dependent variable (Su et al., 2011).
When using the testlet effect estimated by the 2PNO testlet (2PNO-T) model as a dependent variable, the following variables were selected: Percentage of “If” Clauses, Number of Entities (elements), Theme, and Ordered Positions (whether or not the elements provided in the stimulus had to be put into a certain order to solve the problem). For the 3PNO-based counterpart, the variables were: Percentage of “If” Clauses, Predicate Propositional Density, Theme, and Number of Entities. Also, a number of interaction terms were added to the ETRM: For the 2PNO model 4 interaction terms were added, and for the 3PNO model as many as 14 were added. Before plugging the variables into the ETRM, dummy variables were made for each variable selected in the final two TBR models using the cutoffs suggested by the TBR analyses. These two sets of dummy variables were used to build two ETRM models, a 2PL and a 3PL model, respectively. To assess the added value of the
predictors, the proportion of explained variance (when estimating ) was calculated for each testlet; then the distribution of the explained variance was compared for the models containing main effects only to those containing main effects and interaction terms. Note that for the real data sample, the estimation procedure used was a fully Bayesian approach using an MCMC computation method. The model fit the data quite well; see Glas (2012b) for details. It was found that the average proportion of explained variance increased when the interaction terms were added, with a larger difference for the 3PNO model (0.039 for main effects only, and 0.151 for main + interaction effects) than for the 2PNO model (0.026 and 0.055, respectively). For the 2PNO model, the smallest testlet effect was found for stimuli that contained more than 31% “if” clauses but did not have an educational theme. The largest effect was found for stimuli that contained 31% or fewer “if” clauses and 14 entities or more. For the 3PNO model, the testlet effect was smallest for stimuli that contained 31% or fewer “if” clauses and 9.8% or fewer verbs and that had Media or Animals as the main theme. The largest effect was found for stimuli containing more than 9.8% verbs and four or fewer entities. It should be noted that the average testlet-effect estimate was lower when the 2PNO model was used.
Paap et al. (2012) consulted with a test design expert to ensure the validity of the findings and proposed a theoretical explanation for the selection of the variables Percentage of “If” Clauses and Number of Entities. The reasoning is as follows. In the stimuli, circumstances are described and the test taker is asked to reason within this given set of circumstances. When an unambiguous description of the circumstances is given, the answers to all items within the testlet depend on a correct understanding of the stimulus text, leading to a larger testlet effect. If the number of “if” clauses in the stimulus text increases, this leads to more ambiguity in the circumstances and thus is associated with a smaller testlet effect. Furthermore, if the number of entities is low, this directly implies that the given circumstances cannot be highly complicated. If the circumstances are relatively straightforward, a specific insight is often the key to comprehending the setting outlined in the stimulus text. Dependency on such an insight leads to a high testlet effect. Finally, for highly complex stimuli (i.e., large number of entities), it also holds true that a special insight
6
may be needed to reduce the set of circumstances to a manageable set of relationships, resulting in a high testlet effect.
Is the Predictive Value of the Testlet Features Confounded With Average Item Difficulty?
Since a testlet effect is an additional source of variance in an item response function, the question arises as to whether parameters of items belonging to the same testlet may confound the predictive effect of the testlet features. In other words the aggregated item parameters (i.e., the average difficulty and discrimination parameter of items belonging to the same testlet) may be viewed as a fourth type of testlet feature, in addition to the structural, theme, and linguistic testlet features introduced earlier. Paap and Veldkamp (2012b) found that even when aggregated item parameter values were controlled for, the other testlet features still had predictive value. It should be noted, however, that the aggregated item difficulty was now selected for the first split in the TBR models, implying that it is the most important variable relative to the other independent variables. Remarkably, the analyses showed that testlets with a relatively low average item difficulty were associated with a relatively high testlet effect. This led us to wonder what variables were underlying the differences in the aggregated item parameters between testlets. As a first step to unraveling this issue, Paap and Veldkamp (2012a) investigated the relationship between the structural, theme, and linguistic testlet features on the one hand, and aggregated item parameters (difficulty, discrimination, and guessing) on the other hand. The guessing parameter showed very little variance over the testlets, so it was not used in further analyses. Results showed that stimuli associated with easy items consisted of many different but commonly used words (relatively high score on Word Diversity and Brown News Popularity) and an intermediate proportion of negative words. The most difficult testlets were those with infrequently used words (low score on Brown News Popularity) and a low Word Diversity. Furthermore, the average discrimination parameter per testlet was found to be associated with both structural features and linguistic features. The average discrimination was highest for stimuli with a relatively high Word Diversity and a relatively low number of Average Characters. The average discrimination was lowest for relatively lengthy stimuli containing many different words and a complicated set of circumstances (a relatively high Word Diversity, number of Average Characters, and Number of Entities).
Testlet Framework Part II: Consequences of Testlet Effects on Fisher Information and Theta Estimates
Robust Automated Test Assembly: Taking Into Account the Uncertainty in Information
The application of TRT in operational testing also influences the test assembly
process. Generally, items are stored in an item bank, and 0-1 Linear Programming techniques (van der Linden, 2005) or heuristic methods are applied to select items for a test. In this selection process, an attempt is made to optimize the amount of Fisher information in the test, while a number of specifications with respect to, for example, the content, the response times, or the item types have to be met. Since the items belonging to the same testlet are related, Fisher information provided by
7
these items is slightly smaller. Wang, Bradlow, and Wainer (2002) illustrated that ignoring the testlet effects during test assembly resulted in overestimation of the precision of the ability estimates. Veldkamp and Paap (2012) emphasized that testlet effects are modeled as normally distributed parameters with a mean equal to zero. At the level of the candidates, these effects will vary. Veldkamp and Paap (2012) applied robust ATA methods that took this variation into account during test assembly to the problem of ATA with testlets. The method resulted in a lower bound for Fisher information for all candidates in the population. This lower bound can be used to derive a more reliable estimate of the measurement precision.
Veldkamp and Paap (2012) focused only on the problem of ATA with testlets, where general TRT models (Wainer et al. 2007) were applied. In the case of ETRM, slightly different results might be obtained. In ETRM, testlet effects are modeled as a combination of an explanatory part and a normally distributed rest term.
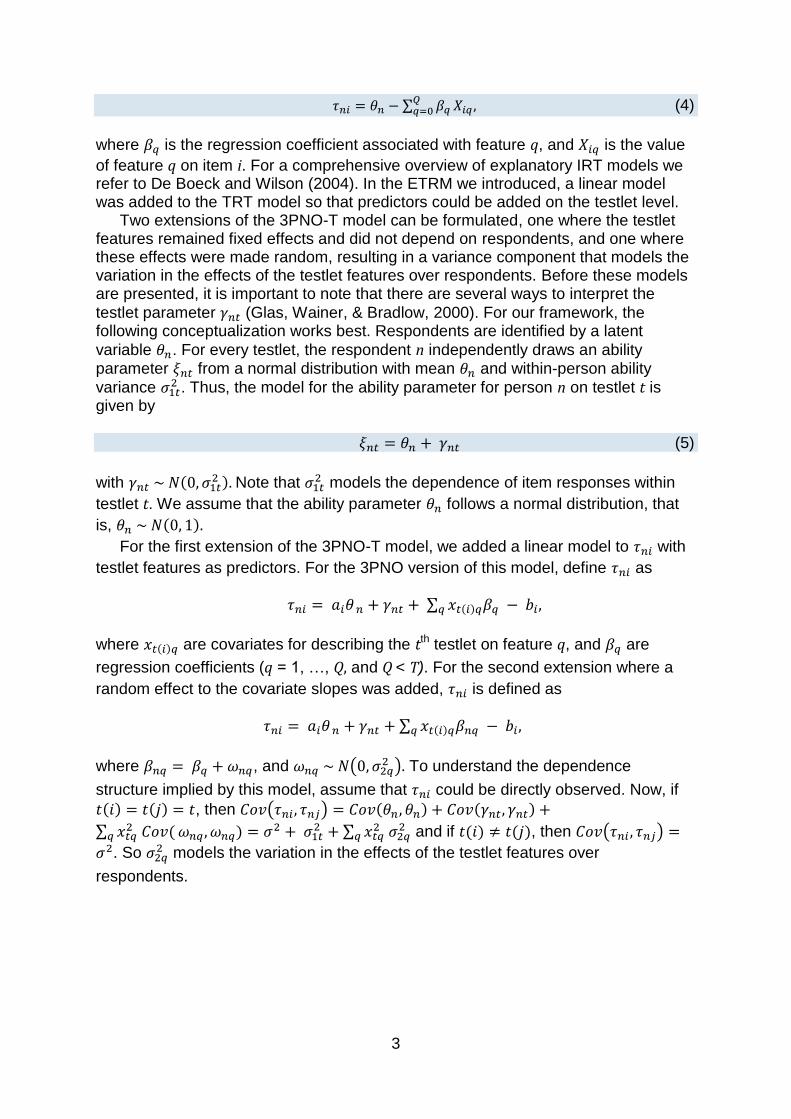
The consequence of applying the Veldkamp and Paap method for robust ATA with testlets is that there is quite a gap between Fisher information and its robust lower bound, even when uncertainty in only one of the testlets is assumed to affect the results. Figure 1 illustrates how application of robust ATA to the ETRM results in a smaller gap. In other words, when the ETRM is applied, more certainty is obtained about the reliability of the estimates of the measurement precision.
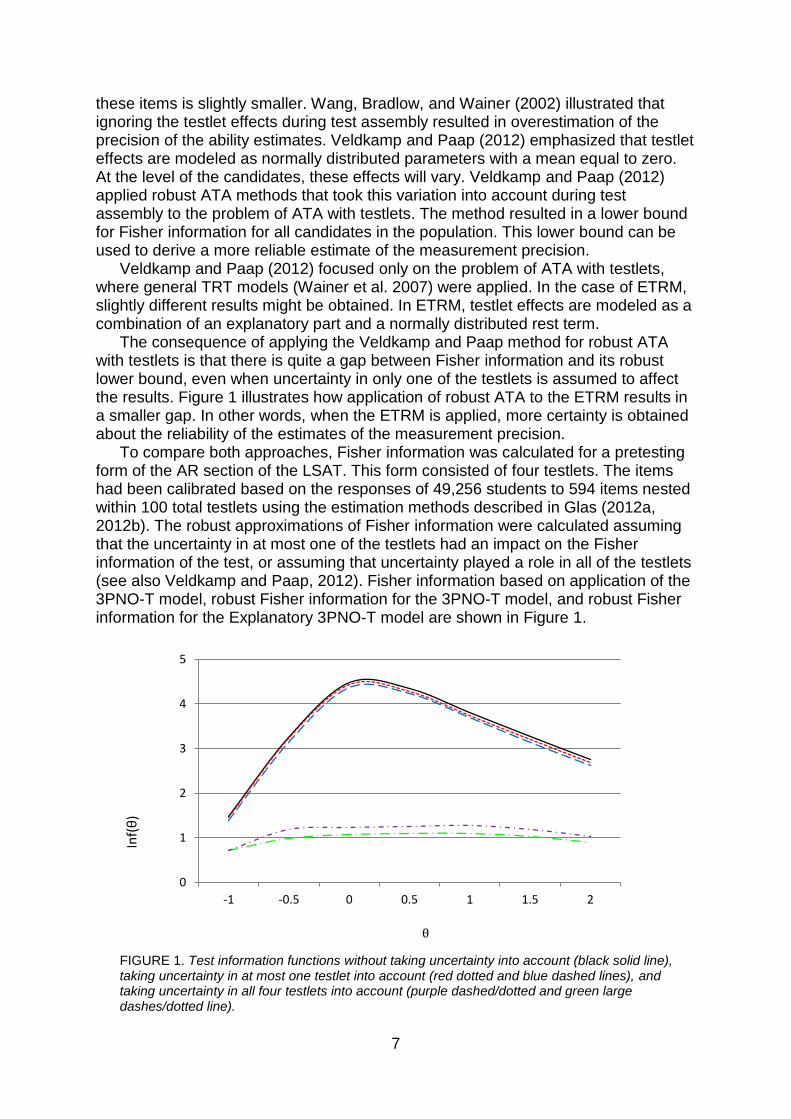
To compare both approaches, Fisher information was calculated for a pretesting form of the AR section of the LSAT. This form consisted of four testlets. The items had been calibrated based on the responses of 49,256 students to 594 items nested within 100 total testlets using the estimation methods described in Glas (2012a, 2012b). The robust approximations of Fisher information were calculated assuming that the uncertainty in at most one of the testlets had an impact on the Fisher information of the test, or assuming that uncertainty played a role in all of the testlets (see also Veldkamp and Paap, 2012). Fisher information based on application of the 3PNO-T model, robust Fisher information for the 3PNO-T model, and robust Fisher information for the Explanatory 3PNO-T model are shown in Figure 1.
FIGURE 1. Test information functions without taking uncertainty into account (black solid line), taking uncertainty in at most one testlet into account (red dotted and blue dashed lines), and taking uncertainty in all four testlets into account (purple dashed/dotted and green large dashes/dotted line).
0
1
2
3
4
5
-1 -0.5 0 0.5 1 1.5 2
Inf(θ)
θ
8
The solid line indicates Fisher information without taking uncertainty into account. When uncertainty in at most one testlet is assumed to affect the solution, the impact on the test information function is very small. For the 3PNO-T model (red dotted line), the effect was slightly larger than for the Explanatory 3PNO-T model (blue dashed line). When uncertainty in all four of the testlets is taken into account, the lower bounds for the resulting test information functions are much more conservative. But it can also be seen here that the results for the Explanatory 3PNO-T model (purple dashes/dots) are less conservative than the lower bound based on the 3PNO-T model (green large dashes/dots). Unfortunately, the explanatory part did not explain that much of the testlet effect in our data set. Therefore, the difference between the lower bounds for the 3PNO and the Explanatory 3PNO-T models are only small.
Theta Estimates and Their Standard Errors
In the previous section, it was shown that taking into account the uncertainty in
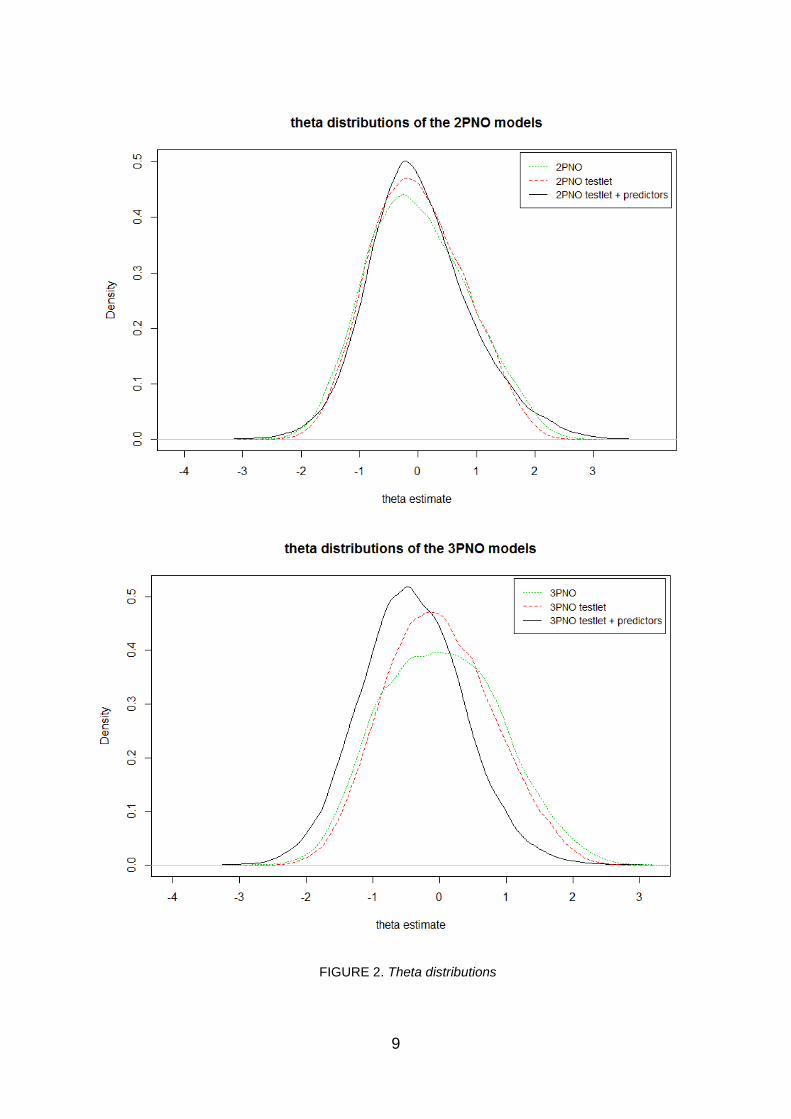
information that is induced by testlet effects has an impact on the process of ATA. In this section we will present new results describing the impact of model choice (ignoring the testlet effect, modeling it, modeling both the testlet effect and the testlet features) on theta estimates and their standard errors (SEs). In these analyses, we used the same data (responses of 49,256 students to 594 items nested within 100 total testlets (stimuli) as was used by Paap et al. (2012) to investigate the feasibility of the ETRM. As before, the estimation procedure used was a fully Bayesian approach using an MCMC computation method. In Figure 2 the distributions of theta estimates for both the 2PNO and 3PNO models are shown.
9
FIGURE 2. Theta distributions
10
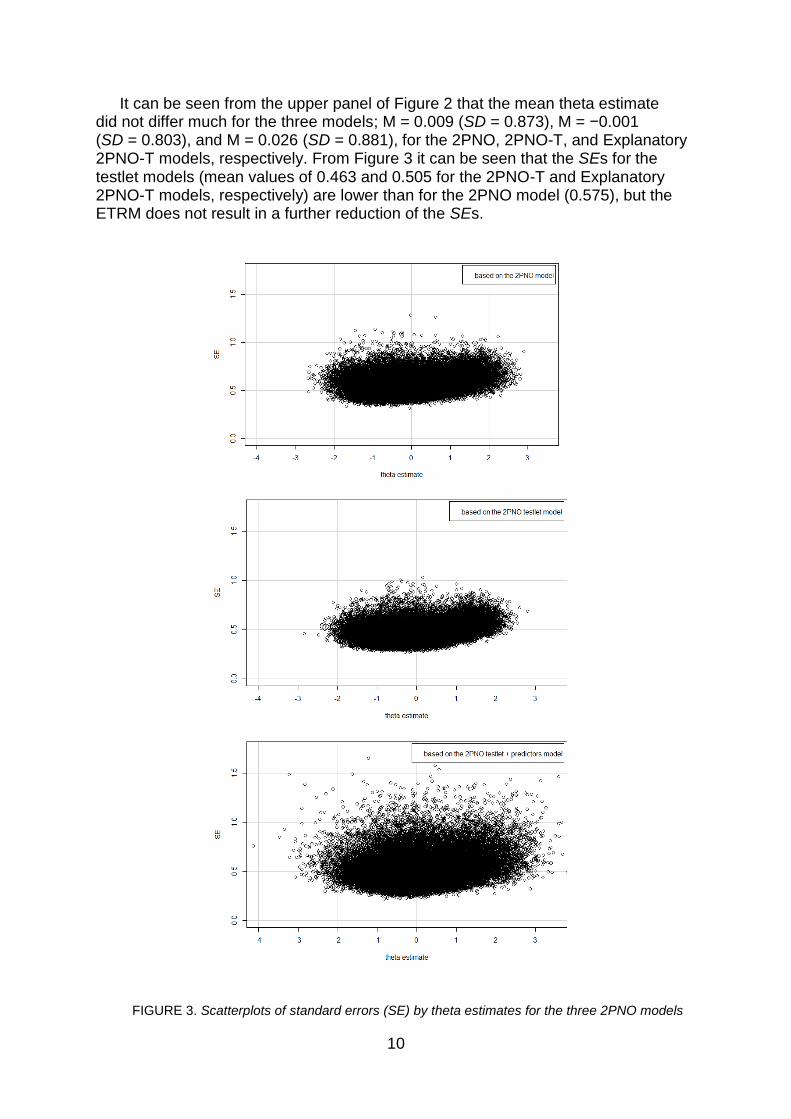
It can be seen from the upper panel of Figure 2 that the mean theta estimate did not differ much for the three models; M = 0.009 (SD = 0.873), M = −0.001 (SD = 0.803), and M = 0.026 (SD = 0.881), for the 2PNO, 2PNO-T, and Explanatory 2PNO-T models, respectively. From Figure 3 it can be seen that the SEs for the testlet models (mean values of 0.463 and 0.505 for the 2PNO-T and Explanatory 2PNO-T models, respectively) are lower than for the 2PNO model (0.575), but the ETRM does not result in a further reduction of the SEs.
FIGURE 3. Scatterplots of standard errors (SE) by theta estimates for the three 2PNO models
11
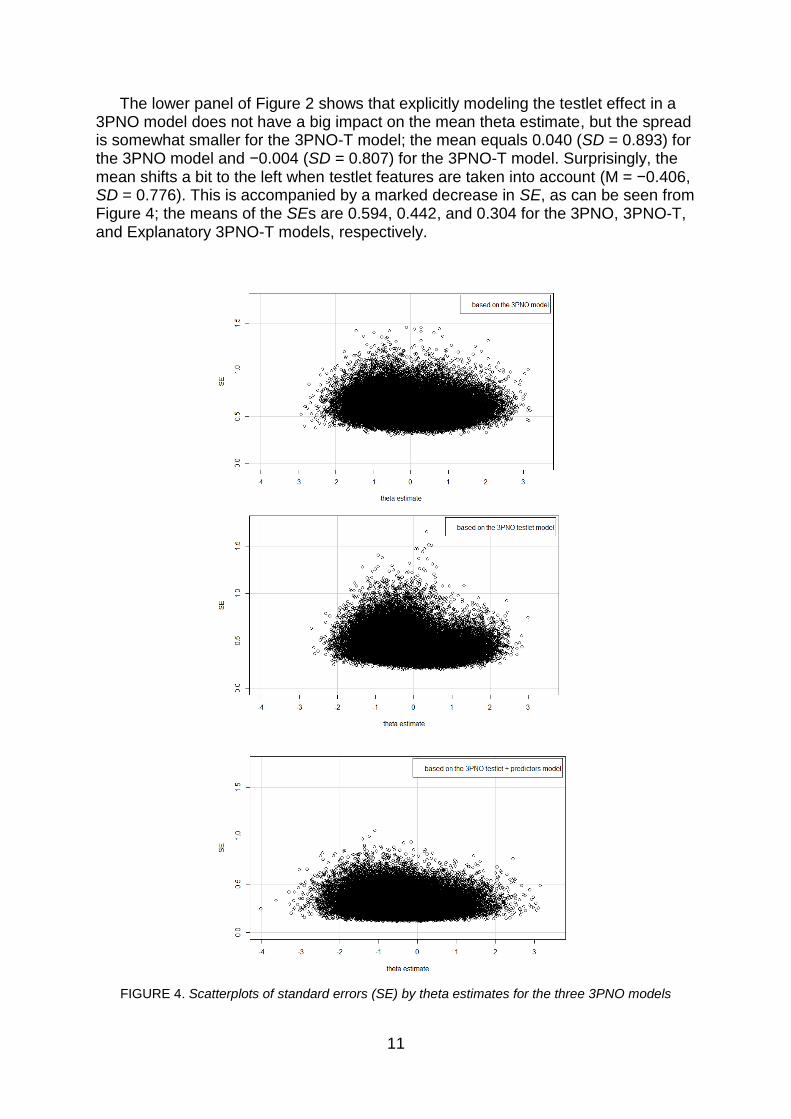
The lower panel of Figure 2 shows that explicitly modeling the testlet effect in a 3PNO model does not have a big impact on the mean theta estimate, but the spread is somewhat smaller for the 3PNO-T model; the mean equals 0.040 (SD = 0.893) for the 3PNO model and −0.004 (SD = 0.807) for the 3PNO-T model. Surprisingly, the mean shifts a bit to the left when testlet features are taken into account (M = −0.406, SD = 0.776). This is accompanied by a marked decrease in SE, as can be seen from Figure 4; the means of the SEs are 0.594, 0.442, and 0.304 for the 3PNO, 3PNO-T, and Explanatory 3PNO-T models, respectively.
FIGURE 4. Scatterplots of standard errors (SE) by theta estimates for the three 3PNO models
12
This finding is unexpected: Adding testlet feature information should not lead to a shift in theta estimates. Although it may seem tempting to infer from the low SEs for this model that the ETRM performs best out of the three models, it should be noted that the mean square error is a function of both bias and SE. Based on our findings, we suspect that a certain bias may have slipped into the estimation of the 3PNO models. However, we cannot firmly conclude which of the 3PNO models suffers from this bias. Based on our experience, we speculate that the complexity of the 3PNO model, which is accompanied by larger testlet effects and larger SEs for the item parameters, in combination with an extension to an ETRM, results in unstable estimates. It should also be noted that only four data points (testlets) were available per respondent to estimate individual regression lines (random coefficients for the testlet features in the ETRM). Had this number been larger, this may have resulted in more stable estimates.
Conclusion and Discussion
In our research project, we focused on the relation between the features of testlets and the magnitude of the testlet effects. An attempt was made to identify relevant features, and to model the relation between these features and testlet effects in a psychometric model to support the common activities of educational measurement such as test assembly, scoring candidates, and identification of DIF.
In previous reports, we described how to build an ETRM and how to estimate the parameters by applying Bayesian procedures for parameter estimation. A classification and regression tree (CART) was applied to identify relevant features for predicting testlet effects. A procedure for model fit was presented, and consequences for test assembly were studied. The ETRM was applied in the context of the AR section of the LSAT. It was demonstrated that small to medium testlet effects were present. The variables Percentage of “If” Clauses, Predicate Propositional Density, Theme, Number of Entities, and Ordered Positions turned out to be related to testlet effects. The model showed an appropriate fit, and no substantial DIF was found in the data.
Two important questions remained: first, whether the application of ETRM affected test assembly; and second, how application of the ETRM affected ability estimation. In this final report we address these issues. It was demonstrated empirically how application of the ETRM resulted in a less conservative lower bound for the test information function. The explanation for this effect can be found in the magnitude of the testlet effect. When explanatory variables are added to the 3PNO-T model, the variance component of the rest term becomes smaller than the variance term in the 3PNO-T model. As a consequence, the uncertainty in the test assembly model reduces as well, and a less conservative lower bound for the test information function is obtained.
Application of the 2PNO and 3PNO-T models did not lead to any shifts in the distribution of ability estimates. This is in accordance with results of comparable studies by others (e.g., Wainer et al., 2007). Extension of the model to ETRM led to some unexpected results. For the Explanatory 3PNO-T model, the distribution of ability estimates shifted to the left, which indicated bias. We cannot explain these results, but we expect that it might be caused by the complexity of the model and the limited number of data points for estimating the explanatory part of the model.
13
Finally, in this research project, a framework was presented to model the relation between relevant testlet features and testlet effects. Application of these new techniques to the AR section of the LSAT implied that violations of the assumption of local independence were modeled explicitly. For the AR data at hand, small and medium testlet effects were found. The presence of these testlet effects, however, did not impact ability estimates and did not indicate any DIF. We also identified relevant features for predicting the testlet effect that can be used in test development. ETRM models were estimated for the AR data as well. Based on the unexpected results found in this paper, however, we have to conclude that application of the ETRM to the AR section of the LSAT cannot yet be supported in practice.
References
Bradlow, E. T., Wainer, H., & Wang, X. H. (1999). A Bayesian random effects model for testlets. Psychometrika, 64(2), 153–168.
De Boeck, P., & Wilson, M. (2004). Explanatory item response models: A generalized linear and nonlinear approach. New York: Springer.
Fischer, G. H. (1973). The linear logistic test model as an instrument in educational research. Acta Psychologica, 37, 359–374.
Fischer, G. H. (1983). Logistic latent trait models with linear constraints. Psychometrika, 48, 3–26.
Glas, C. A. W. (1999). Modification indices for he 2-PL and the nominal response model. Psychometrika, 64, 273–294.
Glas, C. A. W. (2012a). Estimating and testing the extended testlet model (LSAC Research Report, RR 12-03). Newtown, PA: Law School Admission Council.
Glas, C. A. W. (2012b). Fit to testlet models and differential testlet functioning (LSAC Research Reports, RR 12-07). Newtown, PA: Law School Admission Council.
Glas, C. A. W., Wainer, H., & Bradlow, E. T. (2000). MML and EAP estimation in testlet-based adaptive testing. In W. J. van der Linden & C. A. W. Glas (Eds.), Computer Adaptive Testing: Theory and Practice (pp. 271–288). Dordrecht, Netherlands: Kluwer.
Paap, M. C. S., Glas, C. A. W., He, Q., & Veldkamp, B. P. (2012). Using testlet features to predict response behavior on testlets: The explanatory testlet response model. Manuscript submitted for publication.
Paap, M. C. S., & Veldkamp, B.P. (2012a). Unraveling the relationship between testlet features and item parameters: An empirical example (LSAC Research Reports, RR 12-06). Newtown, PA: Law School Admission Council.
14
Paap, M. C. S., & Veldkamp, B. P. (2012b). Minimizing the testlet effect: Identifying critical testlet features by means of tree-based regression. In T. J. H. M. Eggen & B. P. Veldkamp (Eds.), Psychometrics in Practice at RCEC. Enschede, The Netherlands: RCEC, Cito/University of Twente.
Rasch, G. (1960). Probabilistic models for some intelligence and attainment tests. Copenhagen: Danish Institute of Educational Research.
Sörbom, D. (1989). Model modification. Psychometrika, 54, 371–384.
Su, X., Azuero, A., Cho, J., Kvale, E., Meneses, K. M., & McNees, M. P. (2011). An introduction to tree-structured modeling with application to quality of life data. Nurs Res, 60(4), 247–255. doi: 10.1097/NNR.0b013e318221f9bc
van der Linden, W. J. (2005). Linear models for optimal test design. New York: Springer.
Veldkamp, B. P., & Paap, M. C. S. (2012). Robust automated test assembly for testlet-based tests: An illustration with the Analytical Reasoning section of the LSAT. Manuscript submitted for publication (LSAC Research Reports, RR 13-02). Newtown, PA: Law School Admission Council.
Wainer, H., Bradlow, E. T., & Wang, X. (2007). Testlet response theory and its applications. New York: Cambridge University Press.
Wang, X., Bradlow, E.T., & Wainer, H. (2002). A general Bayesian model for testlets: Theory and applications. Applied Psychological Measurement, 26, 109–128.
![Comparison of integrated testlet and constructed-response ...examination [10,13]. A reading comprehension testlet provides a classic example of a traditional testlet, with a ... chem-istry,](https://img.pdfslide.us/doc/110x75/5f1781c12018f27c6453dbbd/comparison-of-integrated-testlet-and-constructed-response-examination-1013.jpg)