Embed Size (px)
Citation preview

LUXURY MARKET REPORT
- May 2018 -
www.LuxuryHomeMarketing.com

Copyright © 2018 Institute for Luxury Home Marketing | www.luxuryhomemarketing.com | 214.485.3000The Luxury Market Report is a monthly analysis provided by The Institute for Luxury Home Marketing. Luxury benchmark prices are
determined by The Institute annually. This active and sold data has been compiled by various sources, including local MLS boards, local tax records and Realtor.com. Data is deemed reliable to the best of our knowledge, but is not guaranteed.
MAP OF LUXURY RESIDENTIAL MARKETS
THIS IS YOUR
LUXURY MARKET REPORT
Welcome to the Luxury Market Report, your guide to luxury real estate market data and trends
for North America. Produced monthly by The Institute for Luxury Home Marketing, this report
provides an in-depth look at the top residential markets across the United States and Canada. Within the
individual markets, you will find established luxury benchmark prices and detailed survey of luxury active and
sold properties designed to showcase current market status and recent trends. The national report illustrates a
compilation of the top North American markets to review overall standards and trends.

REPORT GLOSSARY
The Institute for Luxury Home Marketing has analyzed a number of metrics — including sales prices, sales volumes, number of sales, sales-price-to-list-price ratios, days on market and price-per-square-foot – to provide you a comprehensive North American Luxury Market report.
Additionally, we have further examined all of the individual luxury markets to provide both an overview and an in-depth analysis - including, where data is sufficient, a breakdown by luxury single-family homes and luxury attached homes.
It is our intention to include additional luxury markets on a continual basis. If your market is not featured, please contact us so we can implement the necessary qualification process. More in-depth reports on the luxury communities in your market are available as well.
Looking through this report, you will notice three distinct market statuses, buyer's market, seller's market, and balanced market. A Buyer's Market indicates that buyers have greater control over the price point. This market type is demonstrated by a substantial number of homes on the market and few sales, suggesting demand for residential properties is slow for that market and/or price point.
By contrast, a Seller's Market gives sellers greater control over the price point. Typically this means there are few homes on the market and a generous demand, causing competition between buyers who ultimately drive sales prices higher.
A Balanced Market indicates that neither the buyers nor the sellers control the price point at which that property will sell and that there is neither a glut nor a lack of inventory. Typically, this type of market sees a stabilization of both the list and sold price, the length of time the property is on the market as well as the expectancy amongst homeowners in their respective communities – so long as their home is priced in accordance with the current market value.
REMAINING INVENTORY: The total number of homes available at the close of a month.
DAYS ON MARKET: Measures the number of days a home is available on the market before a purchase offer is accepted.
LUXURY BENCHMARK PRICE: The price point that marks the transition from traditional homes to luxury homes.
NEW LISTINGS: The number of homes that entered the market during the current month.
PRICE PER SQUARE FOOT: Measures the dollar amount of the home's price for an individual square foot.
SALES RATIO: Sales Ratio defines market speed and determines whether the market currently favors buyers or sellers. Buyer's Market = up to 14%; Balanced Market = 15 to 20%; Seller's Market = 21% plus. If >100%, sales from previous month exceeds current inventory.
SP/LP RATIO: The Sales Price/List Price Ratio compares the value of the sold price to the value of the list price.
– LUXURY REPORT OVERVIEW –

“With the levelling of key indicators, questions arise as
to the contributors of this stabilization; are these caused
by a greater need to sell real estate holdings at closer to
market prices, or an increased confidence from luxury real
estate investors, or perhaps this stable market has invited
interest from a new pool of international buyers? ”

The spring market has continued to move forward with an upward momentum, but where March saw near meteoric rises in the number of luxury home sales, April is reporting a levelling off with only a small increase against last month’s figures. Other market indicators, such as new listings, sold prices and sales ratios are actually in-line with market expectations during the typically busier spring market, and results show these are comparable to the same period in 2017. These trends indicate that predictions for a decline in the luxury market during 2018 remain unfounded.
With the levelling of key indicators, questions arise as to the contributors of this stabilization; are these caused by a greater need to sell real estate holdings at closer to market prices, or an increased confidence from luxury real estate investors, or perhaps this stable market has invited interest from a new pool of international buyers?
In the luxury single-family home market there was a decline in the median list price by 7.4% compared to March, whereas the sold price rose 1.1%, decreasing the distance between these two key indicators by a significant 0.51% to 97.72%. The number of sales rose 13.2% and the average number of days on market (DOM) dropped from 43 to 31 days, which is the lowest recorded DOM in 13 months.
Compared to 2017, list and sold prices are pretty much on par, price per square foot is slightly higher and the days on market are significantly less, which does inspire confidence. Even with a 4.5% increase in the number of new listings, which slightly offsets the increase in sales, these numbers clearly show a Balanced Market, contributing to the interpretation of a stable market.
Indicators for attached luxury homes also report continuity in the stabilization of this market segment. The difference between list price and sold price decreased by 0.31% to 98.70%, significant considering pricing is within reach of the 99% percentile. The median sales price rose by 2.9%, the number of sales by 6.3% and the DOM dropped from 41 to 33 days. Compared to 2017, list and sold prices are pretty much on par, price per square foot is slightly higher and the days on market are significantly less, again inspiring market confidence.
For both market segments the sales ratios for April showed only marginal increases between 0.68% and 1.3% against the previous month, illustrating that, on the whole, luxury real estate is still a balanced market. These small but positive changes can easily be attributed to the traditionally busy spring market, but if increases continue over time, a market shift in favor of sellers could emerge.
Locally in the luxury single family markets, Vancouver's median sale price rose 18% to $3,549,444 and the median sales price in LA-The Valley rose 9% to $1,916,000. In the local luxury attached home markets, the median sales price in Boca Raton/Delray beach rose 18% to $900,000 and Denver's median sales price rose 10% to $658,750.
For more information on a particular luxury market, please refer to its corresponding individual report where trends can vary depending on population, location, seasons, and other local factors.
APRIL2 0 1 8
NORTH AMERICAN LUXURY REVIEW

– 13-MONTH MARKET TRENDS* –
Single-Family Homes Attached Homes Single-Family List Price Attached List Price
DA
YS
ON
MA
RK
ET
SA
LE
S P
RIC
E V
S.
LIS
T P
RIC
EPR
ICE
PE
R S
QU
ARE
FO
OT
All data is based off median values. Median prices represent properties priced above respective city benchmark prices.
FOR THE LUXURY NORTH AMERICAN MARKET
*Discrepancies between statistics published in the March 2018 and April 2018 Luxury Market Reports are due to the addition of
Fort Lauderdale, FL and the revision to Chicago, IL.
4639 41
4953
56 5651
59 61 60
43
314337
42
3540
4437
44 44 43 42 41
33
0
20
40
60
80
APR MAY JUN JUL AUG SEP OCT NOV DEC JAN FEB MAR APR
$526
$528 $543
$523
$501 $527 $5
64
$543
$526 $5
58
$511 $5
60 $573
$392
$387
$387
$383
$389
$398
$382
$381
$357 $3
88
$397
$393 $408
$0
$100
$200
$300
$400
$500
$600
APR MAY JUN JUL AUG SEP OCT NOV DEC JAN FEB MAR APR
$0
$250,000
$500,000
$750,000
$1,000,000
$1,250,000
$1,500,000
$1,750,000
$2,000,000
APR MAY JUN JUL AUG SEP OCT NOV DEC JAN FEB MAR APR

– LUXURY MONTHLY MARKET REVIEW –
• Official Market Type: Balanced Market with a 16.22% Sales Ratio.1
• Homes are selling for an average of 97.72% of list price.
• The median luxury threshold2 price is $975,000, and the median luxury home sales price is $1,390,000.
• Markets with the Highest Median Sales Price: Vail ($5,716,250), San Francisco ($3,888,944), LA-Beach Cities ($3,875,000), and Vancouver ($3,549,444).
• Markets with the Highest Sales Ratio: Silicon Valley (94%), Seattle (89%), San Francisco (51%), and Denver (47%).
1Sales Ratio defines market speed and market type: Buyer's = up to 14%; Balanced = 15 to 20%; Seller's = 21% plus. If >100%, sales from previous
month exceeds current inventory. 2The luxury threshold price is set in December of each year by The Institute for Luxury Home Marketing.
SINGLE-FAMILY HOMES MARKET SUMMARY | APRIL 2018
New Listings Total Sold Days on Market Sales RatioMed. Sale Price
477 699 $15,000 12 1.3%
SINGLE-FAMILY HOMES
Median List Price $1,790,756 $1,657,500
Median Sale Price $1,375,000 $1,390,000
Median SP/LP Ratio 97.21% 97.72%
Total Sales Ratio 14.92% 16.22%
Median Price per Sq. Ft. $393 $408
Total Inventory 35,461 36,941
New Listings 10,528 11,005
Total Sold 5,292 5,991
Median Days on Market 43 31
Average Home Size 3,606 3,560
AprilMarch AprilMarch
A Review of Key Market Differences Month Over Month
March 2018 | April 2018
Median prices represent properties priced above respective city benchmark prices.
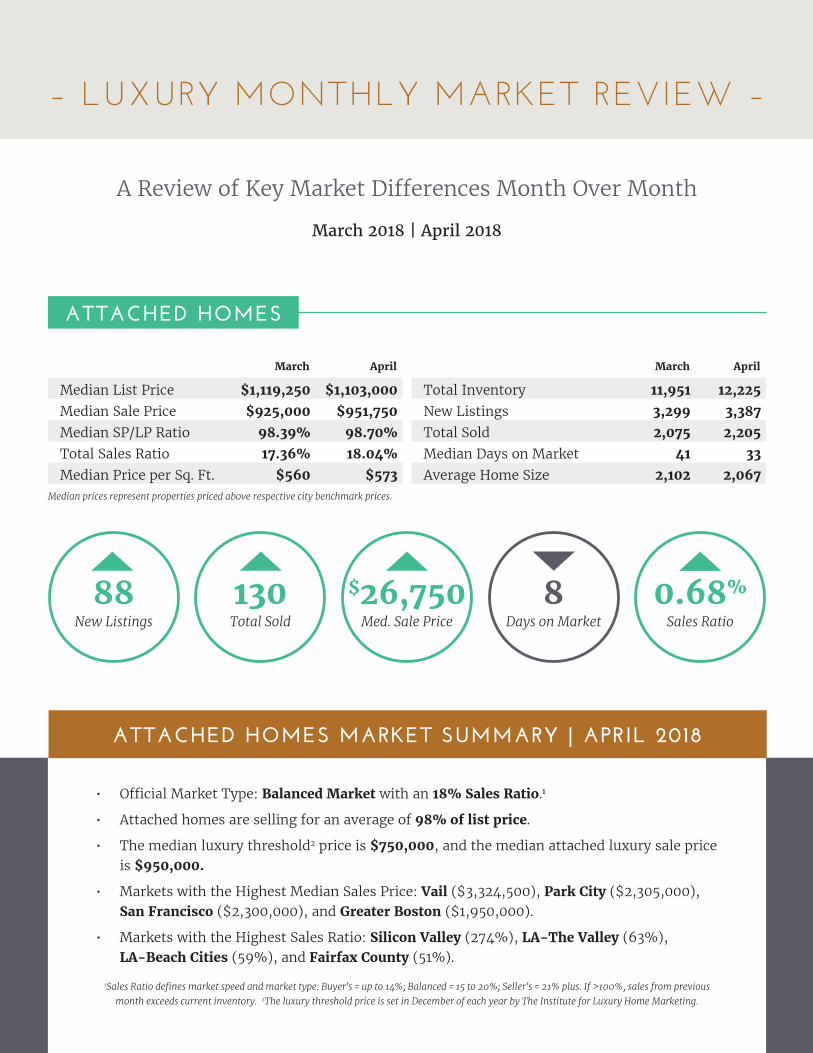
ATTACHED HOMES
New Listings Total Sold Days on Market Sales RatioMed. Sale Price
88 130 8 0.68%
ATTACHED HOMES MARKET SUMMARY | APRIL 2018
• Official Market Type: Balanced Market with an 18% Sales Ratio.1
• Attached homes are selling for an average of 98% of list price.
• The median luxury threshold2 price is $750,000, and the median attached luxury sale price is $950,000.
• Markets with the Highest Median Sales Price: Vail ($3,324,500), Park City ($2,305,000), San Francisco ($2,300,000), and Greater Boston ($1,950,000).
• Markets with the Highest Sales Ratio: Silicon Valley (274%), LA-The Valley (63%), LA-Beach Cities (59%), and Fairfax County (51%).
1Sales Ratio defines market speed and market type: Buyer's = up to 14%; Balanced = 15 to 20%; Seller's = 21% plus. If >100%, sales from previous
month exceeds current inventory. 2The luxury threshold price is set in December of each year by The Institute for Luxury Home Marketing.
$26,750
Median List Price $1,119,250 $1,103,000
Median Sale Price $925,000 $951,750
Median SP/LP Ratio 98.39% 98.70%
Total Sales Ratio 17.36% 18.04%
Median Price per Sq. Ft. $560 $573
Total Inventory 11,951 12,225
New Listings 3,299 3,387
Total Sold 2,075 2,205
Median Days on Market 41 33
Average Home Size 2,102 2,067
AprilMarch AprilMarch
– LUXURY MONTHLY MARKET REVIEW –
A Review of Key Market Differences Month Over Month
March 2018 | April 2018
Median prices represent properties priced above respective city benchmark prices.

– LUXURY MONTHLY MARKET REVIEW –
State Market NameMedian
List PriceMedian
Sold Price InventoryNew
Listings SoldDays on Market
Market Status
AB Calgary $1,149,450 $937,800 648 284 108 21 Balanced
AZ Phoenix $749,900 $622,500 890 243 164 53 Balanced
AZ Scottsdale $1,799,000 $1,390,000 1,394 174 136 111 Buyer's
AZ Tucson $750,000 $635,750 801 173 108 42 Buyer's
BC Vancouver $3,988,000 $3,549,444 1,411 497 72 31 Buyer's
BC Victoria $1,895,000 $1,355,000 333 144 45 23 Buyer's
CA Los Angeles Beach Cities $4,969,500 $3,875,000 396 134 69 40 Balanced
CA Los Angeles City $3,995,000 $2,800,000 751 252 136 49 Balanced
CA Los Angeles The Valley $2,192,000 $1,916,000 554 222 103 45 Balanced
CA Marin County $3,495,000 $3,077,500 139 47 34 24 Seller's
CA Napa County $2,850,000 $1,640,000 112 25 9 158 Buyer's
CA Orange County $2,375,000 $1,975,000 1,569 506 285 32 Balanced
CA Palm Springs & Palm Desert $1,349,000 $1,575,000 656 112 94 72 Buyer's
CA Sacramento $799,000 $704,107 671 327 305 11 Seller's
CA San Diego $2,199,995 $1,545,000 1,229 439 249 30 Balanced
CA San Francisco $4,385,000 $3,888,944 63 15 32 13 Seller's
CA Santa Barbara $3,800,000 $2,600,000 211 44 21 15 Buyer's
CA Silicon Valley $4,895,000 $3,100,000 185 117 174 9 Seller's
CO Boulder $1,975,000 $1,525,000 190 74 55 48 Seller's
CO Denver $1,025,000 $857,000 925 370 431 8 Seller's
CO Vail $4,425,000 $5,716,250 116 5 8 66 Buyer's
DC Washington D.C. $3,500,000 $2,850,000 63 31 10 22 Balanced
FL Boca Raton & Delray Beach $1,999,000 $1,431,000 640 99 42 60 Buyer's
FL Greater Fort Lauderdale $1,295,000 $900,000 1,603 319 148 62 Buyer's
FL Jacksonville Beaches $1,369,250 $997,603 76 16 11 0 Buyer's
FL Miami $1,399,000 $975,000 1,387 249 85 108 Buyer's
SINGLE-FAMILY HOMES
Median prices represent properties priced above respective city benchmark prices.

– LUXURY MONTHLY MARKET REVIEW –SINGLE-FAMILY HOMES
State Market NameMedian
List PriceMedian
Sold Price InventoryNew
Listings SoldDays on Market
Market Status
FL Naples $1,850,000 $1,744,000 1,324 163 158 59 Buyer's
FL Palm Beach Towns $3,047,500 $3,160,661 394 47 50 101 Buyer's
FL Sarasota & Beaches $1,657,500 $1,600,000 542 59 61 66 Buyer's
GA Atlanta $1,199,900 $927,500 1,398 431 162 20 Buyer's
HI Maui $3,300,000 $1,699,000 201 24 12 157 Buyer's
IL Chicago $1,282,450 $1,050,000 2,024 746 299 77 Buyer's
MA Greater Boston $2,995,000 $2,600,000 135 44 25 31 Balanced
MD Montgomery County $1,799,000 $1,379,000 415 141 71 12 Balanced
MI Oakland County $750,000 $590,000 1,028 384 153 20 Buyer's
MO St. Louis $799,950 $684,128 196 66 43 8 Seller's
NC Raleigh-Durham $725,000 $655,000 982 268 213 3 Seller's
NV Las Vegas $739,000 $635,000 1,209 379 267 30 Seller's
NY Brooklyn $1,488,500 $1,162,500 182 47 10 114 Buyer's
NY Long Island $1,497,000 $1,200,000 3,137 892 247 92 Buyer's
NY Staten Island $1,199,900 $969,000 163 54 15 65 Buyer's
ON Toronto $3,295,000 $3,112,500 425 260 80 10 Balanced
TN Nashville $950,000 $875,000 336 120 91 24 Seller's
TX Austin $1,095,000 $882,500 774 282 228 16 Seller's
TX Collin County $708,375 $667,500 902 286 126 25 Buyer's
TX Dallas $1,145,000 $830,000 788 282 154 25 Balanced
TX Houston $845,000 $750,000 1,876 618 309 39 Balanced
TX The Woodlands & Spring $775,000 $692,450 543 188 65 91 Buyer's
UT Park City $3,399,000 $2,577,000 237 28 21 128 Buyer's
VA Fairfax County $1,599,900 $1,436,650 577 211 72 31 Buyer's
WA Seattle $1,950,000 $1,520,000 140 67 125 7 Seller's
Median prices represent properties priced above respective city benchmark prices.

– LUXURY MONTHLY MARKET REVIEW –ATTACHED HOMES
Markets with dashes do not have a significant luxury market for this report. Median prices represent properties priced above respective city benchmark prices.
State Market NameMedian
List PriceMedian
Sold Price InventoryNew
Listings SoldDays on Market
Market Status
AB Calgary $839,900 $800,250 296 107 40 31 Buyer's
AZ Phoenix - - - - - - -
AZ Scottsdale $680,000 $595,000 159 27 41 55 Seller's
AZ Tucson - - - - - - -
BC Vancouver $1,998,000 $1,754,900 642 338 82 11 Buyer's
BC Victoria $910,000 $750,000 135 79 40 14 Seller's
CA Los Angeles Beach Cities $1,575,000 $1,304,000 71 31 42 10 Seller's
CA Los Angeles City $1,699,000 $1,294,500 261 89 82 35 Seller's
CA Los Angeles The Valley $699,000 $680,000 111 62 70 34 Seller's
CA Marin County $1,222,500 $1,343,000 16 11 7 25 Seller's
CA Napa County - - - - - - -
CA Orange County $1,079,000 $925,000 378 162 129 18 Seller's
CA Palm Springs & Palm Desert - - - - - - -
CA Sacramento - - - - - - -
CA San Diego $1,127,000 $851,000 434 181 146 20 Seller's
CA San Francisco $2,817,500 $2,300,000 96 40 35 13 Seller's
CA Santa Barbara $2,000,000 $1,488,000 34 7 4 35 Buyer's
CA Silicon Valley $1,468,000 $1,450,000 43 40 118 9 Seller's
CO Boulder $859,500 $900,708 58 15 18 53 Seller's
CO Denver $700,000 $658,750 397 168 176 13 Seller's
CO Vail $3,037,500 $3,324,500 72 4 8 21 Buyer's
DC Washington D.C. $1,850,000 $1,575,000 150 74 45 7 Seller's
FL Boca Raton & Delray Beach $850,000 $900,000 406 62 52 47 Buyer's
FL Greater Fort Lauderdale $859,900 $770,000 1,201 185 97 90 Buyer's
FL Jacksonville Beaches $1,295,000 $933,500 31 2 3 39 Buyer's
FL Miami $995,000 $1,000,000 2,730 282 85 170 Buyer's

– LUXURY MONTHLY MARKET REVIEW –ATTACHED HOMES
Markets with dashes do not have a significant luxury market for this report. Median prices represent properties priced above respective city benchmark prices.
State Market NameMedian
List PriceMedian
Sold Price InventoryNew
Listings SoldDays on Market
Market Status
FL Naples $2,000,000 $1,710,000 332 26 30 74 Buyer's
FL Palm Beach Towns $1,399,500 $1,360,000 234 29 27 84 Buyer's
FL Sarasota & Beaches $1,177,500 $1,100,000 228 39 34 66 Buyer's
GA Atlanta $699,000 $615,000 495 120 70 41 Buyer's
HI Maui $1,689,000 $1,680,000 133 13 25 158 Balanced
IL Chicago $1,249,839 $970,000 910 333 169 58 Balanced
MA Greater Boston $2,399,000 $1,950,000 215 72 51 26 Seller's
MD Montgomery County $849,900 $700,000 183 75 61 8 Seller's
MI Oakland County $934,500 $596,100 64 15 10 24 Balanced
MO St. Louis - - - - - - -
NC Raleigh-Durham - - - - - - -
NV Las Vegas - - - - - - -
NY Brooklyn $964,000 $1,165,000 64 26 5 99 Buyer's
NY Long Island $928,944 $905,250 254 69 20 108 Buyer's
NY Staten Island - - - - - - -
ON Toronto $1,288,000 $1,159,000 318 296 151 8 Seller's
TN Nashville $711,950 $607,500 102 36 12 23 Buyer's
TX Austin $750,000 $636,750 179 48 34 24 Balanced
TX Collin County - - - - - - -
TX Dallas $699,000 $632,500 203 47 34 49 Balanced
TX Houston $620,000 $619,250 217 68 34 100 Balanced
TX The Woodlands & Spring - - - - - - -
UT Park City $2,035,000 $2,305,000 156 6 15 70 Buyer's
VA Fairfax County $699,950 $650,000 132 75 67 5 Seller's
WA Seattle $1,474,950 $992,500 85 28 36 10 Seller's