Embed Size (px)
Citation preview
Name: ____________________________________________
1) On a certain day, the isobars on aweather map are very close togetherover eastern New York State. To makethe people of this area aware ofpossible risk to life and property in thissituation, the National Weather Serviceshould issueA) a dense-fog warningB) an air-pollution advisoryC) a high-wind advisoryD) a heat-index warning
2) According to the Earth ScienceReference Tables, a barometer readingof 29.53 inches is equal to how manymillibars?A) 1,003.0 mbB) 997.0 mbC) 1,000.0 mbD) 999.0 mb
3) A weather map of New York Stateshows isobars that are close together,indicating a steep pressure gradient.Which weather condition is most likelypresent?A) strong windsB) dry airC) low visibilityD) low temperatures
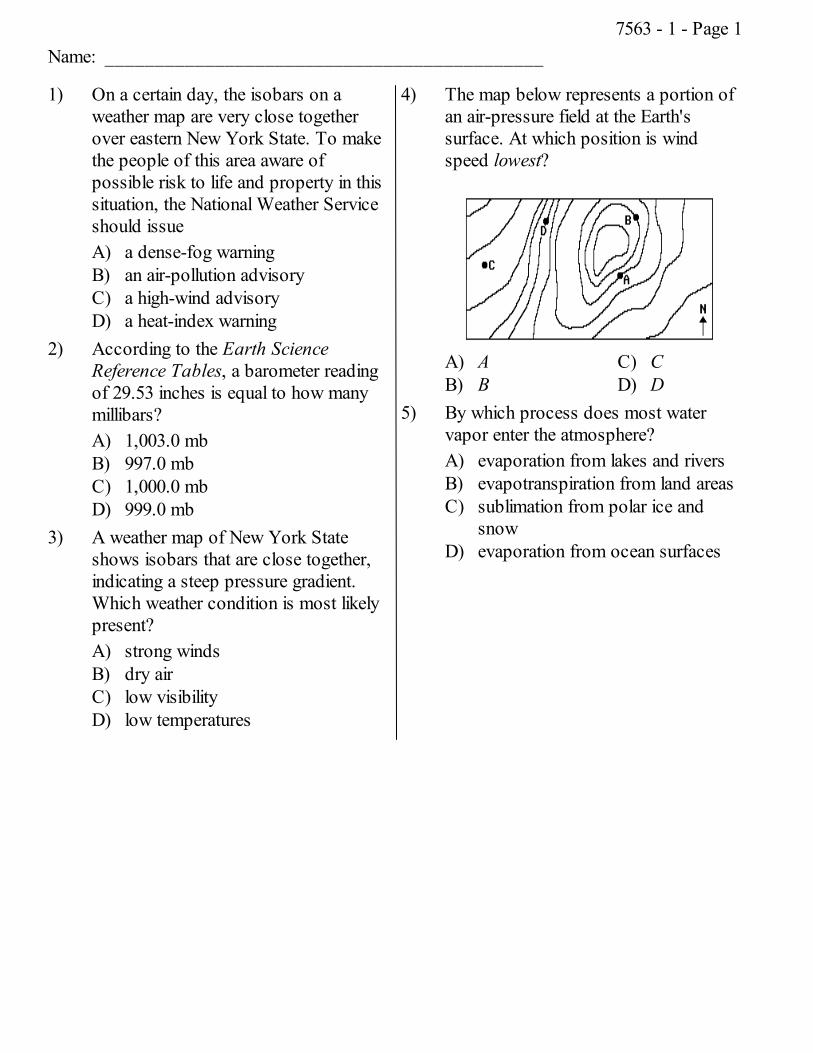
4) The map below represents a portion ofan air-pressure field at the Earth'ssurface. At which position is windspeed lowest?
A) AB) B
C) CD) D
5) By which process does most watervapor enter the atmosphere?A) evaporation from lakes and riversB) evapotranspiration from land areasC) sublimation from polar ice and
snowD) evaporation from ocean surfaces
7563 - 1 - Page 1
6) Which graph best represents therelationship between water droplet sizeand the chance of precipitation?
A)
B)
C)
D)
7) At which temperature could watervapor in the atmosphere change directlyinto solid ice crystals?A) 20DFB) 40DF
C) 100DCD) 10DC
8) When the dry-bulb temperature is22DC and the wet-bulb temperature is13DC, the relative humidity isA) 59%B) 10%
C) 41%D) 33%
9) Which weather station model indicatesthe greatest probability ofprecipitation?
A)
B)
C)
D)
10) According to the Earth ScienceReference Tables, an atmosphericpressure of 978 millibars is equal toA) 28.88 inches of mercuryB) 29.00 inches of mercuryC) 28.92 inches of mercuryD) 28.76 inches of mercury
11) In which direction do surface windsaround low-pressure centers in theNorthern Hemisphere generally move?A) clockwise, toward the center of the
lowB) counterclockwise, away from the
center of the lowC) counterclockwise, toward the
center of the lowD) clockwise, away from the center of
the low12) A temperature of 80D Fahrenheit would
be approximately equal to how manydegrees on the Celsius scale?A) 34B) 299
C) 178D) 27
7563 - 1 - Page 2
13) Which change would result in anincrease in the rate at which waterevaporates from an outdoor swimmingpool?A) The surface of the water is covered
with white plastic.B) Water is added to the pool each
day.C) Cloud cover decreases.D) Wind velocity decreases.
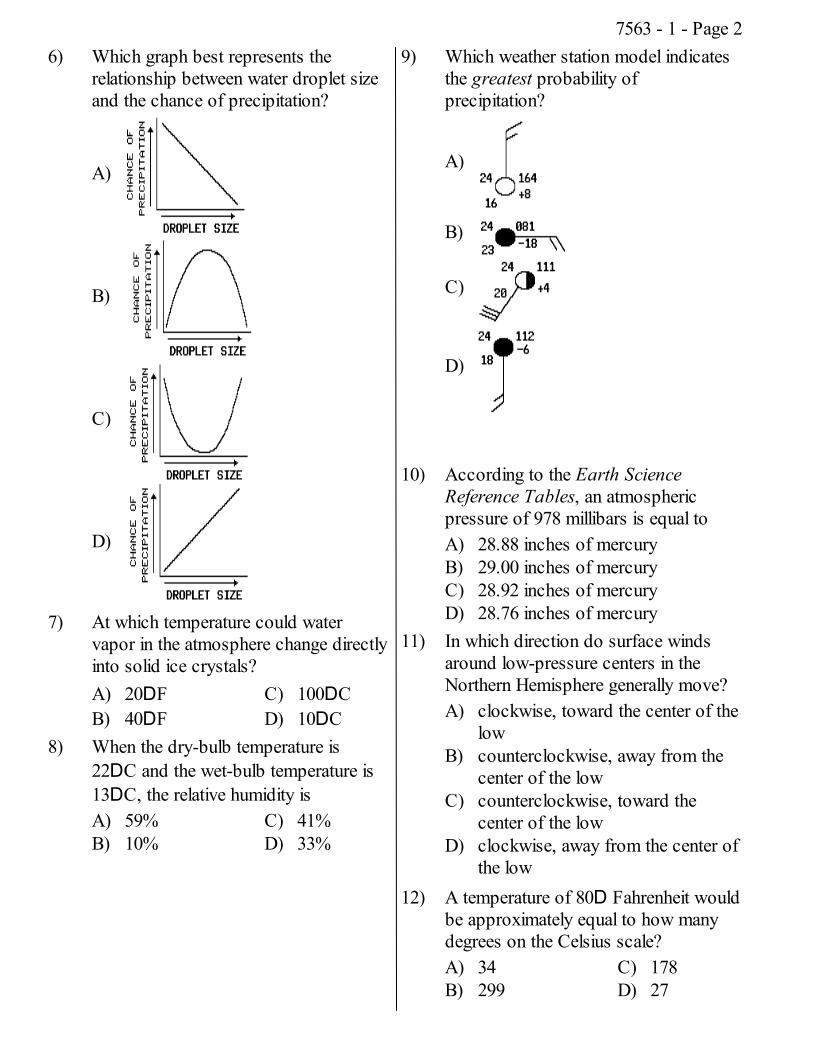
14) The graph below represents how therate of evaporation of water is affectedby a variable, X. Which variable is mostlikely represented by X?
A) moisture content of the airB) exposed surface areaC) temperatureD) wind velocity
15) Most of the Earth's surface oceancurrents are caused byA) differences in ocean water densityB) the revolution of the EarthC) stream flow from continentsD) the prevailing winds
16) What is the approximate dewpointtemperature if the dry-bulb temperatureis 20DC and the wet-bulb temperatureis 13DC? [Refer to the Earth ScienceReference Tables.]A) 12DCB) 7DC
C) -25DCD) 8DC
17) As a sample of very moist air risesfrom sea level to a higher altitude, theprobability of condensation occurringin that air sample willA) decreaseB) increaseC) remain the same
18) When a strong wind is blowing fromone location to another, the twolocations most likely have a differenceinA) elevationB) air pressureC) dewpoint temperatureD) cloud cover
19) Identify by name the surface oceancurrent that cools the climate oflocations on the western coastline ofNorth America.
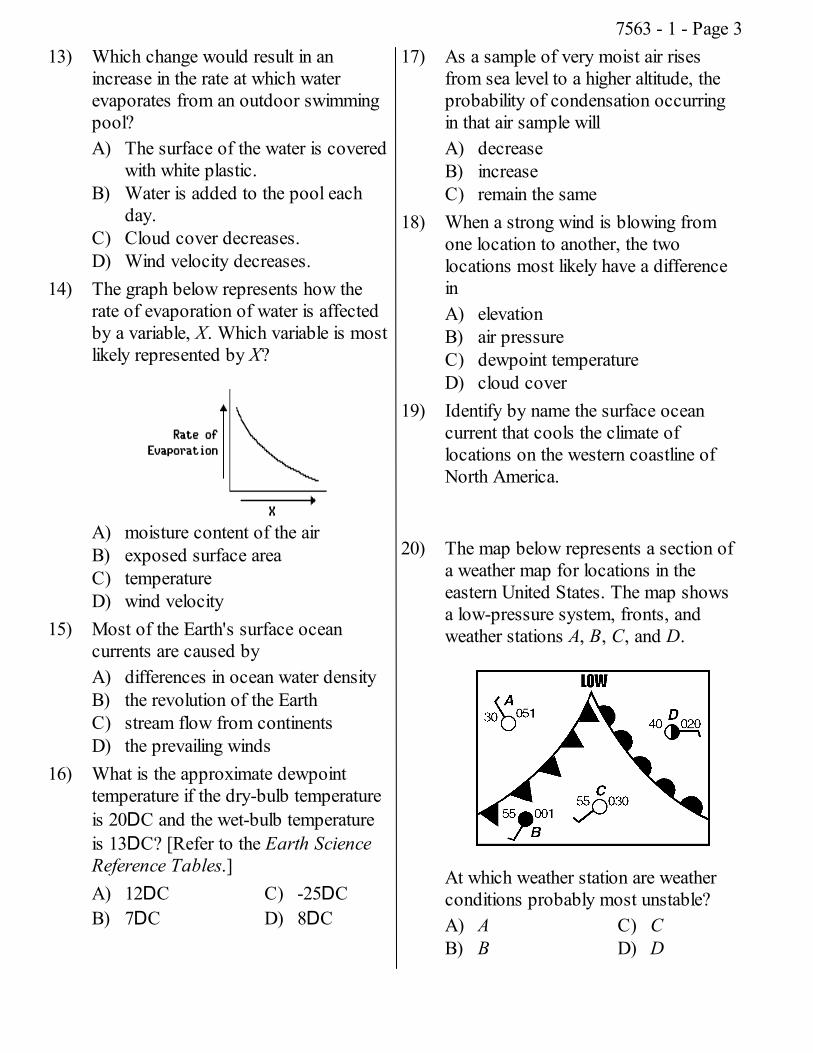
20) The map below represents a section ofa weather map for locations in theeastern United States. The map showsa low-pressure system, fronts, andweather stations A, B, C, and D.
At which weather station are weatherconditions probably most unstable?A) AB) B
C) CD) D
7563 - 1 - Page 3
21) A temperature of 104D Fahrenheit isequal to a temperature ofA) 72DCB) 104DC
C) 136DCD) 40DC
22) A cold front is moving eastward acrossNew York State at an average speed of50 kilometers per hour. According tothe Earth Science Reference Tables,approximately how long will the fronttake to move from Buffalo to Albany?A) 3 hoursB) 5 hours
C) 8 hoursD) 10 hours
23) An Earth science student observed thefollowing weather conditions in Albany,New York, for 2 days: The first daywas warm and humid with southerlywinds. The second day, thetemperature was 15 degrees cooler, therelative humidity had decreased, andwind direction was northwest. Whichtype of air mass most likely had movedinto the area on the second day?A) maritime polarB) continental polarC) continental tropicalD) maritime tropical
24) In which general direction do low-pressure centers usually travel acrossNew York State?A) west to eastB) southeast to northwestC) north to southD) northeast to southwest
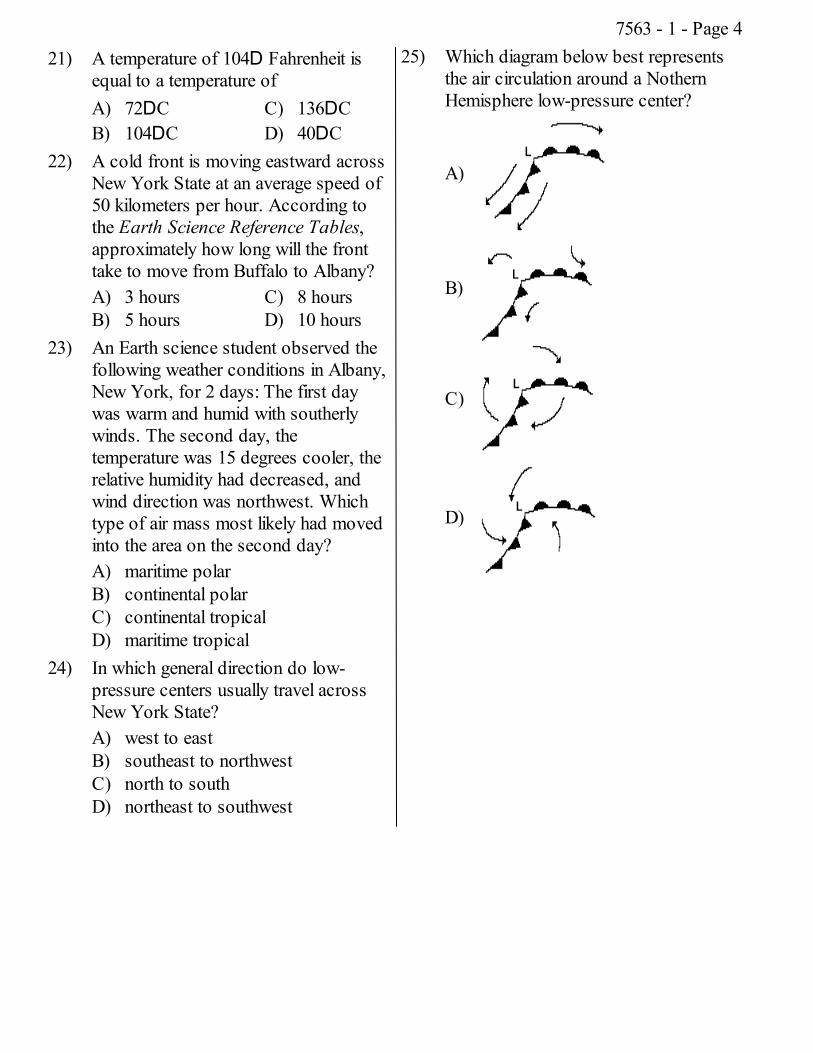
25) Which diagram below best representsthe air circulation around a NothernHemisphere low-pressure center?
A)
B)
C)
D)
7563 - 1 - Page 4
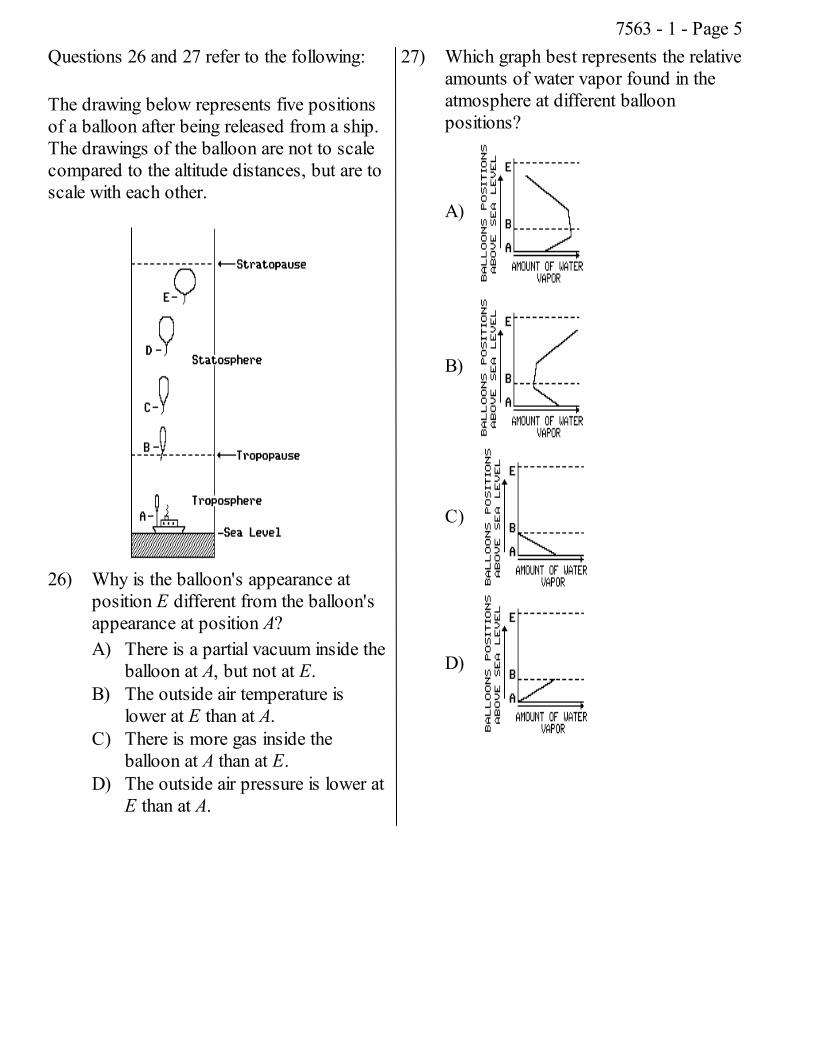
Questions 26 and 27 refer to the following:
The drawing below represents five positionsof a balloon after being released from a ship.The drawings of the balloon are not to scalecompared to the altitude distances, but are toscale with each other.
26) Why is the balloon's appearance atposition E different from the balloon'sappearance at position A?A) There is a partial vacuum inside the
balloon at A, but not at E.B) The outside air temperature is
lower at E than at A.C) There is more gas inside the
balloon at A than at E.D) The outside air pressure is lower at
E than at A.
27) Which graph best represents the relativeamounts of water vapor found in theatmosphere at different balloonpositions?
A)
B)
C)
D)
7563 - 1 - Page 5
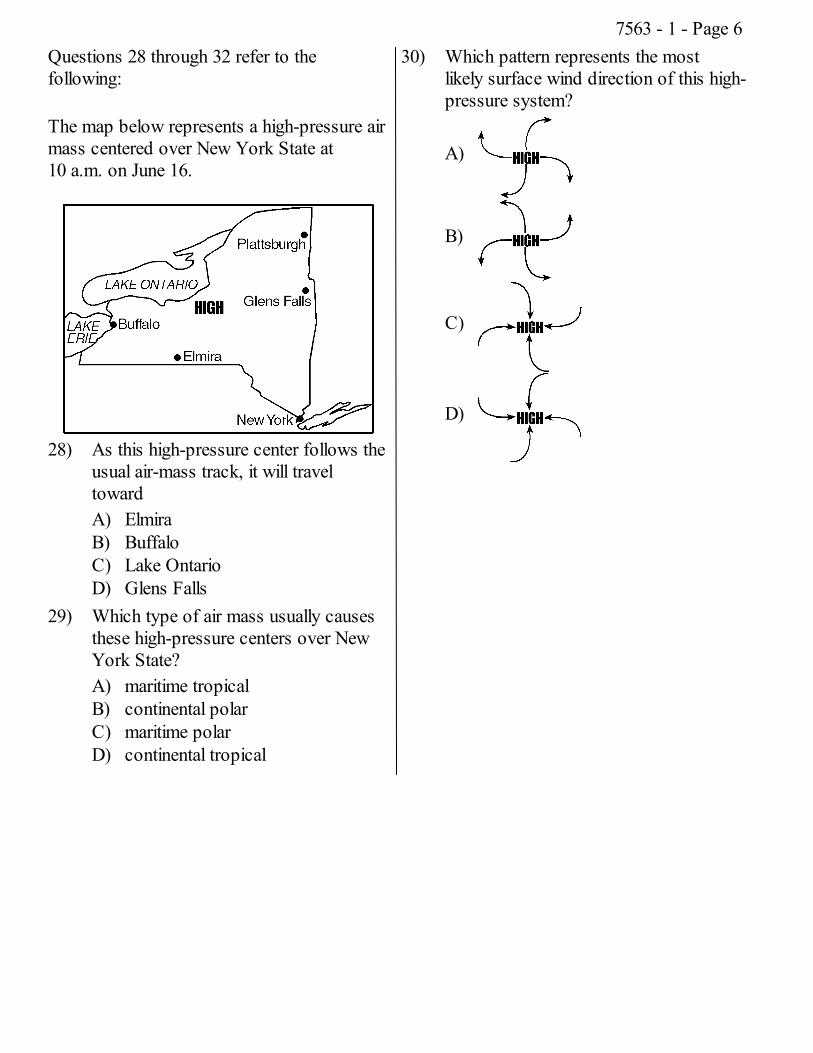
Questions 28 through 32 refer to thefollowing:
The map below represents a high-pressure airmass centered over New York State at10 a.m. on June 16.
28) As this high-pressure center follows theusual air-mass track, it will traveltowardA) ElmiraB) BuffaloC) Lake OntarioD) Glens Falls
29) Which type of air mass usually causesthese high-pressure centers over NewYork State?A) maritime tropicalB) continental polarC) maritime polarD) continental tropical
30) Which pattern represents the mostlikely surface wind direction of this high-pressure system?
A)
B)
C)
D)
7563 - 1 - Page 6
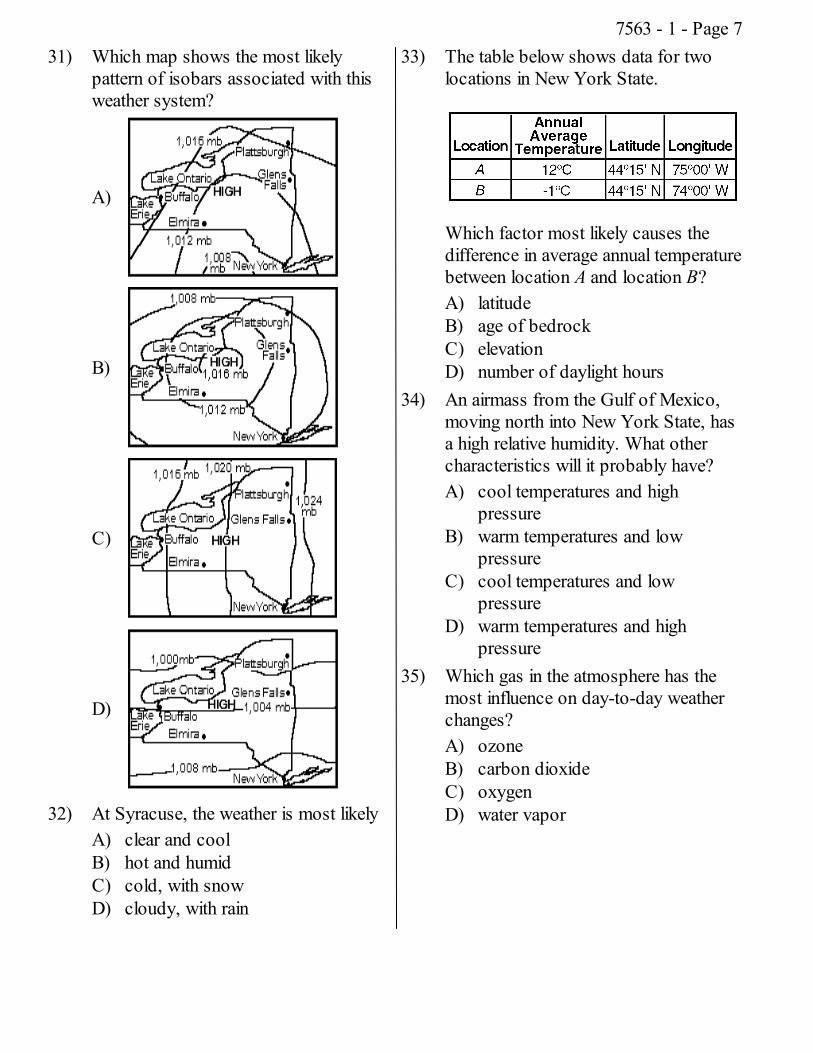
31) Which map shows the most likelypattern of isobars associated with thisweather system?
A)
B)
C)
D)
32) At Syracuse, the weather is most likelyA) clear and coolB) hot and humidC) cold, with snowD) cloudy, with rain
33) The table below shows data for twolocations in New York State.
Which factor most likely causes thedifference in average annual temperaturebetween location A and location B?A) latitudeB) age of bedrockC) elevationD) number of daylight hours
34) An airmass from the Gulf of Mexico,moving north into New York State, hasa high relative humidity. What othercharacteristics will it probably have?A) cool temperatures and high
pressureB) warm temperatures and low
pressureC) cool temperatures and low
pressureD) warm temperatures and high
pressure35) Which gas in the atmosphere has the
most influence on day-to-day weatherchanges?A) ozoneB) carbon dioxideC) oxygenD) water vapor
7563 - 1 - Page 7
36) Which weather station model shows thehighest relative humidity?
A)
B)
C)
D)
37) According to the Earth ScienceReference Tables, an air pressure of29.65 inches of mercury is equal toA) 1004.0 mbB) 999.0 mbC) 984.0 mbD) 1001.0 mb
38) Which condition would cause surfacerunoff to increase in a particularlocation?A) planting grasses and shrubs on a
hillsideB) covering a dirt road with pavementC) having a decrease in the annual
rainfallD) reducing the gradient of a steep hill
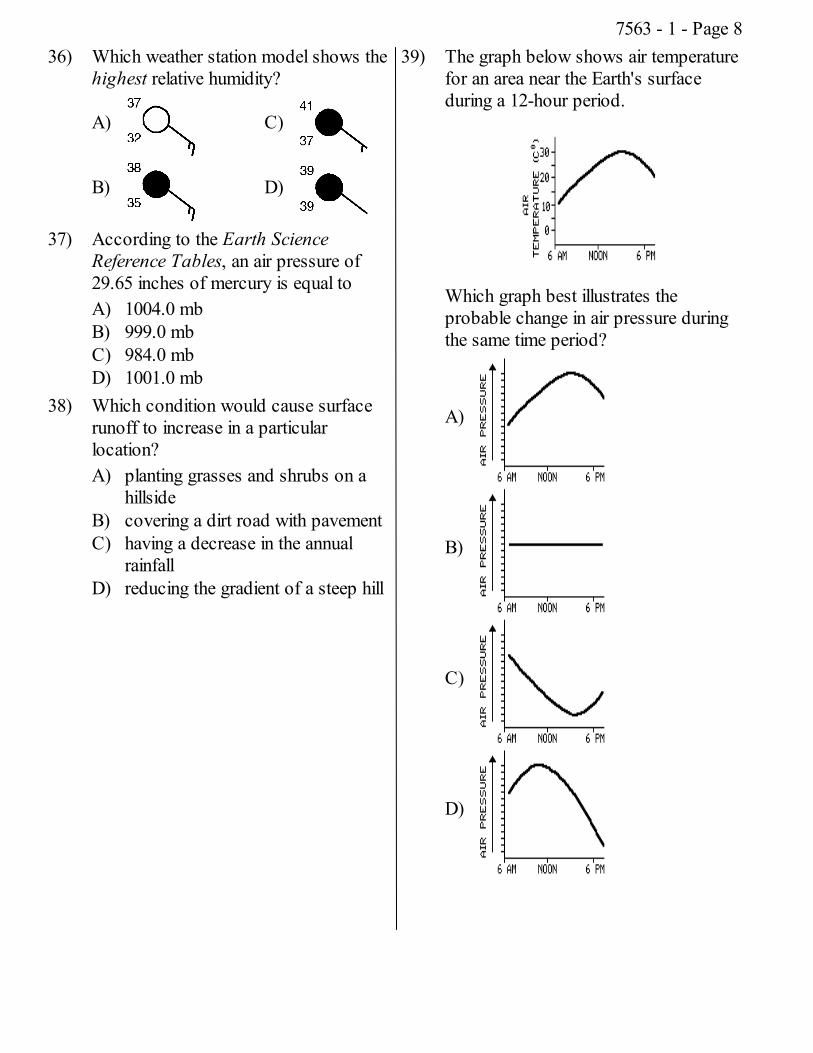
39) The graph below shows air temperaturefor an area near the Earth's surfaceduring a 12-hour period.
Which graph best illustrates theprobable change in air pressure duringthe same time period?
A)
B)
C)
D)
7563 - 1 - Page 8
40) As a stationary airmass is heated, itsdensity will generallyA) increaseB) remain the sameC) decrease
41) Most of Earth's surface ocean currentpatterns are primarily caused byA) prevailing windsB) the force of gravityC) river currentsD) the impact of precipitation
42) Water vapor enters the atmosphere bythe processes of evaporation andA) transpirationB) precipitationC) condensationD) conduction
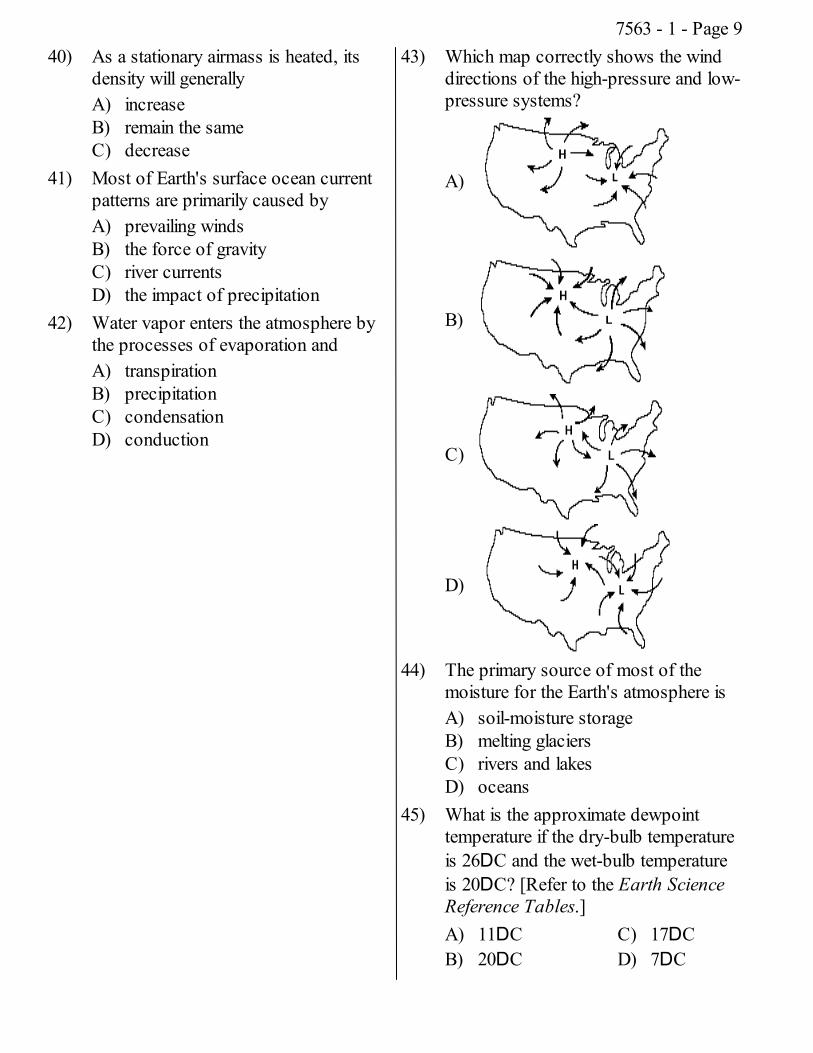
43) Which map correctly shows the winddirections of the high-pressure and low-pressure systems?
A)
B)
C)
D)
44) The primary source of most of themoisture for the Earth's atmosphere isA) soil-moisture storageB) melting glaciersC) rivers and lakesD) oceans
45) What is the approximate dewpointtemperature if the dry-bulb temperatureis 26DC and the wet-bulb temperatureis 20DC? [Refer to the Earth ScienceReference Tables.]A) 11DCB) 20DC
C) 17DCD) 7DC
7563 - 1 - Page 9
46) At which location will a low-pressurestorm center most likely form?A) near the middle of a cold airmassB) over a very dry, large, flat land areaC) on the leeward side of mountainsD) along a frontal surface between
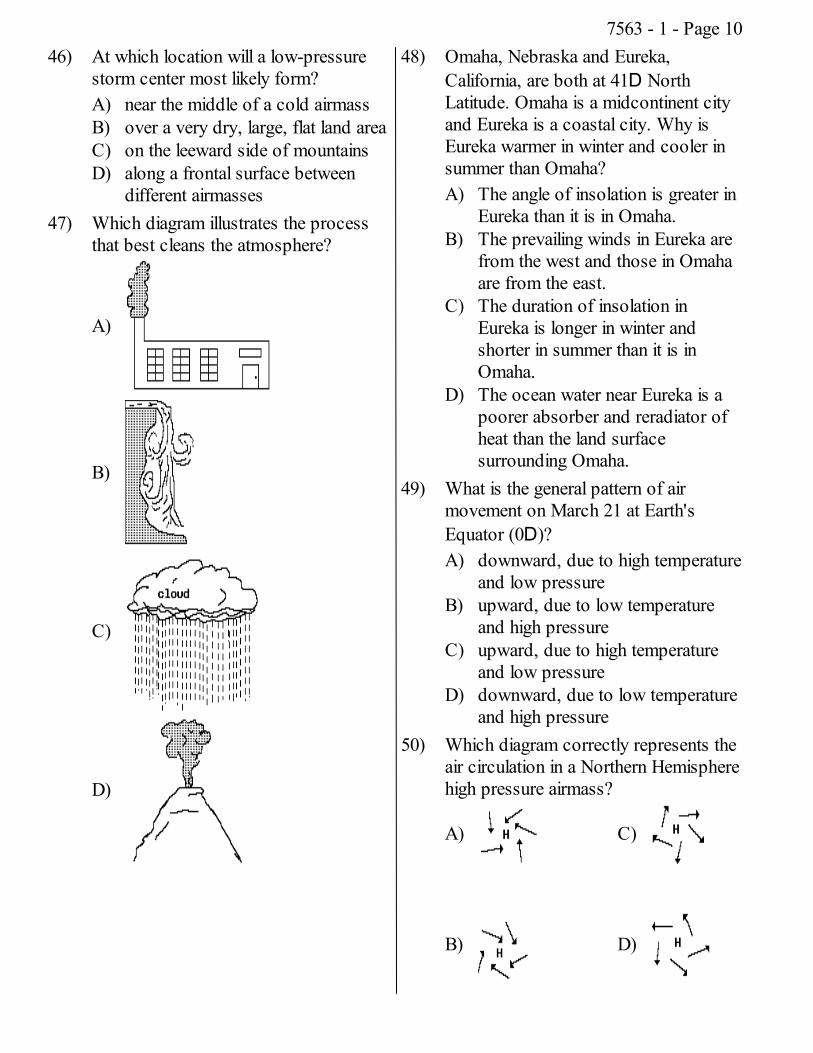
different airmasses47) Which diagram illustrates the process
that best cleans the atmosphere?
A)
B)
C)
D)
48) Omaha, Nebraska and Eureka,California, are both at 41D NorthLatitude. Omaha is a midcontinent cityand Eureka is a coastal city. Why isEureka warmer in winter and cooler insummer than Omaha?A) The angle of insolation is greater in
Eureka than it is in Omaha.B) The prevailing winds in Eureka are
from the west and those in Omahaare from the east.
C) The duration of insolation inEureka is longer in winter andshorter in summer than it is inOmaha.
D) The ocean water near Eureka is apoorer absorber and reradiator ofheat than the land surfacesurrounding Omaha.
49) What is the general pattern of airmovement on March 21 at Earth'sEquator (0D)?A) downward, due to high temperature
and low pressureB) upward, due to low temperature
and high pressureC) upward, due to high temperature
and low pressureD) downward, due to low temperature
and high pressure50) Which diagram correctly represents the
air circulation in a Northern Hemispherehigh pressure airmass?
A)
B)
C)
D)
7563 - 1 - Page 10
51) What is the best explanation for the twostatements below?
d Some mountains located near theEarth's Equator have snow-coveredpeaks.d Icecaps exist at the Earth's poles.
A) High elevation and high latitudehave a similar effect on climate.
B) Mountain and polar regions receivemore energy from the Sun thanother regions do.
C) Both mountain and polar regionshave arid climates.
D) An increase in snowfall and anincrease in temperature have asimilar effect on climate.
52) What is the approximate dewpointtemperature when the dry-bulbtemperature is 2DC and the wet-bulbtemperature is 0DC?A) -6DCB) -2DC
C) -1DCD) -3DC
53) A mT airmass would most likelyoriginate over which type of Earthsurface?A) warm and moistB) warm and dryC) cold and moistD) cold and dry
54) How does air circulate within a cyclone(low pressure area) in the NorthernHemisphere?A) counterclockwise and toward the
center of the cycloneB) clockwise and toward the center of
the cycloneC) clockwise and away from the
center of the cycloneD) counterclockwise and away from
the center of the cyclone
55) In the Northern Hemisphere, what is thedirection of surface wind circulation ina low-pressure system?A) counterclockwise and toward the
centerB) counterclockwise and outward
from the centerC) clockwise and outward from the
centerD) clockwise and toward the center
56) Which location in New York State ismost likely to have the smallest annualtemperature range?A) Old ForgeB) the Mohawk River ValleyC) ElmiraD) Long Island's south shore
57) What is the approximate dewpointtemperature if the dry-bulb temperatureis 26DC and the wet-bulb temperatureis 21DC? [Refer to the Earth ScienceReference Tables.]A) 18DCB) 23DC
C) 12DCD) 5DC
7563 - 1 - Page 11
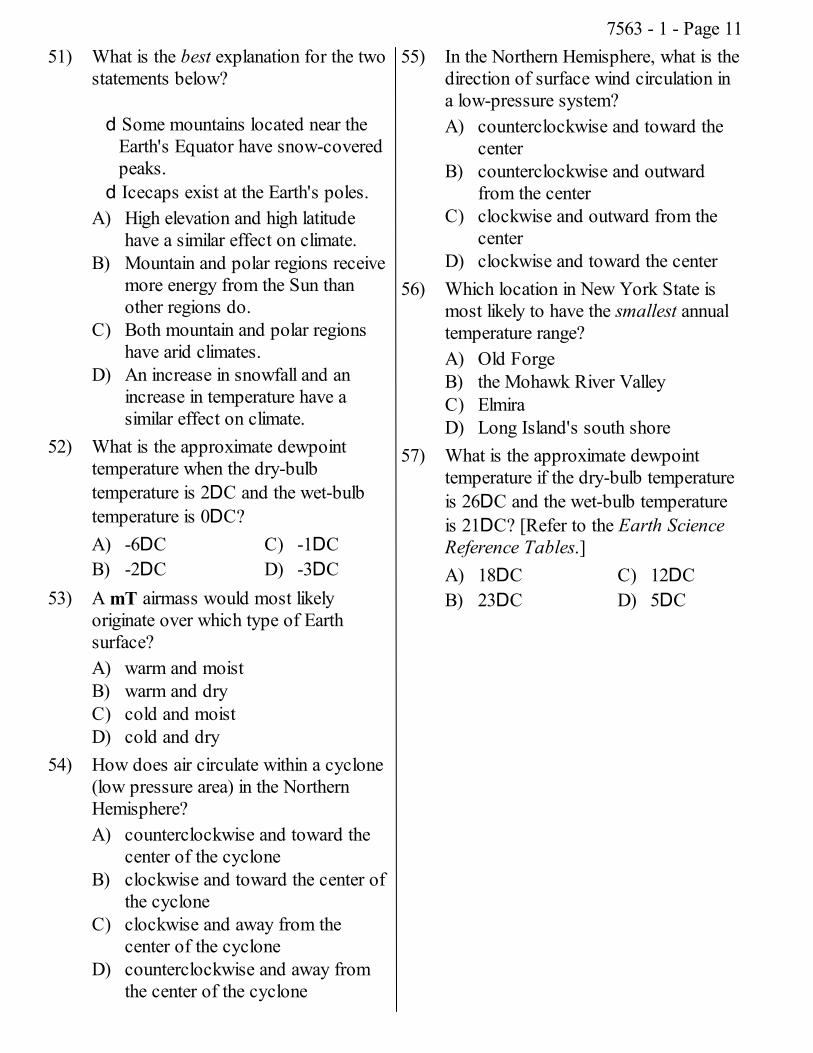
58) The weather map below shows a coldfront approaching three cities. The twoisobars are labeled A and B.
Which weather events will probablyoccur in Millsville as the cold frontpasses?A) an increase in clouds; a brief
thunderstorm; a shift in winddirection
B) an increase in clouds; noprecipitation; no shift in winddirection
C) a decrease in clouds; prolongedprecipitation; a shift in winddirection
D) a decrease in clouds; noprecipitation; no shift in winddirection
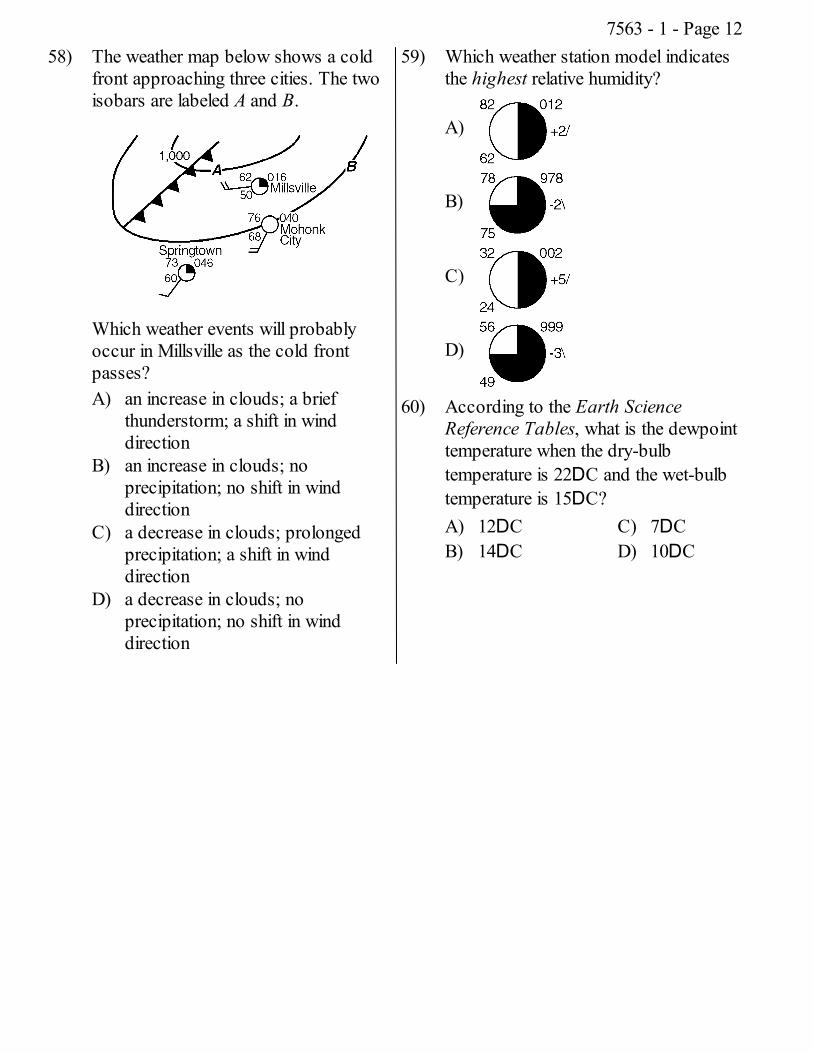
59) Which weather station model indicatesthe highest relative humidity?
A)
B)
C)
D)
60) According to the Earth ScienceReference Tables, what is the dewpointtemperature when the dry-bulbtemperature is 22DC and the wet-bulbtemperature is 15DC?A) 12DCB) 14DC
C) 7DCD) 10DC
7563 - 1 - Page 12
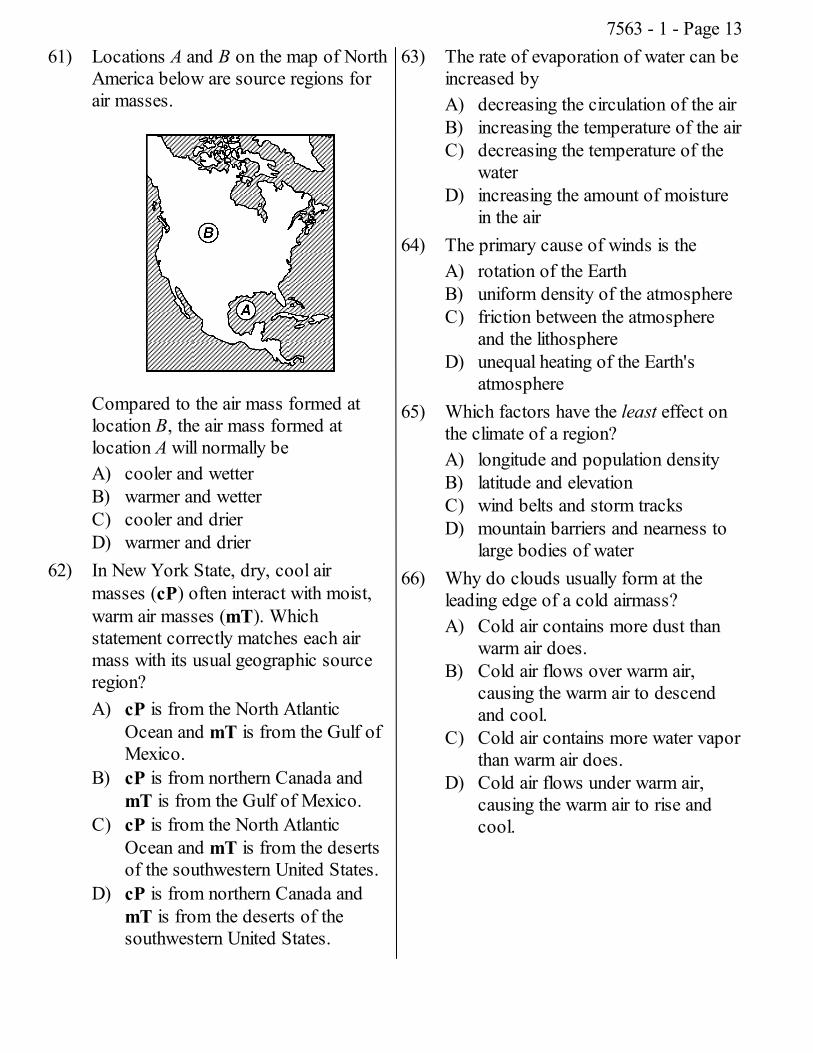
61) Locations A and B on the map of NorthAmerica below are source regions forair masses.
Compared to the air mass formed atlocation B, the air mass formed atlocation A will normally beA) cooler and wetterB) warmer and wetterC) cooler and drierD) warmer and drier
62) In New York State, dry, cool airmasses (cP) often interact with moist,warm air masses (mT). Whichstatement correctly matches each airmass with its usual geographic sourceregion?A) cP is from the North Atlantic
Ocean and mT is from the Gulf ofMexico.
B) cP is from northern Canada andmT is from the Gulf of Mexico.
C) cP is from the North AtlanticOcean and mT is from the desertsof the southwestern United States.
D) cP is from northern Canada andmT is from the deserts of thesouthwestern United States.
63) The rate of evaporation of water can beincreased byA) decreasing the circulation of the airB) increasing the temperature of the airC) decreasing the temperature of the
waterD) increasing the amount of moisture
in the air64) The primary cause of winds is the
A) rotation of the EarthB) uniform density of the atmosphereC) friction between the atmosphere
and the lithosphereD) unequal heating of the Earth's
atmosphere65) Which factors have the least effect on
the climate of a region?A) longitude and population densityB) latitude and elevationC) wind belts and storm tracksD) mountain barriers and nearness to
large bodies of water66) Why do clouds usually form at the
leading edge of a cold airmass?A) Cold air contains more dust than
warm air does.B) Cold air flows over warm air,
causing the warm air to descendand cool.
C) Cold air contains more water vaporthan warm air does.
D) Cold air flows under warm air,causing the warm air to rise andcool.
7563 - 1 - Page 13
67) A weather station records a barometricpressure of 1013.2 millibars. Whichdiagram below would best representthis weather station on a weather map?
A)
B)
C)
D)
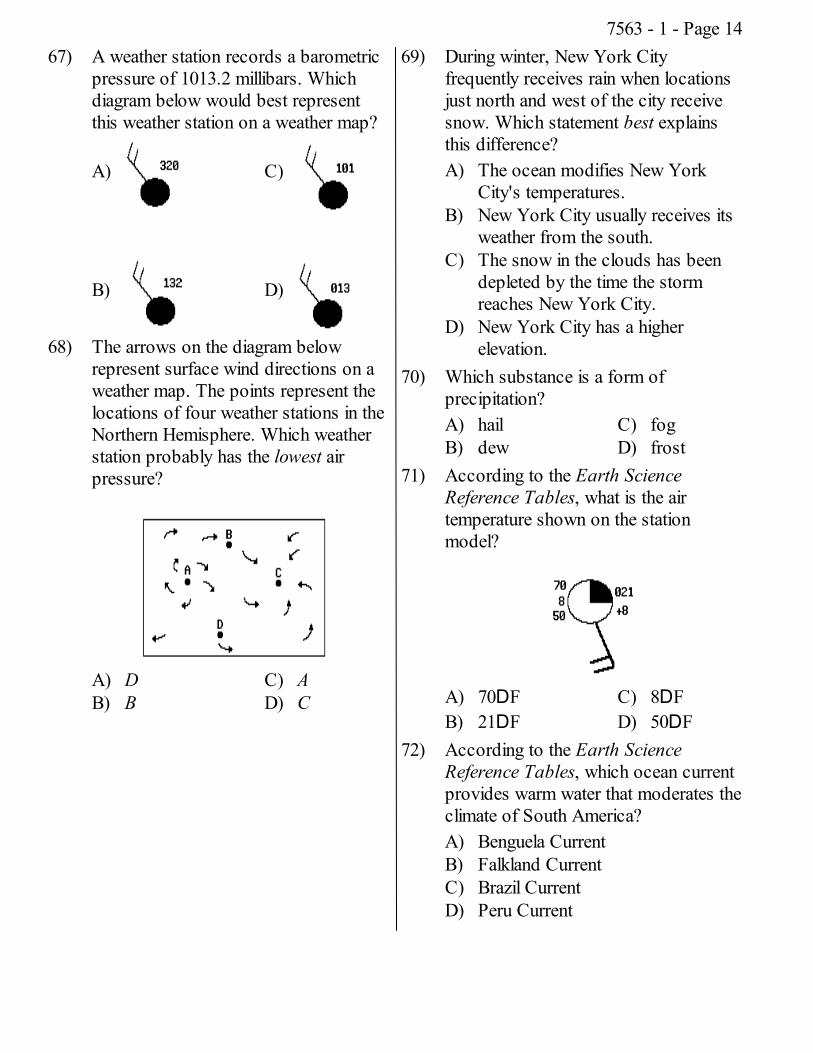
68) The arrows on the diagram belowrepresent surface wind directions on aweather map. The points represent thelocations of four weather stations in theNorthern Hemisphere. Which weatherstation probably has the lowest airpressure?
A) DB) B
C) AD) C
69) During winter, New York Cityfrequently receives rain when locationsjust north and west of the city receivesnow. Which statement best explainsthis difference?A) The ocean modifies New York
City's temperatures.B) New York City usually receives its
weather from the south.C) The snow in the clouds has been
depleted by the time the stormreaches New York City.
D) New York City has a higherelevation.
70) Which substance is a form ofprecipitation?A) hailB) dew
C) fogD) frost
71) According to the Earth ScienceReference Tables, what is the airtemperature shown on the stationmodel?
A) 70DFB) 21DF
C) 8DFD) 50DF
72) According to the Earth ScienceReference Tables, which ocean currentprovides warm water that moderates theclimate of South America?A) Benguela CurrentB) Falkland CurrentC) Brazil CurrentD) Peru Current
7563 - 1 - Page 14
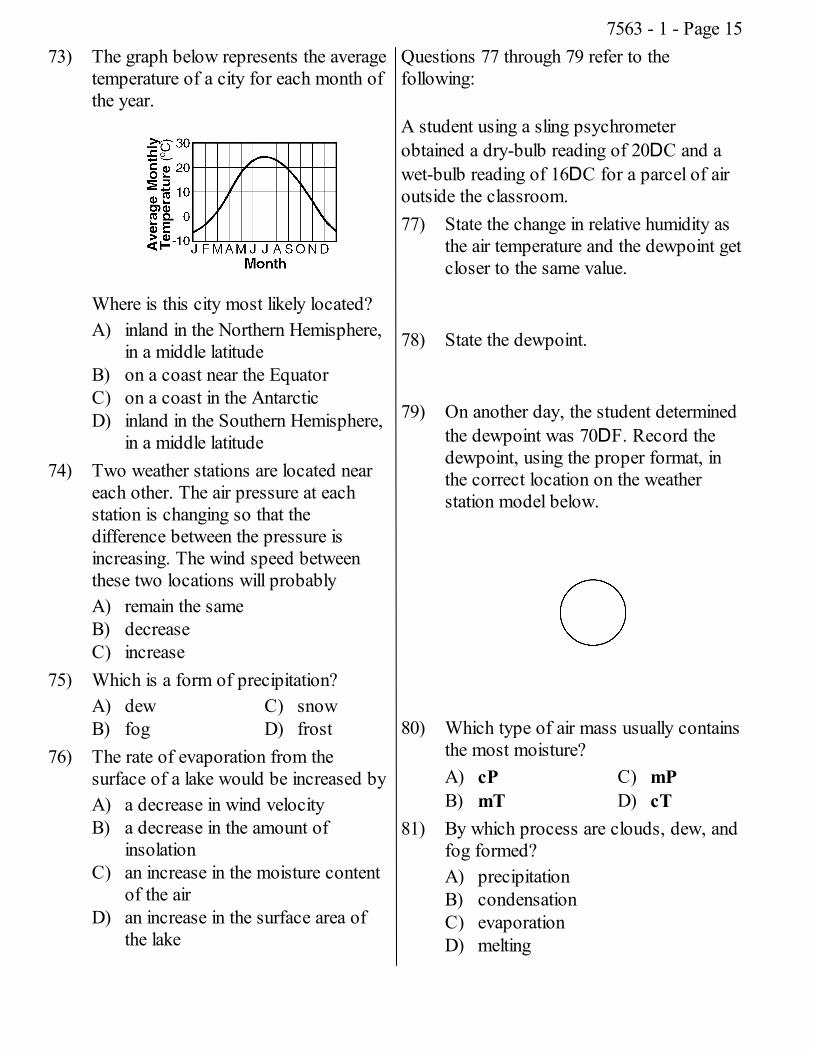
73) The graph below represents the averagetemperature of a city for each month ofthe year.
Where is this city most likely located?A) inland in the Northern Hemisphere,
in a middle latitudeB) on a coast near the EquatorC) on a coast in the AntarcticD) inland in the Southern Hemisphere,
in a middle latitude74) Two weather stations are located near
each other. The air pressure at eachstation is changing so that thedifference between the pressure isincreasing. The wind speed betweenthese two locations will probablyA) remain the sameB) decreaseC) increase
75) Which is a form of precipitation?A) dewB) fog
C) snowD) frost
76) The rate of evaporation from thesurface of a lake would be increased byA) a decrease in wind velocityB) a decrease in the amount of
insolationC) an increase in the moisture content
of the airD) an increase in the surface area of
the lake
Questions 77 through 79 refer to thefollowing:
A student using a sling psychrometerobtained a dry-bulb reading of 20DC and awet-bulb reading of 16DC for a parcel of airoutside the classroom.77) State the change in relative humidity as
the air temperature and the dewpoint getcloser to the same value.
78) State the dewpoint.
79) On another day, the student determinedthe dewpoint was 70DF. Record thedewpoint, using the proper format, inthe correct location on the weatherstation model below.
80) Which type of air mass usually containsthe most moisture?A) cPB) mT
C) mPD) cT
81) By which process are clouds, dew, andfog formed?A) precipitationB) condensationC) evaporationD) melting
7563 - 1 - Page 15
82) A student used a sling psychrometer tomeasure the humidity of the air. If therelative humidity was 65% and the dry-bulb temperature was 10DC, what wasthe wet-bulb temperature?A) 3DCB) 5DC
C) 7DCD) 10DC
83) What is the approximate dewpointtemperature if the dry-bulb temperatureis 13DC and the wet-bulb temperatureis 10DC? [Refer to the Earth ScienceReference Tables.]A) -25DCB) 3DC
C) 7DCD) 10DC
84) During a heavy rainfall, runoff will begreatest on a soil that has an infiltration(permeability) rate ofA) 0.1 cm/secB) 0.3 cm/secC) 1.2 cm/secD) 0.2 cm/sec
85) According to the Earth ScienceReference Tables, at which of theselatitudes would average annualprecipitation be greatest?A) 90D SB) 90D N
C) 0DD) 30D N
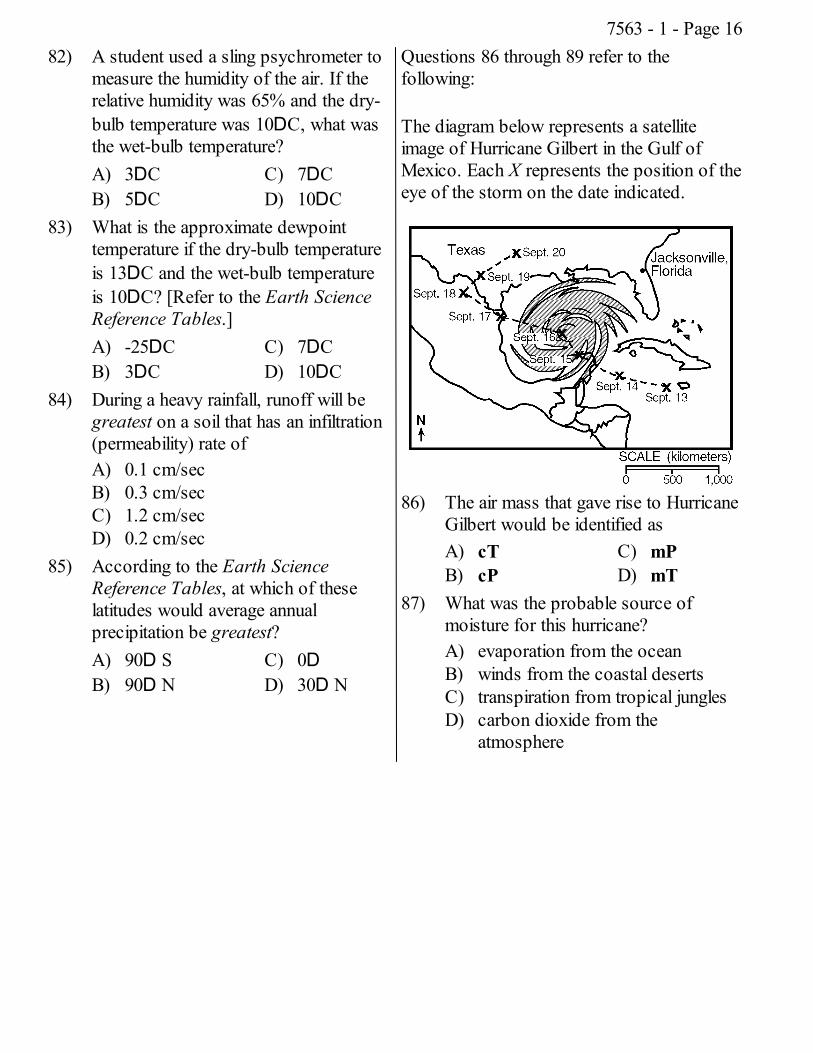
Questions 86 through 89 refer to thefollowing:
The diagram below represents a satelliteimage of Hurricane Gilbert in the Gulf ofMexico. Each X represents the position of theeye of the storm on the date indicated.
86) The air mass that gave rise to HurricaneGilbert would be identified asA) cTB) cP
C) mPD) mT
87) What was the probable source ofmoisture for this hurricane?A) evaporation from the oceanB) winds from the coastal desertsC) transpiration from tropical junglesD) carbon dioxide from the
atmosphere
7563 - 1 - Page 16
88) On September 18, Hurricane Gilbertchanged direction. Which statementprovides the most probable reason forthis change?A) The amount of precipitation
released by the storm changedsuddenly.
B) The air mass was cooled by theland surface.
C) The amount of insolation receivedby the air mass decreased.
D) The storm entered the prevailingwesterlies wind belt.
89) The surface wind pattern associatedwith Hurricane Gilbert wasA) clockwise and toward the centerB) counterclockwise and toward the
centerC) counterclockwise and away from
the centerD) clockwise and away from the
center
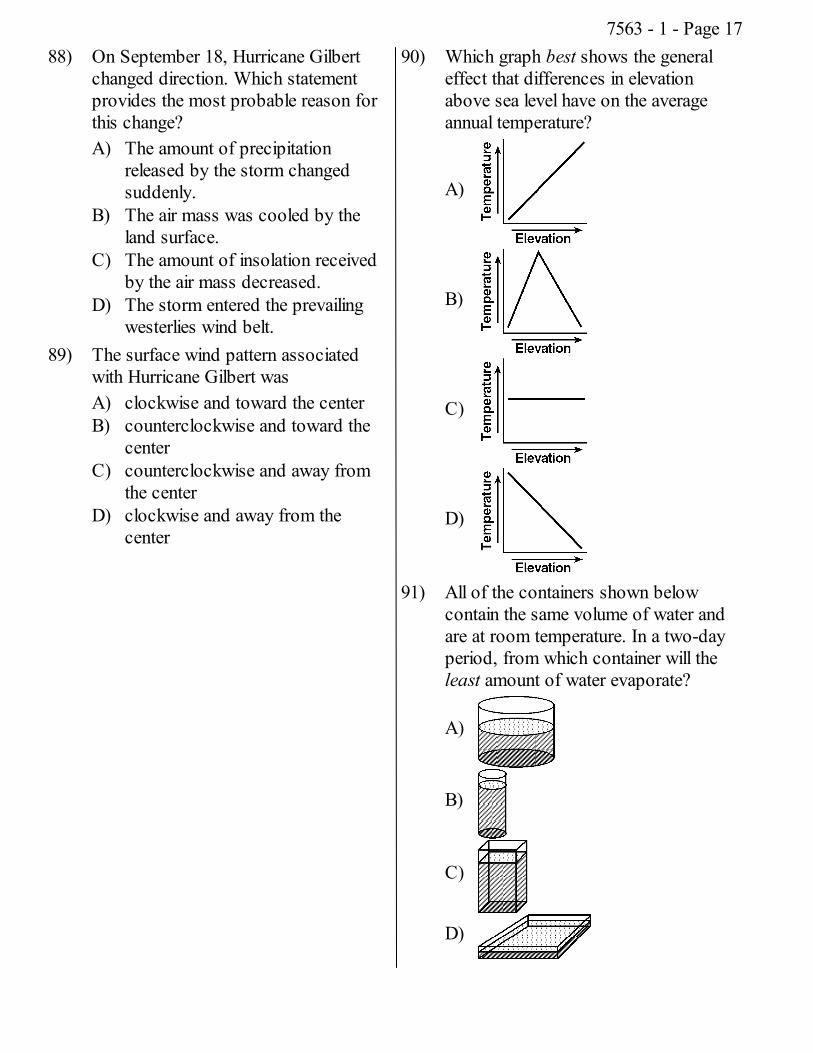
90) Which graph best shows the generaleffect that differences in elevationabove sea level have on the averageannual temperature?
A)
B)
C)
D)
91) All of the containers shown belowcontain the same volume of water andare at room temperature. In a two-dayperiod, from which container will theleast amount of water evaporate?
A)
B)
C)
D)
7563 - 1 - Page 17
92) An air pressure of 1,005 millibars isequivalent to approximately how manyinches of mercury?A) 29.62B) 29.68
C) 29.58D) 29.72
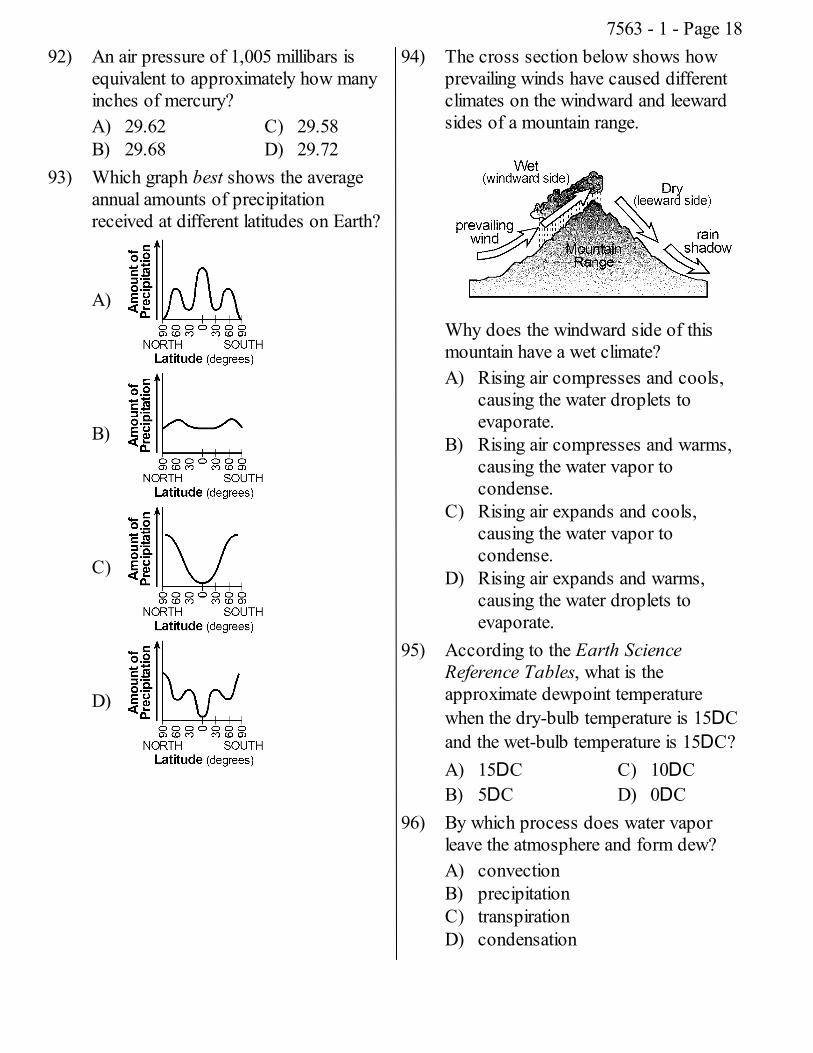
93) Which graph best shows the averageannual amounts of precipitationreceived at different latitudes on Earth?
A)
B)
C)
D)
94) The cross section below shows howprevailing winds have caused differentclimates on the windward and leewardsides of a mountain range.
Why does the windward side of thismountain have a wet climate?A) Rising air compresses and cools,
causing the water droplets toevaporate.
B) Rising air compresses and warms,causing the water vapor tocondense.
C) Rising air expands and cools,causing the water vapor tocondense.
D) Rising air expands and warms,causing the water droplets toevaporate.
95) According to the Earth ScienceReference Tables, what is theapproximate dewpoint temperaturewhen the dry-bulb temperature is 15DCand the wet-bulb temperature is 15DC?A) 15DCB) 5DC
C) 10DCD) 0DC
96) By which process does water vaporleave the atmosphere and form dew?A) convectionB) precipitationC) transpirationD) condensation
7563 - 1 - Page 18
97) According to the Earth ScienceReference Tables, what is the dewpointtemperature when the dry-bulbtemperature is 12DC and the wet-bulbtemperature is 7DC?A) -5DCB) 1DC
C) -2DCD) 4DC
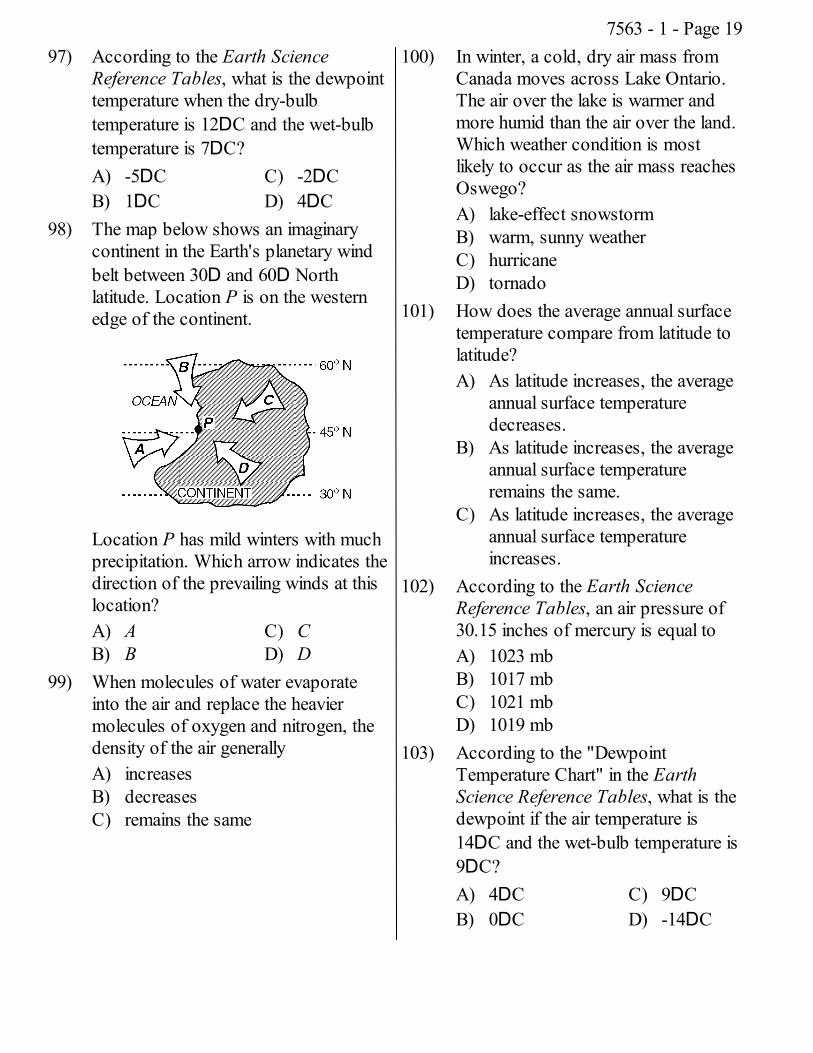
98) The map below shows an imaginarycontinent in the Earth's planetary windbelt between 30D and 60D Northlatitude. Location P is on the westernedge of the continent.
Location P has mild winters with muchprecipitation. Which arrow indicates thedirection of the prevailing winds at thislocation?A) AB) B
C) CD) D
99) When molecules of water evaporateinto the air and replace the heaviermolecules of oxygen and nitrogen, thedensity of the air generallyA) increasesB) decreasesC) remains the same
100) In winter, a cold, dry air mass fromCanada moves across Lake Ontario.The air over the lake is warmer andmore humid than the air over the land.Which weather condition is mostlikely to occur as the air mass reachesOswego?A) lake-effect snowstormB) warm, sunny weatherC) hurricaneD) tornado
101) How does the average annual surfacetemperature compare from latitude tolatitude?A) As latitude increases, the average
annual surface temperaturedecreases.
B) As latitude increases, the averageannual surface temperatureremains the same.
C) As latitude increases, the averageannual surface temperatureincreases.
102) According to the Earth ScienceReference Tables, an air pressure of30.15 inches of mercury is equal toA) 1023 mbB) 1017 mbC) 1021 mbD) 1019 mb
103) According to the "DewpointTemperature Chart" in the EarthScience Reference Tables, what is thedewpoint if the air temperature is14DC and the wet-bulb temperature is9DC?A) 4DCB) 0DC
C) 9DCD) -14DC
7563 - 1 - Page 19
104) A weather station records thefollowing data:
Air pressure is 1,001.0 millibars.Wind is from the south.Wind speed is 25 knots.
Using the proper weather mapsymbols, place this information in thecorrect locations on the weatherstation model provided below.
105) When the height of the mercury in abarometer is 29.92 inches, thebarometric pressure isA) 1,005.5 mbB) 1,000.0 mbC) 1,020.4 mbD) 1,013.2 mb
106) What is the approximate dewpointtemperature if the dry-bulbtemperature is 26DC and the wet-bulbtemperature is 21DC? [Refer to theEarth Science Reference Tables.]A) 9DCB) 18DC
C) 5DCD) 12DC
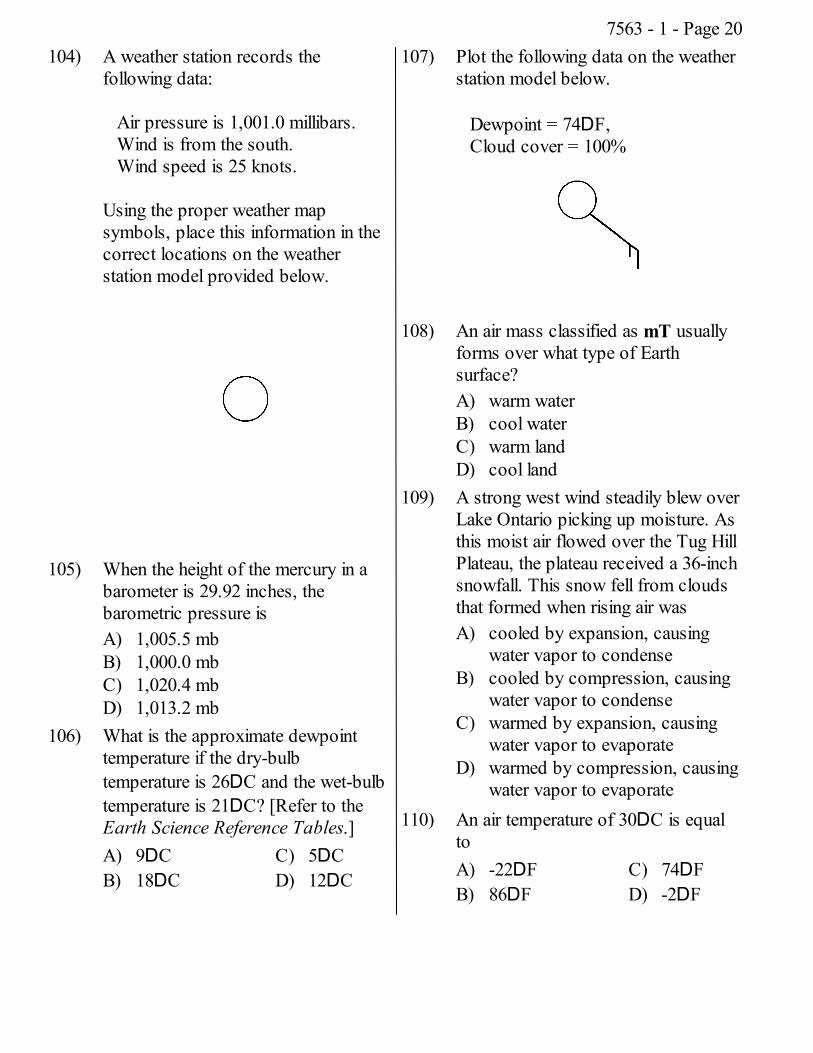
107) Plot the following data on the weatherstation model below.
Dewpoint = 74DF,Cloud cover = 100%
108) An air mass classified as mT usuallyforms over what type of Earthsurface?A) warm waterB) cool waterC) warm landD) cool land
109) A strong west wind steadily blew overLake Ontario picking up moisture. Asthis moist air flowed over the Tug HillPlateau, the plateau received a 36-inchsnowfall. This snow fell from cloudsthat formed when rising air wasA) cooled by expansion, causing
water vapor to condenseB) cooled by compression, causing
water vapor to condenseC) warmed by expansion, causing
water vapor to evaporateD) warmed by compression, causing
water vapor to evaporate110) An air temperature of 30DC is equal
toA) -22DFB) 86DF
C) 74DFD) -2DF
7563 - 1 - Page 20
111) According to the Earth ScienceReference Tables, a barometricpressure reading of 28.97 inches isequal toA) 1,006 mbB) 984 mbC) 981 mbD) 1,008 mb
112) Compared to a maritime tropicalairmass, a maritime polar airmass hasA) higher temperature and less water
vaporB) lower temperature and less water
vaporC) lower temperature and more water
vaporD) higher temperature and more
water vaporQuestions 113 and 114 refer to the following:
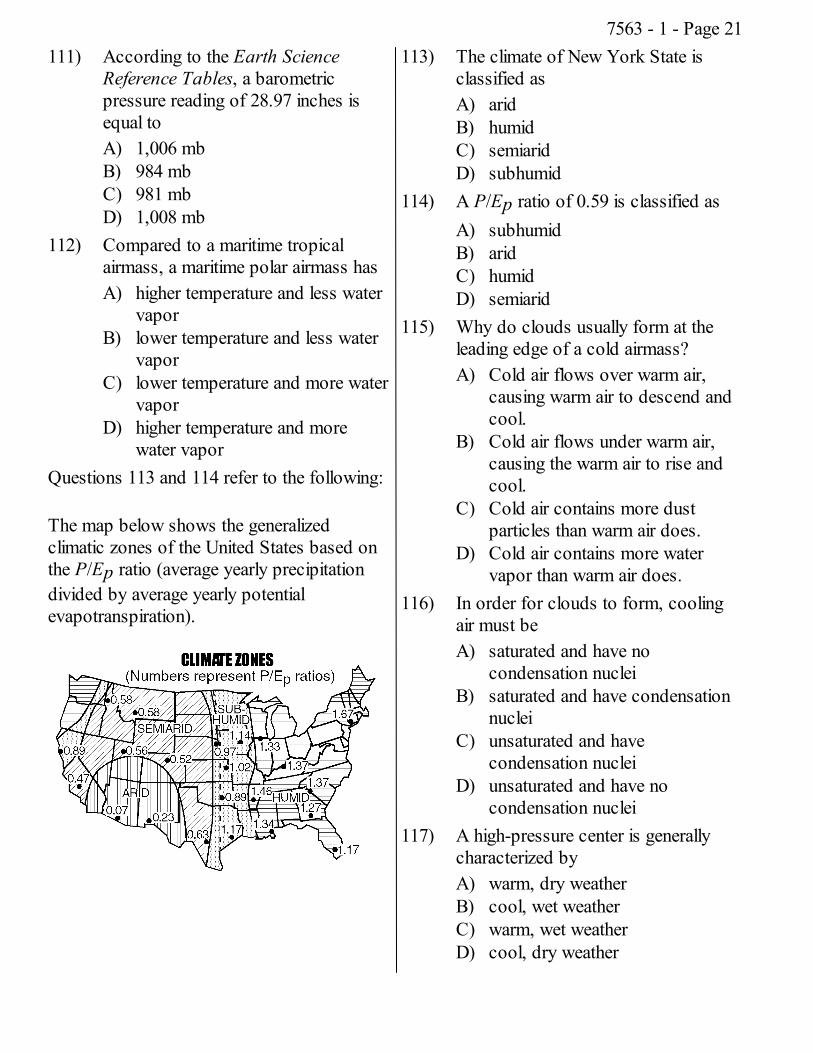
The map below shows the generalizedclimatic zones of the United States based onthe P/Ep ratio (average yearly precipitationdivided by average yearly potentialevapotranspiration).
113) The climate of New York State isclassified asA) aridB) humidC) semiaridD) subhumid
114) A P/Ep ratio of 0.59 is classified asA) subhumidB) aridC) humidD) semiarid
115) Why do clouds usually form at theleading edge of a cold airmass?A) Cold air flows over warm air,
causing warm air to descend andcool.
B) Cold air flows under warm air,causing the warm air to rise andcool.
C) Cold air contains more dustparticles than warm air does.
D) Cold air contains more watervapor than warm air does.
116) In order for clouds to form, coolingair must beA) saturated and have no
condensation nucleiB) saturated and have condensation
nucleiC) unsaturated and have
condensation nucleiD) unsaturated and have no
condensation nuclei117) A high-pressure center is generally
characterized byA) warm, dry weatherB) cool, wet weatherC) warm, wet weatherD) cool, dry weather
7563 - 1 - Page 21
118) According to the Earth ScienceReference Tables, what is thedewpoint temperature when thedrybulb temperature is 14DC and thewet-bulb temperature is 10DC?A) -17DCB) 4DC
C) 3DCD) 6DC
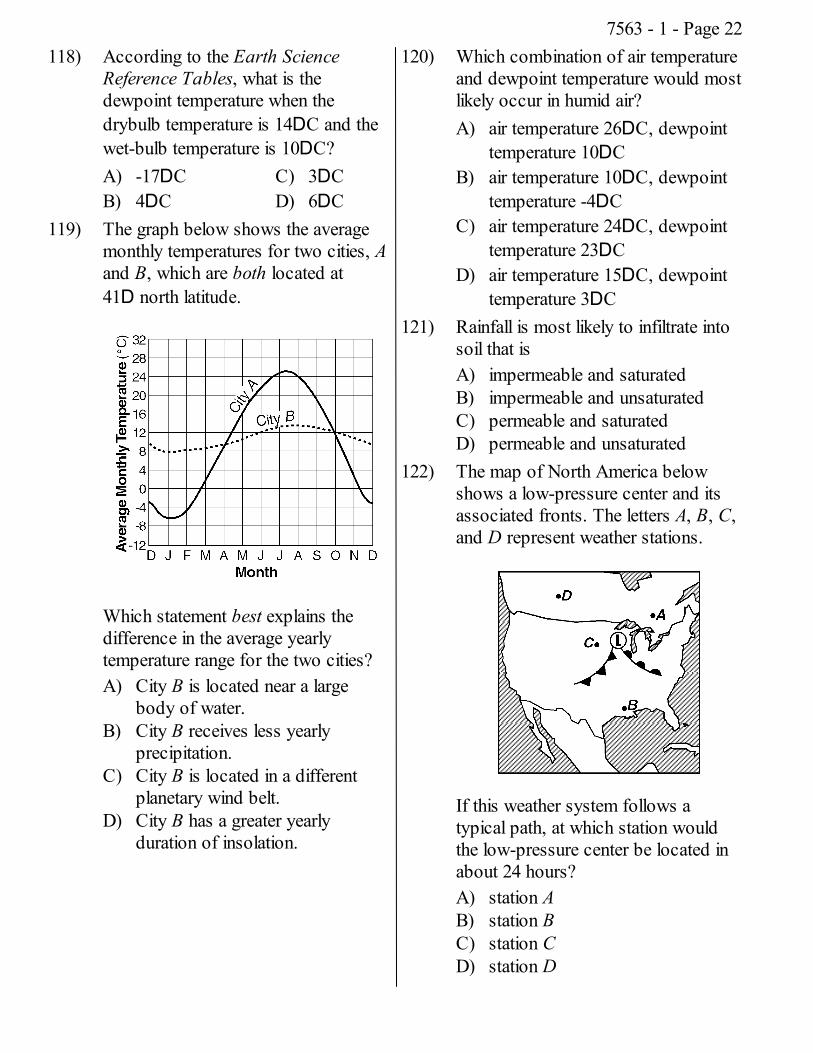
119) The graph below shows the averagemonthly temperatures for two cities, Aand B, which are both located at41D north latitude.
Which statement best explains thedifference in the average yearlytemperature range for the two cities?A) City B is located near a large
body of water.B) City B receives less yearly
precipitation.C) City B is located in a different
planetary wind belt.D) City B has a greater yearly
duration of insolation.
120) Which combination of air temperatureand dewpoint temperature would mostlikely occur in humid air?A) air temperature 26DC, dewpoint
temperature 10DCB) air temperature 10DC, dewpoint
temperature -4DCC) air temperature 24DC, dewpoint
temperature 23DCD) air temperature 15DC, dewpoint
temperature 3DC121) Rainfall is most likely to infiltrate into
soil that isA) impermeable and saturatedB) impermeable and unsaturatedC) permeable and saturatedD) permeable and unsaturated
122) The map of North America belowshows a low-pressure center and itsassociated fronts. The letters A, B, C,and D represent weather stations.
If this weather system follows atypical path, at which station wouldthe low-pressure center be located inabout 24 hours?A) station AB) station BC) station CD) station D
7563 - 1 - Page 22
123) Compared to a coastal location of thesame elevation and latitude, an inlandlocation is likely to haveA) warmer summers and cooler
wintersB) cooler summers and warmer
wintersC) warmer summers and warmer
wintersD) cooler summers and cooler
winters124) As wind velocity decreases, the
distance between isobars on a weathermap willA) remain the sameB) increaseC) decrease
125) Clouds usually form whenA) relative humidity is 0%B) evaporation has warmed the
surrounding airC) air temperature reaches the
dewpointD) condensation nuclei have been
removed from the air126) Compared to a maritime tropical air
mass, a continental polar air mass isA) cooler and contains less moistureB) warmer and contains more
moistureC) cooler and contains more
moistureD) warmer and contains less
moisture127) An air pressure of 1023 millibars is
equal to how many inches ofmercury?A) 30.10B) 30.19
C) 30.21D) 30.15
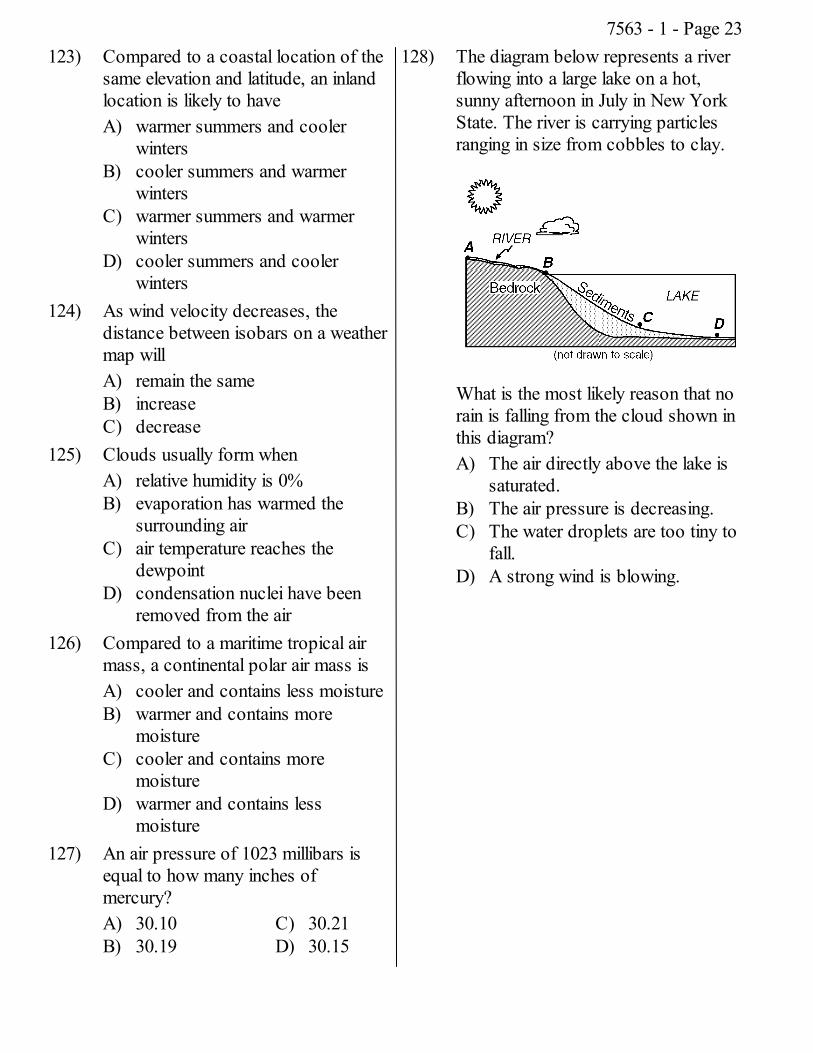
128) The diagram below represents a riverflowing into a large lake on a hot,sunny afternoon in July in New YorkState. The river is carrying particlesranging in size from cobbles to clay.
What is the most likely reason that norain is falling from the cloud shown inthis diagram?A) The air directly above the lake is
saturated.B) The air pressure is decreasing.C) The water droplets are too tiny to
fall.D) A strong wind is blowing.
7563 - 1 - Page 23
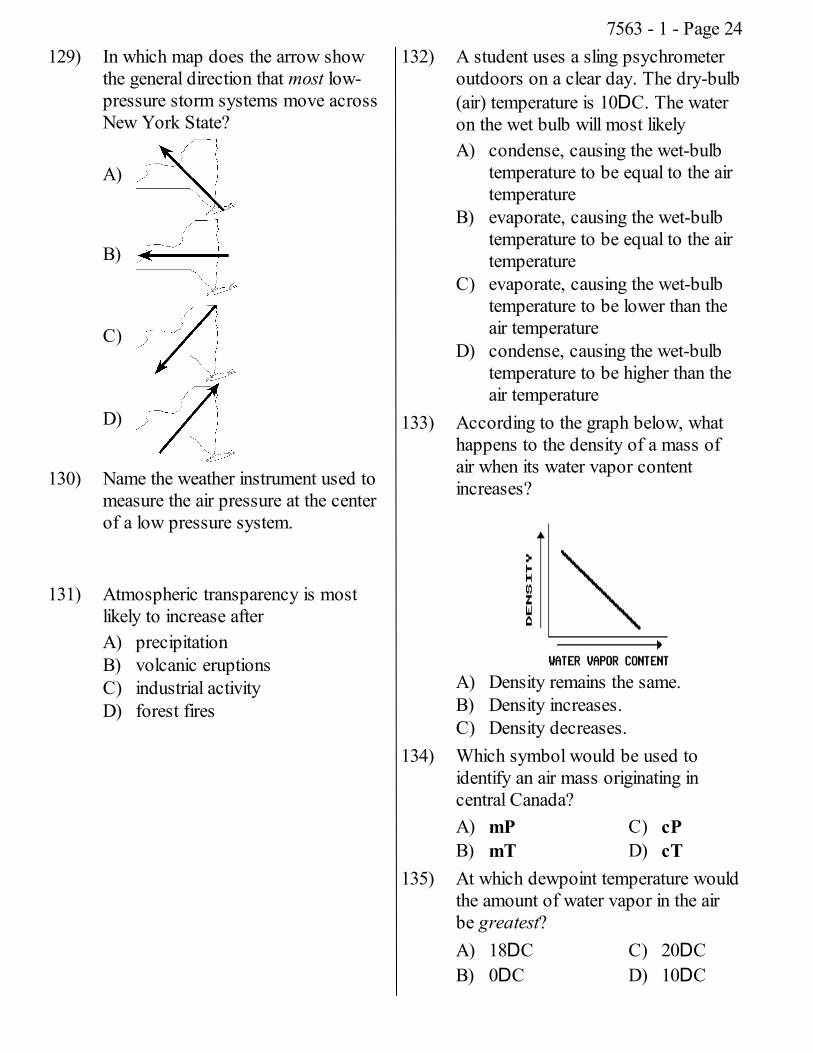
129) In which map does the arrow showthe general direction that most low-pressure storm systems move acrossNew York State?
A)
B)
C)
D)
130) Name the weather instrument used tomeasure the air pressure at the centerof a low pressure system.
131) Atmospheric transparency is mostlikely to increase afterA) precipitationB) volcanic eruptionsC) industrial activityD) forest fires
132) A student uses a sling psychrometeroutdoors on a clear day. The dry-bulb(air) temperature is 10DC. The wateron the wet bulb will most likelyA) condense, causing the wet-bulb
temperature to be equal to the airtemperature
B) evaporate, causing the wet-bulbtemperature to be equal to the airtemperature
C) evaporate, causing the wet-bulbtemperature to be lower than theair temperature
D) condense, causing the wet-bulbtemperature to be higher than theair temperature
133) According to the graph below, whathappens to the density of a mass ofair when its water vapor contentincreases?
A) Density remains the same.B) Density increases.C) Density decreases.
134) Which symbol would be used toidentify an air mass originating incentral Canada?A) mPB) mT
C) cPD) cT
135) At which dewpoint temperature wouldthe amount of water vapor in the airbe greatest?A) 18DCB) 0DC
C) 20DCD) 10DC
7563 - 1 - Page 24
136) According to the Earth ScienceReference Tables, which abbreviationindicates a warm air mass thatcontains large amounts of watervapor?A) mPB) mT
C) cPD) cT
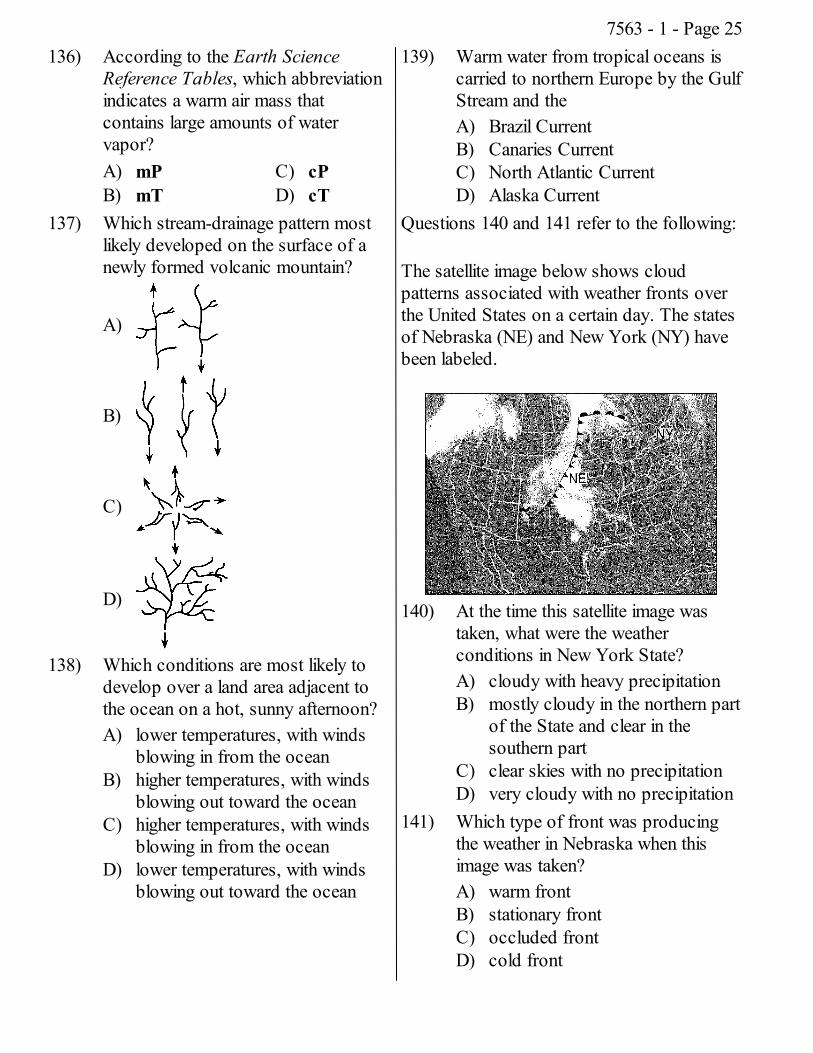
137) Which stream-drainage pattern mostlikely developed on the surface of anewly formed volcanic mountain?
A)
B)
C)
D)
138) Which conditions are most likely todevelop over a land area adjacent tothe ocean on a hot, sunny afternoon?A) lower temperatures, with winds
blowing in from the oceanB) higher temperatures, with winds
blowing out toward the oceanC) higher temperatures, with winds
blowing in from the oceanD) lower temperatures, with winds
blowing out toward the ocean
139) Warm water from tropical oceans iscarried to northern Europe by the GulfStream and theA) Brazil CurrentB) Canaries CurrentC) North Atlantic CurrentD) Alaska Current
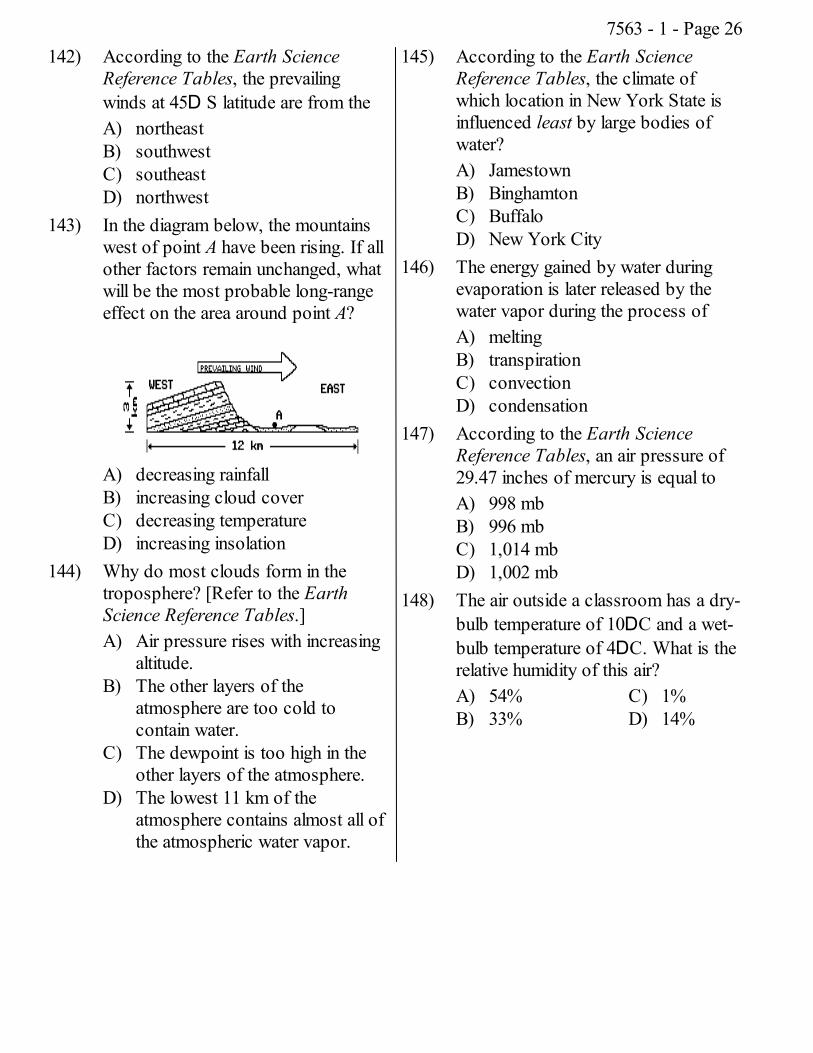
Questions 140 and 141 refer to the following:
The satellite image below shows cloudpatterns associated with weather fronts overthe United States on a certain day. The statesof Nebraska (NE) and New York (NY) havebeen labeled.
140) At the time this satellite image wastaken, what were the weatherconditions in New York State?A) cloudy with heavy precipitationB) mostly cloudy in the northern part
of the State and clear in thesouthern part
C) clear skies with no precipitationD) very cloudy with no precipitation
141) Which type of front was producingthe weather in Nebraska when thisimage was taken?A) warm frontB) stationary frontC) occluded frontD) cold front
7563 - 1 - Page 25
142) According to the Earth ScienceReference Tables, the prevailingwinds at 45D S latitude are from theA) northeastB) southwestC) southeastD) northwest
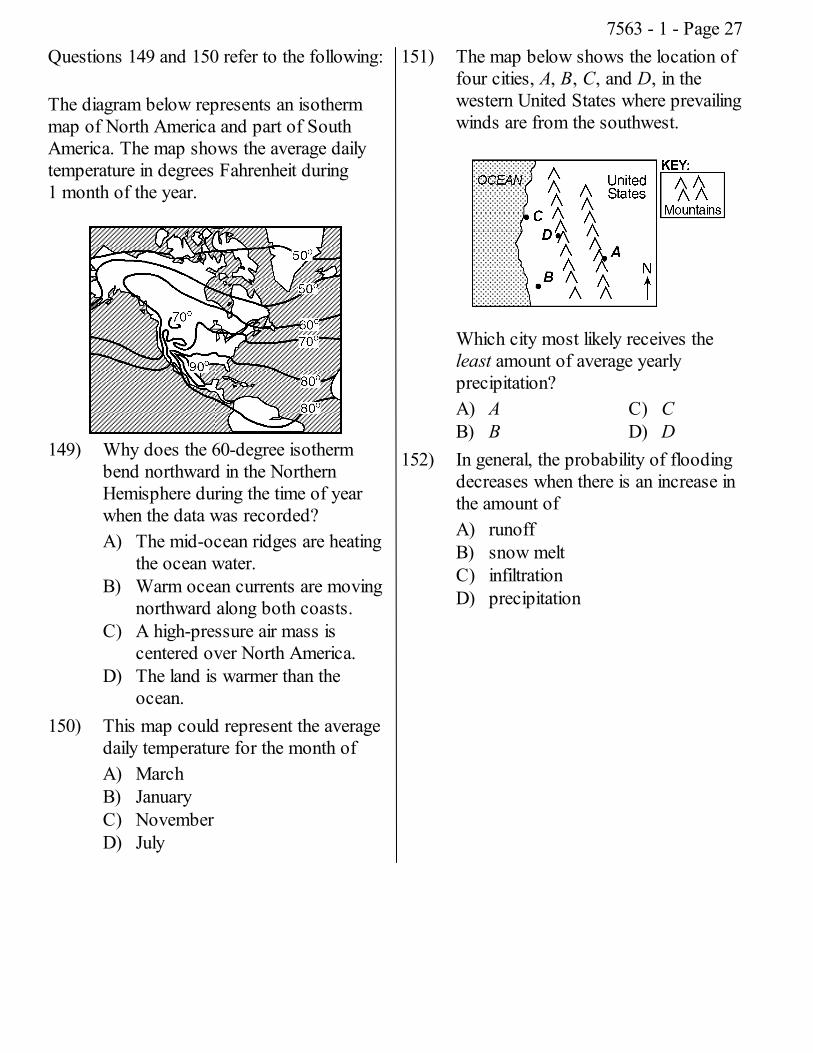
143) In the diagram below, the mountainswest of point A have been rising. If allother factors remain unchanged, whatwill be the most probable long-rangeeffect on the area around point A?
A) decreasing rainfallB) increasing cloud coverC) decreasing temperatureD) increasing insolation
144) Why do most clouds form in thetroposphere? [Refer to the EarthScience Reference Tables.]A) Air pressure rises with increasing
altitude.B) The other layers of the
atmosphere are too cold tocontain water.
C) The dewpoint is too high in theother layers of the atmosphere.
D) The lowest 11 km of theatmosphere contains almost all ofthe atmospheric water vapor.
145) According to the Earth ScienceReference Tables, the climate ofwhich location in New York State isinfluenced least by large bodies ofwater?A) JamestownB) BinghamtonC) BuffaloD) New York City
146) The energy gained by water duringevaporation is later released by thewater vapor during the process ofA) meltingB) transpirationC) convectionD) condensation
147) According to the Earth ScienceReference Tables, an air pressure of29.47 inches of mercury is equal toA) 998 mbB) 996 mbC) 1,014 mbD) 1,002 mb
148) The air outside a classroom has a dry-bulb temperature of 10DC and a wet-bulb temperature of 4DC. What is therelative humidity of this air?A) 54%B) 33%
C) 1%D) 14%
7563 - 1 - Page 26
Questions 149 and 150 refer to the following:
The diagram below represents an isothermmap of North America and part of SouthAmerica. The map shows the average dailytemperature in degrees Fahrenheit during1 month of the year.
149) Why does the 60-degree isothermbend northward in the NorthernHemisphere during the time of yearwhen the data was recorded?A) The mid-ocean ridges are heating
the ocean water.B) Warm ocean currents are moving
northward along both coasts.C) A high-pressure air mass is
centered over North America.D) The land is warmer than the
ocean.150) This map could represent the average
daily temperature for the month ofA) MarchB) JanuaryC) NovemberD) July
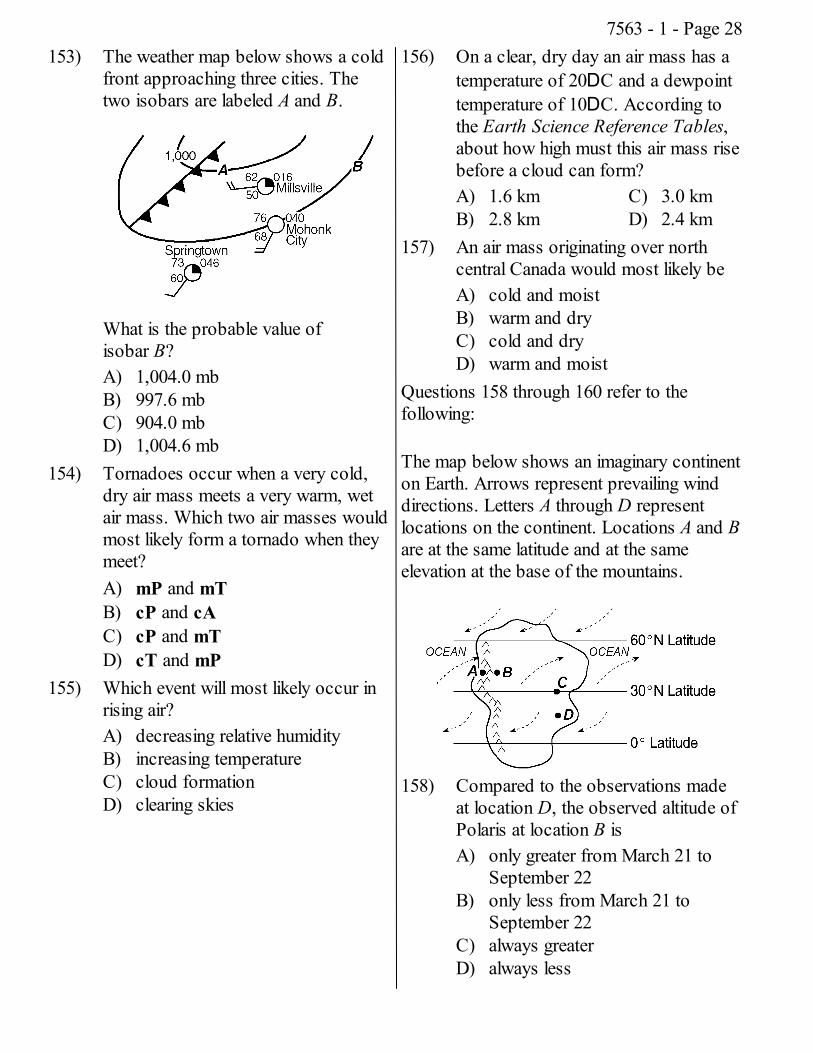
151) The map below shows the location offour cities, A, B, C, and D, in thewestern United States where prevailingwinds are from the southwest.
Which city most likely receives theleast amount of average yearlyprecipitation?A) AB) B
C) CD) D
152) In general, the probability of floodingdecreases when there is an increase inthe amount ofA) runoffB) snow meltC) infiltrationD) precipitation
7563 - 1 - Page 27
153) The weather map below shows a coldfront approaching three cities. Thetwo isobars are labeled A and B.
What is the probable value ofisobar B?A) 1,004.0 mbB) 997.6 mbC) 904.0 mbD) 1,004.6 mb
154) Tornadoes occur when a very cold,dry air mass meets a very warm, wetair mass. Which two air masses wouldmost likely form a tornado when theymeet?A) mP and mTB) cP and cAC) cP and mTD) cT and mP
155) Which event will most likely occur inrising air?A) decreasing relative humidityB) increasing temperatureC) cloud formationD) clearing skies
156) On a clear, dry day an air mass has atemperature of 20DC and a dewpointtemperature of 10DC. According tothe Earth Science Reference Tables,about how high must this air mass risebefore a cloud can form?A) 1.6 kmB) 2.8 km
C) 3.0 kmD) 2.4 km
157) An air mass originating over northcentral Canada would most likely beA) cold and moistB) warm and dryC) cold and dryD) warm and moist
Questions 158 through 160 refer to thefollowing:
The map below shows an imaginary continenton Earth. Arrows represent prevailing winddirections. Letters A through D representlocations on the continent. Locations A and Bare at the same latitude and at the sameelevation at the base of the mountains.
158) Compared to the observations madeat location D, the observed altitude ofPolaris at location B isA) only greater from March 21 to
September 22B) only less from March 21 to
September 22C) always greaterD) always less
7563 - 1 - Page 28
159) Over the course of a year, comparedto location B, location A will haveA) more precipitation and a smaller
temperature rangeB) less precipitation and a smaller
temperature rangeC) more precipitation and a greater
temperature rangeD) less precipitation and a greater
temperature range160) The climate at location C is much
drier than at location D. Thisdifference is best explained by the factthat location C is locatedA) at a latitude where air is sinking
and surface winds divergeB) at a latitude that experiences
longer average annual daylightC) closer to a large body of waterD) farther from any mountain range
161) During the warmest part of a Juneday, breezes blow from the oceantoward the shore at a Long Islandbeach. Which statement best explainswhy this happens?A) Winds never blow from the shore
toward the ocean.B) Winds usually blow from hot to
cold areas.C) Air pressure over the land is
higher than air pressure over theocean.
D) Air pressure over the ocean ishigher than air pressure over theland.
Questions 162 and 163 refer to the following:
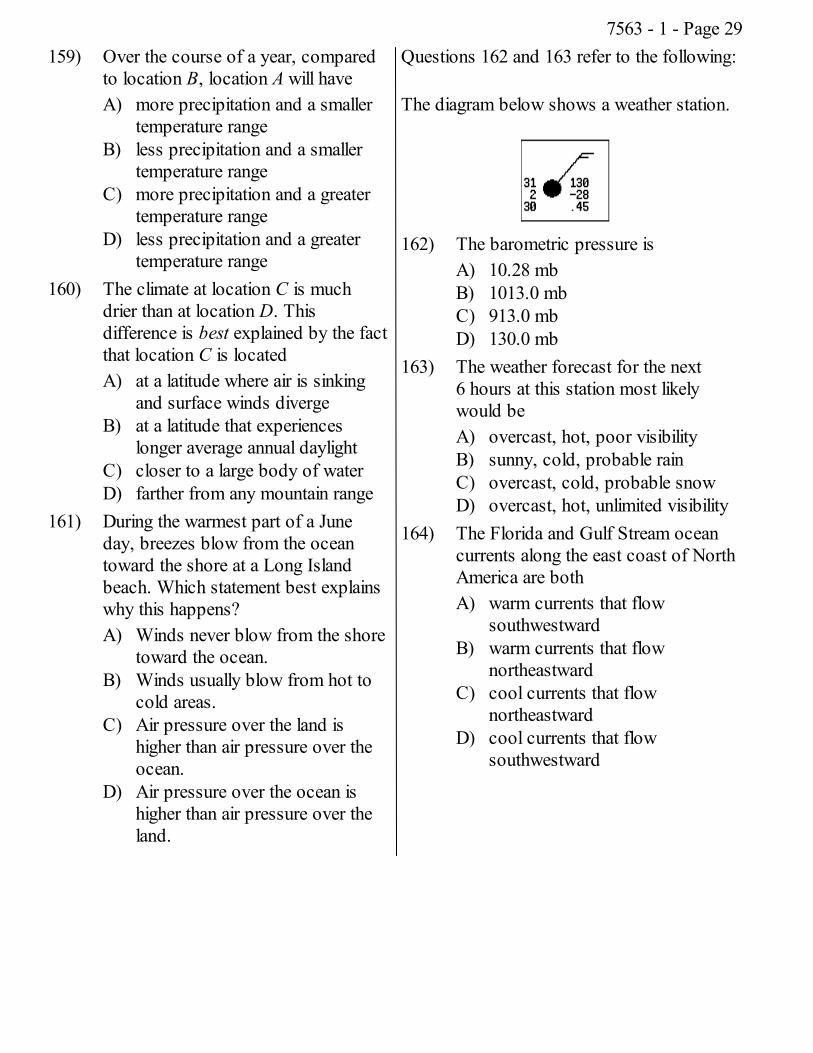
The diagram below shows a weather station.
162) The barometric pressure isA) 10.28 mbB) 1013.0 mbC) 913.0 mbD) 130.0 mb
163) The weather forecast for the next6 hours at this station most likelywould beA) overcast, hot, poor visibilityB) sunny, cold, probable rainC) overcast, cold, probable snowD) overcast, hot, unlimited visibility
164) The Florida and Gulf Stream oceancurrents along the east coast of NorthAmerica are bothA) warm currents that flow
southwestwardB) warm currents that flow
northeastwardC) cool currents that flow
northeastwardD) cool currents that flow
southwestward
7563 - 1 - Page 29
165) Which weather-station model showsan air pressure of 993.4 millibars?
A)
B)
C)
D)
166) An airmass located over the centralUnited States will most likely movetoward theA) southeastB) northwestC) northeastD) southwest
167) At which weather station is visibilitygreatest?
A)
B)
C)
D)
Questions 168 through 170 refer to thefollowing:
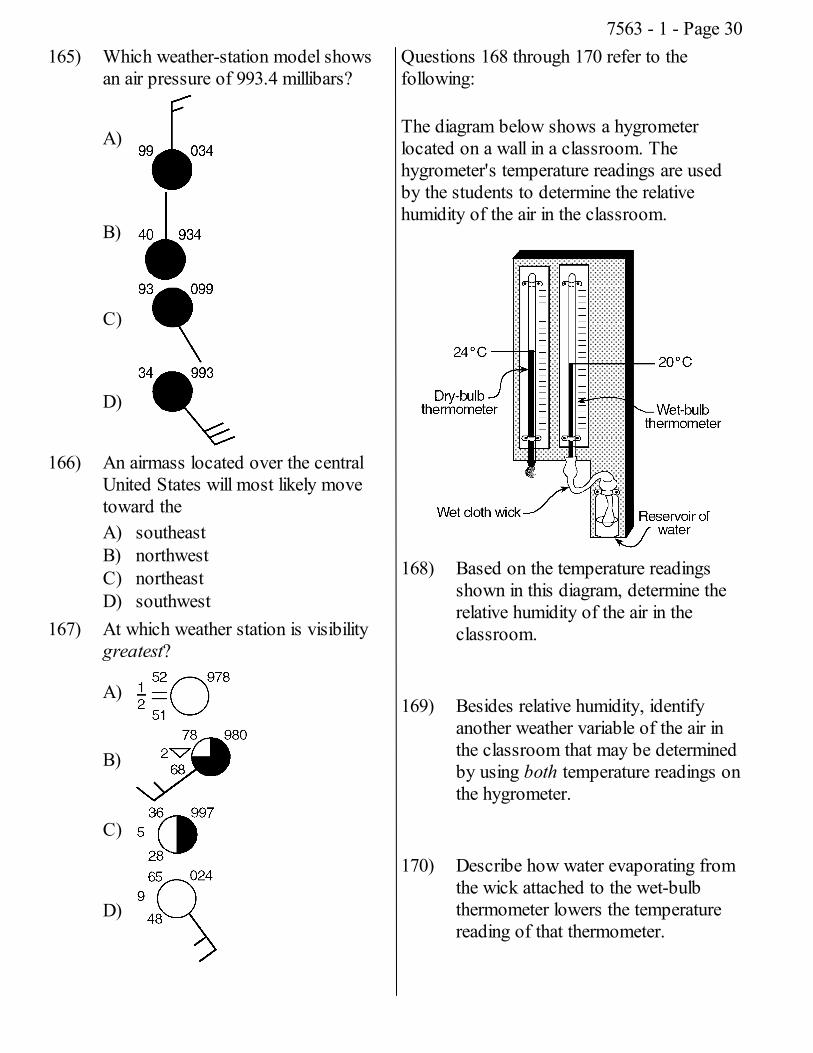
The diagram below shows a hygrometerlocated on a wall in a classroom. Thehygrometer's temperature readings are usedby the students to determine the relativehumidity of the air in the classroom.
168) Based on the temperature readingsshown in this diagram, determine therelative humidity of the air in theclassroom.
169) Besides relative humidity, identifyanother weather variable of the air inthe classroom that may be determinedby using both temperature readings onthe hygrometer.
170) Describe how water evaporating fromthe wick attached to the wet-bulbthermometer lowers the temperaturereading of that thermometer.
7563 - 1 - Page 30
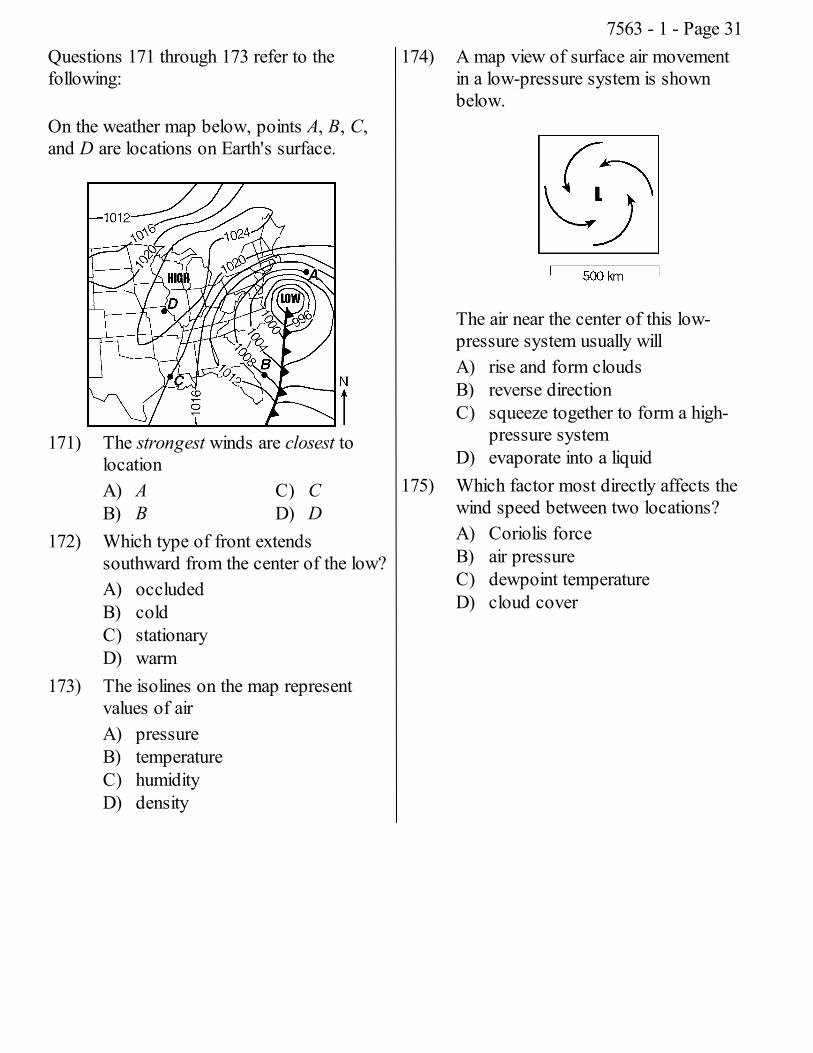
Questions 171 through 173 refer to thefollowing:
On the weather map below, points A, B, C,and D are locations on Earth's surface.
171) The strongest winds are closest tolocationA) AB) B
C) CD) D
172) Which type of front extendssouthward from the center of the low?A) occludedB) coldC) stationaryD) warm
173) The isolines on the map representvalues of airA) pressureB) temperatureC) humidityD) density
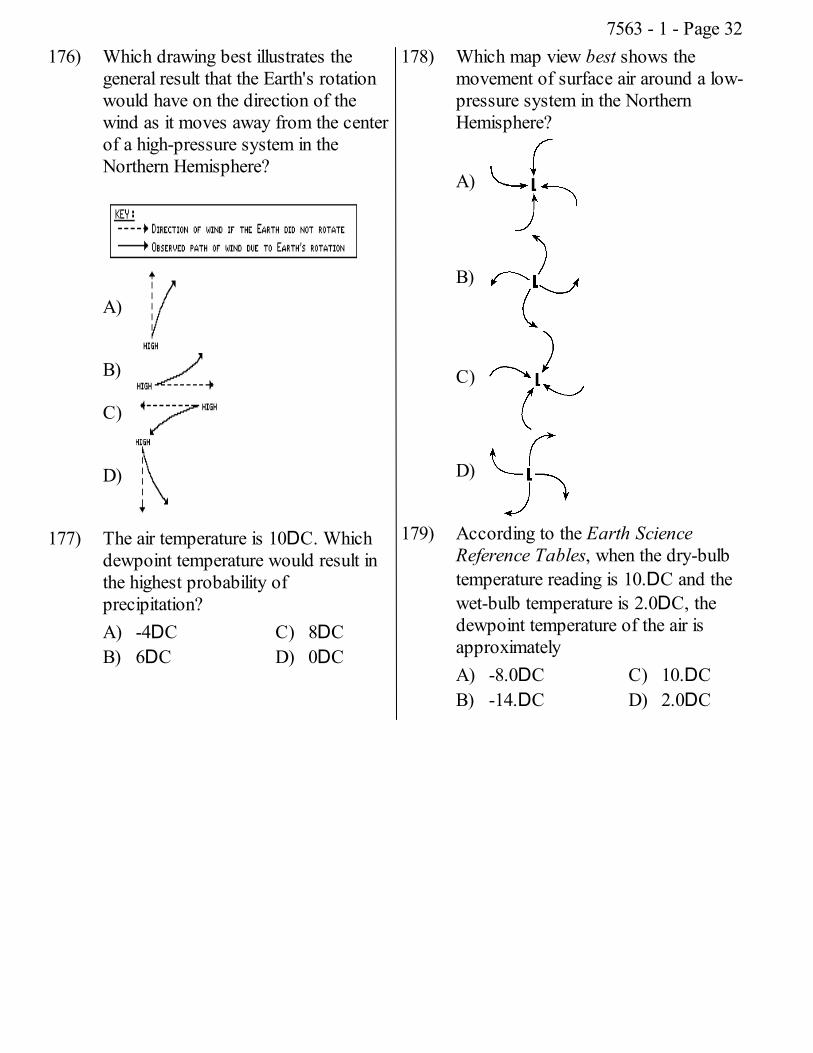
174) A map view of surface air movementin a low-pressure system is shownbelow.
The air near the center of this low-pressure system usually willA) rise and form cloudsB) reverse directionC) squeeze together to form a high-
pressure systemD) evaporate into a liquid
175) Which factor most directly affects thewind speed between two locations?A) Coriolis forceB) air pressureC) dewpoint temperatureD) cloud cover
7563 - 1 - Page 31
176) Which drawing best illustrates thegeneral result that the Earth's rotationwould have on the direction of thewind as it moves away from the centerof a high-pressure system in theNorthern Hemisphere?
A)
B)
C)
D)
177) The air temperature is 10DC. Whichdewpoint temperature would result inthe highest probability ofprecipitation?A) -4DCB) 6DC
C) 8DCD) 0DC
178) Which map view best shows themovement of surface air around a low-pressure system in the NorthernHemisphere?
A)
B)
C)
D)
179) According to the Earth ScienceReference Tables, when the dry-bulbtemperature reading is 10.DC and thewet-bulb temperature is 2.0DC, thedewpoint temperature of the air isapproximatelyA) -8.0DCB) -14.DC
C) 10.DCD) 2.0DC
7563 - 1 - Page 32
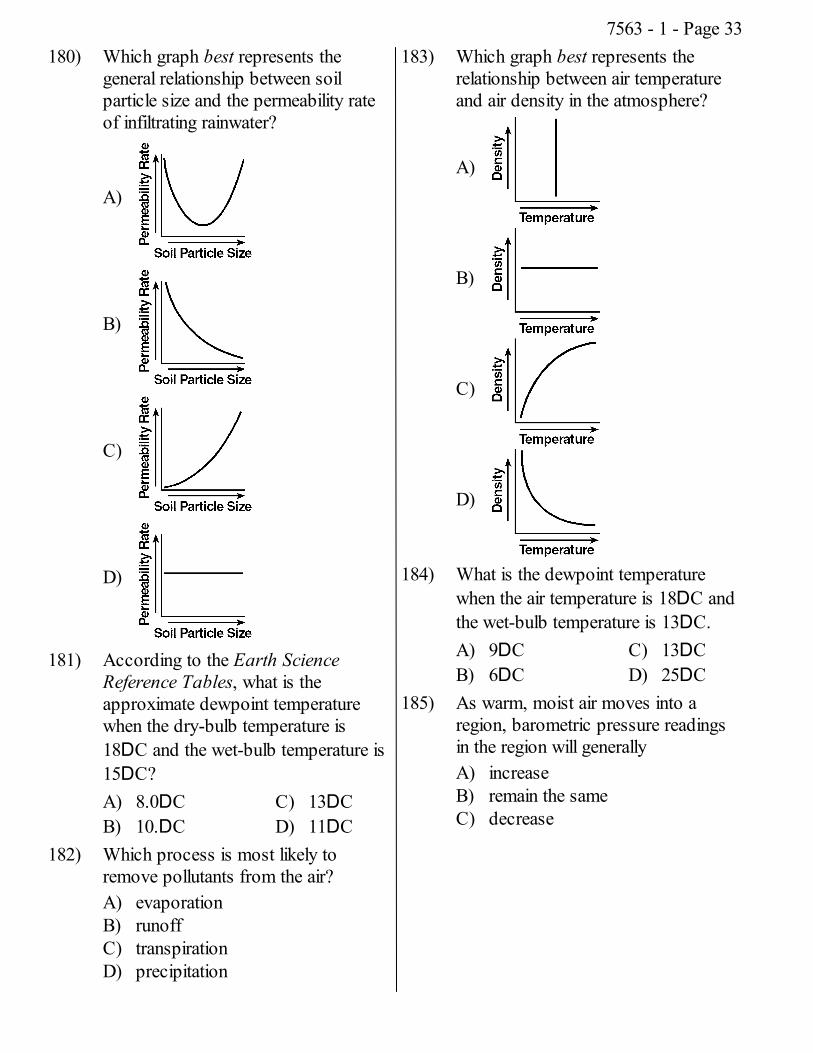
180) Which graph best represents thegeneral relationship between soilparticle size and the permeability rateof infiltrating rainwater?
A)
B)
C)
D)
181) According to the Earth ScienceReference Tables, what is theapproximate dewpoint temperaturewhen the dry-bulb temperature is18DC and the wet-bulb temperature is15DC?A) 8.0DCB) 10.DC
C) 13DCD) 11DC
182) Which process is most likely toremove pollutants from the air?A) evaporationB) runoffC) transpirationD) precipitation
183) Which graph best represents therelationship between air temperatureand air density in the atmosphere?
A)
B)
C)
D)
184) What is the dewpoint temperaturewhen the air temperature is 18DC andthe wet-bulb temperature is 13DC.A) 9DCB) 6DC
C) 13DCD) 25DC
185) As warm, moist air moves into aregion, barometric pressure readingsin the region will generallyA) increaseB) remain the sameC) decrease
7563 - 1 - Page 33
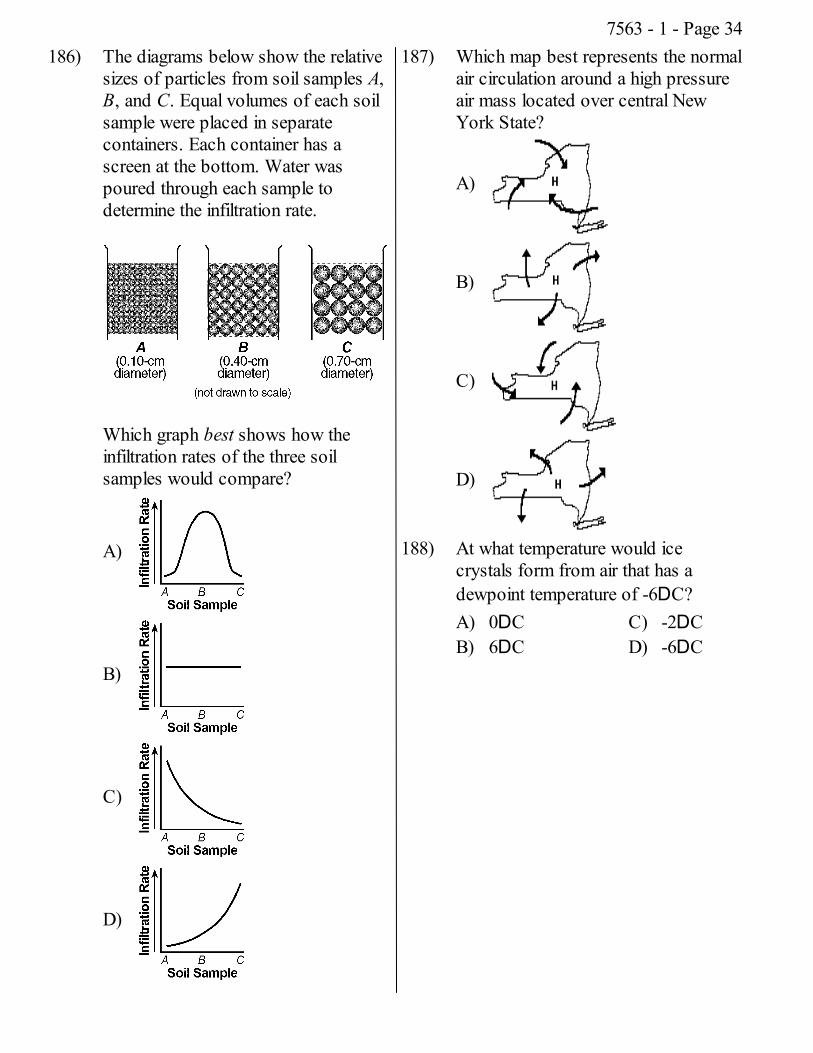
186) The diagrams below show the relativesizes of particles from soil samples A,B, and C. Equal volumes of each soilsample were placed in separatecontainers. Each container has ascreen at the bottom. Water waspoured through each sample todetermine the infiltration rate.
Which graph best shows how theinfiltration rates of the three soilsamples would compare?
A)
B)
C)
D)
187) Which map best represents the normalair circulation around a high pressureair mass located over central NewYork State?
A)
B)
C)
D)
188) At what temperature would icecrystals form from air that has adewpoint temperature of -6DC?A) 0DCB) 6DC
C) -2DCD) -6DC
7563 - 1 - Page 34
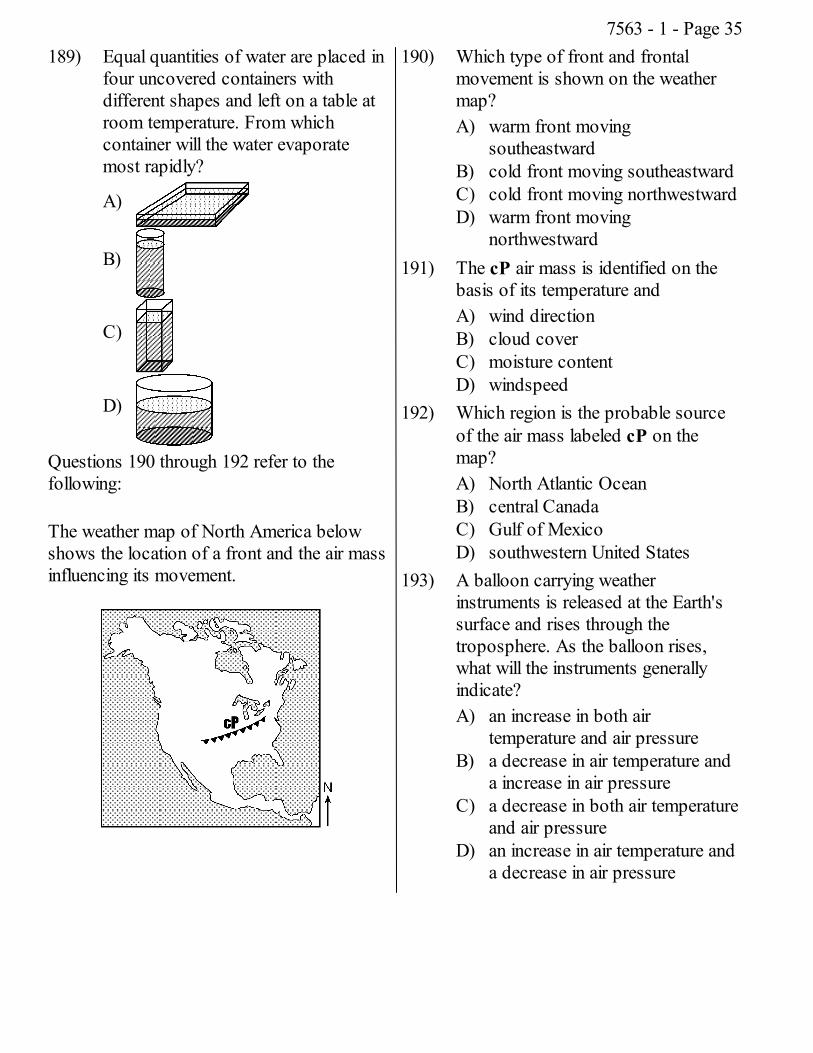
189) Equal quantities of water are placed infour uncovered containers withdifferent shapes and left on a table atroom temperature. From whichcontainer will the water evaporatemost rapidly?
A)
B)
C)
D)
Questions 190 through 192 refer to thefollowing:
The weather map of North America belowshows the location of a front and the air massinfluencing its movement.
190) Which type of front and frontalmovement is shown on the weathermap?A) warm front moving
southeastwardB) cold front moving southeastwardC) cold front moving northwestwardD) warm front moving
northwestward191) The cP air mass is identified on the
basis of its temperature andA) wind directionB) cloud coverC) moisture contentD) windspeed
192) Which region is the probable sourceof the air mass labeled cP on themap?A) North Atlantic OceanB) central CanadaC) Gulf of MexicoD) southwestern United States
193) A balloon carrying weatherinstruments is released at the Earth'ssurface and rises through thetroposphere. As the balloon rises,what will the instruments generallyindicate?A) an increase in both air
temperature and air pressureB) a decrease in air temperature and
a increase in air pressureC) a decrease in both air temperature
and air pressureD) an increase in air temperature and
a decrease in air pressure
7563 - 1 - Page 35
194) Pollutants are most likely to beremoved from the atmosphere byA) precipitationB) transpirationC) volcanic activityD) evaporation
195) Which weather change usually occurswhen the difference between the airtemperature and the dewpointtemperature is decreasing?A) The amount of cloud cover
decreases.B) The relative humidity increases.C) The probability of precipitation
decreases.D) The barometric pressure
increases.196) A strong wind blowing from the
northwest toward the southeast wouldbe caused primarily by differences inA) dewpoint temperatureB) cloud coverC) elevationD) air pressure
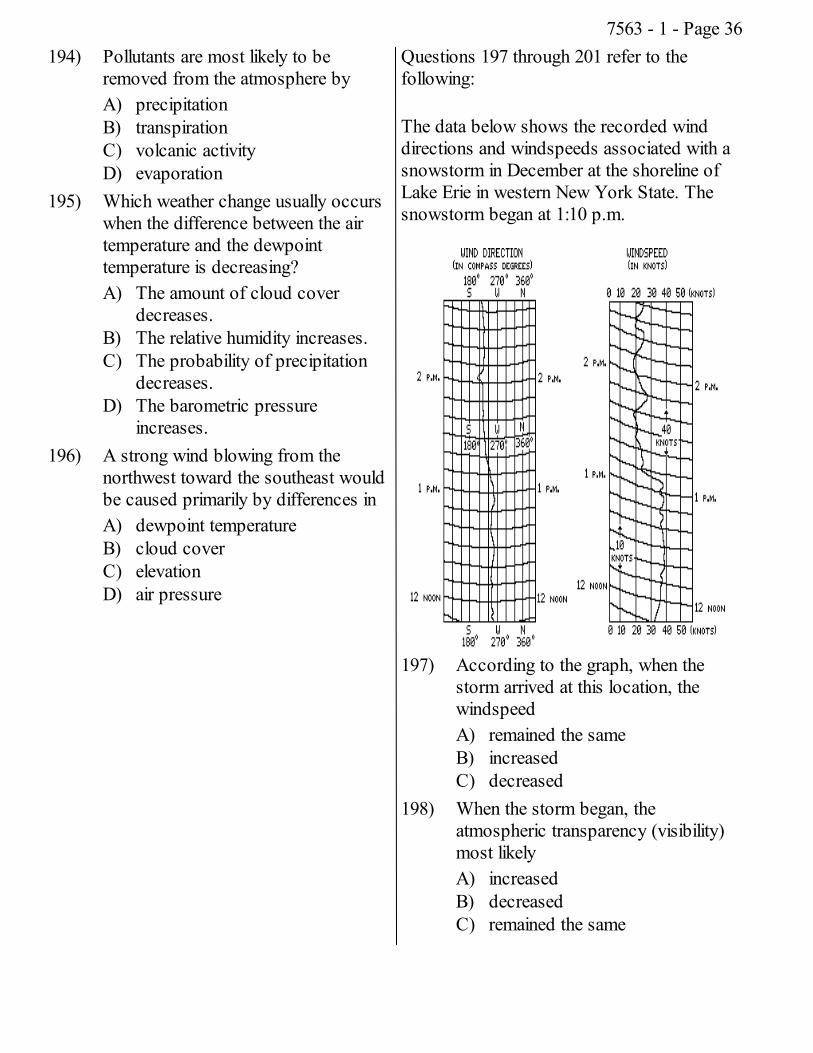
Questions 197 through 201 refer to thefollowing:
The data below shows the recorded winddirections and windspeeds associated with asnowstorm in December at the shoreline ofLake Erie in western New York State. Thesnowstorm began at 1:10 p.m.
197) According to the graph, when thestorm arrived at this location, thewindspeedA) remained the sameB) increasedC) decreased
198) When the storm began, theatmospheric transparency (visibility)most likelyA) increasedB) decreasedC) remained the same
7563 - 1 - Page 36
199) Before the storm arrived at thislocation, the wind direction wasprimarilyA) southeastB) southC) northwestD) west
200) According to the Earth ScienceReference Tables, the airmass thatmoved over this location most likelyobtained moisture by passing overA) the Adirondack MountainsB) Lake ErieC) the Appalachian UplandsD) the Atlantic Ocean
201) At approximately what time was anaverage windspeed of 40 knotsrecorded?A) 12:30 p.m.B) 1:30 p.m.C) 1:20 p.m.D) 2:10 p.m.
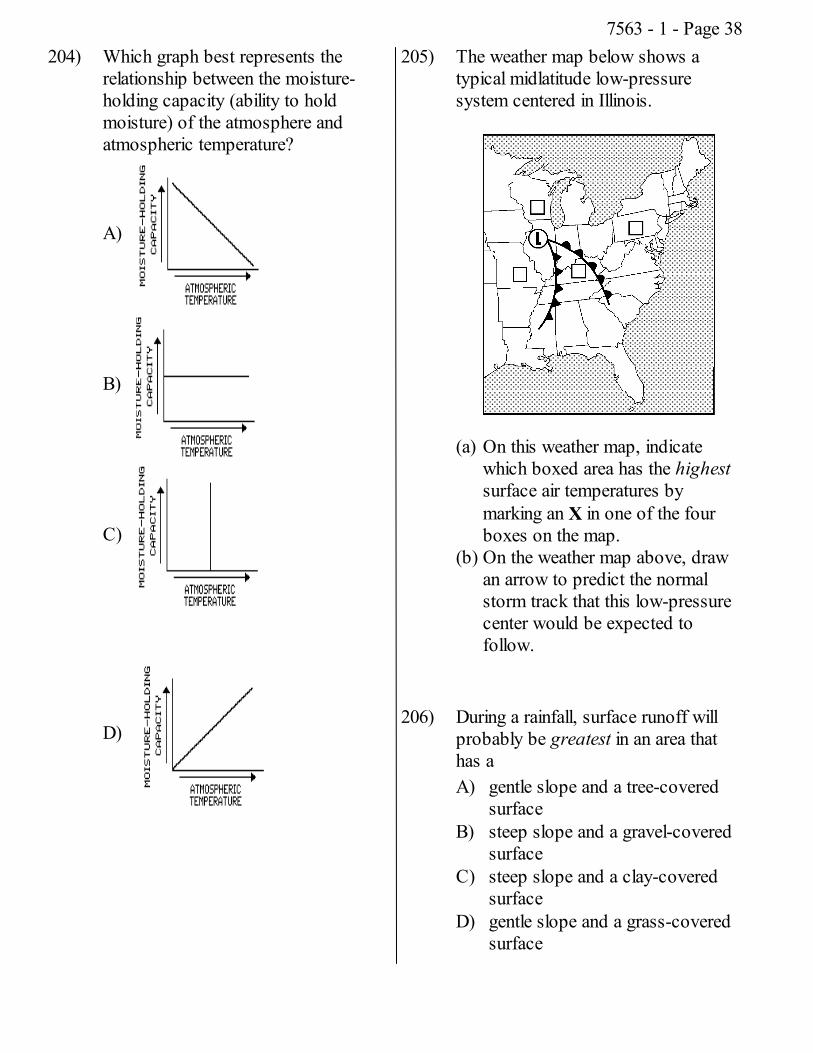
202) At which interface in the diagrambelow is the moisture content of theair likely to be highest?
A) thermosphere-mesosphereB) mesosphere-stratosphereC) stratosphere-troposphereD) troposphere-hydrosphere
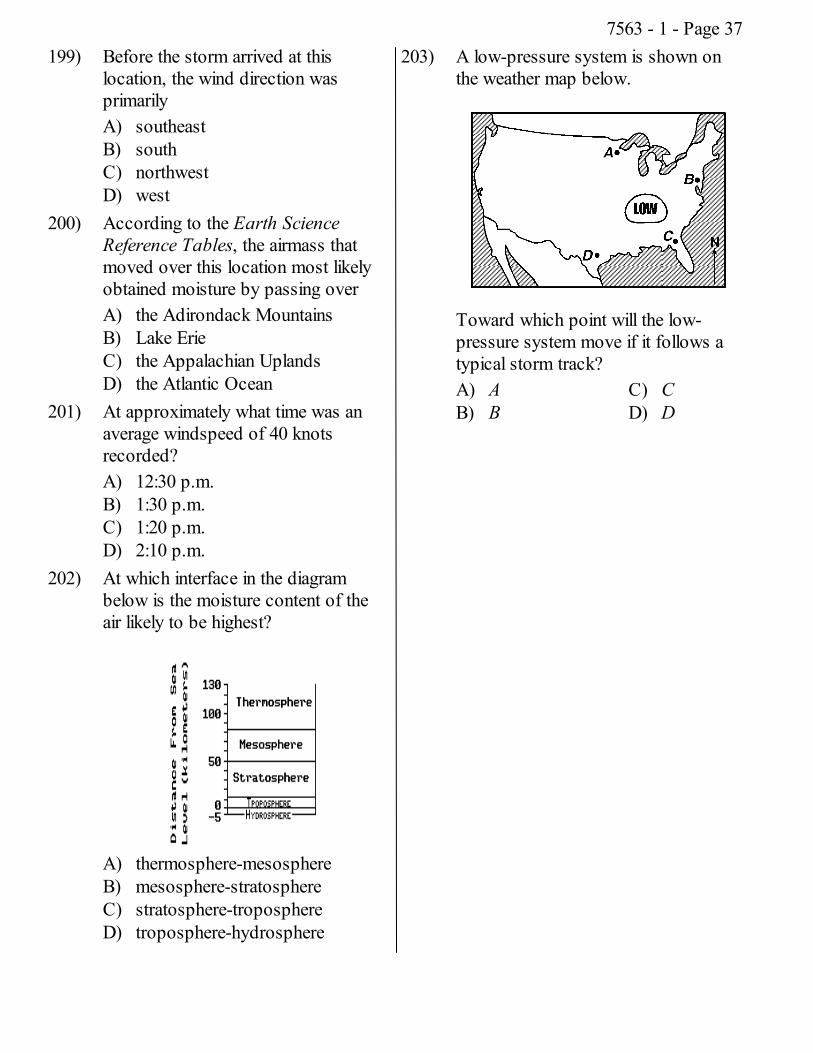
203) A low-pressure system is shown onthe weather map below.
Toward which point will the low-pressure system move if it follows atypical storm track?A) AB) B
C) CD) D
7563 - 1 - Page 37
204) Which graph best represents therelationship between the moisture-holding capacity (ability to holdmoisture) of the atmosphere andatmospheric temperature?
A)
B)
C)
D)
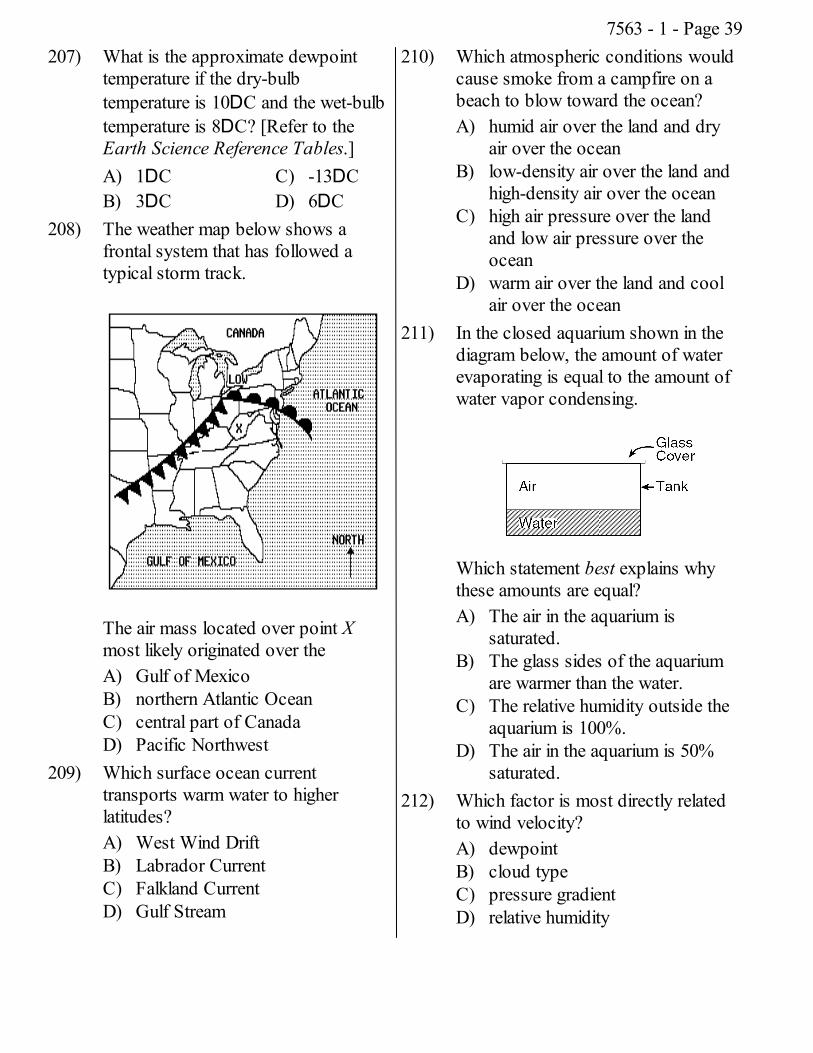
205) The weather map below shows atypical midlatitude low-pressuresystem centered in Illinois.
(a) On this weather map, indicatewhich boxed area has the highestsurface air temperatures bymarking an X in one of the fourboxes on the map.
(b) On the weather map above, drawan arrow to predict the normalstorm track that this low-pressurecenter would be expected tofollow.
206) During a rainfall, surface runoff willprobably be greatest in an area thathas aA) gentle slope and a tree-covered
surfaceB) steep slope and a gravel-covered
surfaceC) steep slope and a clay-covered
surfaceD) gentle slope and a grass-covered
surface
7563 - 1 - Page 38
207) What is the approximate dewpointtemperature if the dry-bulbtemperature is 10DC and the wet-bulbtemperature is 8DC? [Refer to theEarth Science Reference Tables.]A) 1DCB) 3DC
C) -13DCD) 6DC
208) The weather map below shows afrontal system that has followed atypical storm track.
The air mass located over point Xmost likely originated over theA) Gulf of MexicoB) northern Atlantic OceanC) central part of CanadaD) Pacific Northwest
209) Which surface ocean currenttransports warm water to higherlatitudes?A) West Wind DriftB) Labrador CurrentC) Falkland CurrentD) Gulf Stream
210) Which atmospheric conditions wouldcause smoke from a campfire on abeach to blow toward the ocean?A) humid air over the land and dry
air over the oceanB) low-density air over the land and
high-density air over the oceanC) high air pressure over the land
and low air pressure over theocean
D) warm air over the land and coolair over the ocean
211) In the closed aquarium shown in thediagram below, the amount of waterevaporating is equal to the amount ofwater vapor condensing.
Which statement best explains whythese amounts are equal?A) The air in the aquarium is
saturated.B) The glass sides of the aquarium
are warmer than the water.C) The relative humidity outside the
aquarium is 100%.D) The air in the aquarium is 50%
saturated.212) Which factor is most directly related
to wind velocity?A) dewpointB) cloud typeC) pressure gradientD) relative humidity
7563 - 1 - Page 39
213) On a weather map, an airmass that isvery warm and dry would be labeledA) mTB) mP
C) cPD) cT
214) The map below represents a high-pressure weather system located overNew York State.
Which diagram represents the mostprobable wind direction in this high-pressure system?
A)
B)
C)
D)
215) According to the Earth ScienceReference Tables, what is theapproximate dewpoint temperature ifthe dry-bulb temperature is 18DC andthe wet-bulb temperature is 11DC?A) -10DCB) 7DC
C) 4DCD) 1DC
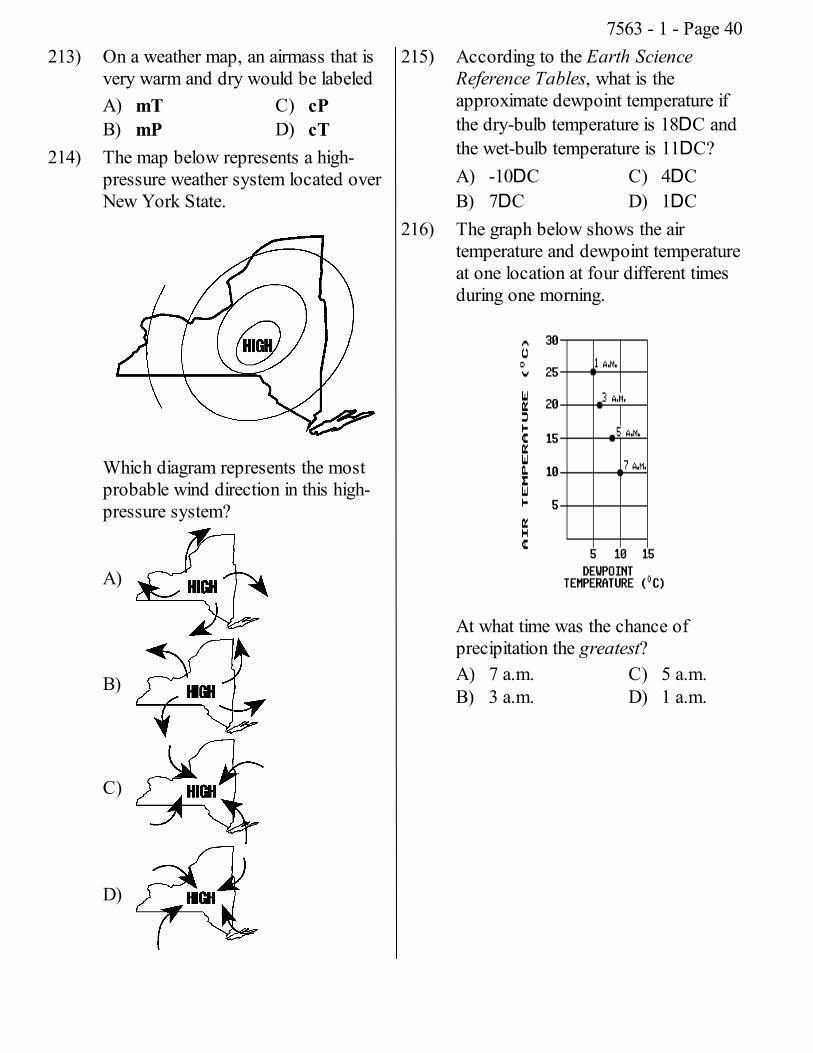
216) The graph below shows the airtemperature and dewpoint temperatureat one location at four different timesduring one morning.
At what time was the chance ofprecipitation the greatest?A) 7 a.m.B) 3 a.m.
C) 5 a.m.D) 1 a.m.
7563 - 1 - Page 40
217) Which one of the following statementsbest explains why climates atcontinental shorelines generally have asmaller yearly temperature range thaninland climates at the same latitude?A) Land changes temperature
rapidly, due to the high specificheat and lack of transparency ofland.
B) Ocean water is a good absorberand a good conductor of heatenergy.
C) Ocean water changes temperatureslowly, due to the high specificheat and transparency of water.
D) Land is a poor absorber and apoor conductor of heat energy.
218) A temperature of 73D Fahrenheit isapproximately equal to a temperatureofA) 23D CelsiusB) 17D CelsiusC) 26D CelsiusD) 162D Celsius
219) Which statement best explains whyprecipitation occurs at the frontalsurfaces between air masses?A) Cold fronts move slower than
warm fronts.B) Cold fronts move faster than
warm fronts.C) Warm, moist air rises when it
meets cold, dry air.D) Warm, moist air sinks when it
meets cold, dry air.
220) During the summer months, whichchange in location would most likelycause a decrease in the observeddaytime air temperatures?A) from sea level to 5 km above sea
levelB) from the ocean coast to an inland
locationC) from sea level on the windward
side of a mountain to sea level onthe leeward side
D) from 45DN latitude to 20DNlatitude
221) The base of a cumulus cloud wasdetermined to be 500 meters abovethe Earth's surface. This is the altitudeat whichA) no dust is present in the airB) the air temperature drops below
0DCC) cumulus clouds always formD) the air temperature equals the
dewpoint temperature
7563 - 1 - Page 41
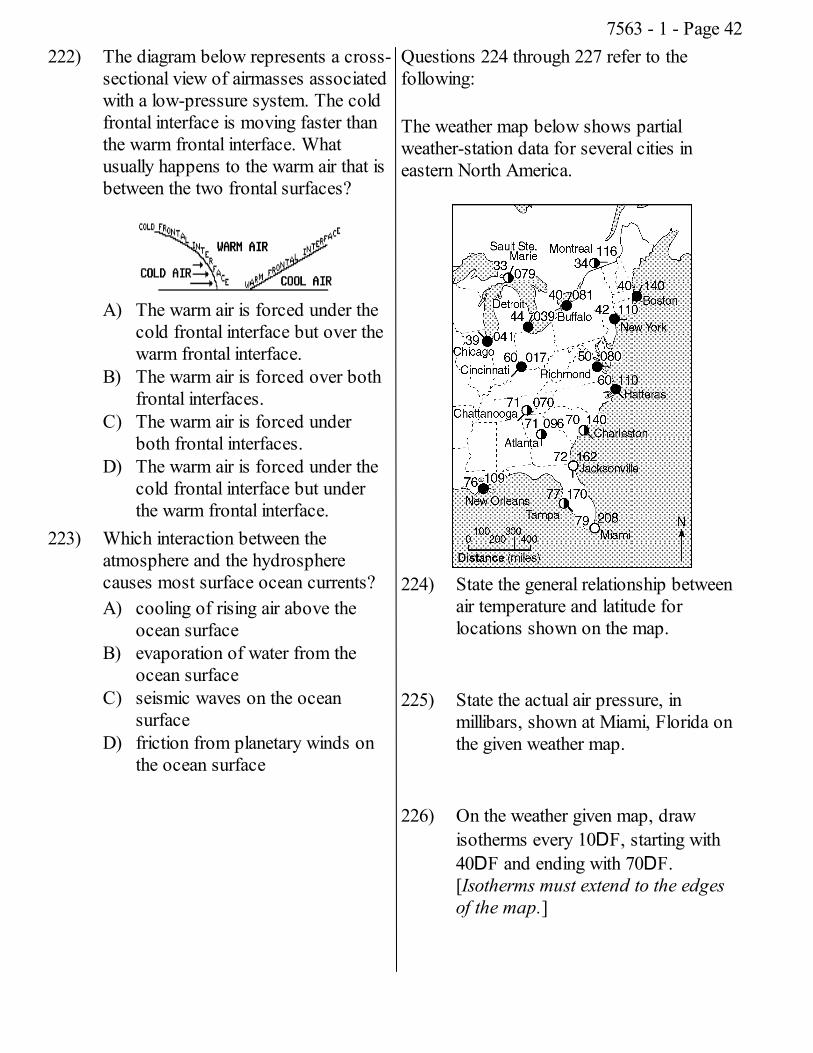
222) The diagram below represents a cross-sectional view of airmasses associatedwith a low-pressure system. The coldfrontal interface is moving faster thanthe warm frontal interface. Whatusually happens to the warm air that isbetween the two frontal surfaces?
A) The warm air is forced under thecold frontal interface but over thewarm frontal interface.
B) The warm air is forced over bothfrontal interfaces.
C) The warm air is forced underboth frontal interfaces.
D) The warm air is forced under thecold frontal interface but underthe warm frontal interface.
223) Which interaction between theatmosphere and the hydrospherecauses most surface ocean currents?A) cooling of rising air above the
ocean surfaceB) evaporation of water from the
ocean surfaceC) seismic waves on the ocean
surfaceD) friction from planetary winds on
the ocean surface
Questions 224 through 227 refer to thefollowing:
The weather map below shows partialweather-station data for several cities ineastern North America.
224) State the general relationship betweenair temperature and latitude forlocations shown on the map.
225) State the actual air pressure, inmillibars, shown at Miami, Florida onthe given weather map.
226) On the weather given map, drawisotherms every 10DF, starting with40DF and ending with 70DF.[Isotherms must extend to the edgesof the map.]
7563 - 1 - Page 42
227) Based on the given weather map,calculate the temperature gradientbetween Richmond, Virginia, andHatteras, North Carolina, by followingthe directions below.
(a) Write the equation for gradient.(b) Substitute data from the given map
into the equation.(c) Calculate the average gradient and
label your answer with the correctunits.
228) Most water vapor enters theatmosphere by the processes ofA) convection and radiationB) evaporation and transpirationC) condensation and precipitationD) erosion and conduction
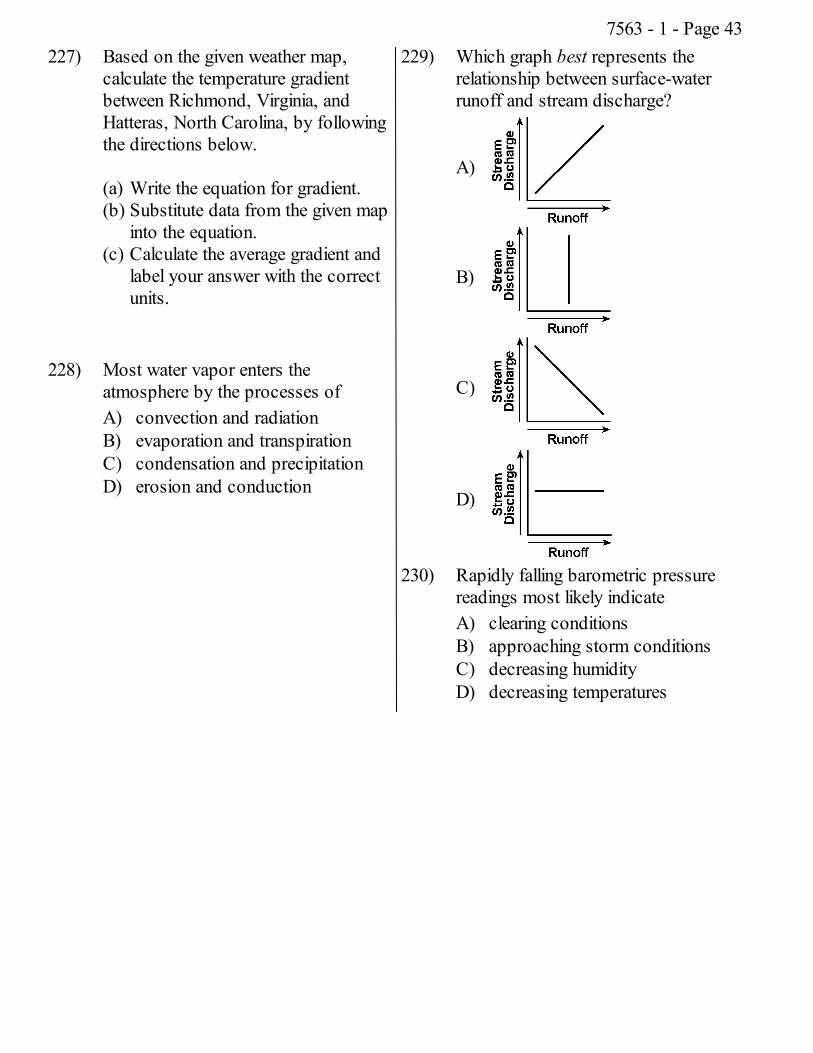
229) Which graph best represents therelationship between surface-waterrunoff and stream discharge?
A)
B)
C)
D)
230) Rapidly falling barometric pressurereadings most likely indicateA) clearing conditionsB) approaching storm conditionsC) decreasing humidityD) decreasing temperatures
7563 - 1 - Page 43
231) Which station model represents anatmospheric pressure of1,009.2 millibars and a temperature of75DF?
A)
B)
C)
D)
232) In the Northern Hemisphere, what isthe direction of surface windcirculation in a high-pressure system?A) clockwise and toward the centerB) clockwise and outward from the
centerC) counterclockwise and toward the
centerD) counterclockwise and outward
from the center233) The primary reason that clouds rarely
form in the stratosphere is thatA) ozone prevents the formation of
cloudsB) very little water vapor is present
in the stratosphereC) no condensation nuclei are
present in the stratosphereD) the temperature is too high for
clouds to form
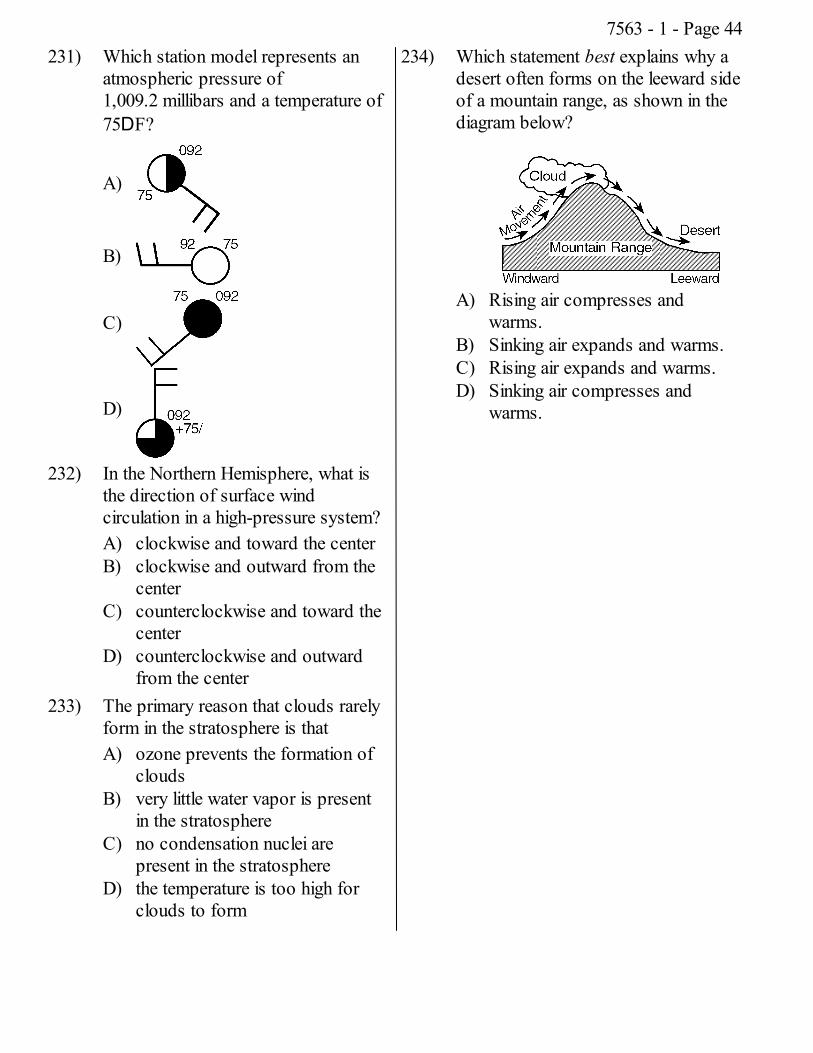
234) Which statement best explains why adesert often forms on the leeward sideof a mountain range, as shown in thediagram below?
A) Rising air compresses andwarms.
B) Sinking air expands and warms.C) Rising air expands and warms.D) Sinking air compresses and
warms.
7563 - 1 - Page 44
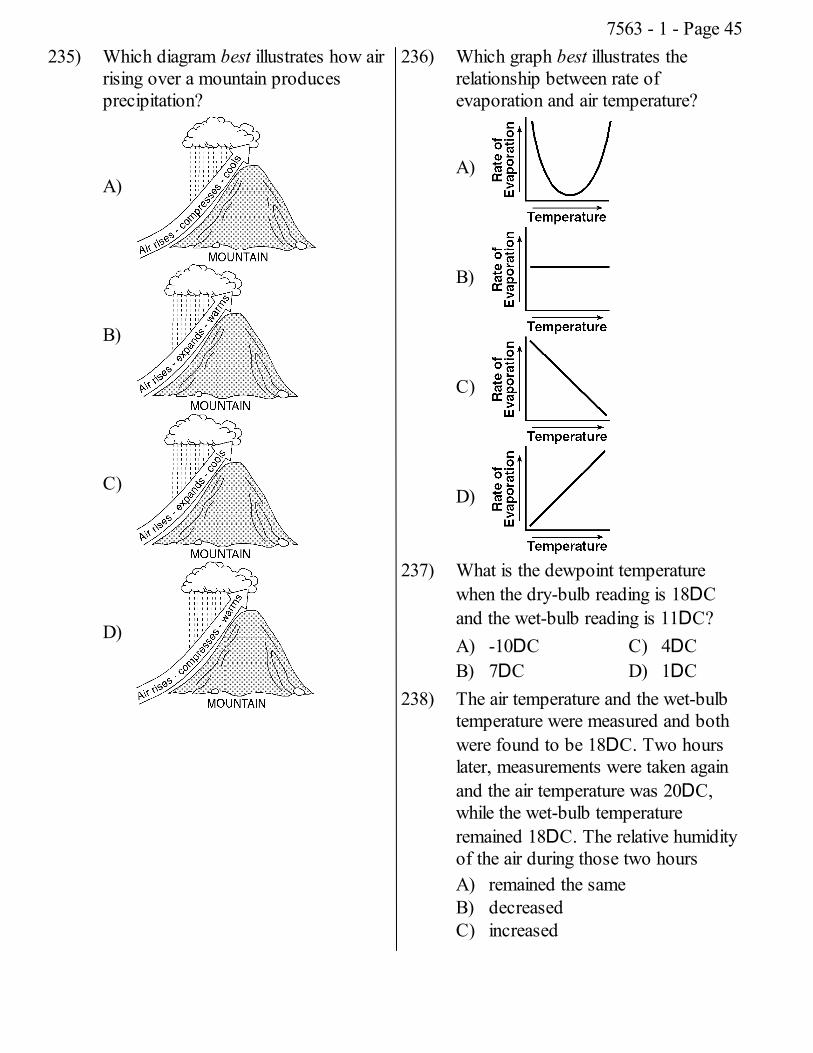
235) Which diagram best illustrates how airrising over a mountain producesprecipitation?
A)
B)
C)
D)
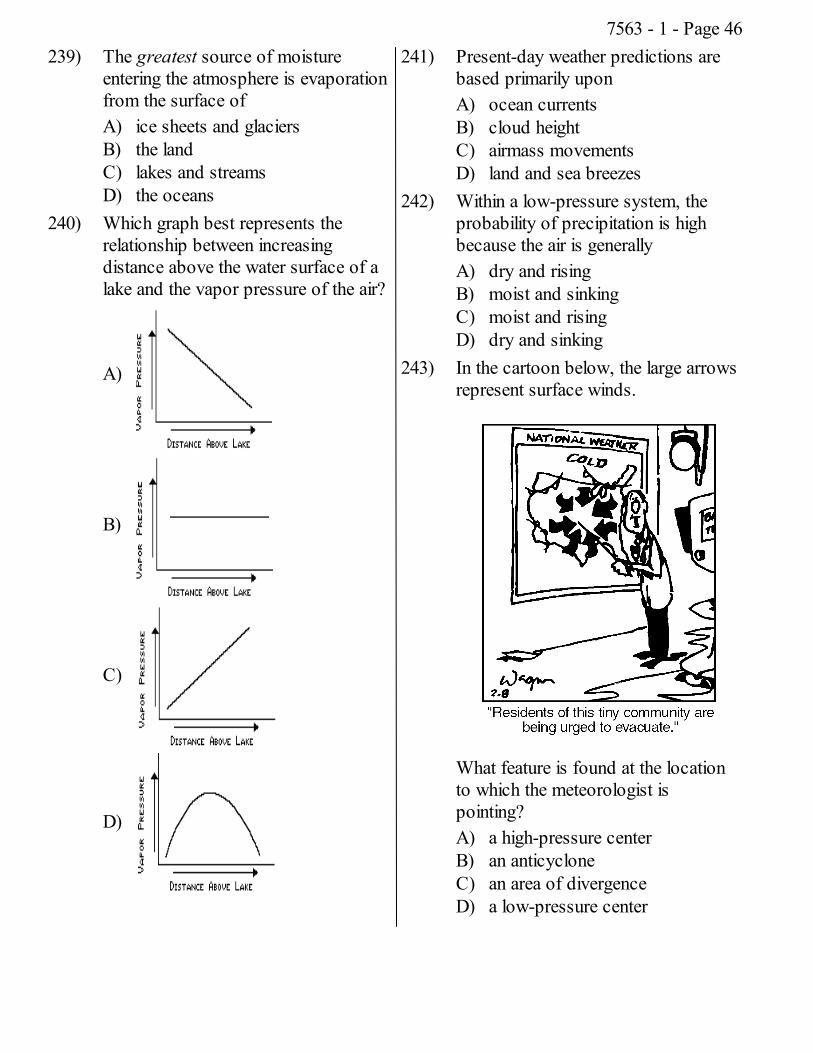
236) Which graph best illustrates therelationship between rate ofevaporation and air temperature?
A)
B)
C)
D)
237) What is the dewpoint temperaturewhen the dry-bulb reading is 18DCand the wet-bulb reading is 11DC?A) -10DCB) 7DC
C) 4DCD) 1DC
238) The air temperature and the wet-bulbtemperature were measured and bothwere found to be 18DC. Two hourslater, measurements were taken againand the air temperature was 20DC,while the wet-bulb temperatureremained 18DC. The relative humidityof the air during those two hoursA) remained the sameB) decreasedC) increased
7563 - 1 - Page 45
239) The greatest source of moistureentering the atmosphere is evaporationfrom the surface ofA) ice sheets and glaciersB) the landC) lakes and streamsD) the oceans
240) Which graph best represents therelationship between increasingdistance above the water surface of alake and the vapor pressure of the air?
A)
B)
C)
D)
241) Present-day weather predictions arebased primarily uponA) ocean currentsB) cloud heightC) airmass movementsD) land and sea breezes
242) Within a low-pressure system, theprobability of precipitation is highbecause the air is generallyA) dry and risingB) moist and sinkingC) moist and risingD) dry and sinking
243) In the cartoon below, the large arrowsrepresent surface winds.
What feature is found at the locationto which the meteorologist ispointing?A) a high-pressure centerB) an anticycloneC) an area of divergenceD) a low-pressure center
7563 - 1 - Page 46
244) Which single factor generally has thegreatest effect on the climate of anarea on the Earth's surface?A) the month of the yearB) the degrees of longitudeC) the extent of vegetative coverD) the distance from the Equator
245) A low-pressure center located in themidwestern United States generallymoves toward theA) southeastB) northeastC) northwestD) southwest
246) Which weather station modelrepresents a location where athunderstorm is occurring?
A)
B)
C)
D)
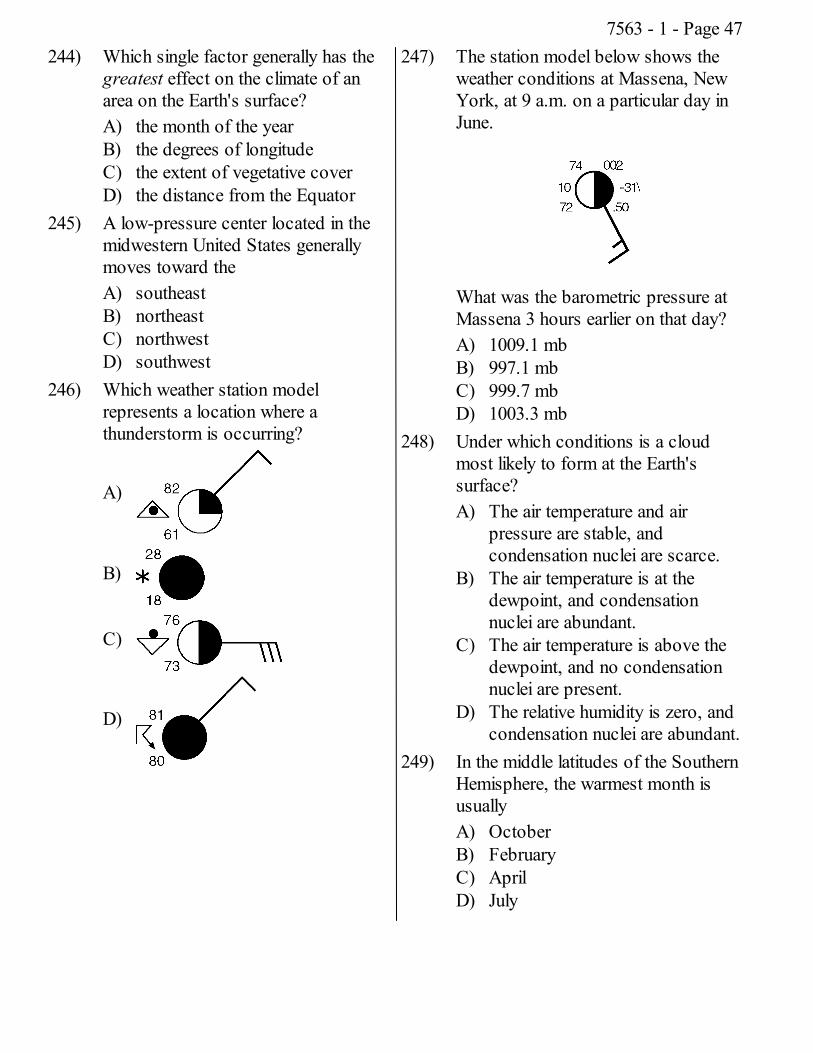
247) The station model below shows theweather conditions at Massena, NewYork, at 9 a.m. on a particular day inJune.
What was the barometric pressure atMassena 3 hours earlier on that day?A) 1009.1 mbB) 997.1 mbC) 999.7 mbD) 1003.3 mb
248) Under which conditions is a cloudmost likely to form at the Earth'ssurface?A) The air temperature and air
pressure are stable, andcondensation nuclei are scarce.
B) The air temperature is at thedewpoint, and condensationnuclei are abundant.
C) The air temperature is above thedewpoint, and no condensationnuclei are present.
D) The relative humidity is zero, andcondensation nuclei are abundant.
249) In the middle latitudes of the SouthernHemisphere, the warmest month isusuallyA) OctoberB) FebruaryC) AprilD) July
7563 - 1 - Page 47
250) What is the dewpoint when the dry-bulb temperature is 24DC and the wet-bulb temperature is 15DC?A) -18DCB) 8DC
C) 36DCD) 4DC
251) What is the dewpoint temperaturewhen the dry-bulb temperature is16DC and the wet-bulb temperature is11DC?A) 9DCB) 7DC
C) -17DCD) 5DC
252) Two coastal cities have the samelatitude and elevation, but are locatednear different oceans. Whichstatement best explains why the twocities have different climates?A) They are at different longitudes.B) They are near different ocean
currents.C) They have different angles of
insolation.D) They have different numbers of
daylight hours.
Questions 253 through 255 refer to thefollowing:
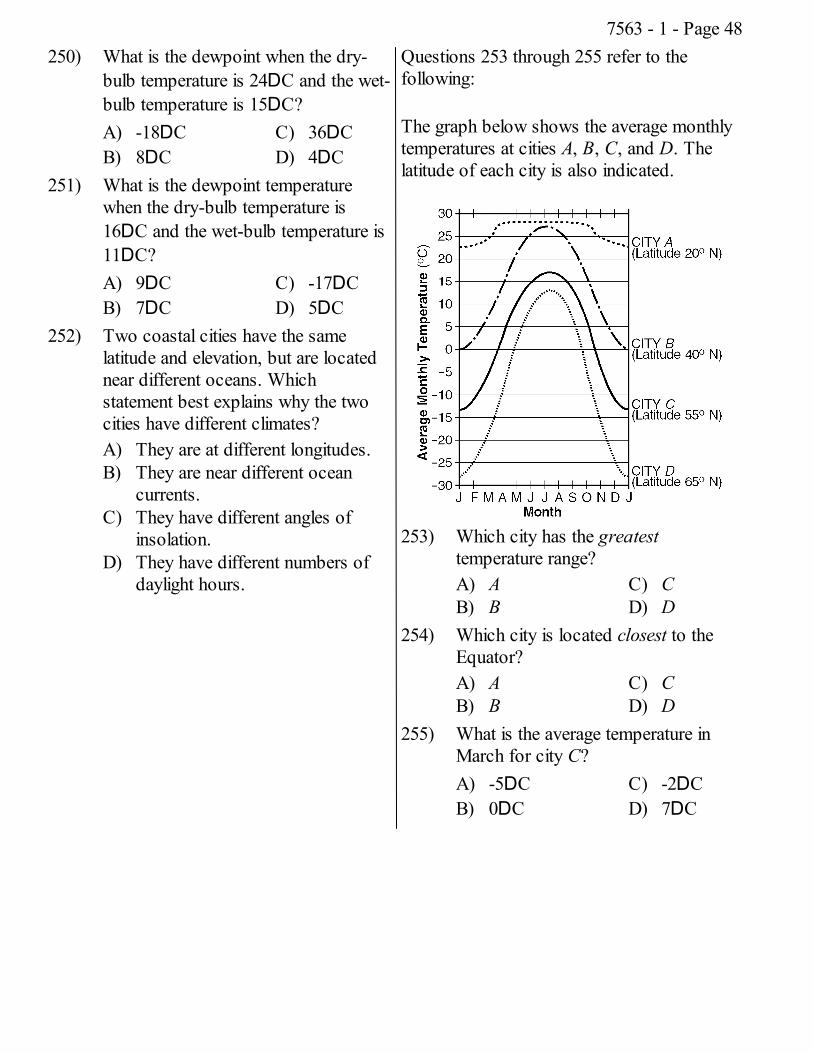
The graph below shows the average monthlytemperatures at cities A, B, C, and D. Thelatitude of each city is also indicated.
253) Which city has the greatesttemperature range?A) AB) B
C) CD) D
254) Which city is located closest to theEquator?A) AB) B
C) CD) D
255) What is the average temperature inMarch for city C?A) -5DCB) 0DC
C) -2DCD) 7DC
7563 - 1 - Page 48
256) On a July afternoon in New YorkState, the barometric pressure is29.85 inches and falling. This readingmost likely indicatesA) an approaching stormB) gradually improving conditionsC) rapidly clearing skiesD) continuing fair weather
257) As the difference between thedewpoint temperature and the airtemperature decreases, the probabilityof precipitationA) decreasesB) remains the sameC) increases
258) Which two changes increase the rateof evaporation of water into theatmosphere?A) decreasing air pressure and
increasing cloud coverB) increasing relative humidity and
decreasing dewpoint temperatureC) decreasing air temperature and
increasing surface areaD) increasing air temperature and
increasing wind velocity
259) Two cities are located at the samelatitude and elevation. One city,located in the center of the UnitedStates, has cooler winters and warmersummers than the other city, which islocated near the coast. Whichstatement best explains these seasonaldifferences?A) A large body of water modifies
coastal air temperatures.B) Warm ocean currents flow among
most coastlines.C) Cold airmasses usually originate
over continents.D) The air over continents is drier
than the air over oceans.260) An airmass originating over the North
Pacific Ocean would most likely beA) continental polarB) maritime polarC) maritime tropicalD) continental tropical
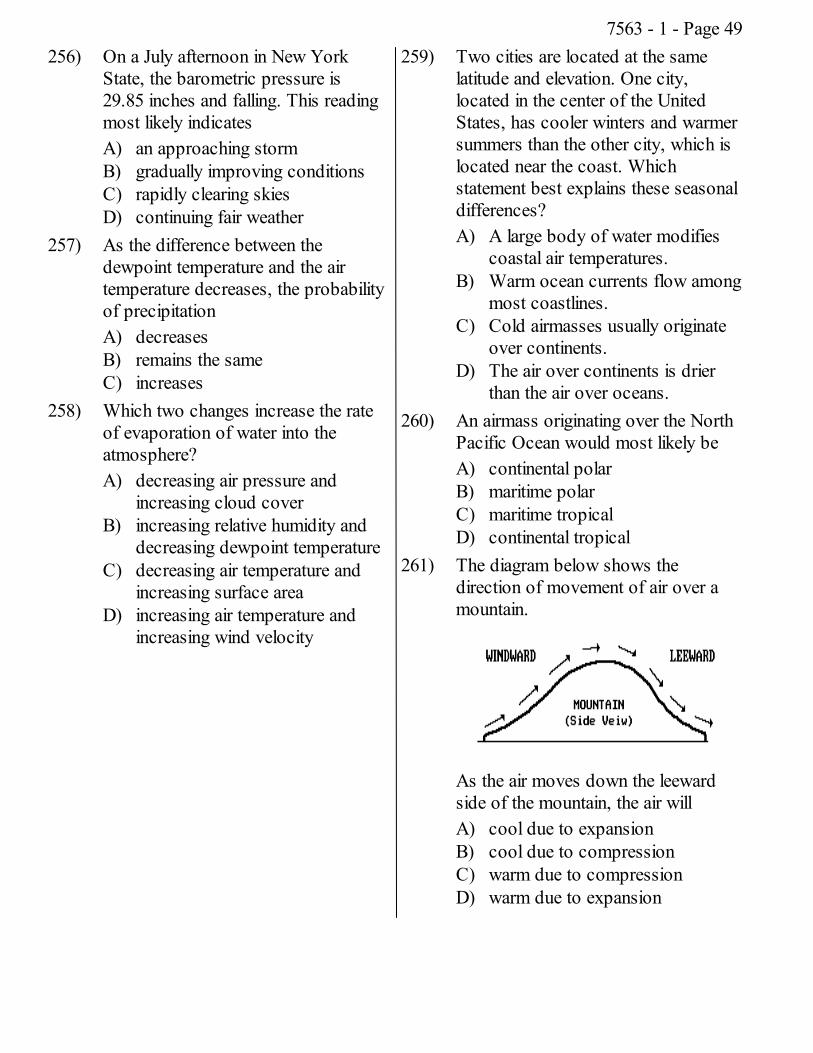
261) The diagram below shows thedirection of movement of air over amountain.
As the air moves down the leewardside of the mountain, the air willA) cool due to expansionB) cool due to compressionC) warm due to compressionD) warm due to expansion
7563 - 1 - Page 49
262) Which graph best shows therelationship between the probability ofprecipitation and the differencebetween air temperature anddewpoint?
A)
B)
C)
D)
263) A higher concentration of water vaporis found in the atmosphere over NewYork State in the summer than in thewinter because in the summer there isa greaterA) concentration of air pollutantsB) rate of evapotranspirationC) amount of water in ground
storageD) frequency of high pressure
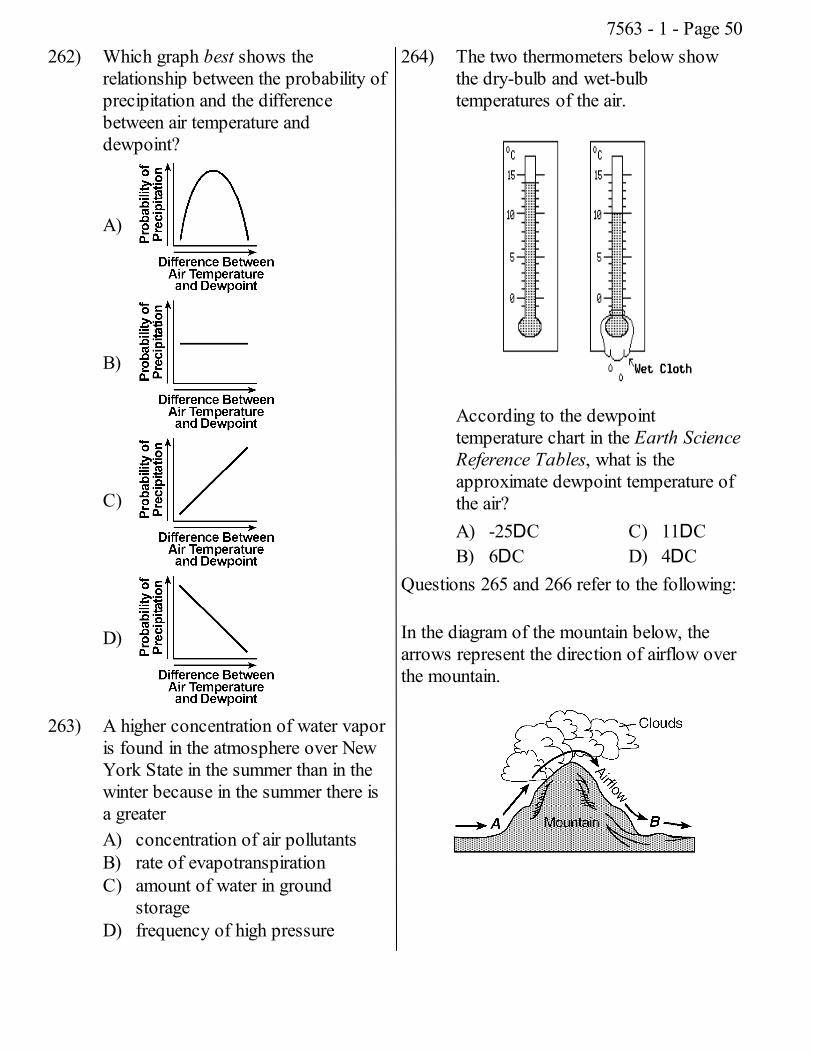
264) The two thermometers below showthe dry-bulb and wet-bulbtemperatures of the air.
According to the dewpointtemperature chart in the Earth ScienceReference Tables, what is theapproximate dewpoint temperature ofthe air?A) -25DCB) 6DC
C) 11DCD) 4DC
Questions 265 and 266 refer to the following:
In the diagram of the mountain below, thearrows represent the direction of airflow overthe mountain.
7563 - 1 - Page 50
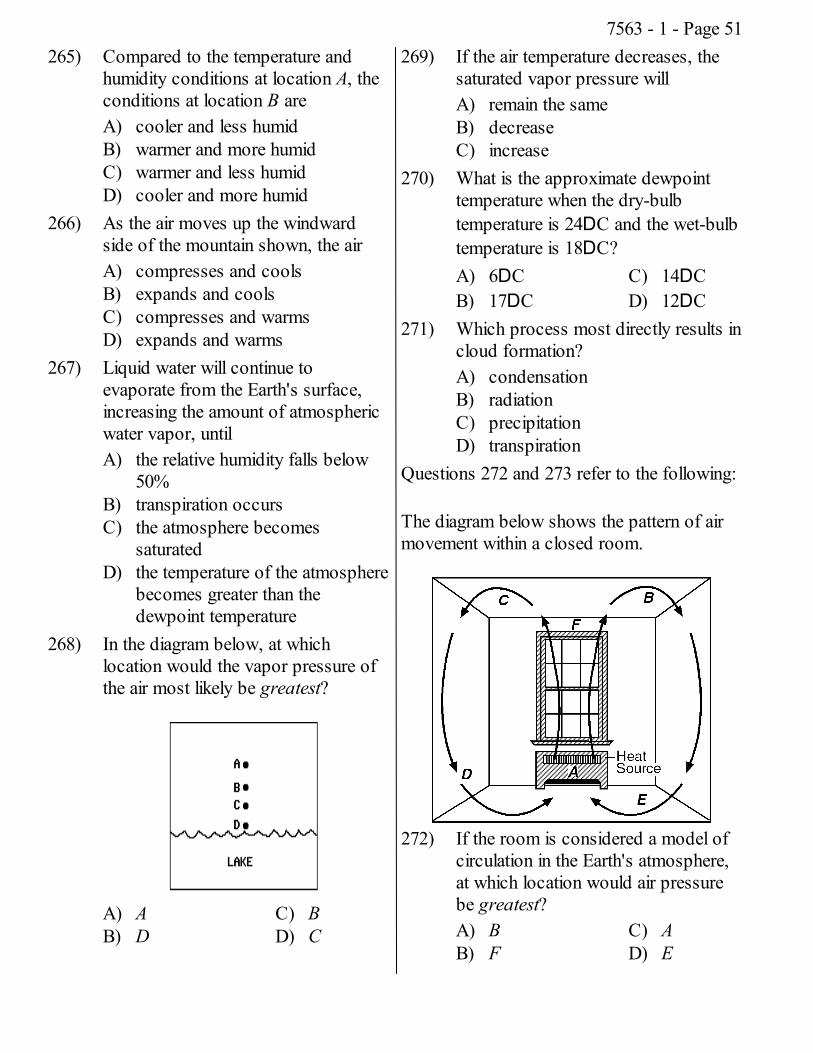
265) Compared to the temperature andhumidity conditions at location A, theconditions at location B areA) cooler and less humidB) warmer and more humidC) warmer and less humidD) cooler and more humid
266) As the air moves up the windwardside of the mountain shown, the airA) compresses and coolsB) expands and coolsC) compresses and warmsD) expands and warms
267) Liquid water will continue toevaporate from the Earth's surface,increasing the amount of atmosphericwater vapor, untilA) the relative humidity falls below
50%B) transpiration occursC) the atmosphere becomes
saturatedD) the temperature of the atmosphere
becomes greater than thedewpoint temperature
268) In the diagram below, at whichlocation would the vapor pressure ofthe air most likely be greatest?
A) AB) D
C) BD) C
269) If the air temperature decreases, thesaturated vapor pressure willA) remain the sameB) decreaseC) increase
270) What is the approximate dewpointtemperature when the dry-bulbtemperature is 24DC and the wet-bulbtemperature is 18DC?A) 6DCB) 17DC
C) 14DCD) 12DC
271) Which process most directly results incloud formation?A) condensationB) radiationC) precipitationD) transpiration
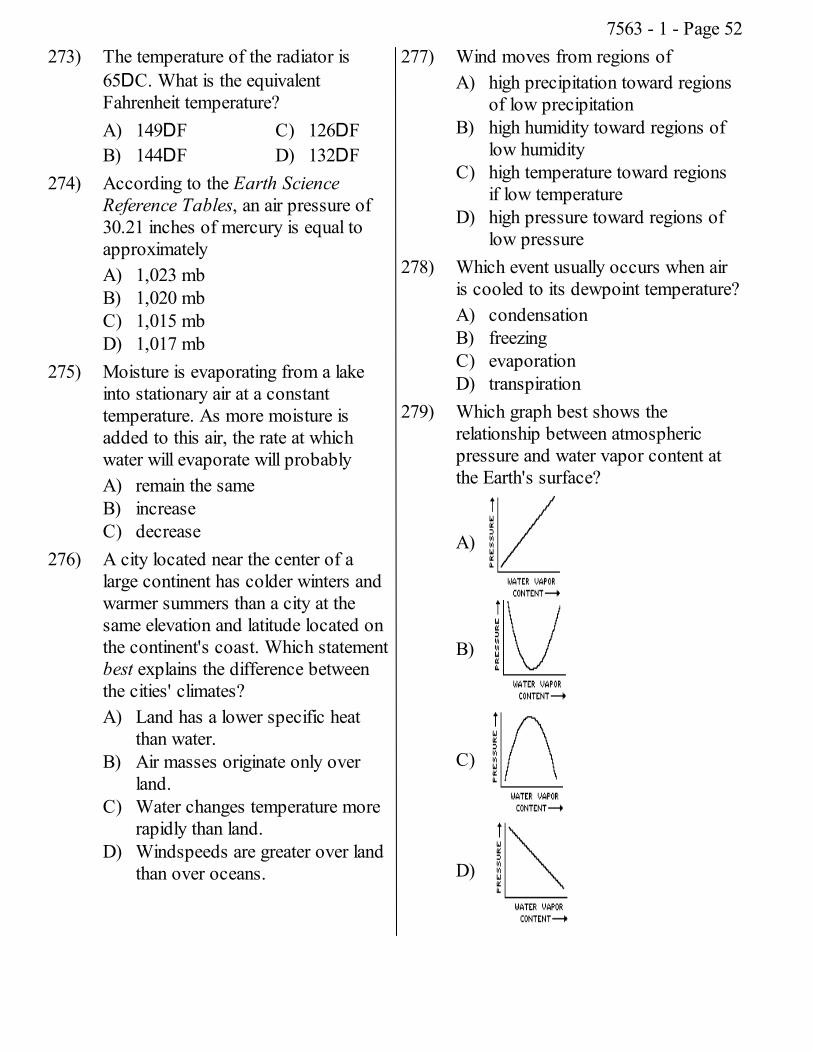
Questions 272 and 273 refer to the following:
The diagram below shows the pattern of airmovement within a closed room.
272) If the room is considered a model ofcirculation in the Earth's atmosphere,at which location would air pressurebe greatest?A) BB) F
C) AD) E
7563 - 1 - Page 51
273) The temperature of the radiator is65DC. What is the equivalentFahrenheit temperature?A) 149DFB) 144DF
C) 126DFD) 132DF
274) According to the Earth ScienceReference Tables, an air pressure of30.21 inches of mercury is equal toapproximatelyA) 1,023 mbB) 1,020 mbC) 1,015 mbD) 1,017 mb
275) Moisture is evaporating from a lakeinto stationary air at a constanttemperature. As more moisture isadded to this air, the rate at whichwater will evaporate will probablyA) remain the sameB) increaseC) decrease
276) A city located near the center of alarge continent has colder winters andwarmer summers than a city at thesame elevation and latitude located onthe continent's coast. Which statementbest explains the difference betweenthe cities' climates?A) Land has a lower specific heat
than water.B) Air masses originate only over
land.C) Water changes temperature more
rapidly than land.D) Windspeeds are greater over land
than over oceans.
277) Wind moves from regions ofA) high precipitation toward regions
of low precipitationB) high humidity toward regions of
low humidityC) high temperature toward regions
if low temperatureD) high pressure toward regions of
low pressure278) Which event usually occurs when air
is cooled to its dewpoint temperature?A) condensationB) freezingC) evaporationD) transpiration
279) Which graph best shows therelationship between atmosphericpressure and water vapor content atthe Earth's surface?
A)
B)
C)
D)
7563 - 1 - Page 52
280) When a person leaves the ocean afterswimming on a windy day, the personusually feels cold becauseA) water evaporates from the skinB) salt is absorbed through the skinC) water condenses on the skinD) radiation is absorbed through the
skin281) The change from the vapor phase to
the liquid phase is calledA) transpirationB) condensationC) precipitationD) evaporation
282) An Earth science class is preparing abooklet on emergency preparedness.State one safety measure that shouldbe taken to minimize danger fromeach of the following threats:
(1) thunderstorm(2) tornado(3) volcanic eruption
283) The direction of surface oceancurrents is influenced most byA) planetary windsB) variations in salinity of the waterC) variations in density of the waterD) land breezes and sea breezes
284) A high air-pressure, dry-climate belt islocated at which Earth latitude?A) 60DNB) 0D
C) 30DND) 15DN
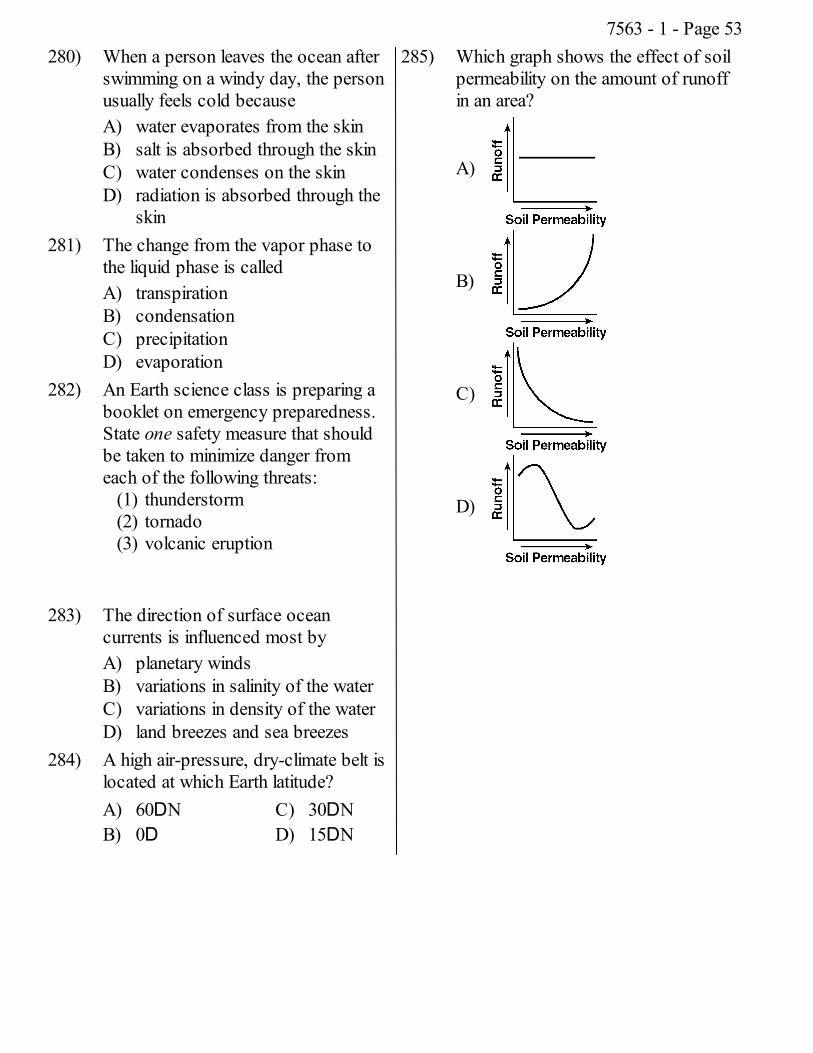
285) Which graph shows the effect of soilpermeability on the amount of runoffin an area?
A)
B)
C)
D)
7563 - 1 - Page 53
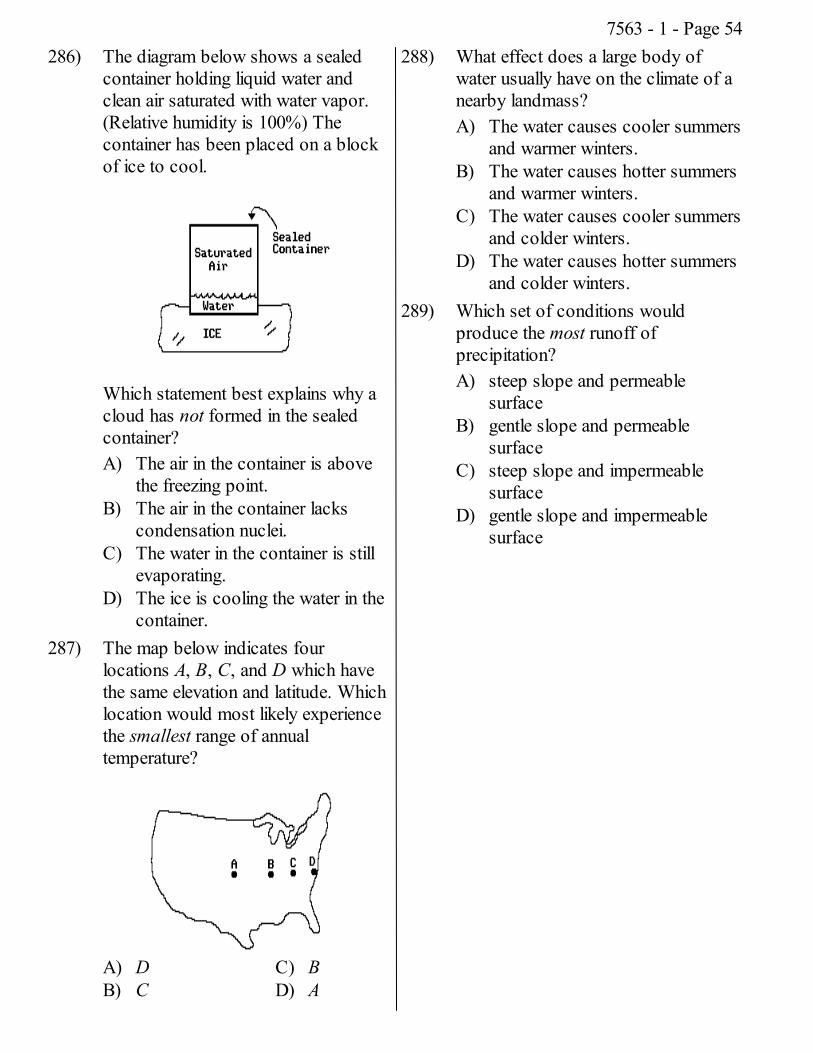
286) The diagram below shows a sealedcontainer holding liquid water andclean air saturated with water vapor.(Relative humidity is 100%) Thecontainer has been placed on a blockof ice to cool.
Which statement best explains why acloud has not formed in the sealedcontainer?A) The air in the container is above
the freezing point.B) The air in the container lacks
condensation nuclei.C) The water in the container is still
evaporating.D) The ice is cooling the water in the
container.287) The map below indicates four
locations A, B, C, and D which havethe same elevation and latitude. Whichlocation would most likely experiencethe smallest range of annualtemperature?
A) DB) C
C) BD) A
288) What effect does a large body ofwater usually have on the climate of anearby landmass?A) The water causes cooler summers
and warmer winters.B) The water causes hotter summers
and warmer winters.C) The water causes cooler summers
and colder winters.D) The water causes hotter summers
and colder winters.289) Which set of conditions would
produce the most runoff ofprecipitation?A) steep slope and permeable
surfaceB) gentle slope and permeable
surfaceC) steep slope and impermeable
surfaceD) gentle slope and impermeable
surface
7563 - 1 - Page 54
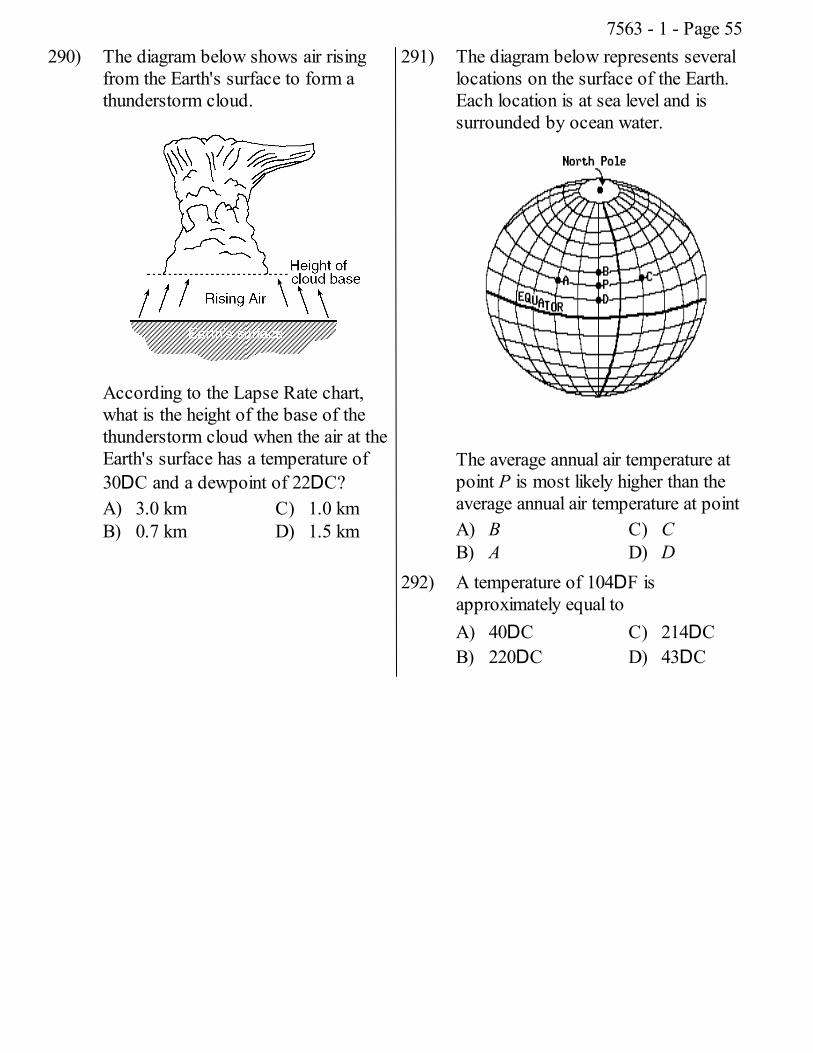
290) The diagram below shows air risingfrom the Earth's surface to form athunderstorm cloud.
According to the Lapse Rate chart,what is the height of the base of thethunderstorm cloud when the air at theEarth's surface has a temperature of30DC and a dewpoint of 22DC?A) 3.0 kmB) 0.7 km
C) 1.0 kmD) 1.5 km
291) The diagram below represents severallocations on the surface of the Earth.Each location is at sea level and issurrounded by ocean water.
The average annual air temperature atpoint P is most likely higher than theaverage annual air temperature at pointA) BB) A
C) CD) D
292) A temperature of 104DF isapproximately equal toA) 40DCB) 220DC
C) 214DCD) 43DC
7563 - 1 - Page 55
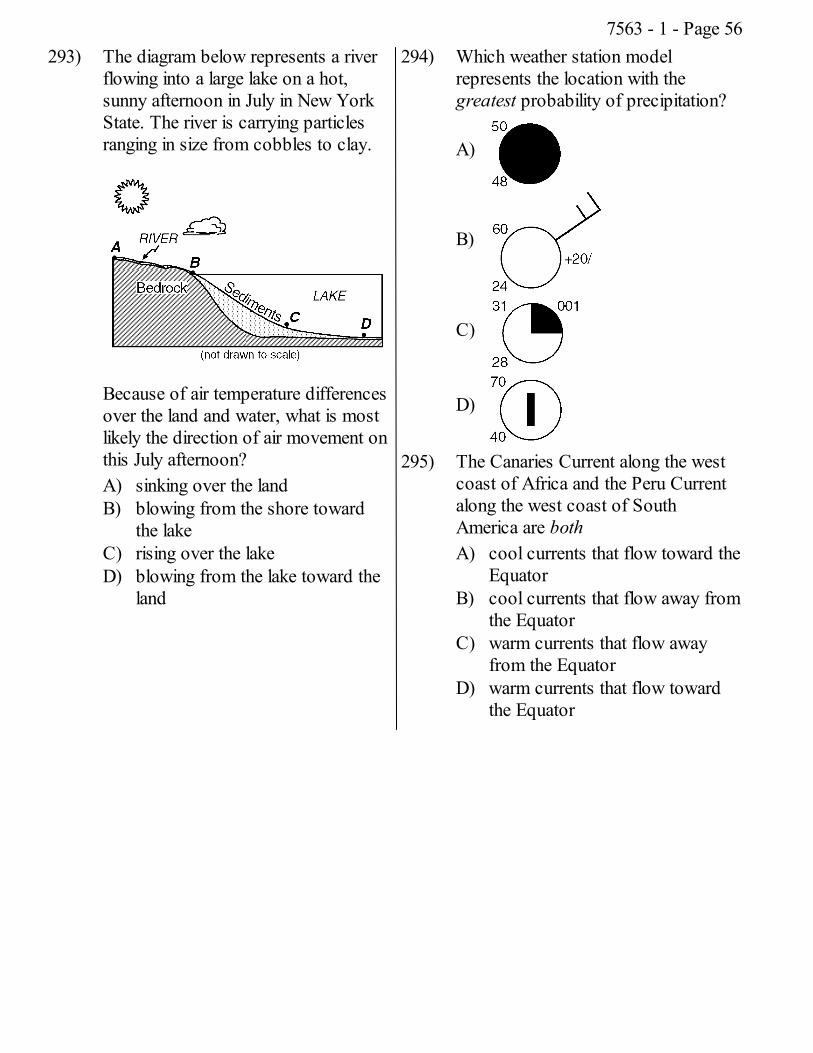
293) The diagram below represents a riverflowing into a large lake on a hot,sunny afternoon in July in New YorkState. The river is carrying particlesranging in size from cobbles to clay.
Because of air temperature differencesover the land and water, what is mostlikely the direction of air movement onthis July afternoon?A) sinking over the landB) blowing from the shore toward
the lakeC) rising over the lakeD) blowing from the lake toward the
land
294) Which weather station modelrepresents the location with thegreatest probability of precipitation?
A)
B)
C)
D)
295) The Canaries Current along the westcoast of Africa and the Peru Currentalong the west coast of SouthAmerica are bothA) cool currents that flow toward the
EquatorB) cool currents that flow away from
the EquatorC) warm currents that flow away
from the EquatorD) warm currents that flow toward
the Equator
7563 - 1 - Page 56
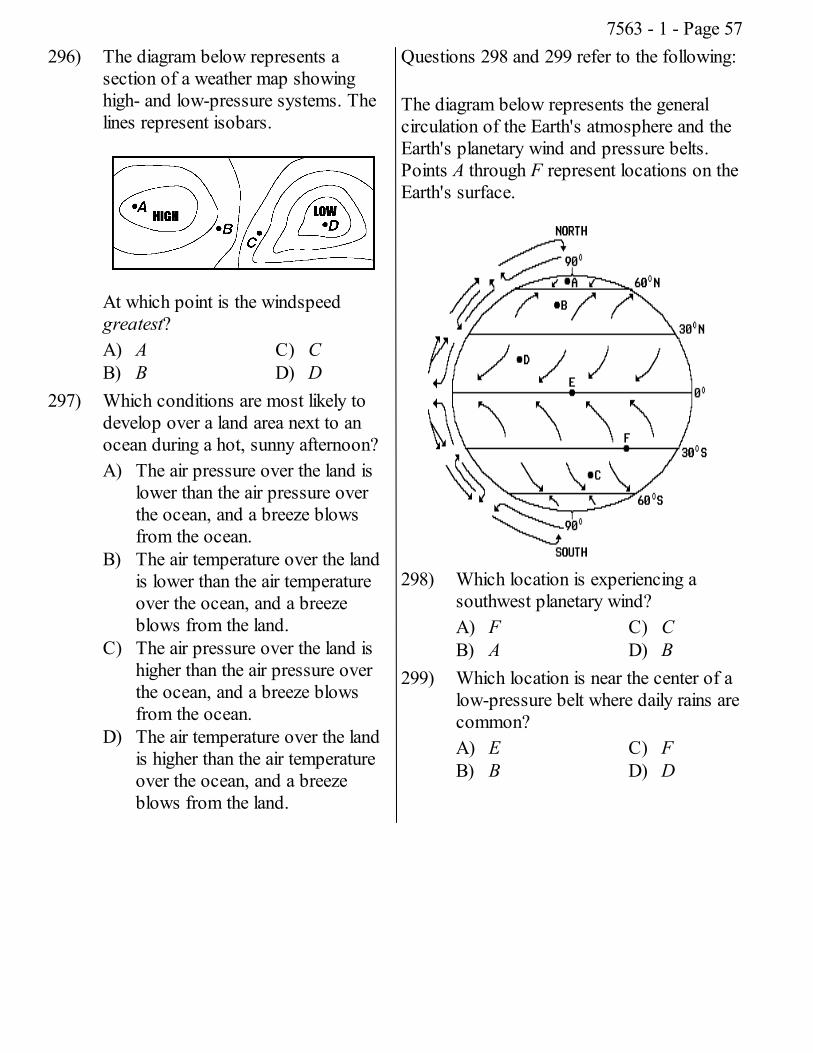
296) The diagram below represents asection of a weather map showinghigh- and low-pressure systems. Thelines represent isobars.
At which point is the windspeedgreatest?A) AB) B
C) CD) D
297) Which conditions are most likely todevelop over a land area next to anocean during a hot, sunny afternoon?A) The air pressure over the land is
lower than the air pressure overthe ocean, and a breeze blowsfrom the ocean.
B) The air temperature over the landis lower than the air temperatureover the ocean, and a breezeblows from the land.
C) The air pressure over the land ishigher than the air pressure overthe ocean, and a breeze blowsfrom the ocean.
D) The air temperature over the landis higher than the air temperatureover the ocean, and a breezeblows from the land.
Questions 298 and 299 refer to the following:
The diagram below represents the generalcirculation of the Earth's atmosphere and theEarth's planetary wind and pressure belts.Points A through F represent locations on theEarth's surface.
298) Which location is experiencing asouthwest planetary wind?A) FB) A
C) CD) B
299) Which location is near the center of alow-pressure belt where daily rains arecommon?A) EB) B
C) FD) D
7563 - 1 - Page 57
300) Condensation of water vapor in theatmosphere is most likely to occurwhen a condensation surface isavailable andA) the temperature of the air is below
0DCB) the air is saturated with water
vaporC) the air pressure is risingD) a strong wind is blowing
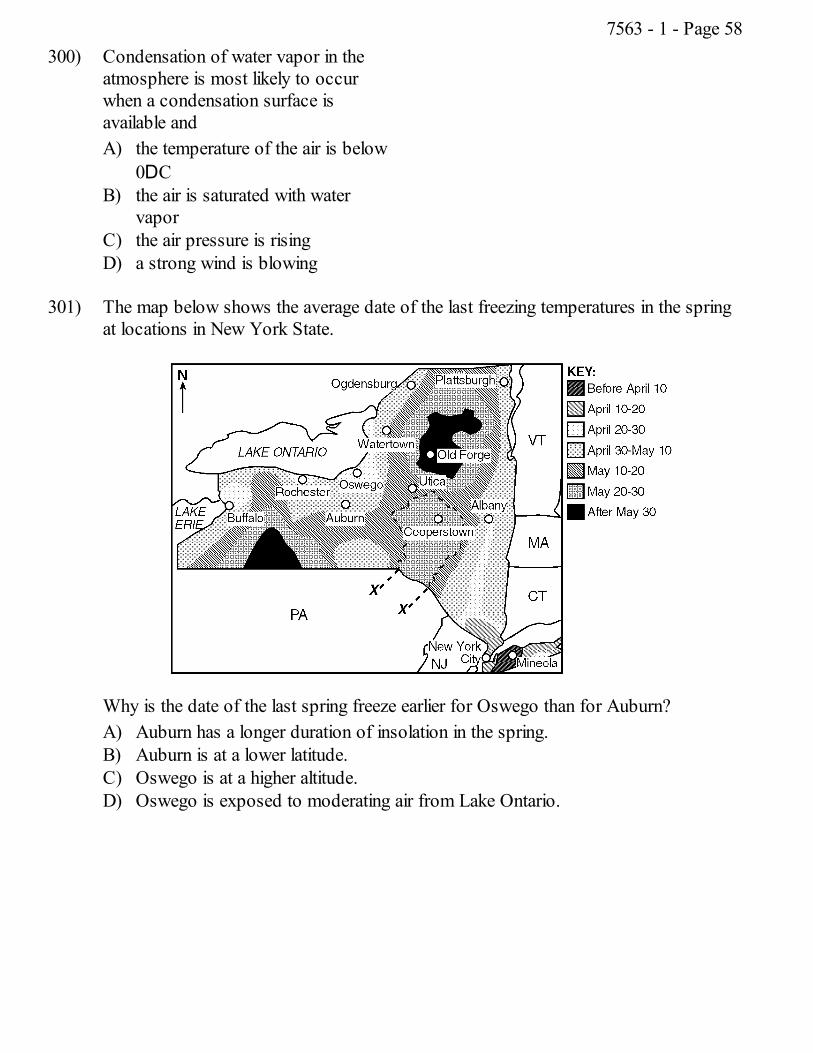
301) The map below shows the average date of the last freezing temperatures in the springat locations in New York State.
Why is the date of the last spring freeze earlier for Oswego than for Auburn?A) Auburn has a longer duration of insolation in the spring.B) Auburn is at a lower latitude.C) Oswego is at a higher altitude.D) Oswego is exposed to moderating air from Lake Ontario.
7563 - 1 - Page 58
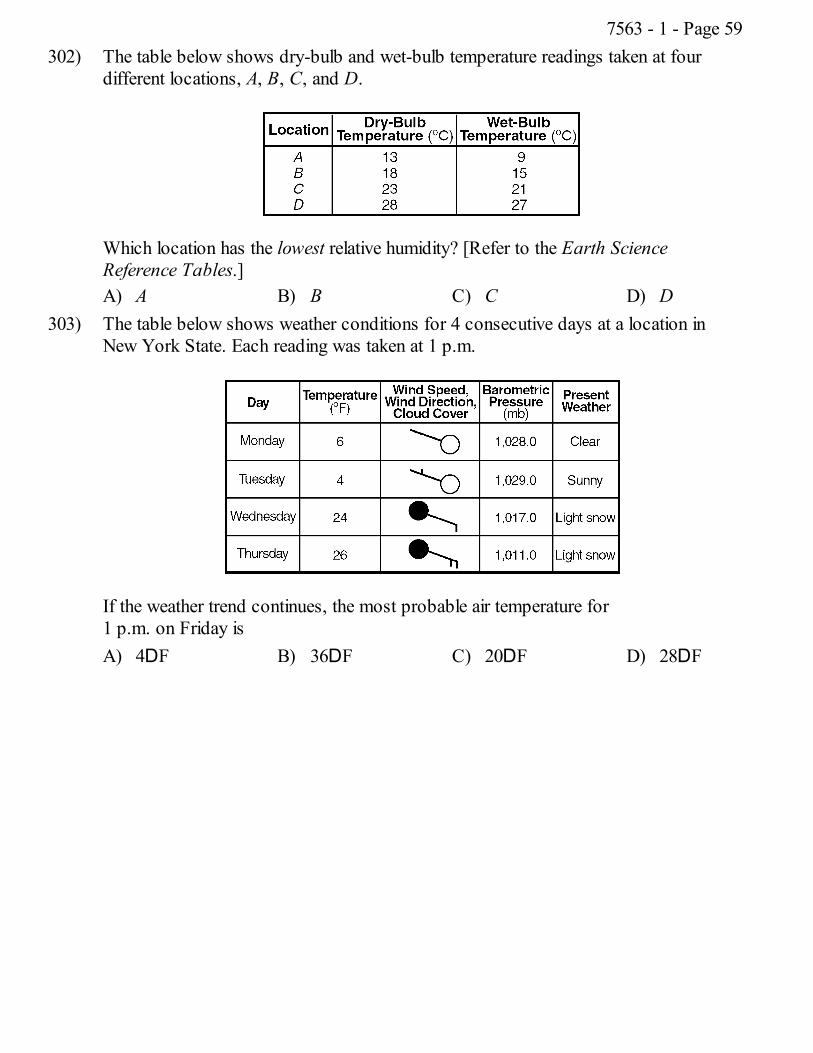
302) The table below shows dry-bulb and wet-bulb temperature readings taken at fourdifferent locations, A, B, C, and D.
Which location has the lowest relative humidity? [Refer to the Earth ScienceReference Tables.]A) A B) B C) C D) D
303) The table below shows weather conditions for 4 consecutive days at a location inNew York State. Each reading was taken at 1 p.m.
If the weather trend continues, the most probable air temperature for1 p.m. on Friday isA) 4DF B) 36DF C) 20DF D) 28DF
7563 - 1 - Page 59
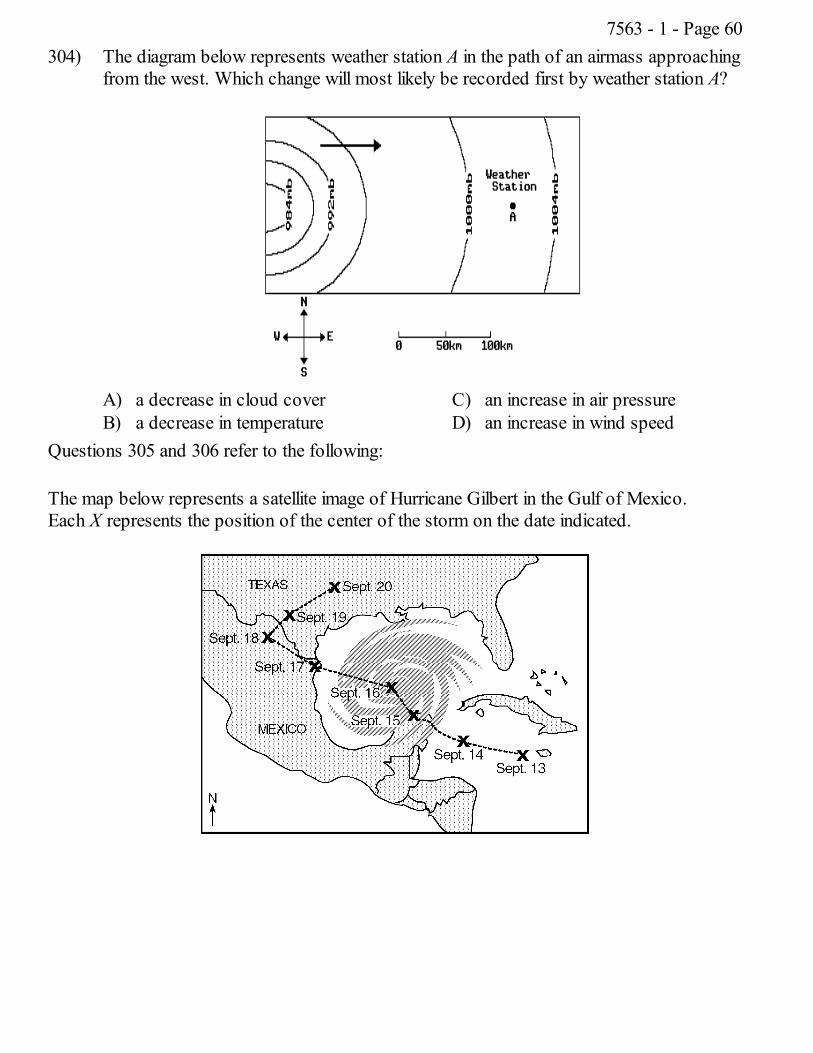
304) The diagram below represents weather station A in the path of an airmass approachingfrom the west. Which change will most likely be recorded first by weather station A?
A) a decrease in cloud coverB) a decrease in temperature
C) an increase in air pressureD) an increase in wind speed
Questions 305 and 306 refer to the following:
The map below represents a satellite image of Hurricane Gilbert in the Gulf of Mexico.Each X represents the position of the center of the storm on the date indicated.
7563 - 1 - Page 60
305) Describe one threat to human life andproperty that could have been causedby the arrival of Hurricane Gilbertalong the coastline at the Texas-Mexico border in the given map.
306) State one reason Hurricane Gilbertweakened between September 16 andSeptember 18 in the given map.
Questions 307 through 309 refer to the following:
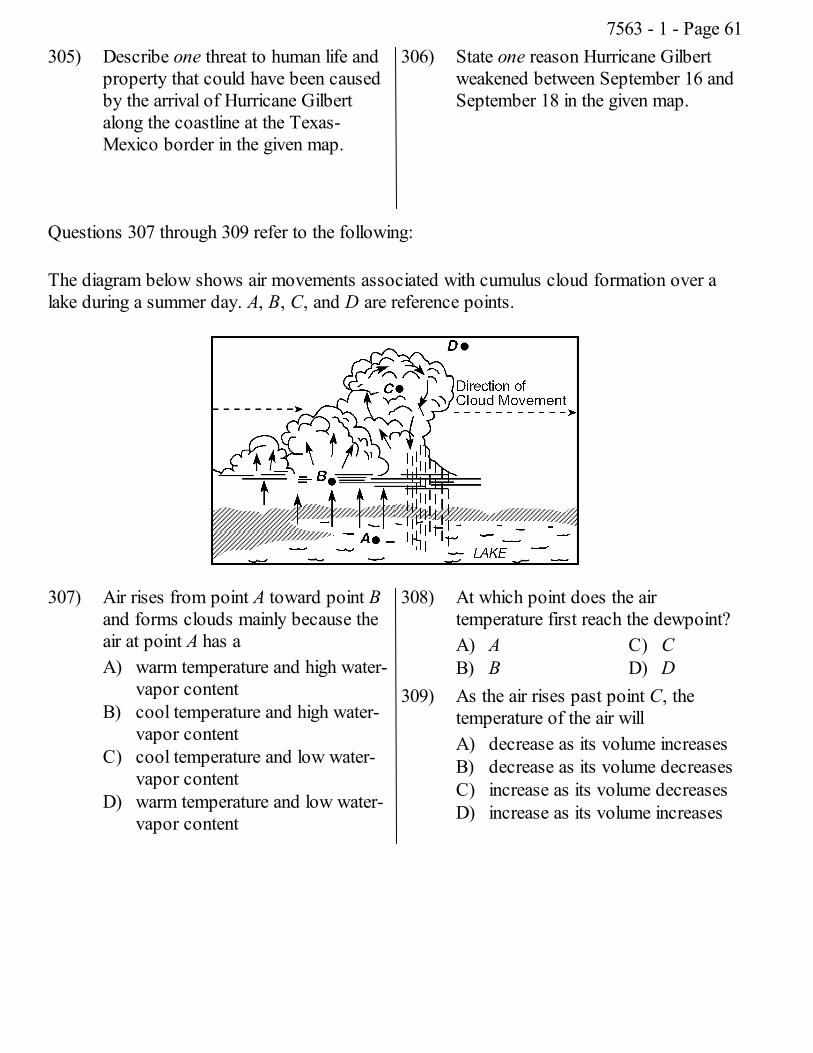
The diagram below shows air movements associated with cumulus cloud formation over alake during a summer day. A, B, C, and D are reference points.
307) Air rises from point A toward point Band forms clouds mainly because theair at point A has aA) warm temperature and high water-
vapor contentB) cool temperature and high water-
vapor contentC) cool temperature and low water-
vapor contentD) warm temperature and low water-
vapor content
308) At which point does the airtemperature first reach the dewpoint?A) AB) B
C) CD) D
309) As the air rises past point C, thetemperature of the air willA) decrease as its volume increasesB) decrease as its volume decreasesC) increase as its volume decreasesD) increase as its volume increases
7563 - 1 - Page 61
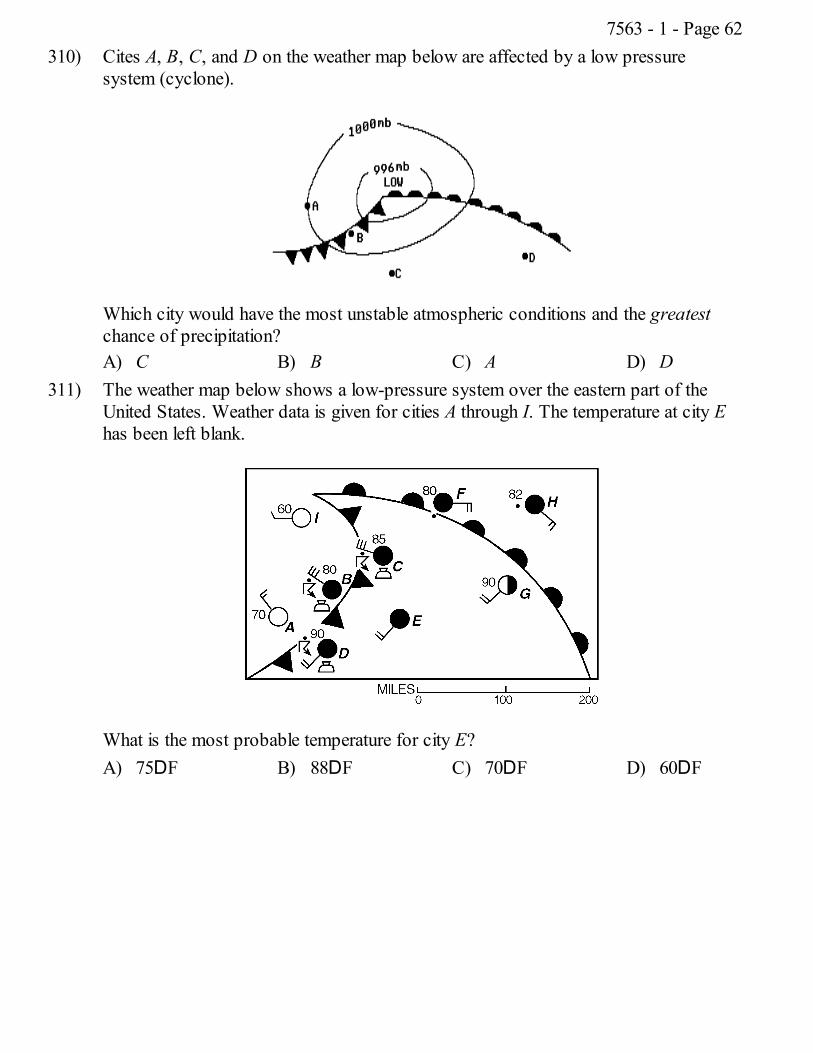
310) Cites A, B, C, and D on the weather map below are affected by a low pressuresystem (cyclone).
Which city would have the most unstable atmospheric conditions and the greatestchance of precipitation?A) C B) B C) A D) D
311) The weather map below shows a low-pressure system over the eastern part of theUnited States. Weather data is given for cities A through I. The temperature at city Ehas been left blank.
What is the most probable temperature for city E?A) 75DF B) 88DF C) 70DF D) 60DF
7563 - 1 - Page 62
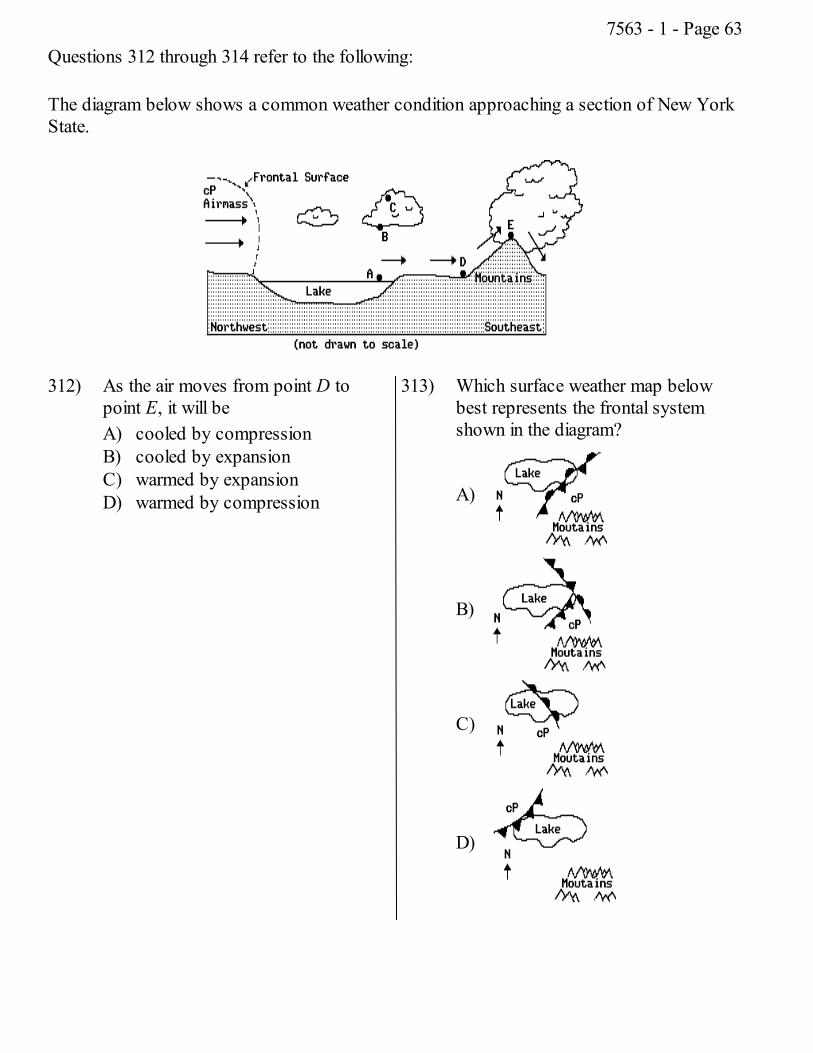
Questions 312 through 314 refer to the following:
The diagram below shows a common weather condition approaching a section of New YorkState.
312) As the air moves from point D topoint E, it will beA) cooled by compressionB) cooled by expansionC) warmed by expansionD) warmed by compression
313) Which surface weather map belowbest represents the frontal systemshown in the diagram?
A)
B)
C)
D)
7563 - 1 - Page 63
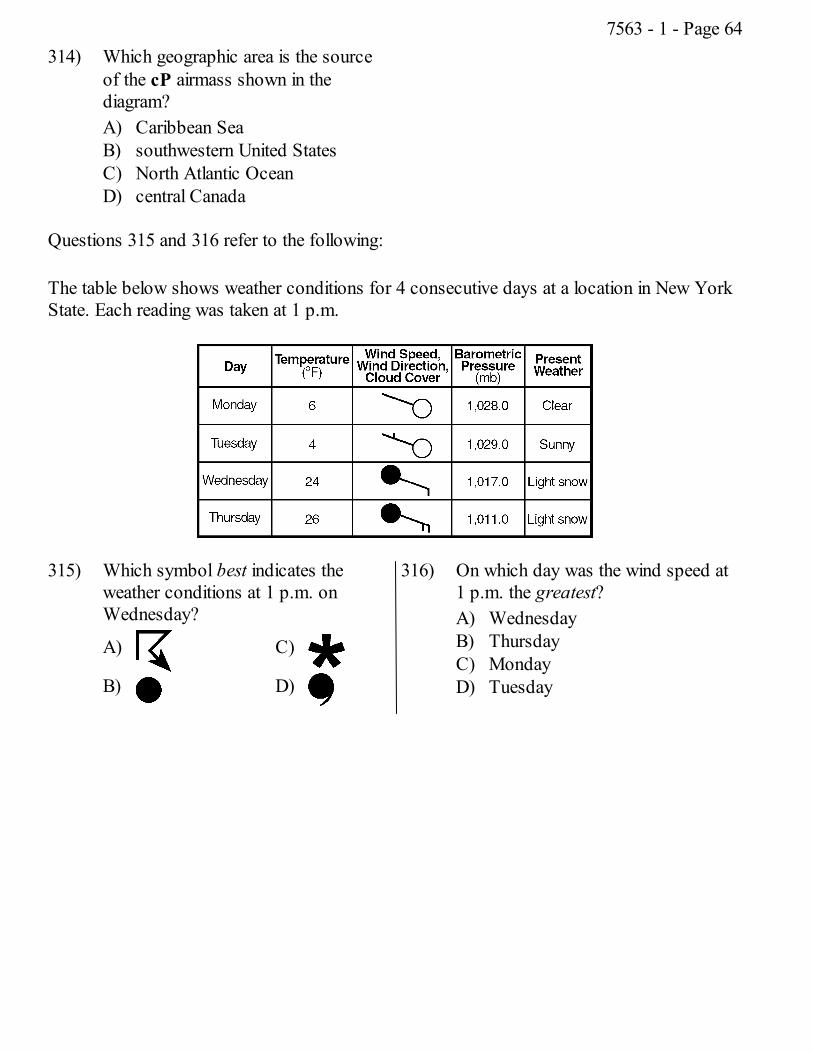
314) Which geographic area is the sourceof the cP airmass shown in thediagram?A) Caribbean SeaB) southwestern United StatesC) North Atlantic OceanD) central Canada
Questions 315 and 316 refer to the following:
The table below shows weather conditions for 4 consecutive days at a location in New YorkState. Each reading was taken at 1 p.m.
315) Which symbol best indicates theweather conditions at 1 p.m. onWednesday?
A)
B)
C)
D)
316) On which day was the wind speed at1 p.m. the greatest?A) WednesdayB) ThursdayC) MondayD) Tuesday
7563 - 1 - Page 64
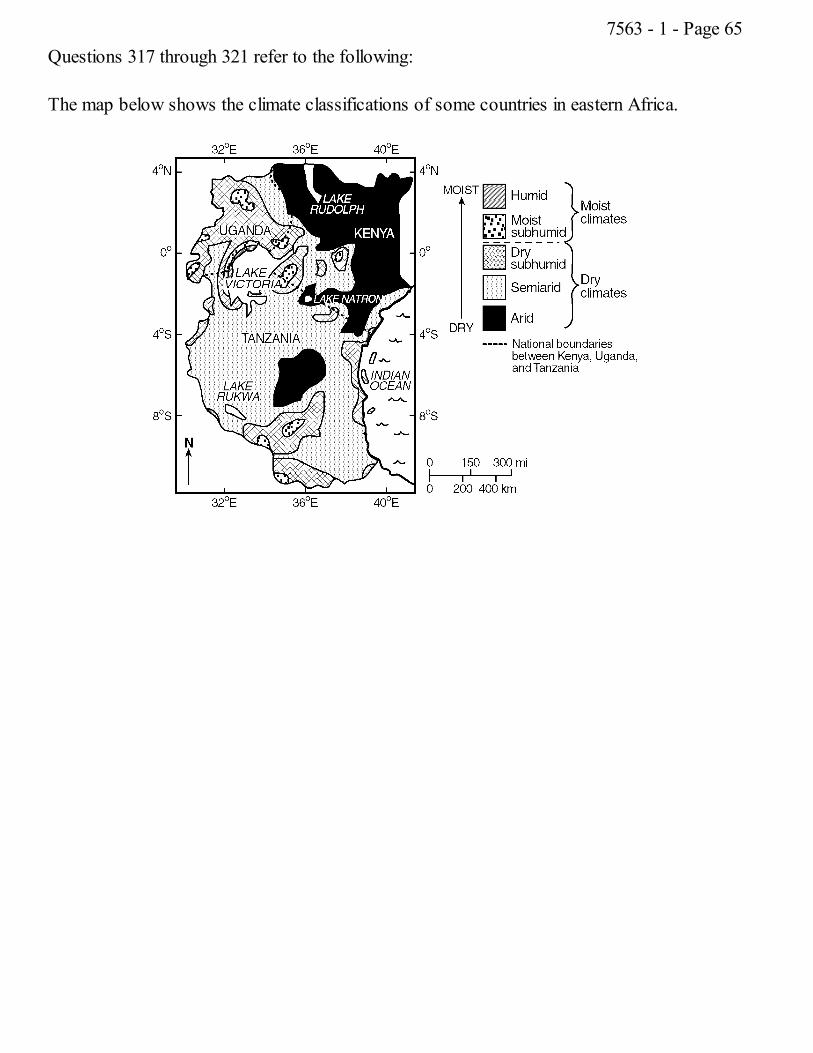
Questions 317 through 321 refer to the following:
The map below shows the climate classifications of some countries in eastern Africa.
7563 - 1 - Page 65
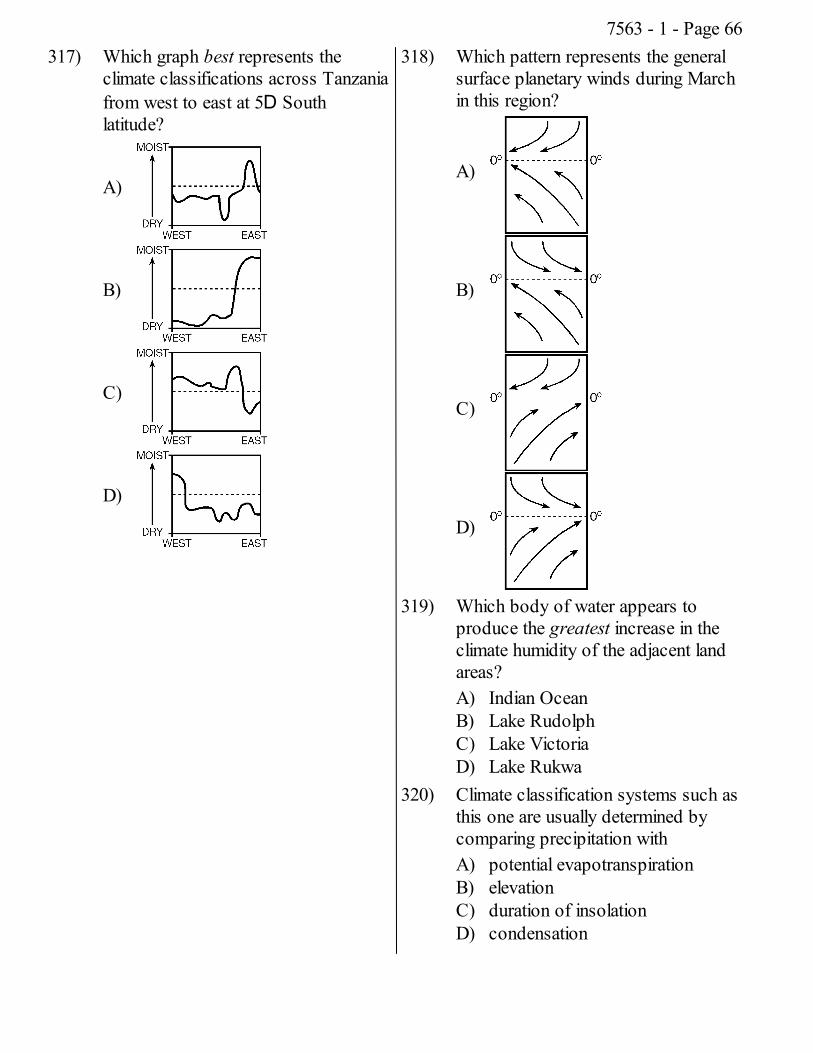
317) Which graph best represents theclimate classifications across Tanzaniafrom west to east at 5D Southlatitude?
A)
B)
C)
D)
318) Which pattern represents the generalsurface planetary winds during Marchin this region?
A)
B)
C)
D)
319) Which body of water appears toproduce the greatest increase in theclimate humidity of the adjacent landareas?A) Indian OceanB) Lake RudolphC) Lake VictoriaD) Lake Rukwa
320) Climate classification systems such asthis one are usually determined bycomparing precipitation withA) potential evapotranspirationB) elevationC) duration of insolationD) condensation
7563 - 1 - Page 66
321) Which inference best explains thecause of the climate of thenortheastern section of Kenya?A) Warm ocean currents bring
moisture to this coastal section.B) Mountains force air to rise over
this section.C) Cloud cover reflects most
insolation in this section.D) The air reaching this section
comes from a dry landmassregion.
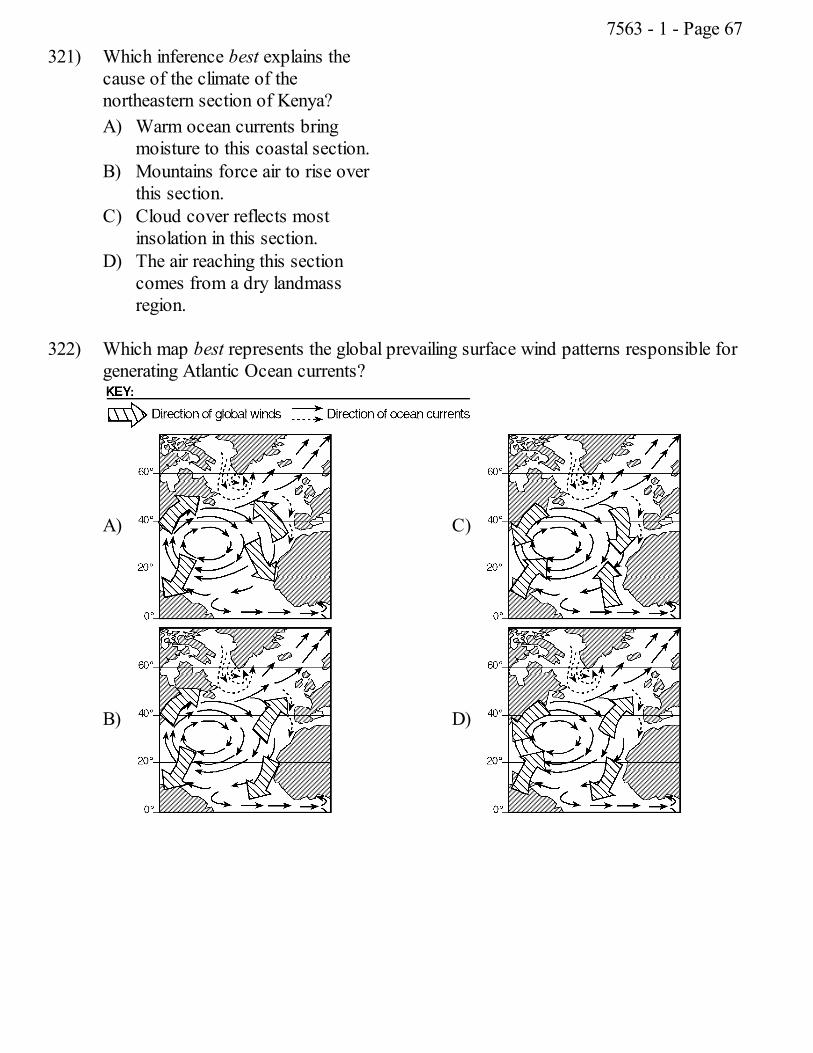
322) Which map best represents the global prevailing surface wind patterns responsible forgenerating Atlantic Ocean currents?
A)
B)
C)
D)
7563 - 1 - Page 67
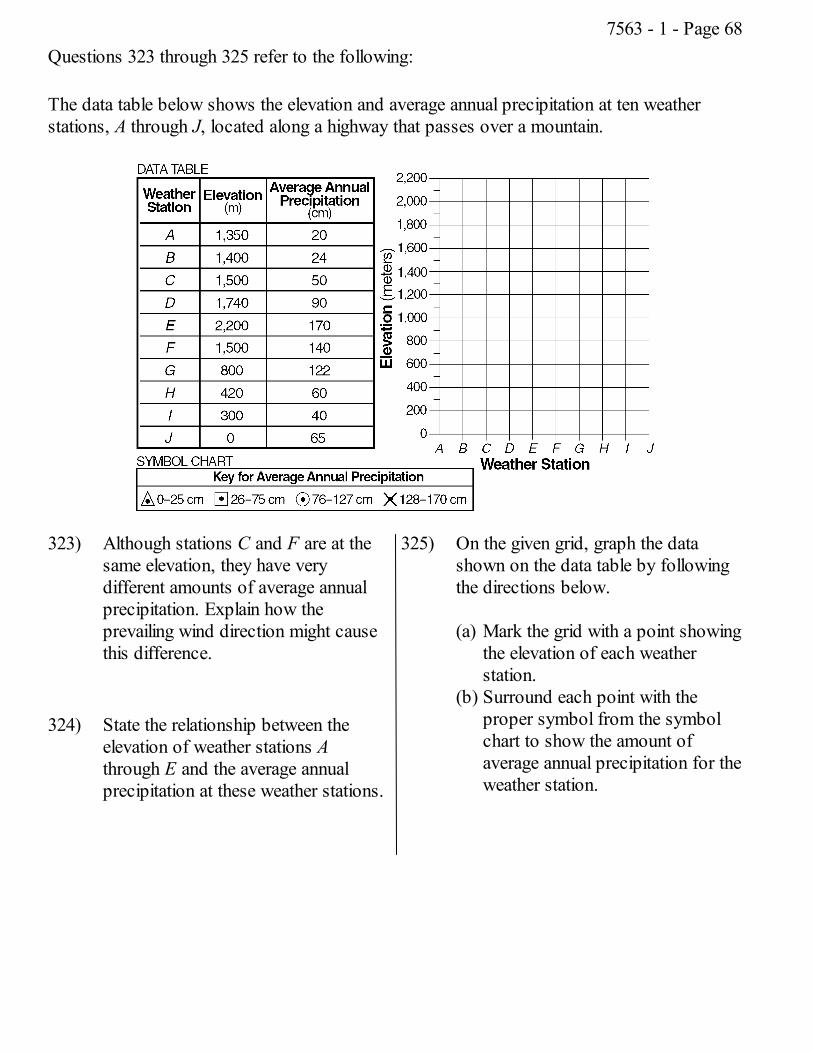
Questions 323 through 325 refer to the following:
The data table below shows the elevation and average annual precipitation at ten weatherstations, A through J, located along a highway that passes over a mountain.
323) Although stations C and F are at thesame elevation, they have verydifferent amounts of average annualprecipitation. Explain how theprevailing wind direction might causethis difference.
324) State the relationship between theelevation of weather stations Athrough E and the average annualprecipitation at these weather stations.
325) On the given grid, graph the datashown on the data table by followingthe directions below.
(a) Mark the grid with a point showingthe elevation of each weatherstation.
(b) Surround each point with theproper symbol from the symbolchart to show the amount ofaverage annual precipitation for theweather station.
7563 - 1 - Page 68
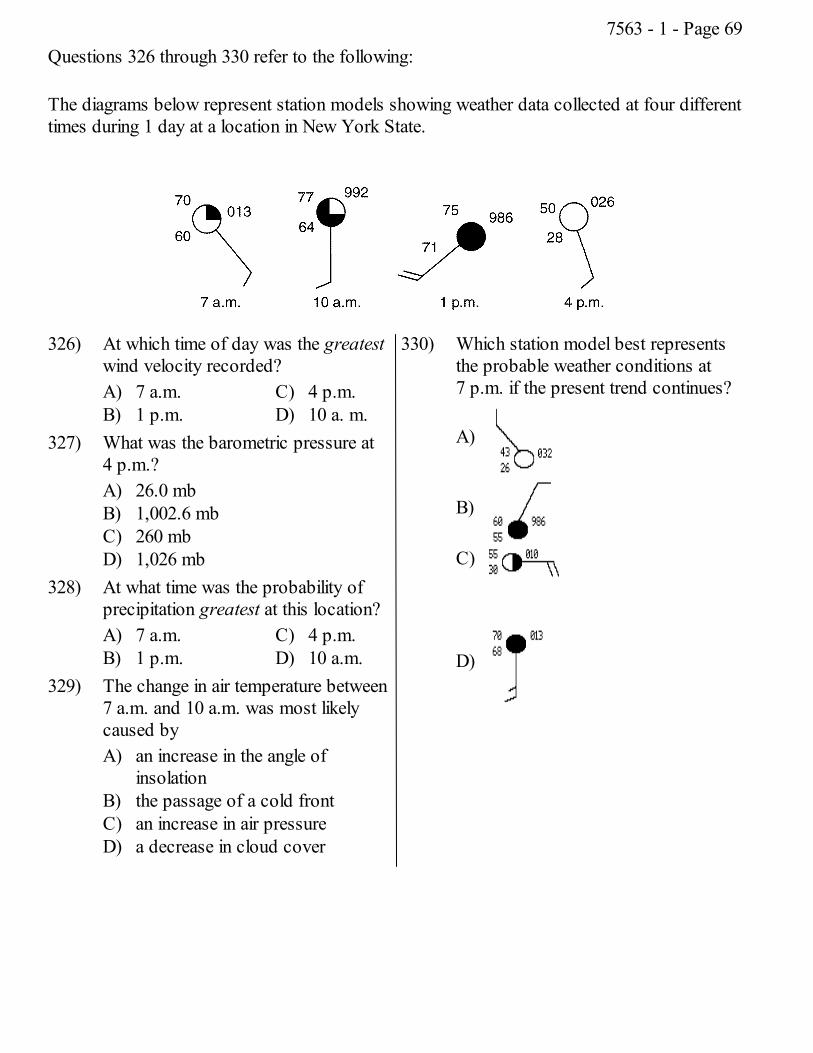
Questions 326 through 330 refer to the following:
The diagrams below represent station models showing weather data collected at four differenttimes during 1 day at a location in New York State.
326) At which time of day was the greatestwind velocity recorded?A) 7 a.m.B) 1 p.m.
C) 4 p.m.D) 10 a. m.
327) What was the barometric pressure at4 p.m.?A) 26.0 mbB) 1,002.6 mbC) 260 mbD) 1,026 mb
328) At what time was the probability ofprecipitation greatest at this location?A) 7 a.m.B) 1 p.m.
C) 4 p.m.D) 10 a.m.
329) The change in air temperature between7 a.m. and 10 a.m. was most likelycaused byA) an increase in the angle of
insolationB) the passage of a cold frontC) an increase in air pressureD) a decrease in cloud cover
330) Which station model best representsthe probable weather conditions at7 p.m. if the present trend continues?
A)
B)
C)
D)
7563 - 1 - Page 69
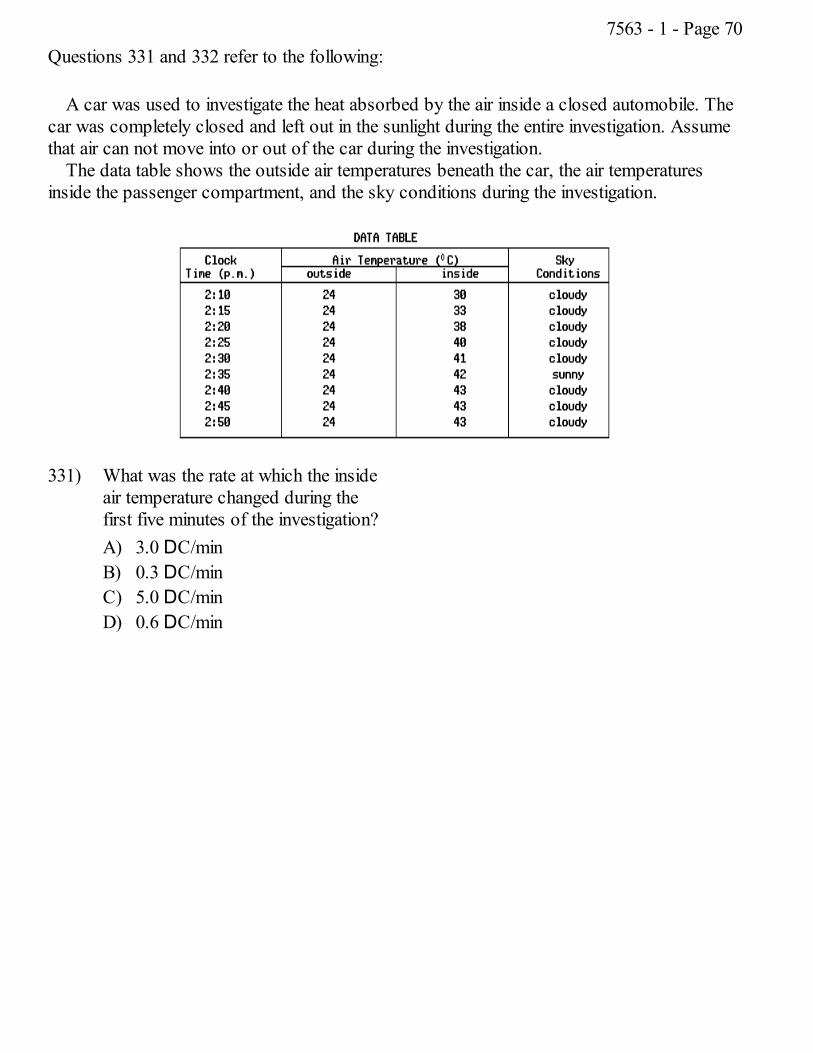
Questions 331 and 332 refer to the following:
A car was used to investigate the heat absorbed by the air inside a closed automobile. Thecar was completely closed and left out in the sunlight during the entire investigation. Assumethat air can not move into or out of the car during the investigation.
The data table shows the outside air temperatures beneath the car, the air temperaturesinside the passenger compartment, and the sky conditions during the investigation.
331) What was the rate at which the insideair temperature changed during thefirst five minutes of the investigation?A) 3.0 DC/minB) 0.3 DC/minC) 5.0 DC/minD) 0.6 DC/min
7563 - 1 - Page 70
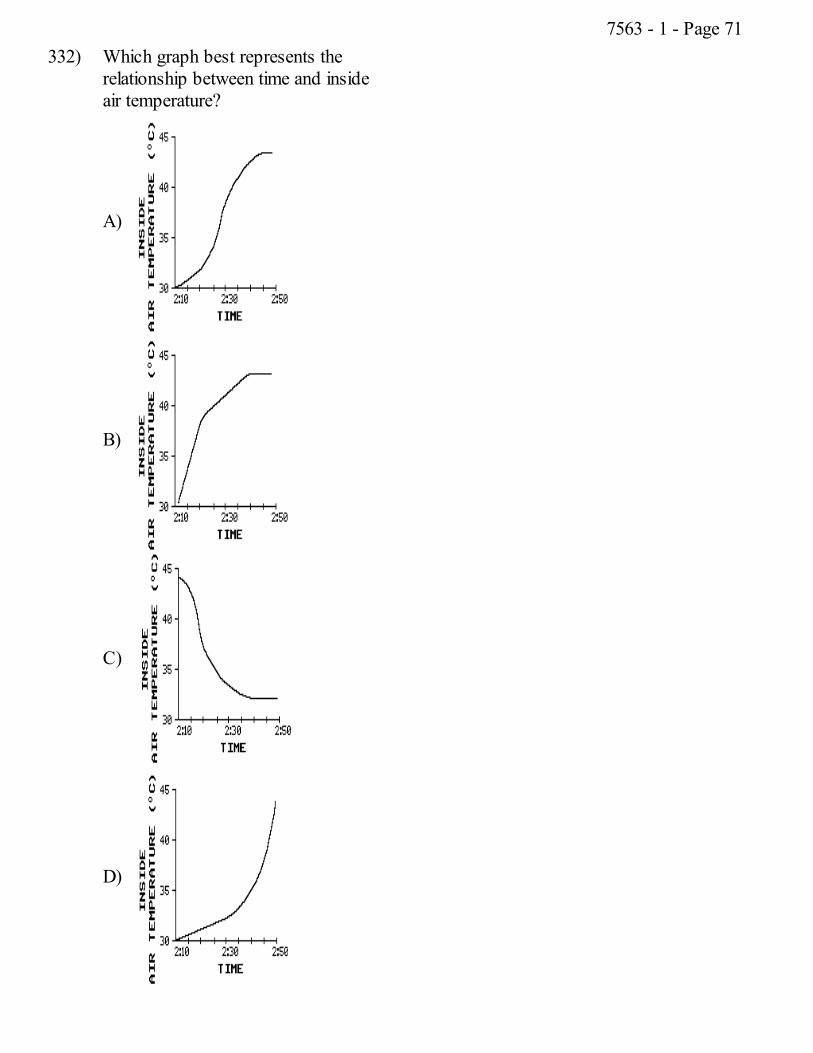
332) Which graph best represents therelationship between time and insideair temperature?
A)
B)
C)
D)
7563 - 1 - Page 71
Questions 333 through 336 refer to the following:
The passage below represents a magazine article.
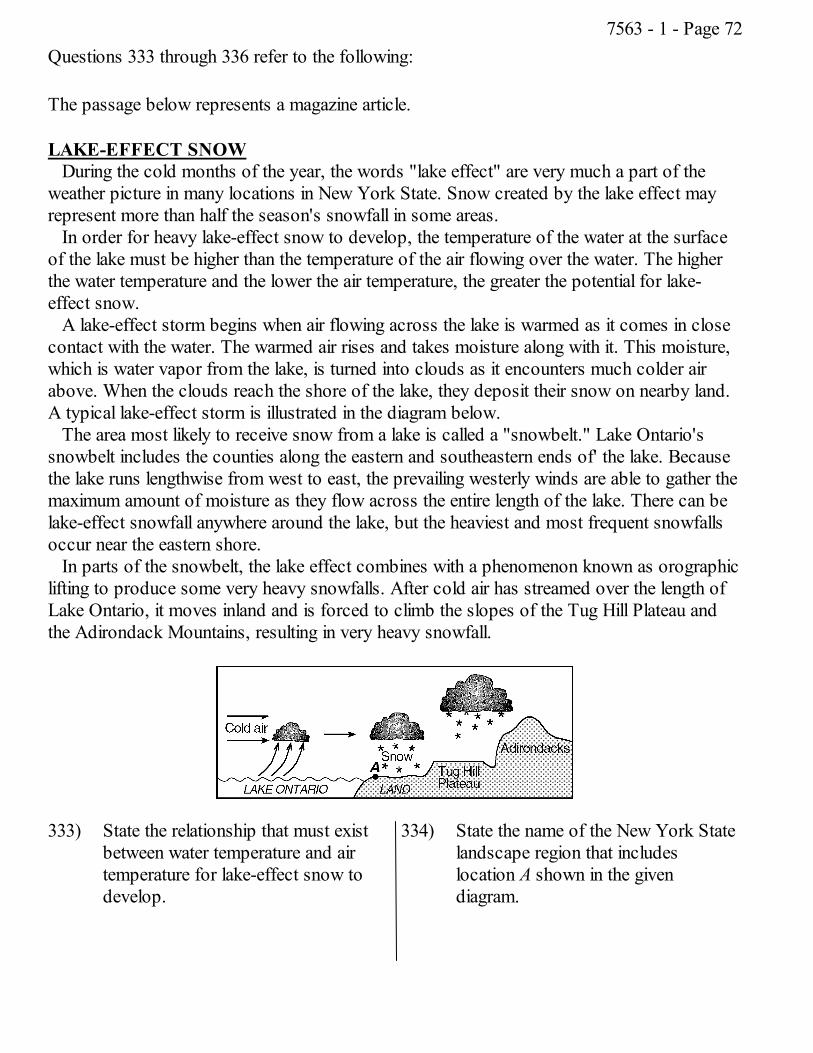
LAKE-EFFECT SNOWDuring the cold months of the year, the words "lake effect" are very much a part of the
weather picture in many locations in New York State. Snow created by the lake effect mayrepresent more than half the season's snowfall in some areas.
In order for heavy lake-effect snow to develop, the temperature of the water at the surfaceof the lake must be higher than the temperature of the air flowing over the water. The higherthe water temperature and the lower the air temperature, the greater the potential for lake-effect snow.
A lake-effect storm begins when air flowing across the lake is warmed as it comes in closecontact with the water. The warmed air rises and takes moisture along with it. This moisture,which is water vapor from the lake, is turned into clouds as it encounters much colder airabove. When the clouds reach the shore of the lake, they deposit their snow on nearby land.A typical lake-effect storm is illustrated in the diagram below.
The area most likely to receive snow from a lake is called a "snowbelt." Lake Ontario'ssnowbelt includes the counties along the eastern and southeastern ends of' the lake. Becausethe lake runs lengthwise from west to east, the prevailing westerly winds are able to gather themaximum amount of moisture as they flow across the entire length of the lake. There can belake-effect snowfall anywhere around the lake, but the heaviest and most frequent snowfallsoccur near the eastern shore.
In parts of the snowbelt, the lake effect combines with a phenomenon known as orographiclifting to produce some very heavy snowfalls. After cold air has streamed over the length ofLake Ontario, it moves inland and is forced to climb the slopes of the Tug Hill Plateau andthe Adirondack Mountains, resulting in very heavy snowfall.
333) State the relationship that must existbetween water temperature and airtemperature for lake-effect snow todevelop.
334) State the name of the New York Statelandscape region that includeslocation A shown in the givendiagram.
7563 - 1 - Page 72
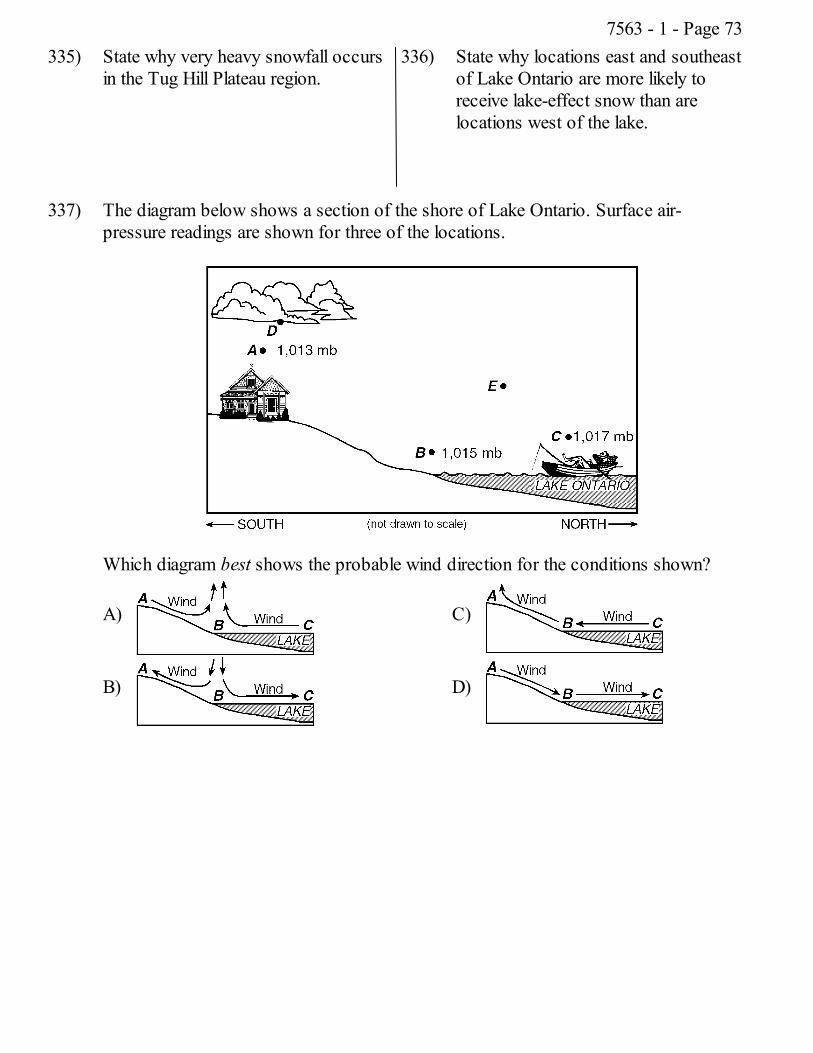
335) State why very heavy snowfall occursin the Tug Hill Plateau region.
336) State why locations east and southeastof Lake Ontario are more likely toreceive lake-effect snow than arelocations west of the lake.
337) The diagram below shows a section of the shore of Lake Ontario. Surface air-pressure readings are shown for three of the locations.
Which diagram best shows the probable wind direction for the conditions shown?
A)
B)
C)
D)
7563 - 1 - Page 73
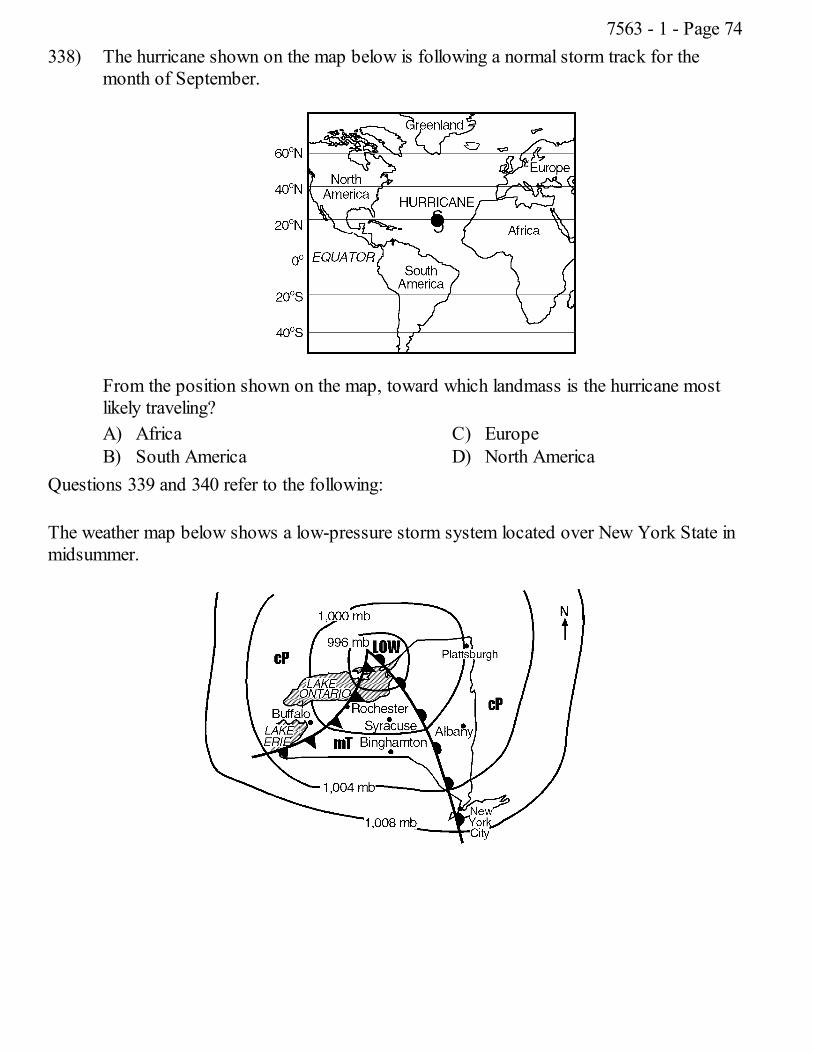
338) The hurricane shown on the map below is following a normal storm track for themonth of September.
From the position shown on the map, toward which landmass is the hurricane mostlikely traveling?A) AfricaB) South America
C) EuropeD) North America
Questions 339 and 340 refer to the following:
The weather map below shows a low-pressure storm system located over New York State inmidsummer.
7563 - 1 - Page 74
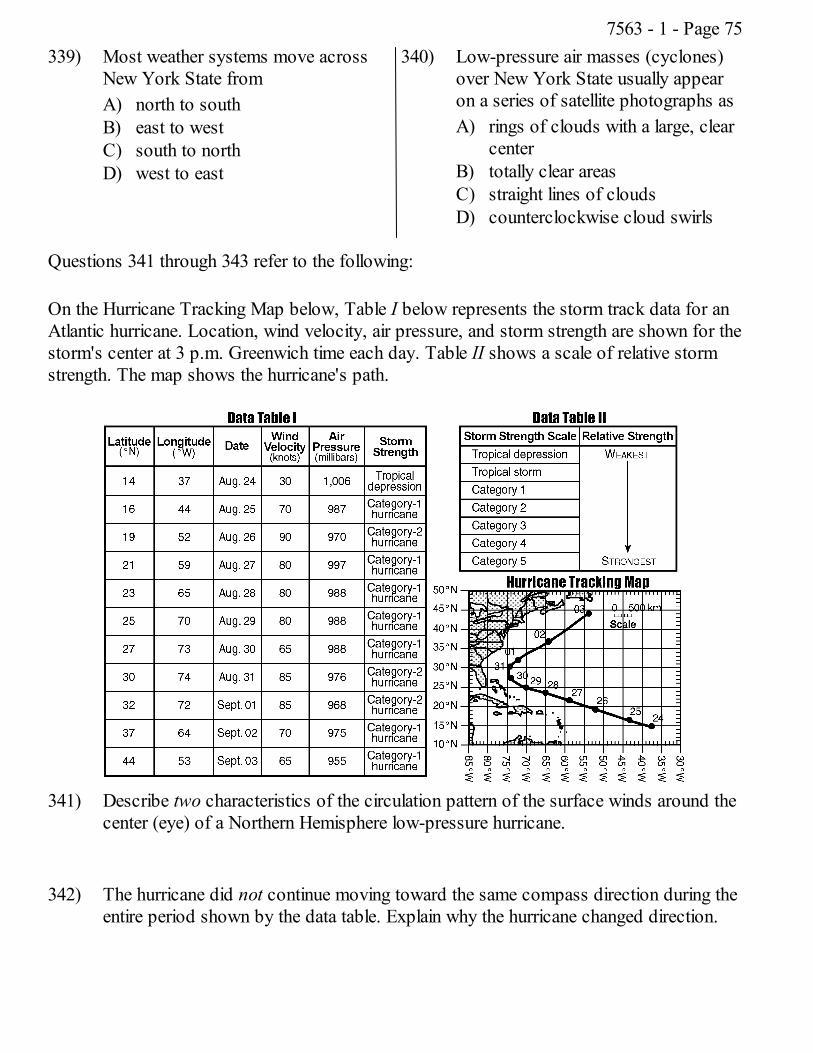
339) Most weather systems move acrossNew York State fromA) north to southB) east to westC) south to northD) west to east
340) Low-pressure air masses (cyclones)over New York State usually appearon a series of satellite photographs asA) rings of clouds with a large, clear
centerB) totally clear areasC) straight lines of cloudsD) counterclockwise cloud swirls
Questions 341 through 343 refer to the following:
On the Hurricane Tracking Map below, Table I below represents the storm track data for anAtlantic hurricane. Location, wind velocity, air pressure, and storm strength are shown for thestorm's center at 3 p.m. Greenwich time each day. Table II shows a scale of relative stormstrength. The map shows the hurricane's path.
341) Describe two characteristics of the circulation pattern of the surface winds around thecenter (eye) of a Northern Hemisphere low-pressure hurricane.
342) The hurricane did not continue moving toward the same compass direction during theentire period shown by the data table. Explain why the hurricane changed direction.
7563 - 1 - Page 75
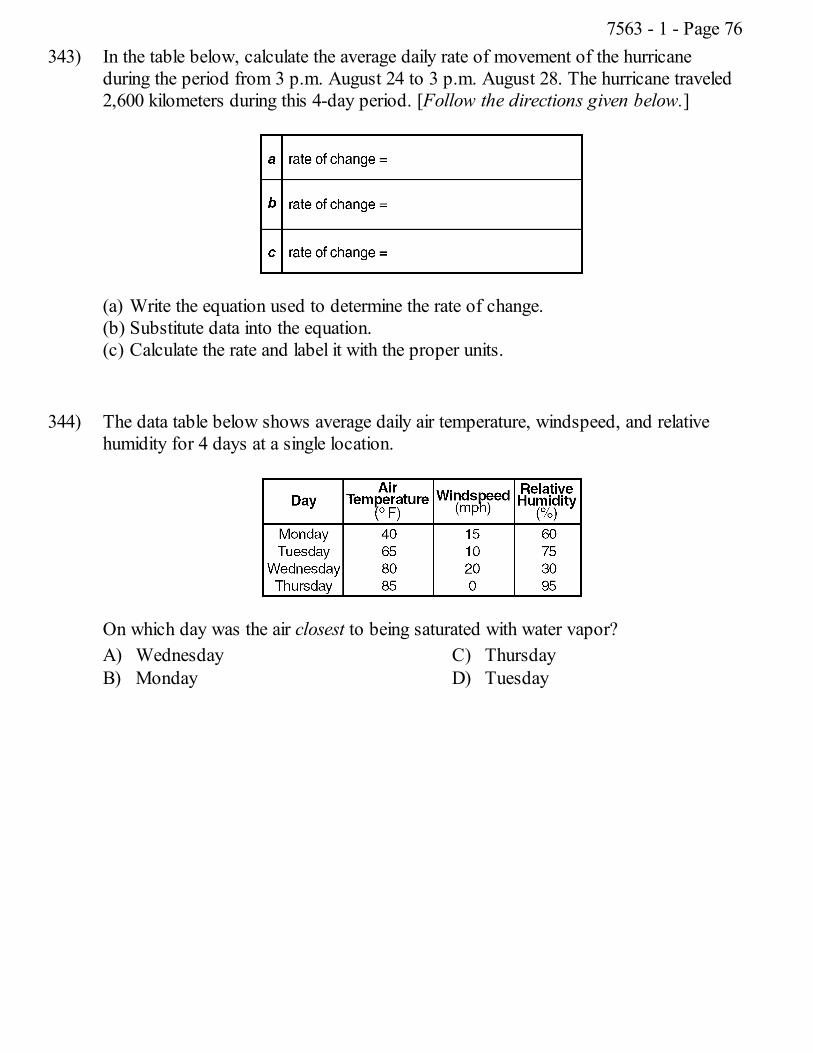
343) In the table below, calculate the average daily rate of movement of the hurricaneduring the period from 3 p.m. August 24 to 3 p.m. August 28. The hurricane traveled2,600 kilometers during this 4-day period. [Follow the directions given below.]
(a) Write the equation used to determine the rate of change.(b) Substitute data into the equation.(c) Calculate the rate and label it with the proper units.
344) The data table below shows average daily air temperature, windspeed, and relativehumidity for 4 days at a single location.
On which day was the air closest to being saturated with water vapor?A) WednesdayB) Monday
C) ThursdayD) Tuesday
7563 - 1 - Page 76
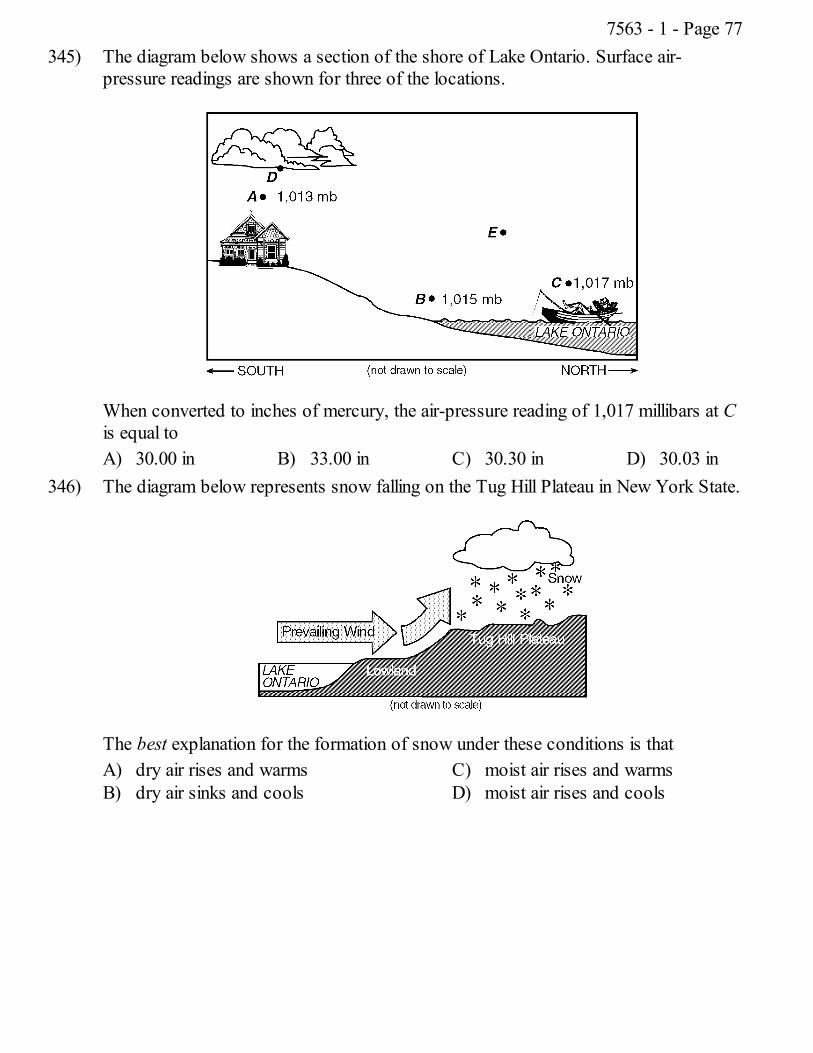
345) The diagram below shows a section of the shore of Lake Ontario. Surface air-pressure readings are shown for three of the locations.
When converted to inches of mercury, the air-pressure reading of 1,017 millibars at Cis equal toA) 30.00 in B) 33.00 in C) 30.30 in D) 30.03 in
346) The diagram below represents snow falling on the Tug Hill Plateau in New York State.
The best explanation for the formation of snow under these conditions is thatA) dry air rises and warmsB) dry air sinks and cools
C) moist air rises and warmsD) moist air rises and cools
7563 - 1 - Page 77
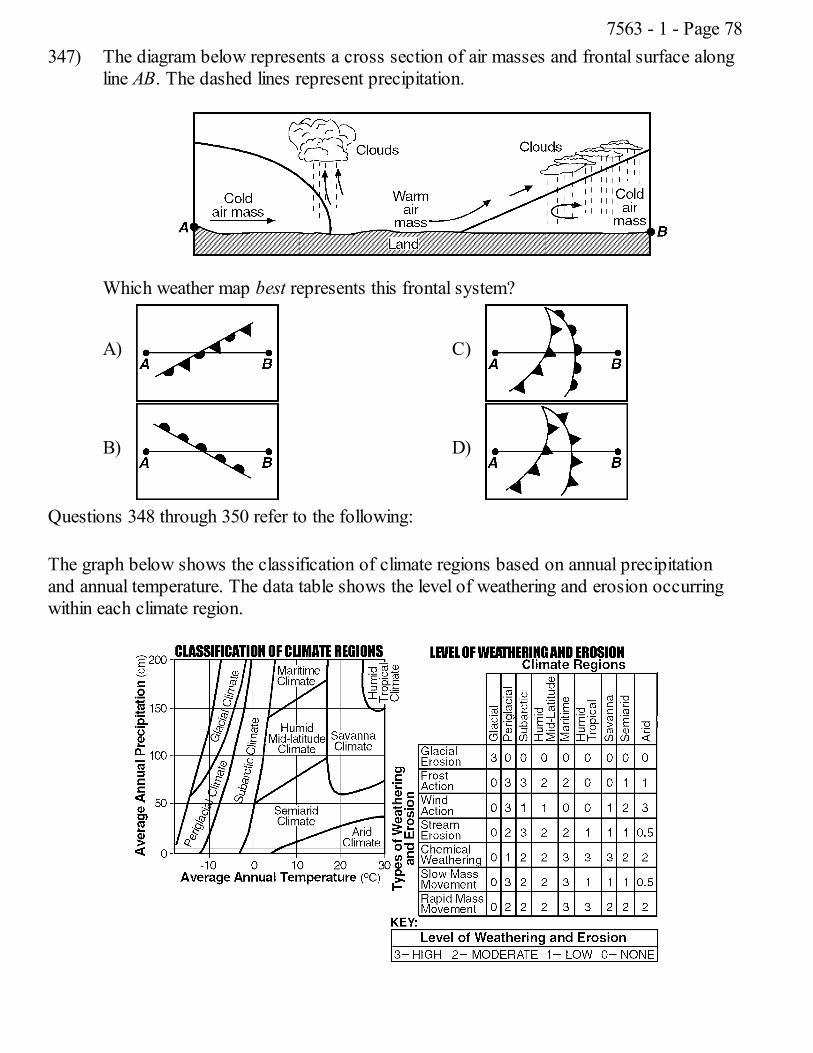
347) The diagram below represents a cross section of air masses and frontal surface alongline AB. The dashed lines represent precipitation.
Which weather map best represents this frontal system?
A)
B)
C)
D)
Questions 348 through 350 refer to the following:
The graph below shows the classification of climate regions based on annual precipitationand annual temperature. The data table shows the level of weathering and erosion occurringwithin each climate region.
7563 - 1 - Page 78
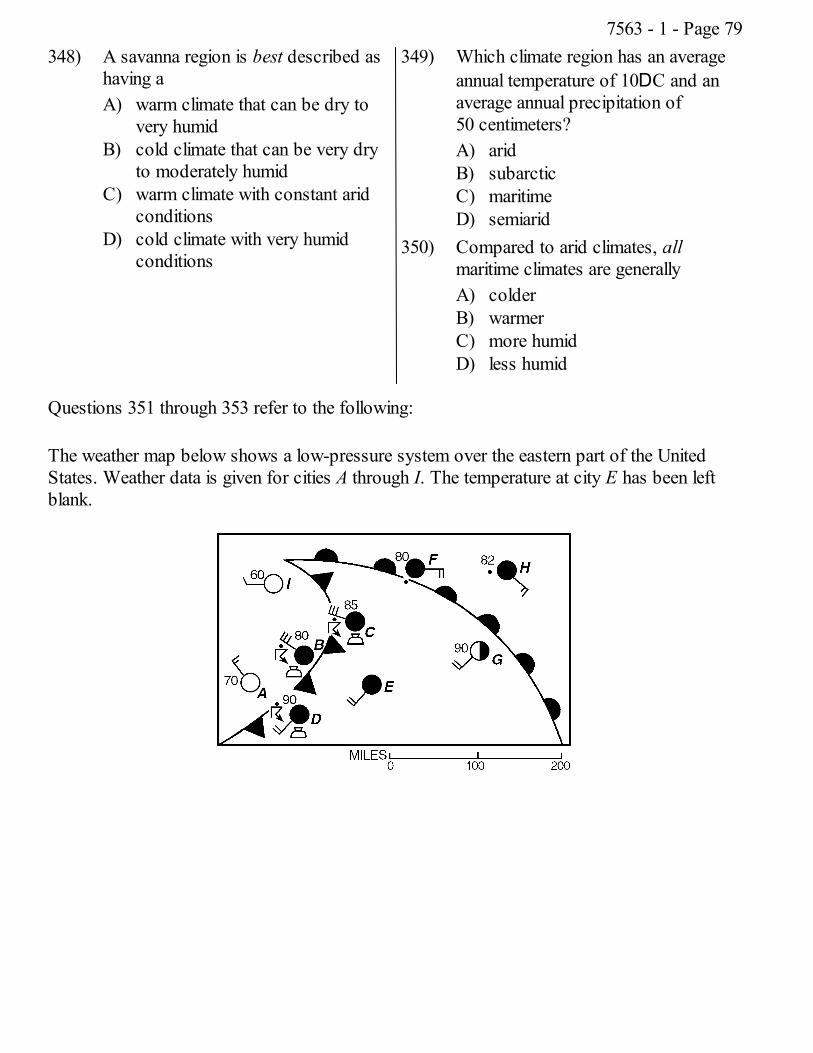
348) A savanna region is best described ashaving aA) warm climate that can be dry to
very humidB) cold climate that can be very dry
to moderately humidC) warm climate with constant arid
conditionsD) cold climate with very humid
conditions
349) Which climate region has an averageannual temperature of 10DC and anaverage annual precipitation of50 centimeters?A) aridB) subarcticC) maritimeD) semiarid
350) Compared to arid climates, allmaritime climates are generallyA) colderB) warmerC) more humidD) less humid
Questions 351 through 353 refer to the following:
The weather map below shows a low-pressure system over the eastern part of the UnitedStates. Weather data is given for cities A through I. The temperature at city E has been leftblank.
7563 - 1 - Page 79
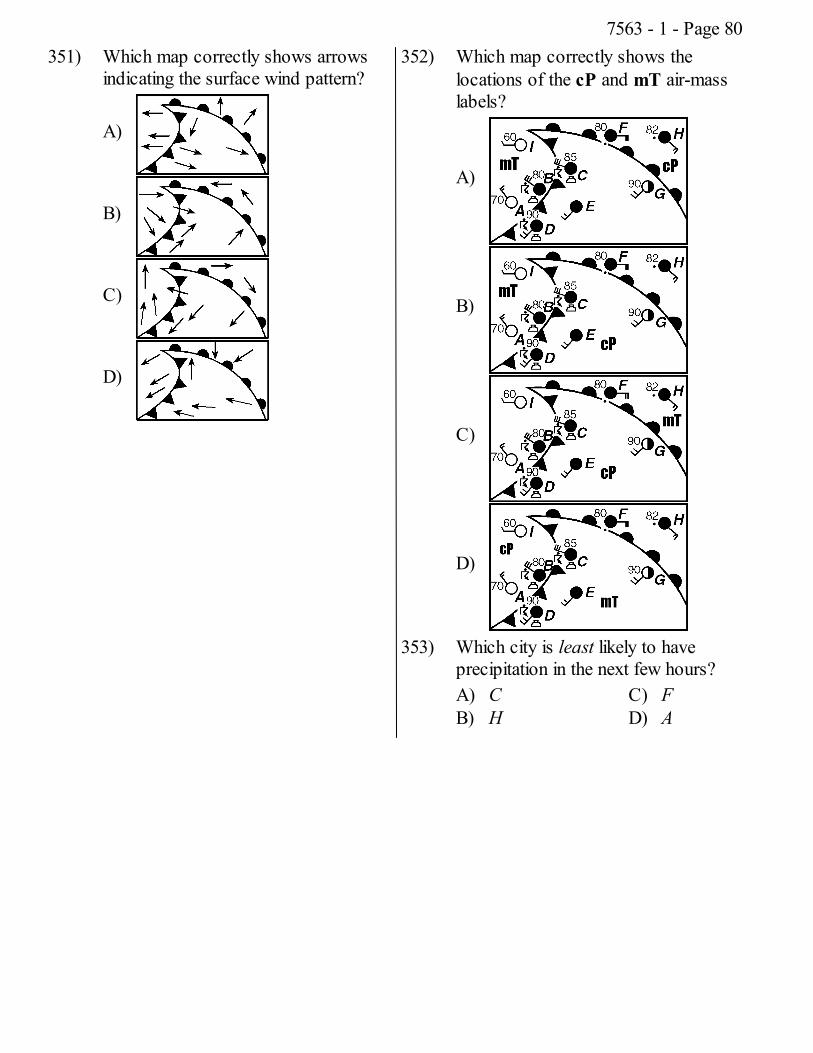
351) Which map correctly shows arrowsindicating the surface wind pattern?
A)
B)
C)
D)
352) Which map correctly shows thelocations of the cP and mT air-masslabels?
A)
B)
C)
D)
353) Which city is least likely to haveprecipitation in the next few hours?A) CB) H
C) FD) A
7563 - 1 - Page 80
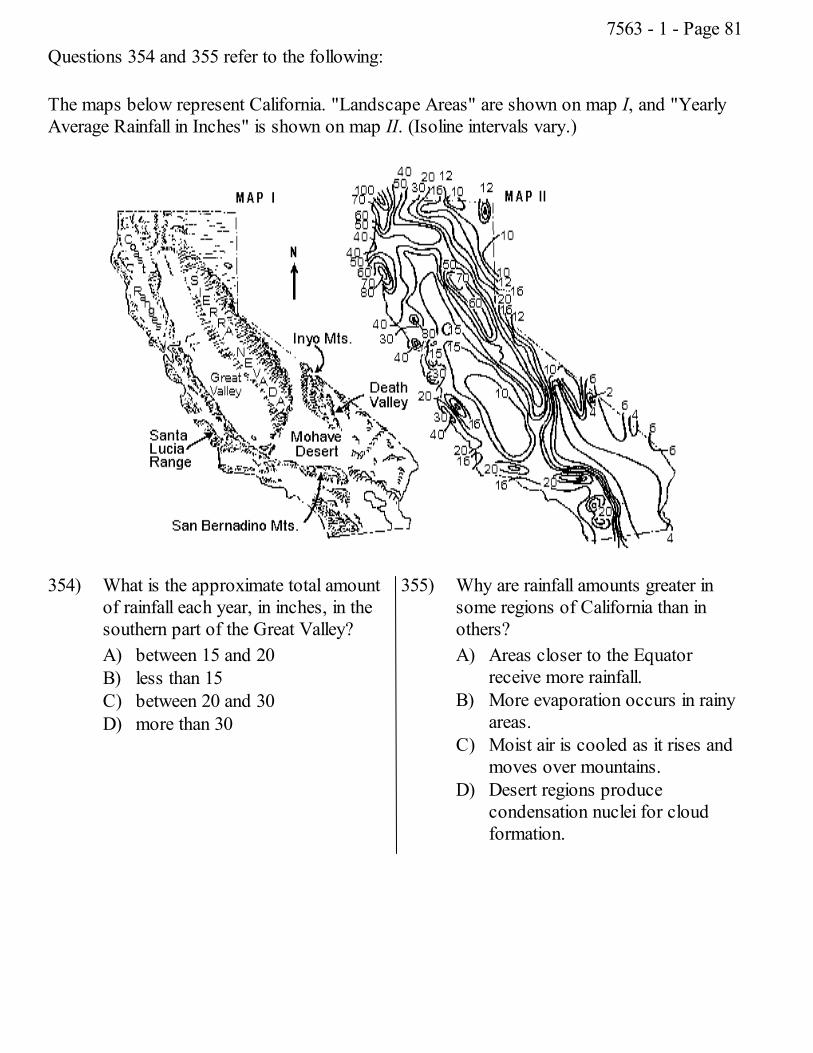
Questions 354 and 355 refer to the following:
The maps below represent California. "Landscape Areas" are shown on map I, and "YearlyAverage Rainfall in Inches" is shown on map II. (Isoline intervals vary.)
354) What is the approximate total amountof rainfall each year, in inches, in thesouthern part of the Great Valley?A) between 15 and 20B) less than 15C) between 20 and 30D) more than 30
355) Why are rainfall amounts greater insome regions of California than inothers?A) Areas closer to the Equator
receive more rainfall.B) More evaporation occurs in rainy
areas.C) Moist air is cooled as it rises and
moves over mountains.D) Desert regions produce
condensation nuclei for cloudformation.
7563 - 1 - Page 81
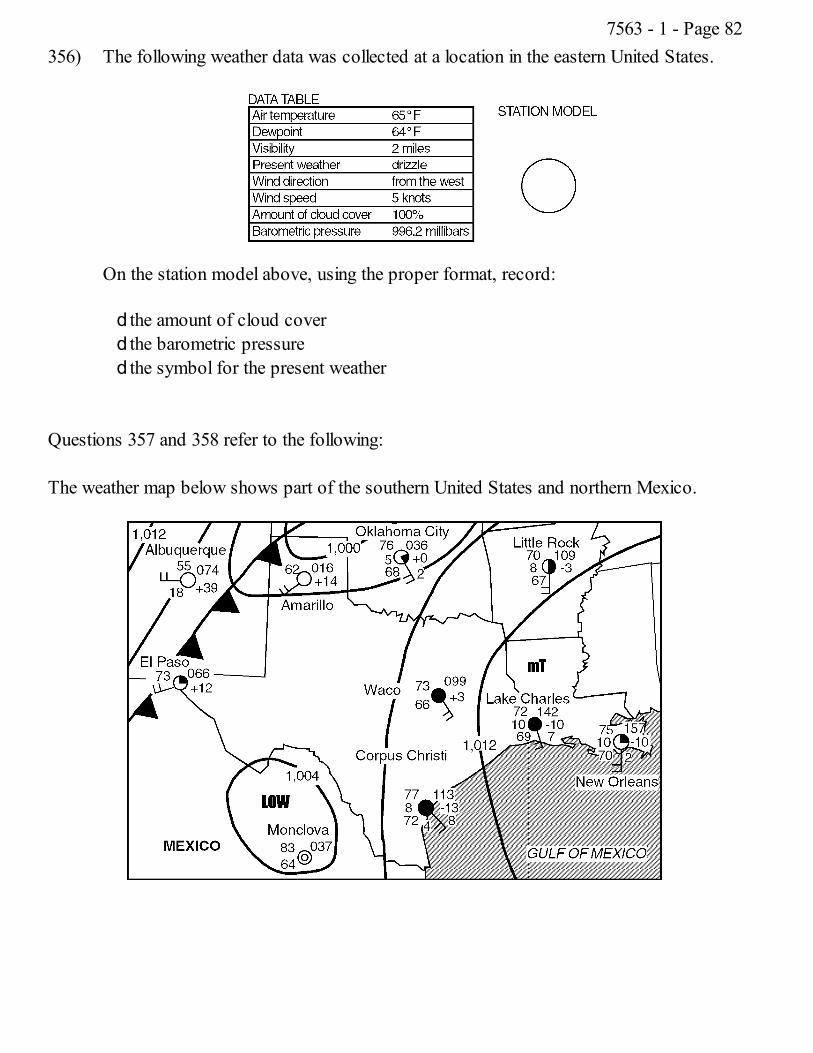
356) The following weather data was collected at a location in the eastern United States.
On the station model above, using the proper format, record:
d the amount of cloud coverd the barometric pressured the symbol for the present weather
Questions 357 and 358 refer to the following:
The weather map below shows part of the southern United States and northern Mexico.
7563 - 1 - Page 82
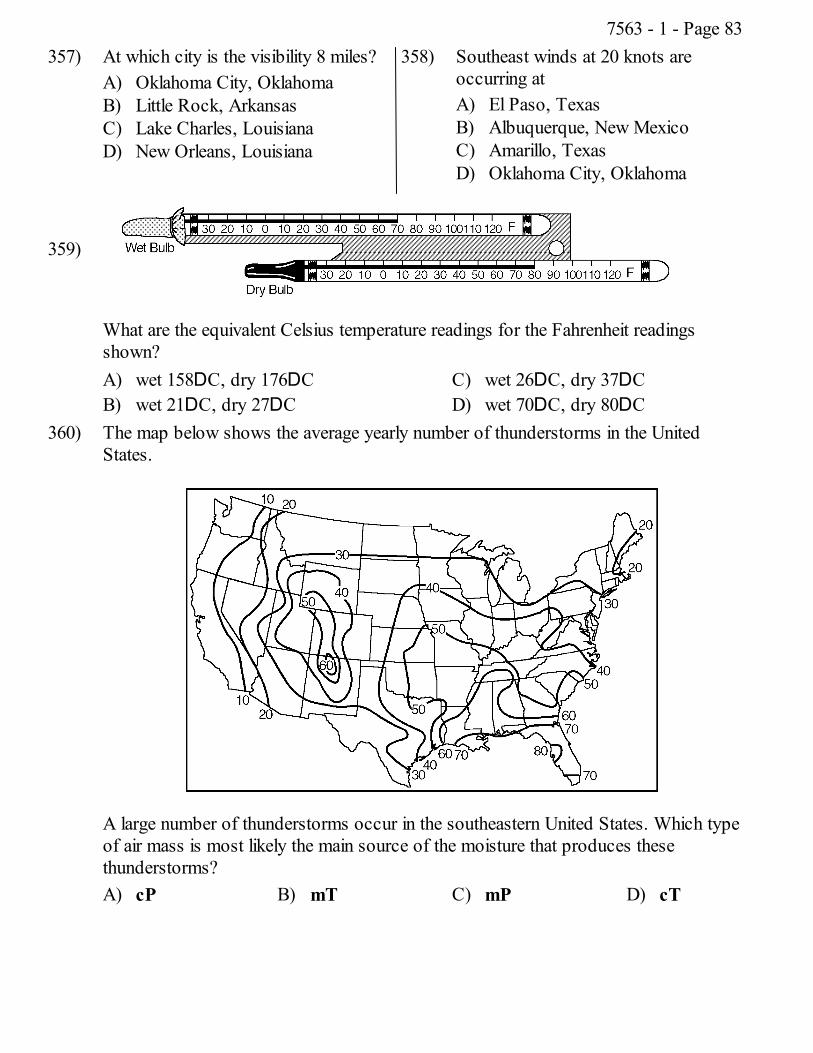
357) At which city is the visibility 8 miles?A) Oklahoma City, OklahomaB) Little Rock, ArkansasC) Lake Charles, LouisianaD) New Orleans, Louisiana
358) Southeast winds at 20 knots areoccurring atA) El Paso, TexasB) Albuquerque, New MexicoC) Amarillo, TexasD) Oklahoma City, Oklahoma
359)
What are the equivalent Celsius temperature readings for the Fahrenheit readingsshown?A) wet 158DC, dry 176DCB) wet 21DC, dry 27DC
C) wet 26DC, dry 37DCD) wet 70DC, dry 80DC
360) The map below shows the average yearly number of thunderstorms in the UnitedStates.
A large number of thunderstorms occur in the southeastern United States. Which typeof air mass is most likely the main source of the moisture that produces thesethunderstorms?A) cP B) mT C) mP D) cT
7563 - 1 - Page 83
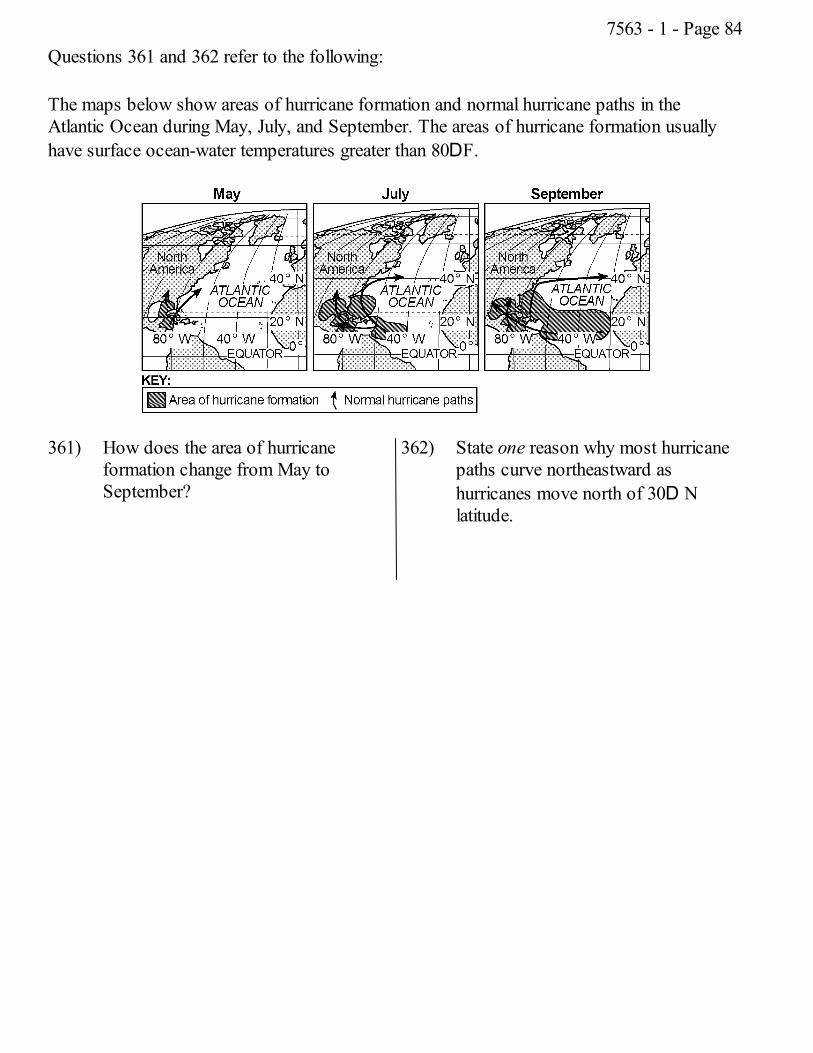
Questions 361 and 362 refer to the following:
The maps below show areas of hurricane formation and normal hurricane paths in theAtlantic Ocean during May, July, and September. The areas of hurricane formation usuallyhave surface ocean-water temperatures greater than 80DF.
361) How does the area of hurricaneformation change from May toSeptember?
362) State one reason why most hurricanepaths curve northeastward ashurricanes move north of 30D Nlatitude.
7563 - 1 - Page 84
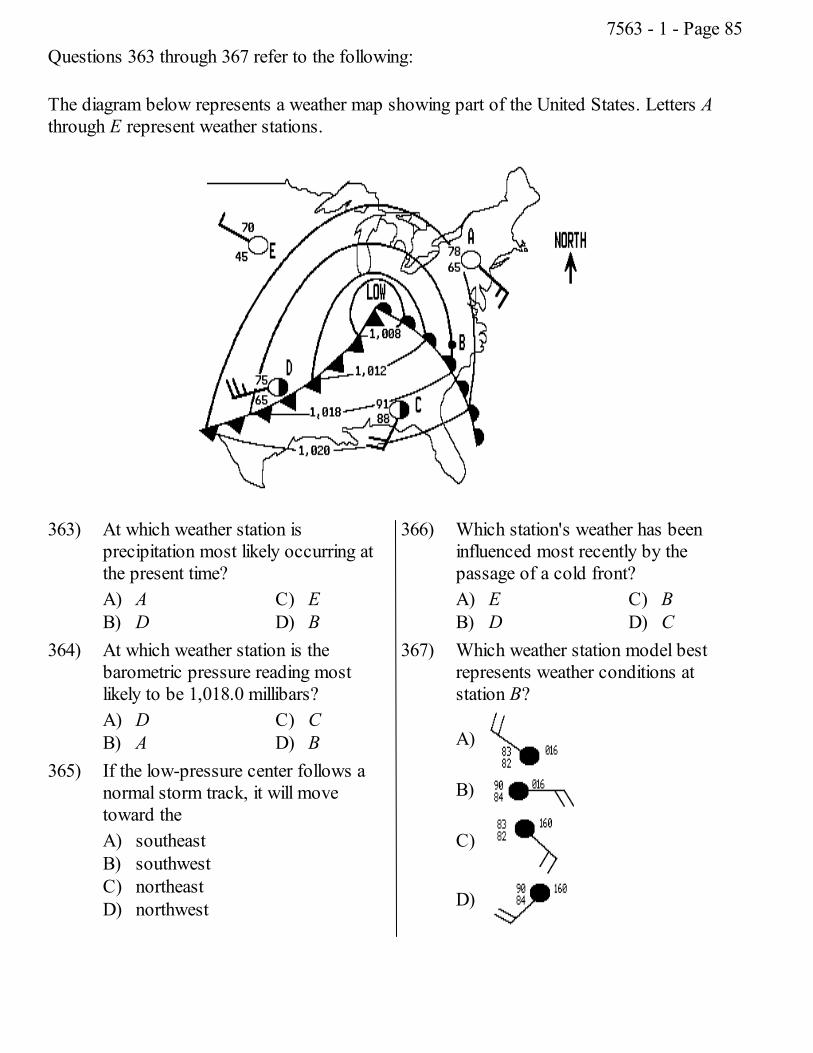
Questions 363 through 367 refer to the following:
The diagram below represents a weather map showing part of the United States. Letters Athrough E represent weather stations.
363) At which weather station isprecipitation most likely occurring atthe present time?A) AB) D
C) ED) B
364) At which weather station is thebarometric pressure reading mostlikely to be 1,018.0 millibars?A) DB) A
C) CD) B
365) If the low-pressure center follows anormal storm track, it will movetoward theA) southeastB) southwestC) northeastD) northwest
366) Which station's weather has beeninfluenced most recently by thepassage of a cold front?A) EB) D
C) BD) C
367) Which weather station model bestrepresents weather conditions atstation B?
A)
B)
C)
D)
7563 - 1 - Page 85
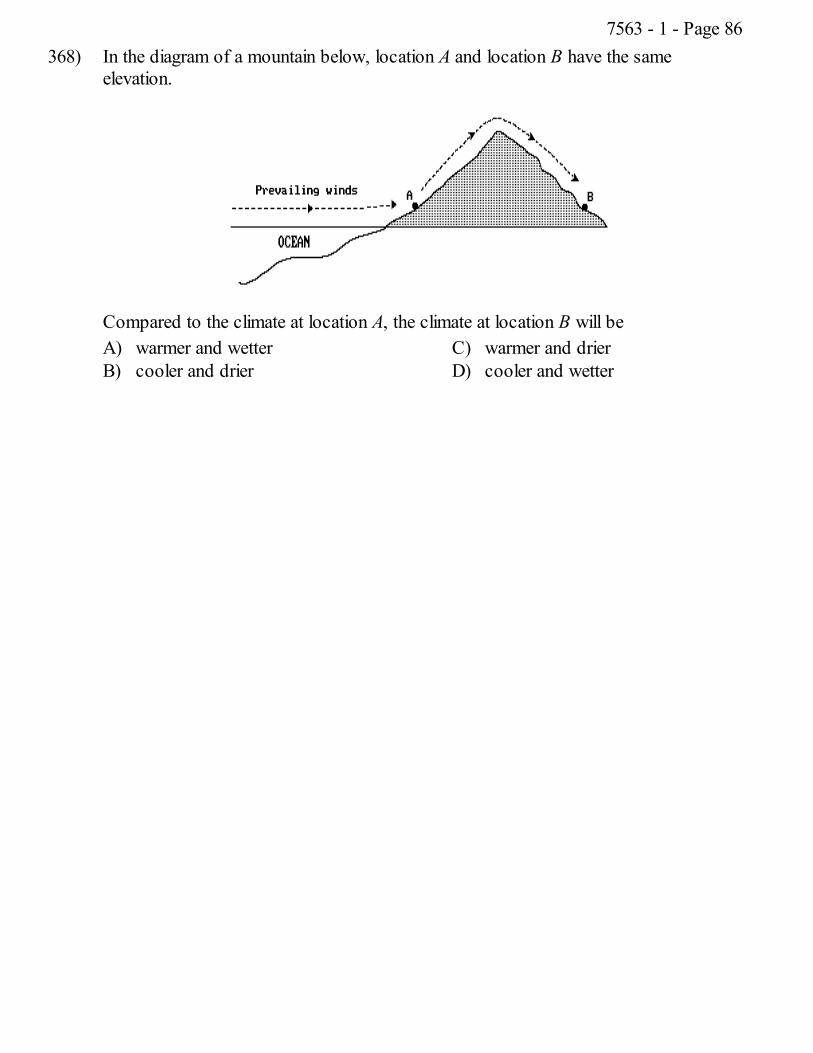
368) In the diagram of a mountain below, location A and location B have the sameelevation.
Compared to the climate at location A, the climate at location B will beA) warmer and wetterB) cooler and drier
C) warmer and drierD) cooler and wetter
7563 - 1 - Page 86
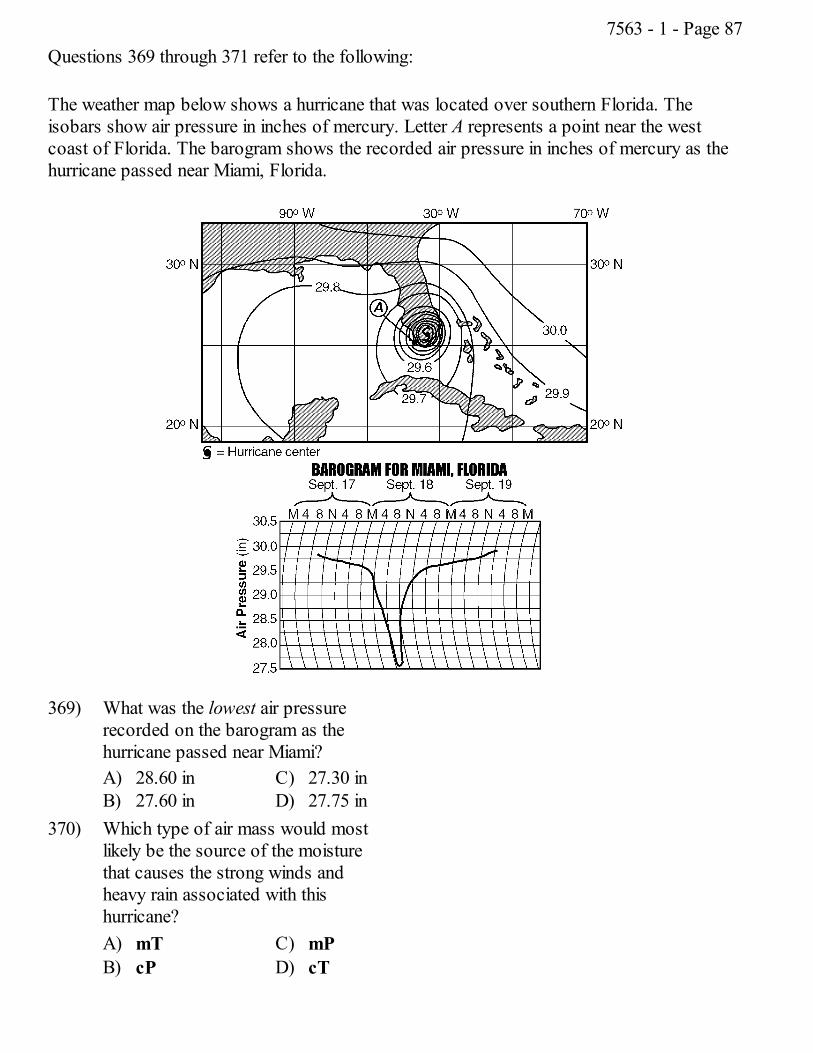
Questions 369 through 371 refer to the following:
The weather map below shows a hurricane that was located over southern Florida. Theisobars show air pressure in inches of mercury. Letter A represents a point near the westcoast of Florida. The barogram shows the recorded air pressure in inches of mercury as thehurricane passed near Miami, Florida.
369) What was the lowest air pressurerecorded on the barogram as thehurricane passed near Miami?A) 28.60 inB) 27.60 in
C) 27.30 inD) 27.75 in
370) Which type of air mass would mostlikely be the source of the moisturethat causes the strong winds andheavy rain associated with thishurricane?A) mTB) cP
C) mPD) cT
7563 - 1 - Page 87
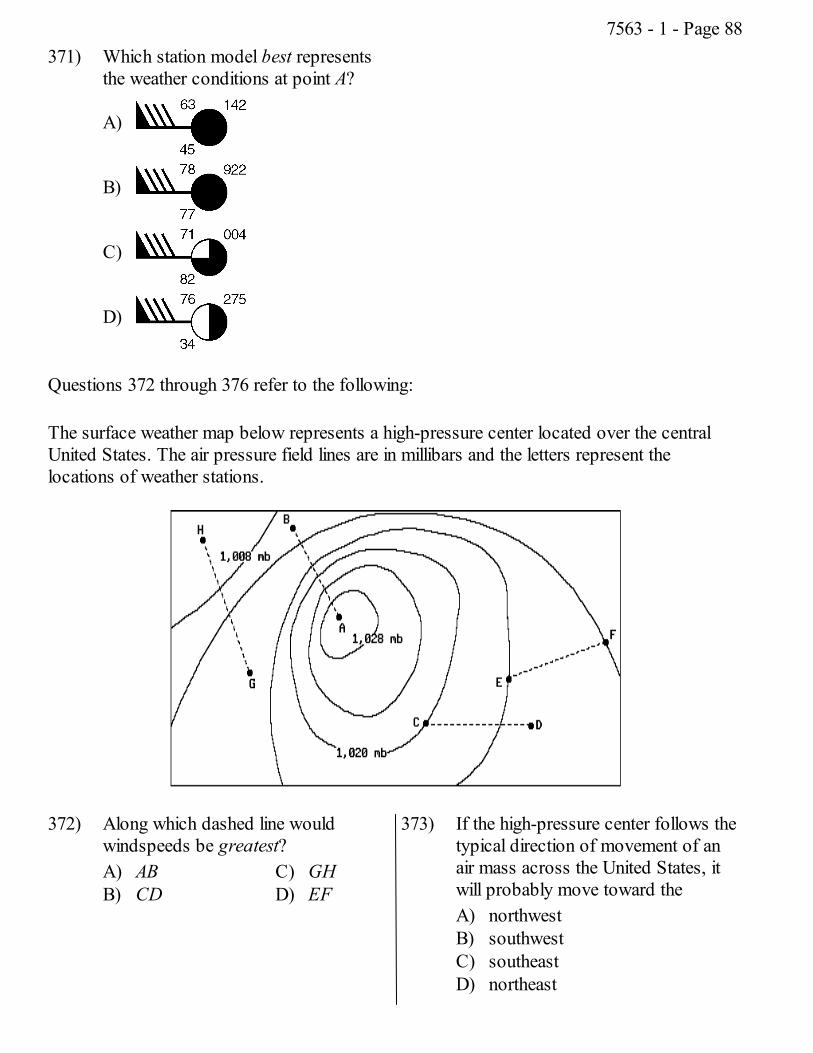
371) Which station model best representsthe weather conditions at point A?
A)
B)
C)
D)
Questions 372 through 376 refer to the following:
The surface weather map below represents a high-pressure center located over the centralUnited States. The air pressure field lines are in millibars and the letters represent thelocations of weather stations.
372) Along which dashed line wouldwindspeeds be greatest?A) ABB) CD
C) GHD) EF
373) If the high-pressure center follows thetypical direction of movement of anair mass across the United States, itwill probably move toward theA) northwestB) southwestC) southeastD) northeast
7563 - 1 - Page 88
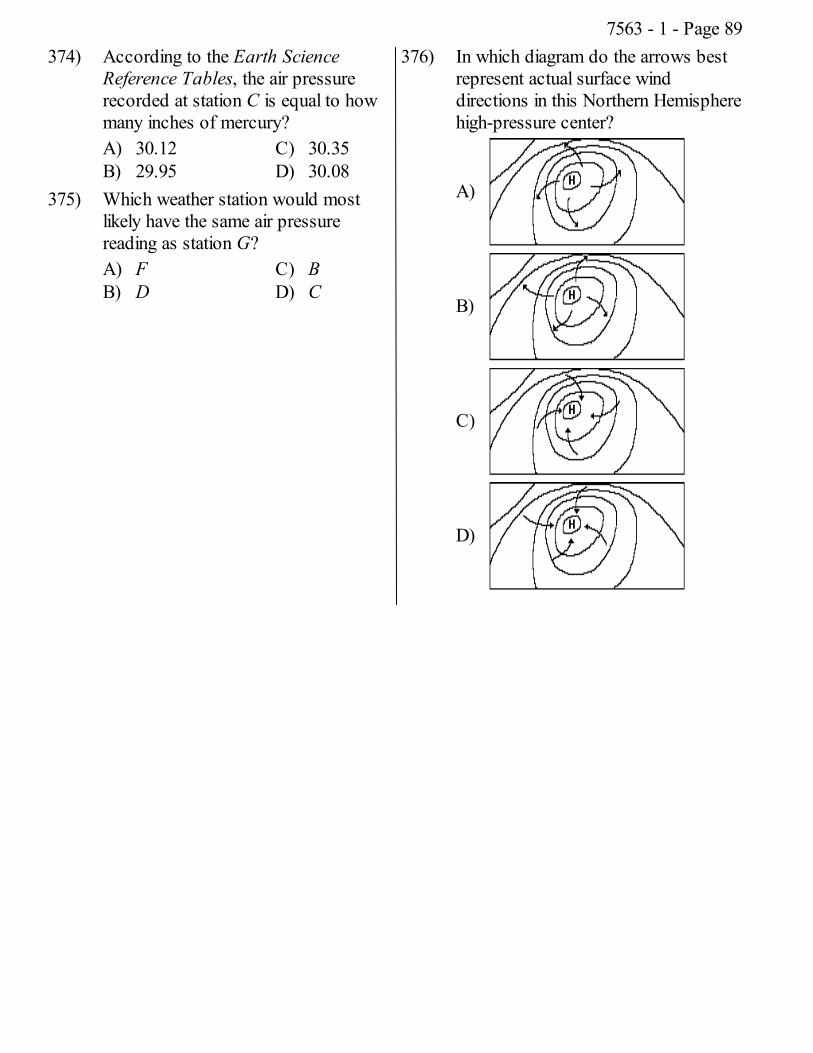
374) According to the Earth ScienceReference Tables, the air pressurerecorded at station C is equal to howmany inches of mercury?A) 30.12B) 29.95
C) 30.35D) 30.08
375) Which weather station would mostlikely have the same air pressurereading as station G?A) FB) D
C) BD) C
376) In which diagram do the arrows bestrepresent actual surface winddirections in this Northern Hemispherehigh-pressure center?
A)
B)
C)
D)
7563 - 1 - Page 89
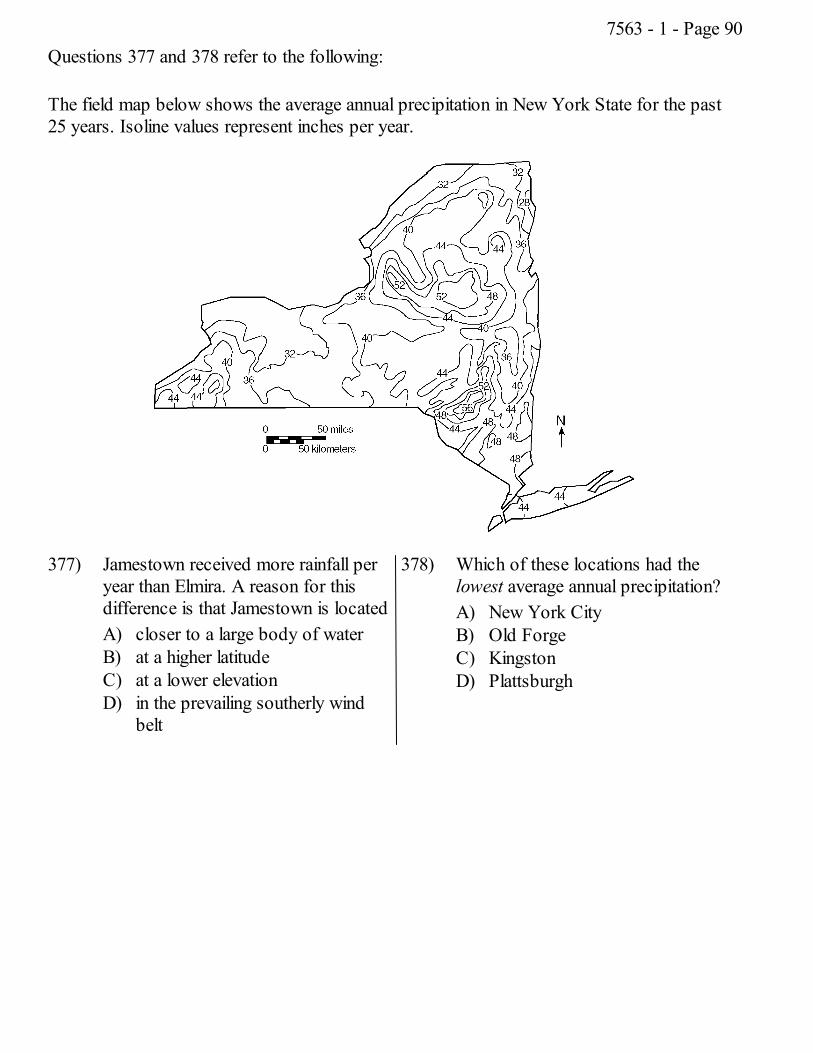
Questions 377 and 378 refer to the following:
The field map below shows the average annual precipitation in New York State for the past25 years. Isoline values represent inches per year.
377) Jamestown received more rainfall peryear than Elmira. A reason for thisdifference is that Jamestown is locatedA) closer to a large body of waterB) at a higher latitudeC) at a lower elevationD) in the prevailing southerly wind
belt
378) Which of these locations had thelowest average annual precipitation?A) New York CityB) Old ForgeC) KingstonD) Plattsburgh
7563 - 1 - Page 90
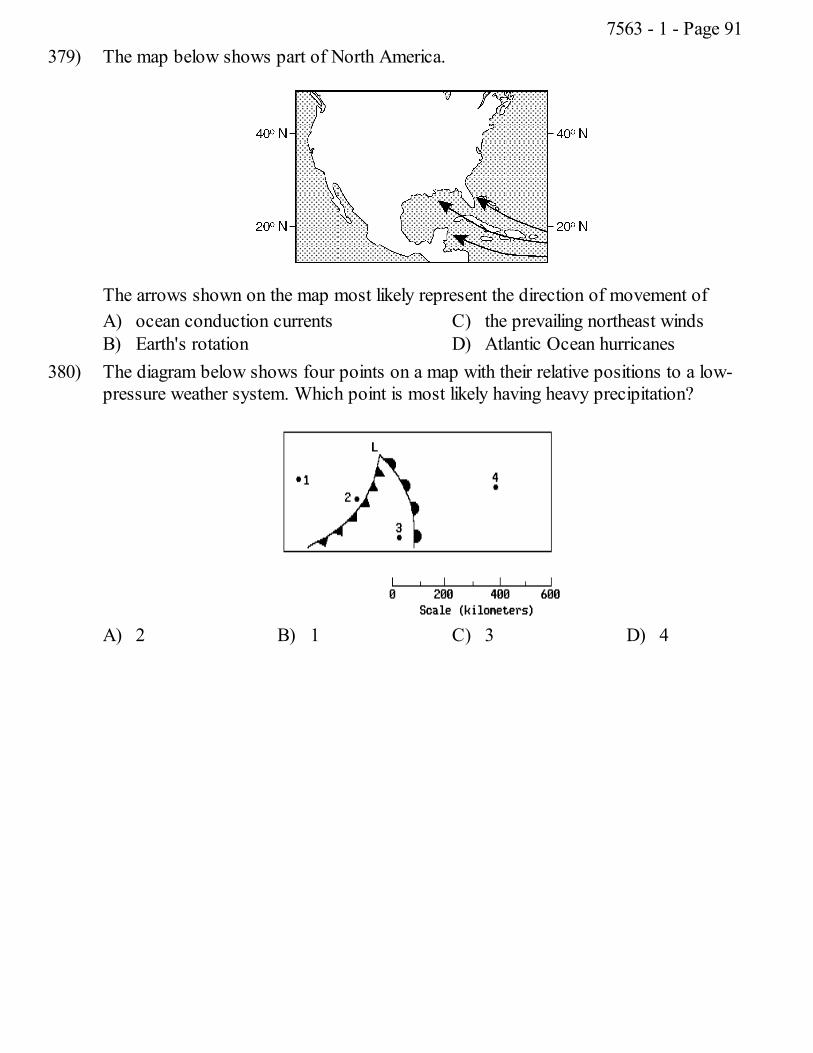
379) The map below shows part of North America.
The arrows shown on the map most likely represent the direction of movement ofA) ocean conduction currentsB) Earth's rotation
C) the prevailing northeast windsD) Atlantic Ocean hurricanes
380) The diagram below shows four points on a map with their relative positions to a low-pressure weather system. Which point is most likely having heavy precipitation?
A) 2 B) 1 C) 3 D) 4
7563 - 1 - Page 91
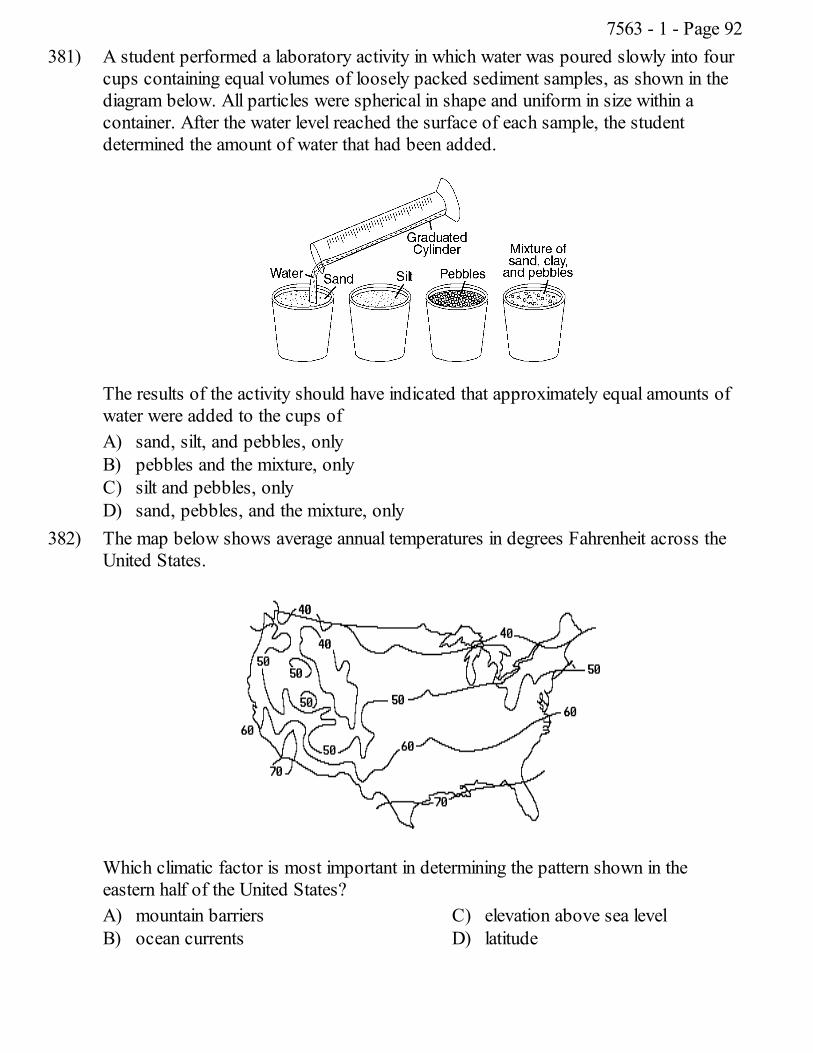
381) A student performed a laboratory activity in which water was poured slowly into fourcups containing equal volumes of loosely packed sediment samples, as shown in thediagram below. All particles were spherical in shape and uniform in size within acontainer. After the water level reached the surface of each sample, the studentdetermined the amount of water that had been added.
The results of the activity should have indicated that approximately equal amounts ofwater were added to the cups ofA) sand, silt, and pebbles, onlyB) pebbles and the mixture, onlyC) silt and pebbles, onlyD) sand, pebbles, and the mixture, only
382) The map below shows average annual temperatures in degrees Fahrenheit across theUnited States.
Which climatic factor is most important in determining the pattern shown in theeastern half of the United States?A) mountain barriersB) ocean currents
C) elevation above sea levelD) latitude
7563 - 1 - Page 92
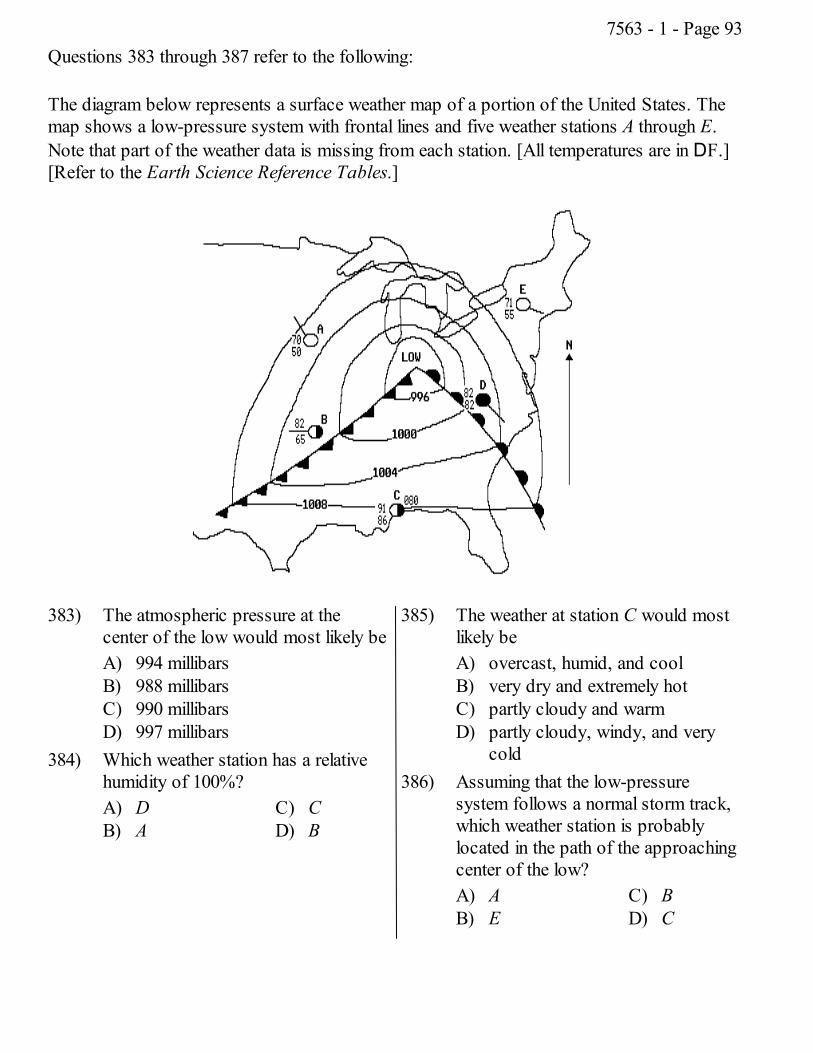
Questions 383 through 387 refer to the following:
The diagram below represents a surface weather map of a portion of the United States. Themap shows a low-pressure system with frontal lines and five weather stations A through E.Note that part of the weather data is missing from each station. [All temperatures are in DF.][Refer to the Earth Science Reference Tables.]
383) The atmospheric pressure at thecenter of the low would most likely beA) 994 millibarsB) 988 millibarsC) 990 millibarsD) 997 millibars
384) Which weather station has a relativehumidity of 100%?A) DB) A
C) CD) B
385) The weather at station C would mostlikely beA) overcast, humid, and coolB) very dry and extremely hotC) partly cloudy and warmD) partly cloudy, windy, and very
cold386) Assuming that the low-pressure
system follows a normal storm track,which weather station is probablylocated in the path of the approachingcenter of the low?A) AB) E
C) BD) C
7563 - 1 - Page 93
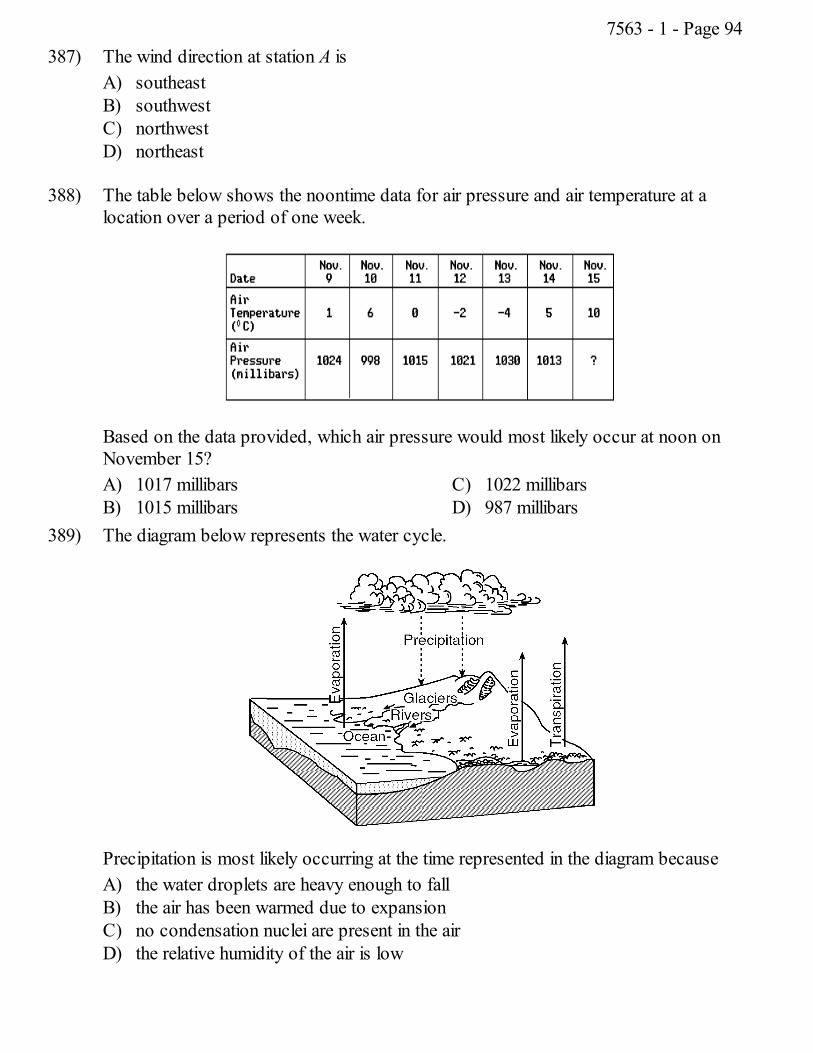
387) The wind direction at station A isA) southeastB) southwestC) northwestD) northeast
388) The table below shows the noontime data for air pressure and air temperature at alocation over a period of one week.
Based on the data provided, which air pressure would most likely occur at noon onNovember 15?A) 1017 millibarsB) 1015 millibars
C) 1022 millibarsD) 987 millibars
389) The diagram below represents the water cycle.
Precipitation is most likely occurring at the time represented in the diagram becauseA) the water droplets are heavy enough to fallB) the air has been warmed due to expansionC) no condensation nuclei are present in the airD) the relative humidity of the air is low
7563 - 1 - Page 94
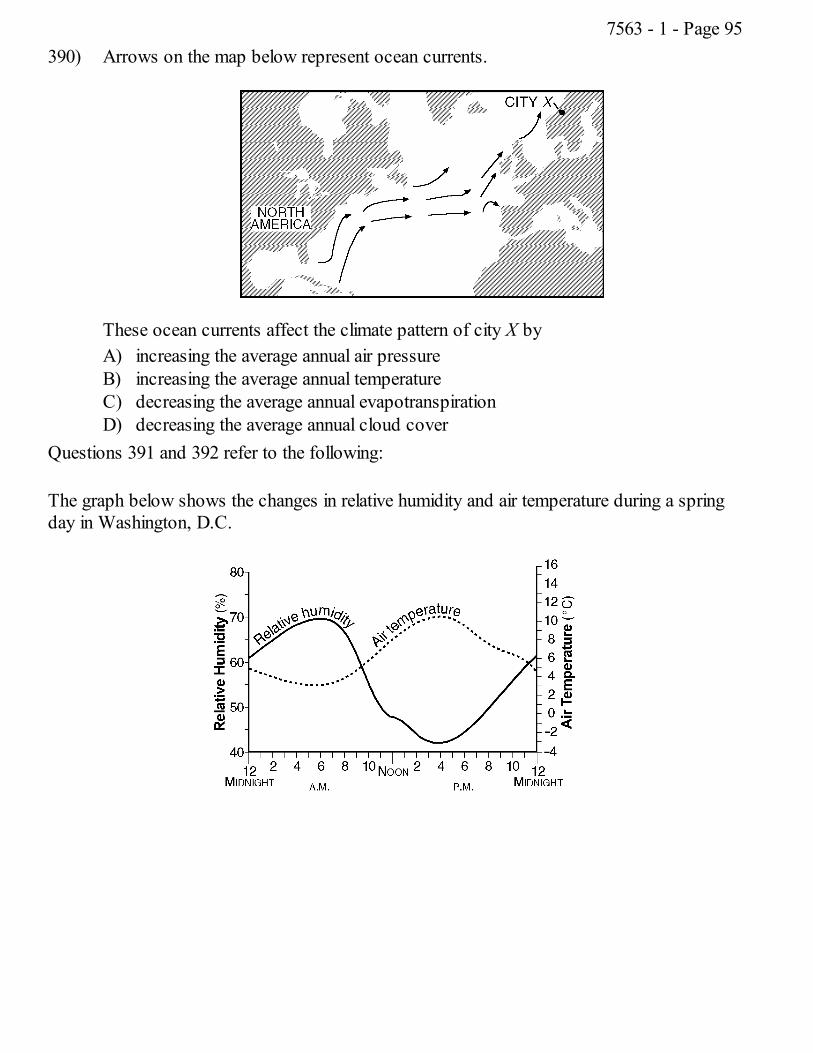
390) Arrows on the map below represent ocean currents.
These ocean currents affect the climate pattern of city X byA) increasing the average annual air pressureB) increasing the average annual temperatureC) decreasing the average annual evapotranspirationD) decreasing the average annual cloud cover
Questions 391 and 392 refer to the following:
The graph below shows the changes in relative humidity and air temperature during a springday in Washington, D.C.
7563 - 1 - Page 95
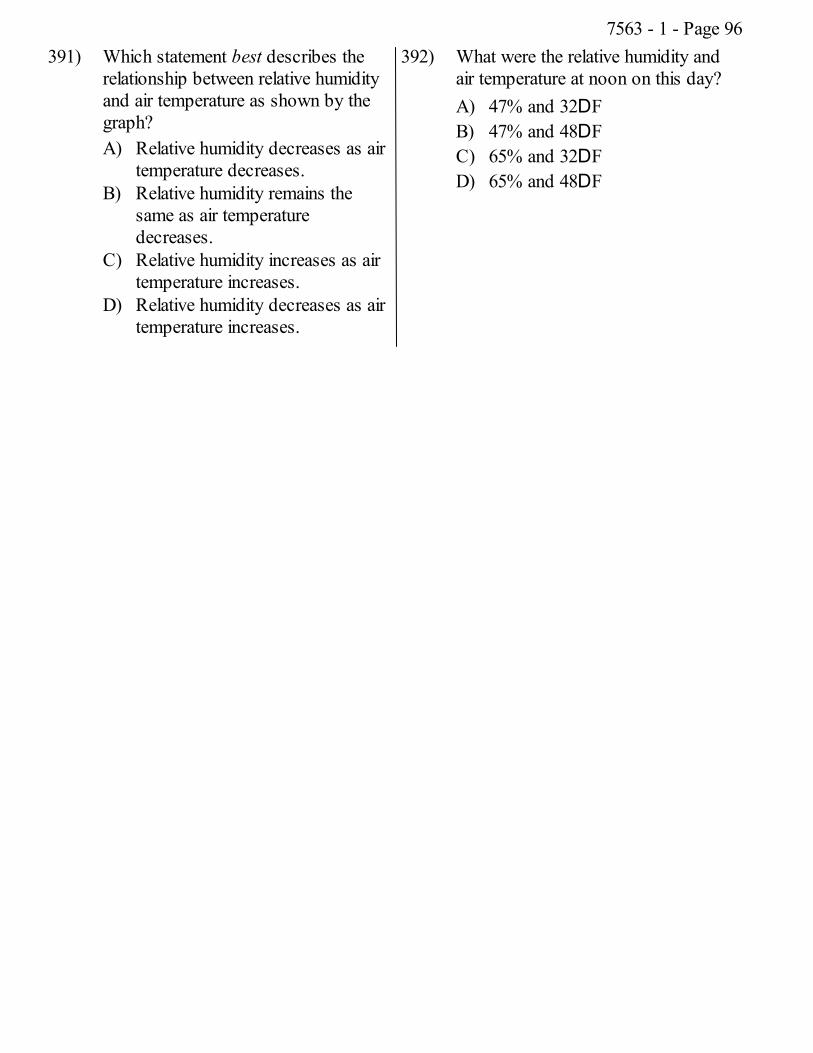
391) Which statement best describes therelationship between relative humidityand air temperature as shown by thegraph?A) Relative humidity decreases as air
temperature decreases.B) Relative humidity remains the
same as air temperaturedecreases.
C) Relative humidity increases as airtemperature increases.
D) Relative humidity decreases as airtemperature increases.
392) What were the relative humidity andair temperature at noon on this day?A) 47% and 32DFB) 47% and 48DFC) 65% and 32DFD) 65% and 48DF
7563 - 1 - Page 96
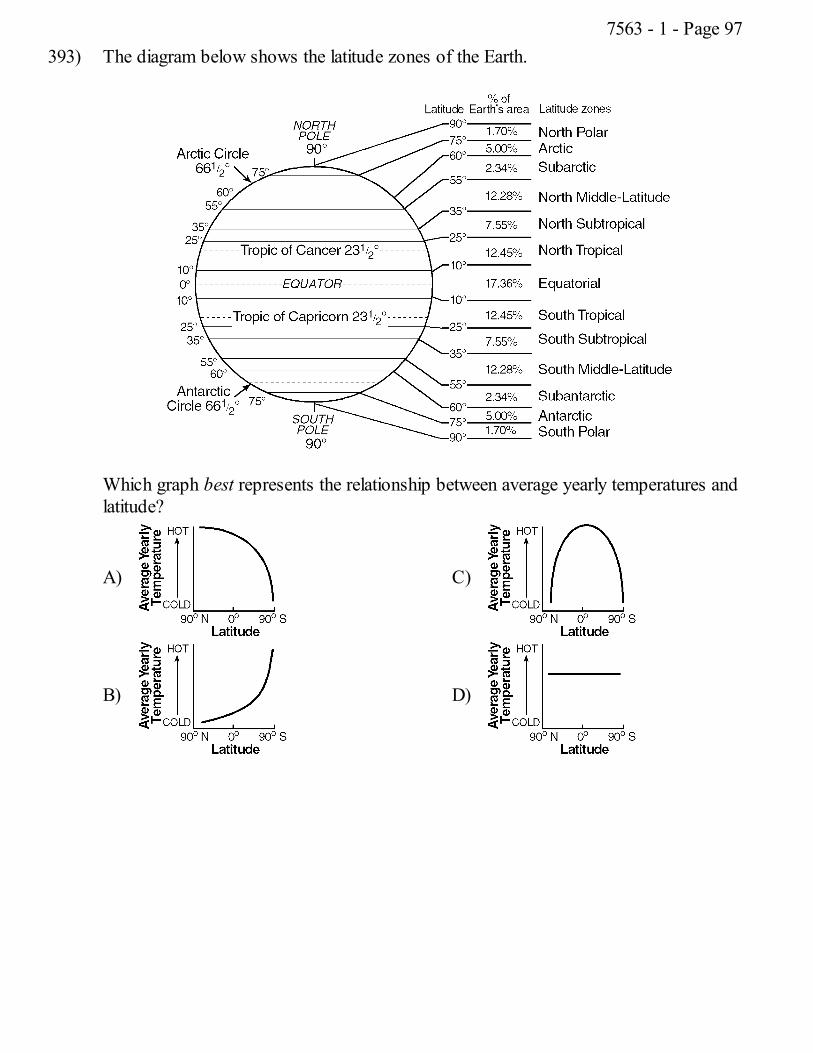
393) The diagram below shows the latitude zones of the Earth.
Which graph best represents the relationship between average yearly temperatures andlatitude?
A)
B)
C)
D)
7563 - 1 - Page 97
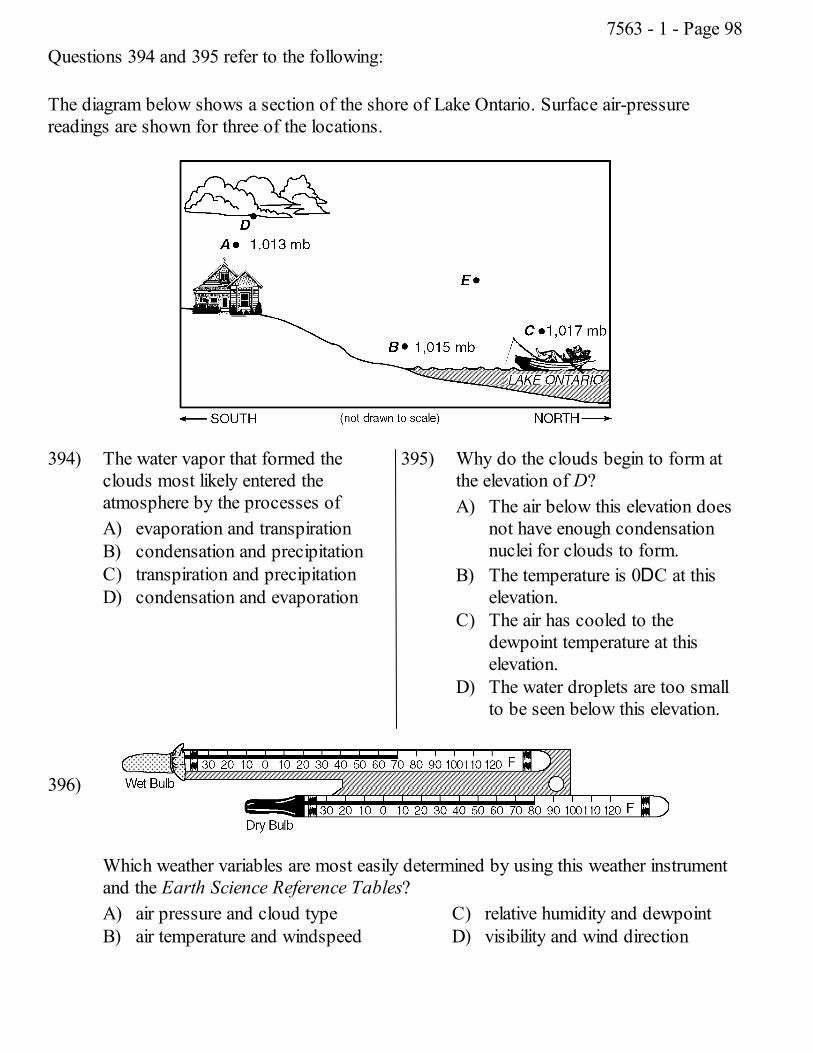
Questions 394 and 395 refer to the following:
The diagram below shows a section of the shore of Lake Ontario. Surface air-pressurereadings are shown for three of the locations.
394) The water vapor that formed theclouds most likely entered theatmosphere by the processes ofA) evaporation and transpirationB) condensation and precipitationC) transpiration and precipitationD) condensation and evaporation
395) Why do the clouds begin to form atthe elevation of D?A) The air below this elevation does
not have enough condensationnuclei for clouds to form.
B) The temperature is 0DC at thiselevation.
C) The air has cooled to thedewpoint temperature at thiselevation.
D) The water droplets are too smallto be seen below this elevation.
396)
Which weather variables are most easily determined by using this weather instrumentand the Earth Science Reference Tables?A) air pressure and cloud typeB) air temperature and windspeed
C) relative humidity and dewpointD) visibility and wind direction
7563 - 1 - Page 98
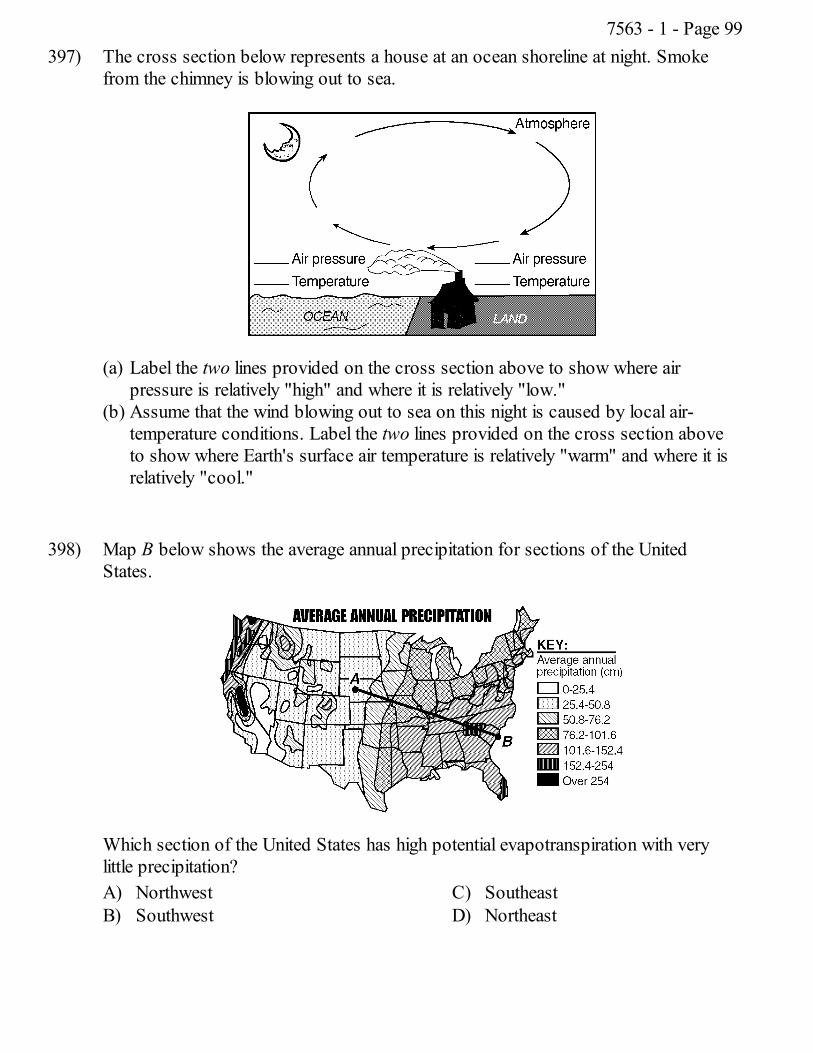
397) The cross section below represents a house at an ocean shoreline at night. Smokefrom the chimney is blowing out to sea.
(a) Label the two lines provided on the cross section above to show where airpressure is relatively "high" and where it is relatively "low."
(b) Assume that the wind blowing out to sea on this night is caused by local air-temperature conditions. Label the two lines provided on the cross section aboveto show where Earth's surface air temperature is relatively "warm" and where it isrelatively "cool."
398) Map B below shows the average annual precipitation for sections of the UnitedStates.
Which section of the United States has high potential evapotranspiration with verylittle precipitation?A) NorthwestB) Southwest
C) SoutheastD) Northeast
7563 - 1 - Page 99
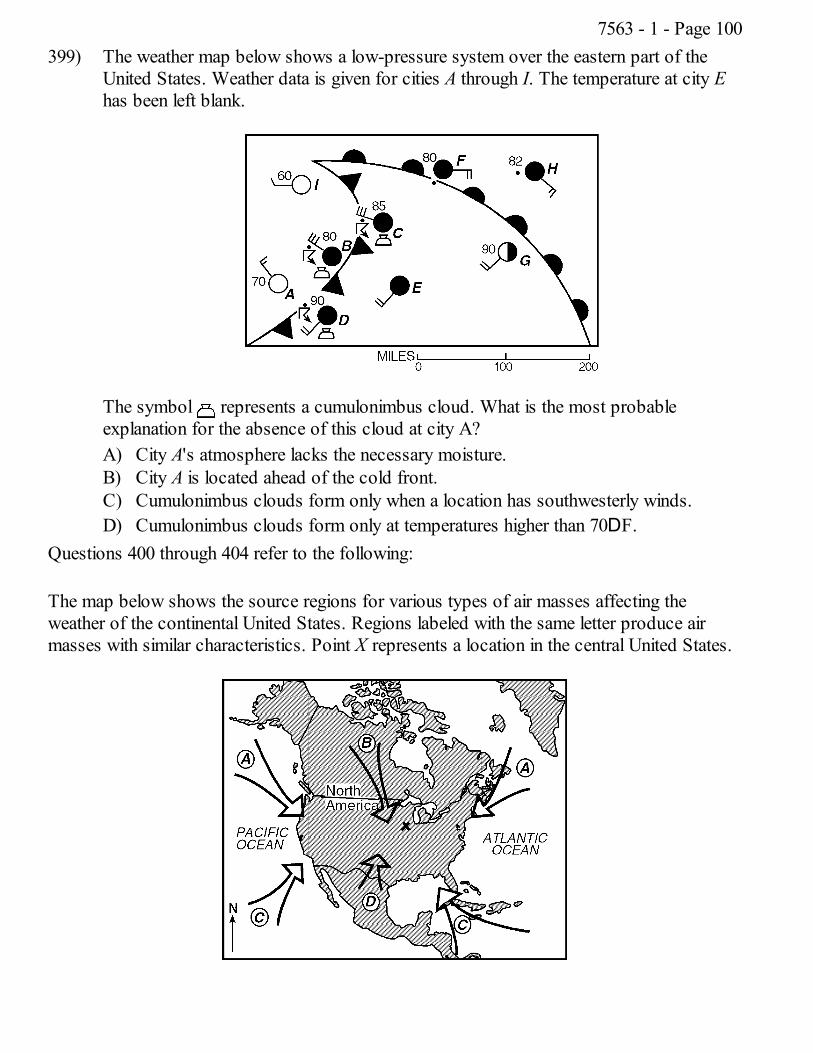
399) The weather map below shows a low-pressure system over the eastern part of theUnited States. Weather data is given for cities A through I. The temperature at city Ehas been left blank.
The symbol represents a cumulonimbus cloud. What is the most probableexplanation for the absence of this cloud at city A?A) City A's atmosphere lacks the necessary moisture.B) City A is located ahead of the cold front.C) Cumulonimbus clouds form only when a location has southwesterly winds.D) Cumulonimbus clouds form only at temperatures higher than 70DF.
Questions 400 through 404 refer to the following:
The map below shows the source regions for various types of air masses affecting theweather of the continental United States. Regions labeled with the same letter produce airmasses with similar characteristics. Point X represents a location in the central United States.
7563 - 1 - Page 100
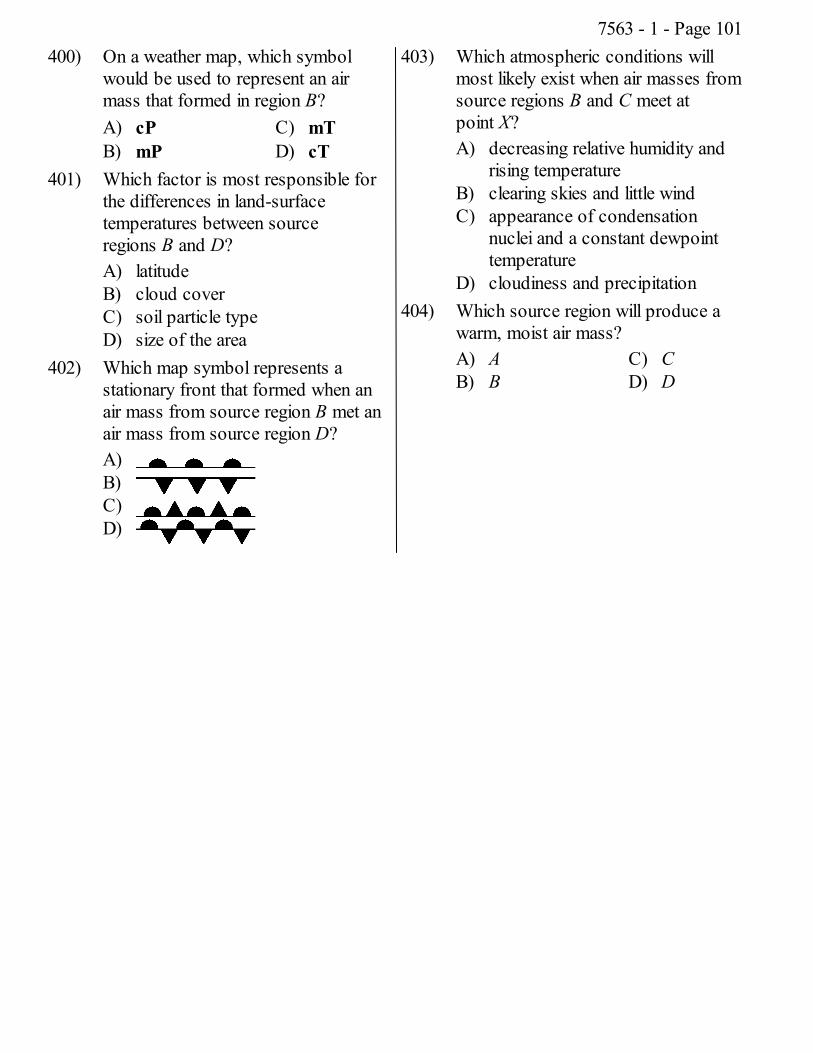
400) On a weather map, which symbolwould be used to represent an airmass that formed in region B?A) cPB) mP
C) mTD) cT
401) Which factor is most responsible forthe differences in land-surfacetemperatures between sourceregions B and D?A) latitudeB) cloud coverC) soil particle typeD) size of the area
402) Which map symbol represents astationary front that formed when anair mass from source region B met anair mass from source region D?A)B)C)D)
403) Which atmospheric conditions willmost likely exist when air masses fromsource regions B and C meet atpoint X?A) decreasing relative humidity and
rising temperatureB) clearing skies and little windC) appearance of condensation
nuclei and a constant dewpointtemperature
D) cloudiness and precipitation404) Which source region will produce a
warm, moist air mass?A) AB) B
C) CD) D
7563 - 1 - Page 101
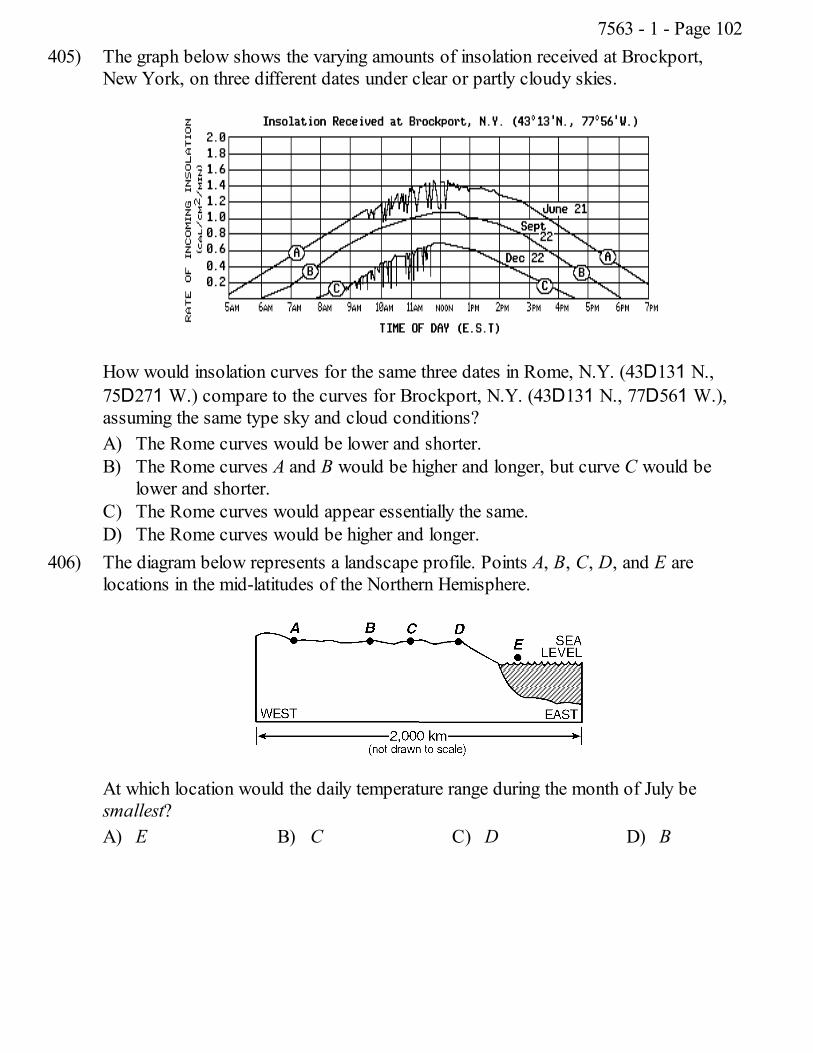
405) The graph below shows the varying amounts of insolation received at Brockport,New York, on three different dates under clear or partly cloudy skies.
How would insolation curves for the same three dates in Rome, N.Y. (43D131 N.,75D271 W.) compare to the curves for Brockport, N.Y. (43D131 N., 77D561 W.),assuming the same type sky and cloud conditions?A) The Rome curves would be lower and shorter.B) The Rome curves A and B would be higher and longer, but curve C would be
lower and shorter.C) The Rome curves would appear essentially the same.D) The Rome curves would be higher and longer.
406) The diagram below represents a landscape profile. Points A, B, C, D, and E arelocations in the mid-latitudes of the Northern Hemisphere.
At which location would the daily temperature range during the month of July besmallest?A) E B) C C) D D) B
7563 - 1 - Page 102
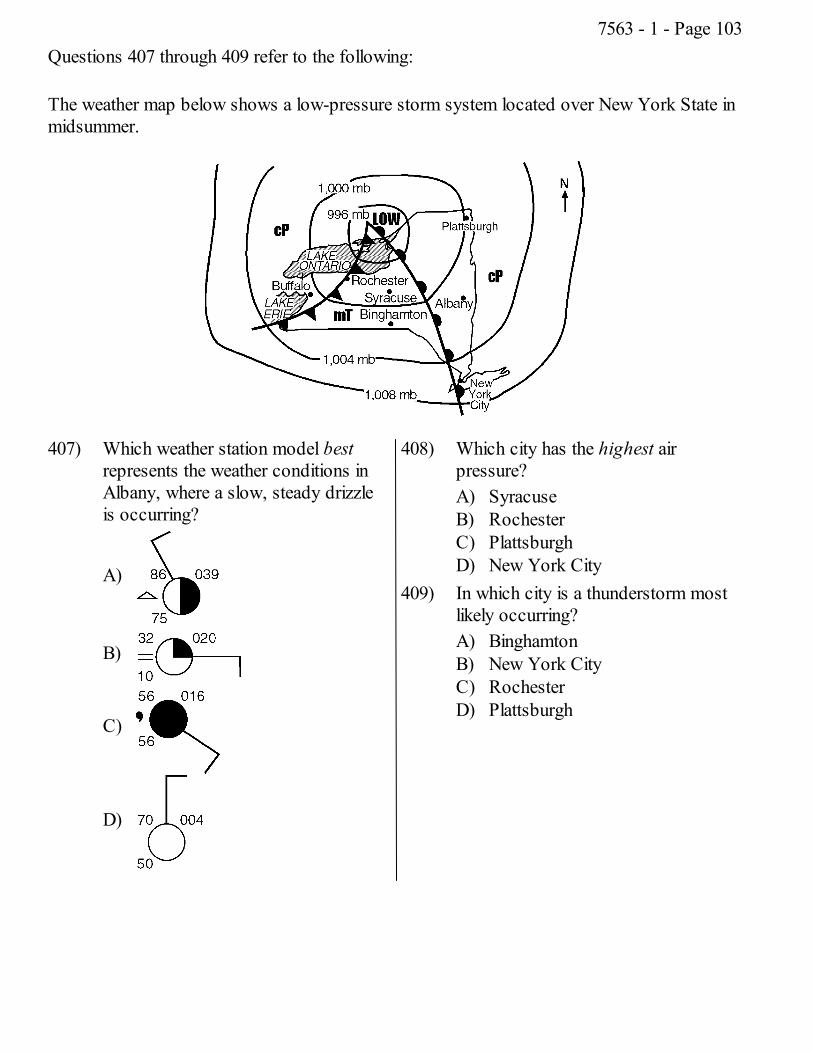
Questions 407 through 409 refer to the following:
The weather map below shows a low-pressure storm system located over New York State inmidsummer.
407) Which weather station model bestrepresents the weather conditions inAlbany, where a slow, steady drizzleis occurring?
A)
B)
C)
D)
408) Which city has the highest airpressure?A) SyracuseB) RochesterC) PlattsburghD) New York City
409) In which city is a thunderstorm mostlikely occurring?A) BinghamtonB) New York CityC) RochesterD) Plattsburgh
7563 - 1 - Page 103
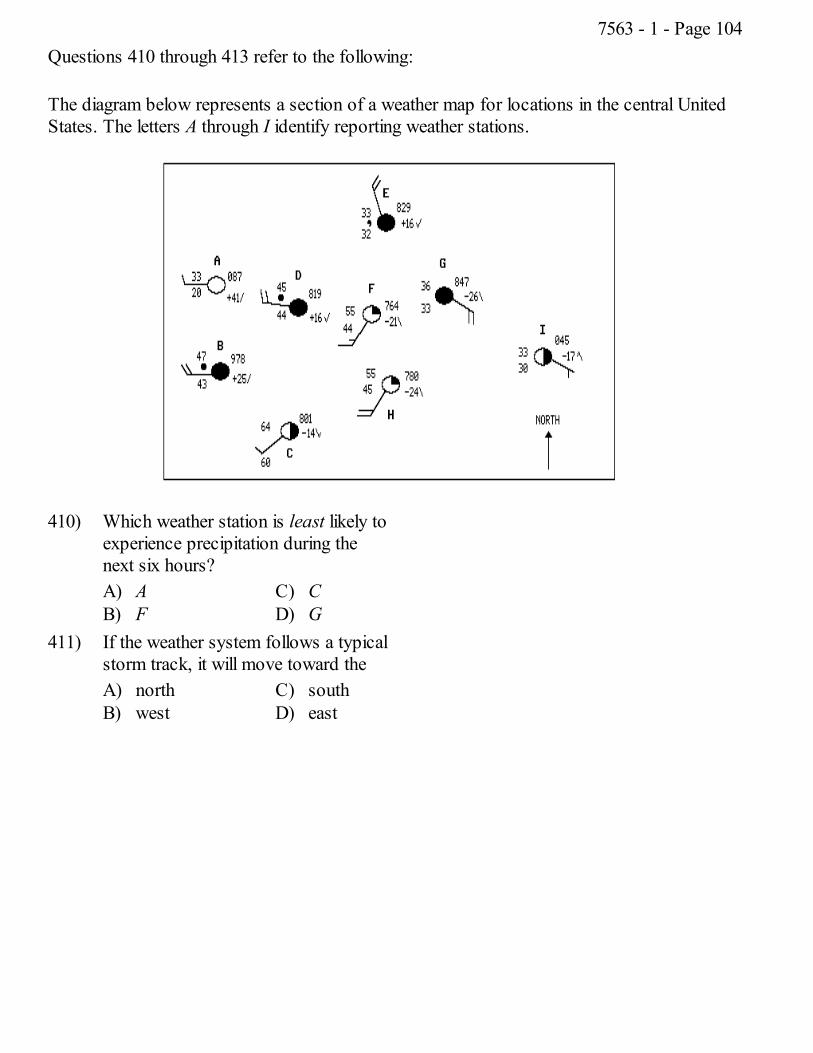
Questions 410 through 413 refer to the following:
The diagram below represents a section of a weather map for locations in the central UnitedStates. The letters A through I identify reporting weather stations.
410) Which weather station is least likely toexperience precipitation during thenext six hours?A) AB) F
C) CD) G
411) If the weather system follows a typicalstorm track, it will move toward theA) northB) west
C) southD) east
7563 - 1 - Page 104
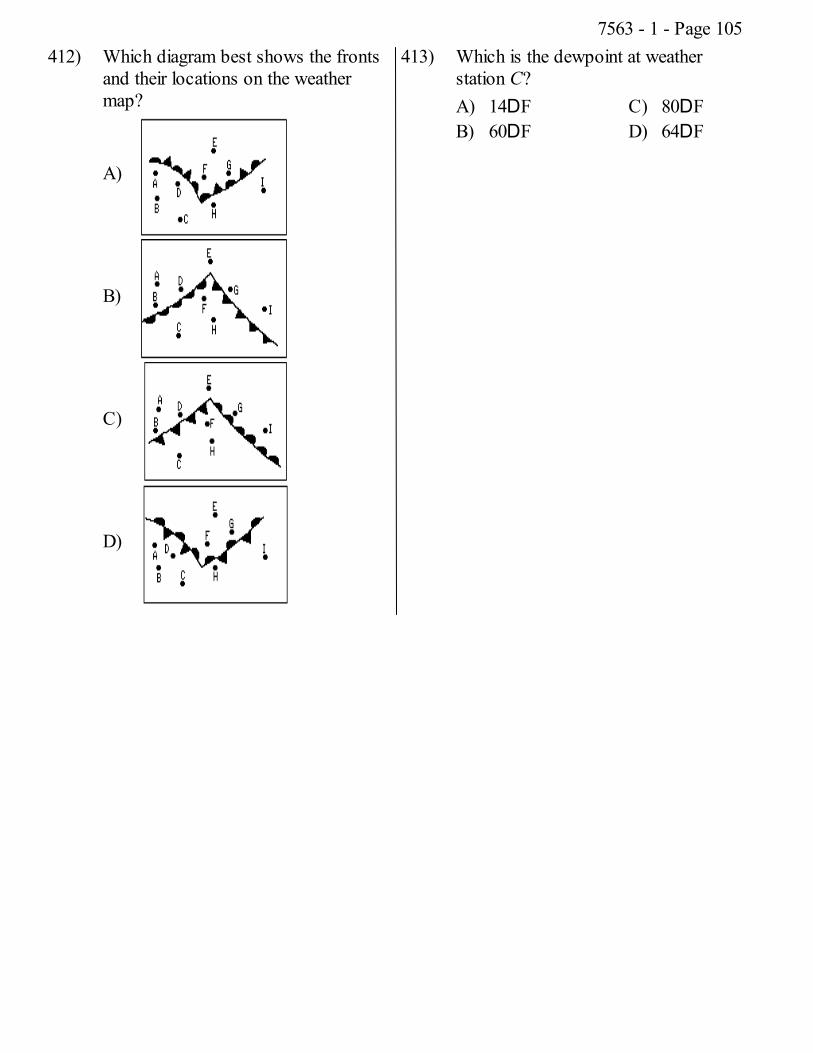
412) Which diagram best shows the frontsand their locations on the weathermap?
A)
B)
C)
D)
413) Which is the dewpoint at weatherstation C?A) 14DFB) 60DF
C) 80DFD) 64DF
7563 - 1 - Page 105
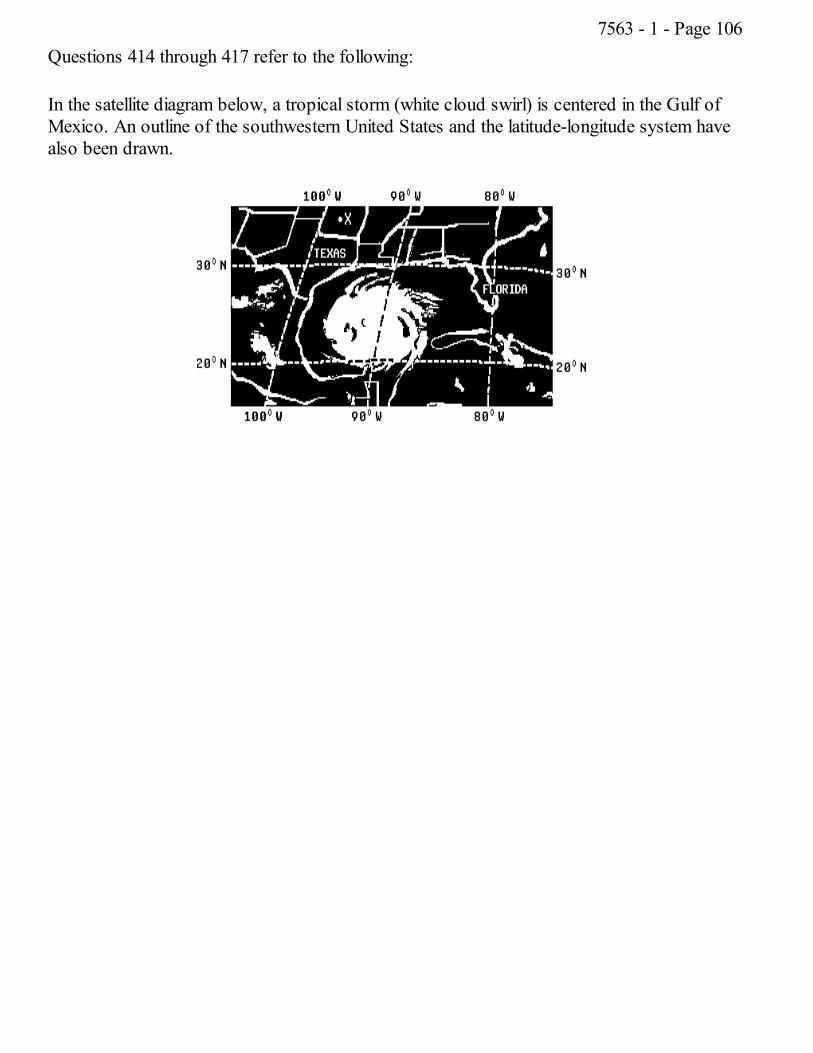
Questions 414 through 417 refer to the following:
In the satellite diagram below, a tropical storm (white cloud swirl) is centered in the Gulf ofMexico. An outline of the southwestern United States and the latitude-longitude system havealso been drawn.
7563 - 1 - Page 106
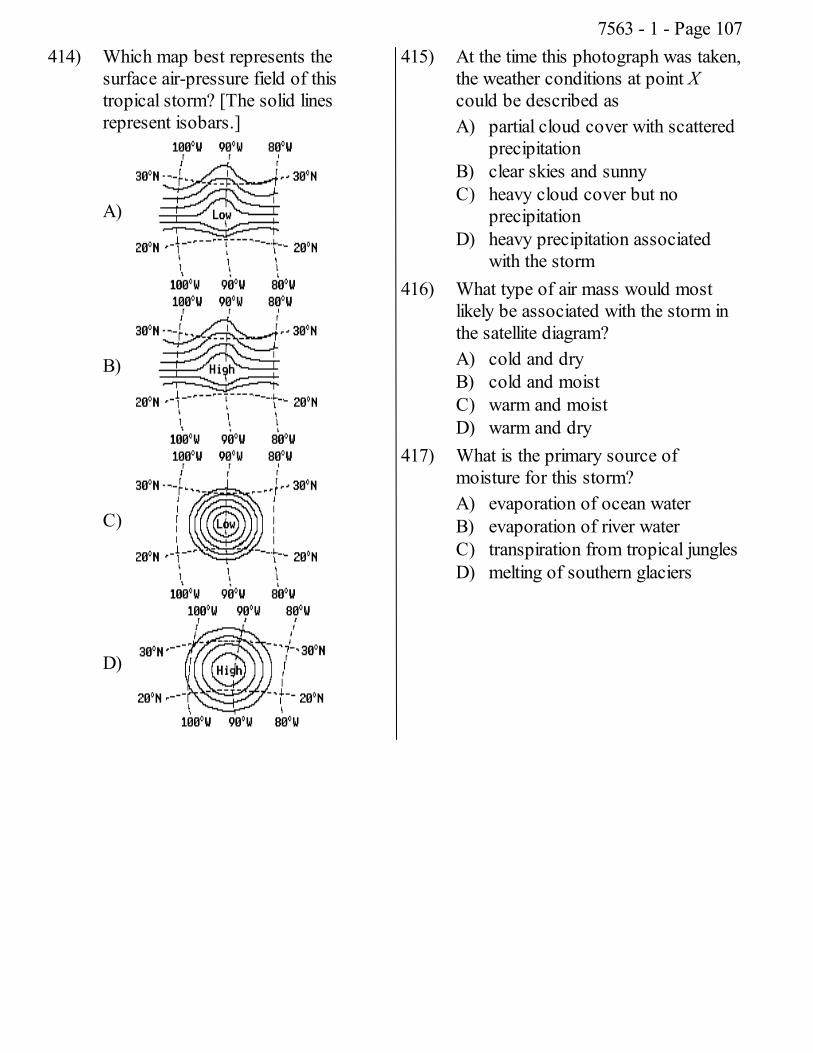
414) Which map best represents thesurface air-pressure field of thistropical storm? [The solid linesrepresent isobars.]
A)
B)
C)
D)
415) At the time this photograph was taken,the weather conditions at point Xcould be described asA) partial cloud cover with scattered
precipitationB) clear skies and sunnyC) heavy cloud cover but no
precipitationD) heavy precipitation associated
with the storm416) What type of air mass would most
likely be associated with the storm inthe satellite diagram?A) cold and dryB) cold and moistC) warm and moistD) warm and dry
417) What is the primary source ofmoisture for this storm?A) evaporation of ocean waterB) evaporation of river waterC) transpiration from tropical junglesD) melting of southern glaciers
7563 - 1 - Page 107
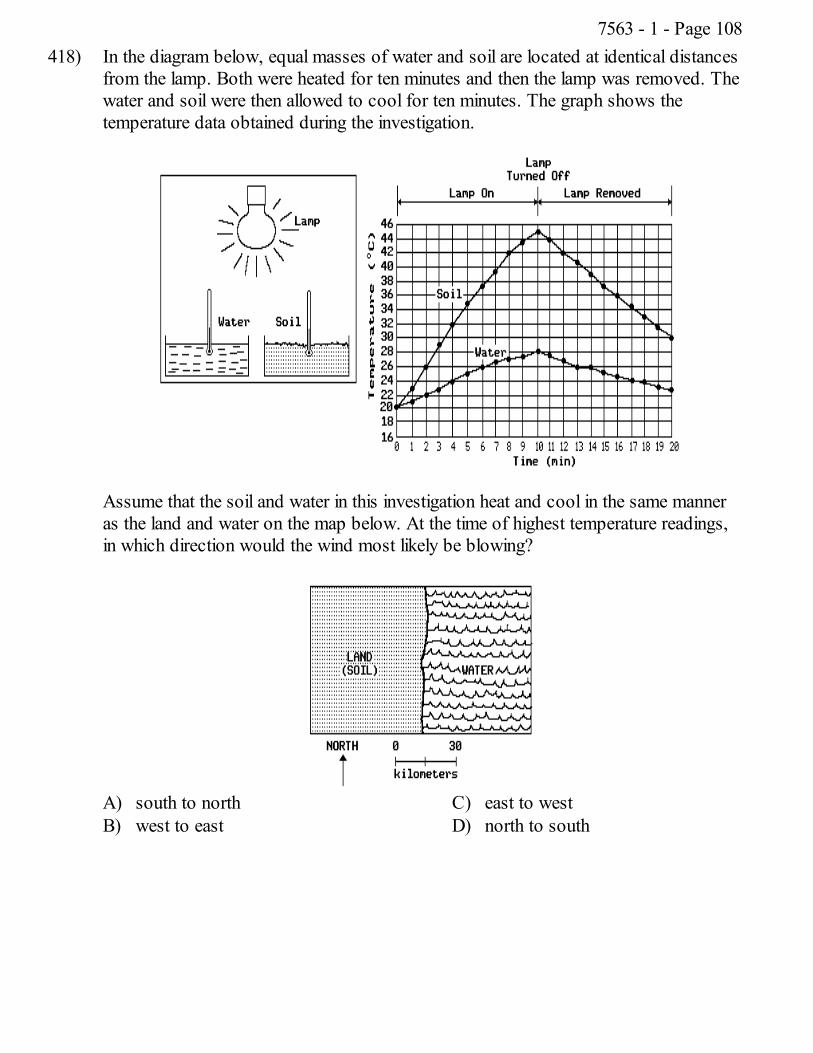
418) In the diagram below, equal masses of water and soil are located at identical distancesfrom the lamp. Both were heated for ten minutes and then the lamp was removed. Thewater and soil were then allowed to cool for ten minutes. The graph shows thetemperature data obtained during the investigation.
Assume that the soil and water in this investigation heat and cool in the same manneras the land and water on the map below. At the time of highest temperature readings,in which direction would the wind most likely be blowing?
A) south to northB) west to east
C) east to westD) north to south
7563 - 1 - Page 108
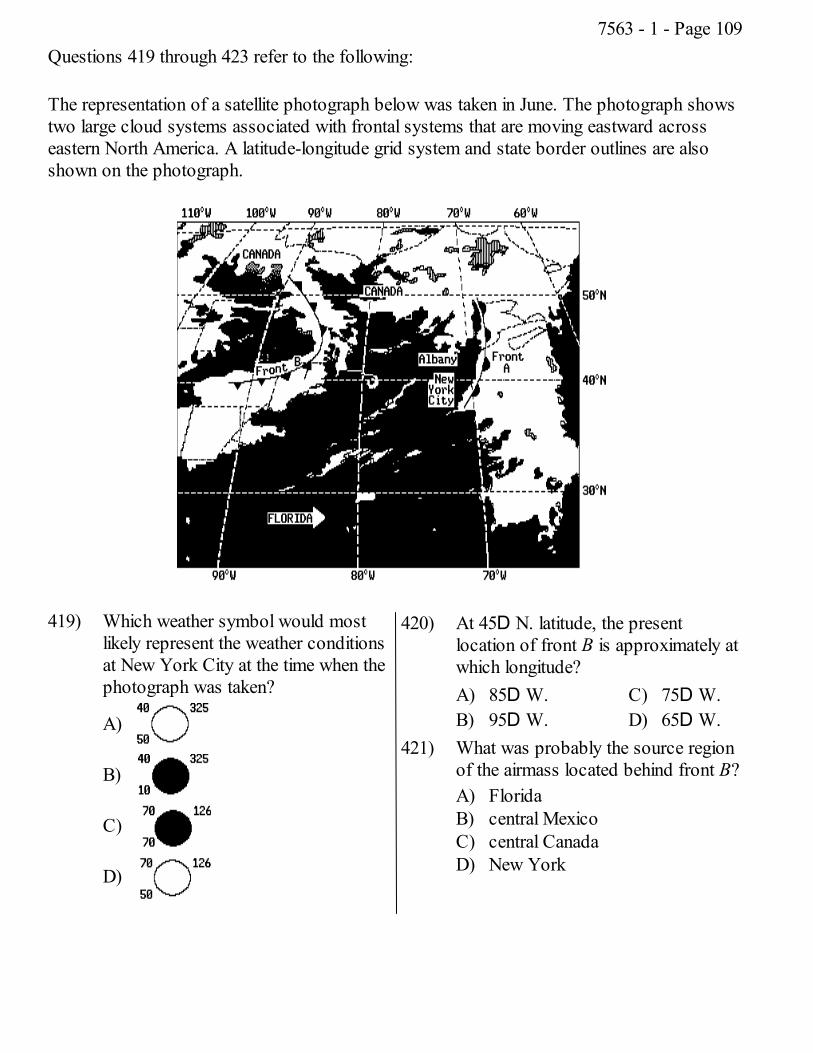
Questions 419 through 423 refer to the following:
The representation of a satellite photograph below was taken in June. The photograph showstwo large cloud systems associated with frontal systems that are moving eastward acrosseastern North America. A latitude-longitude grid system and state border outlines are alsoshown on the photograph.
419) Which weather symbol would mostlikely represent the weather conditionsat New York City at the time when thephotograph was taken?
A)
B)
C)
D)
420) At 45D N. latitude, the presentlocation of front B is approximately atwhich longitude?A) 85D W.B) 95D W.
C) 75D W.D) 65D W.
421) What was probably the source regionof the airmass located behind front B?A) FloridaB) central MexicoC) central CanadaD) New York
7563 - 1 - Page 109
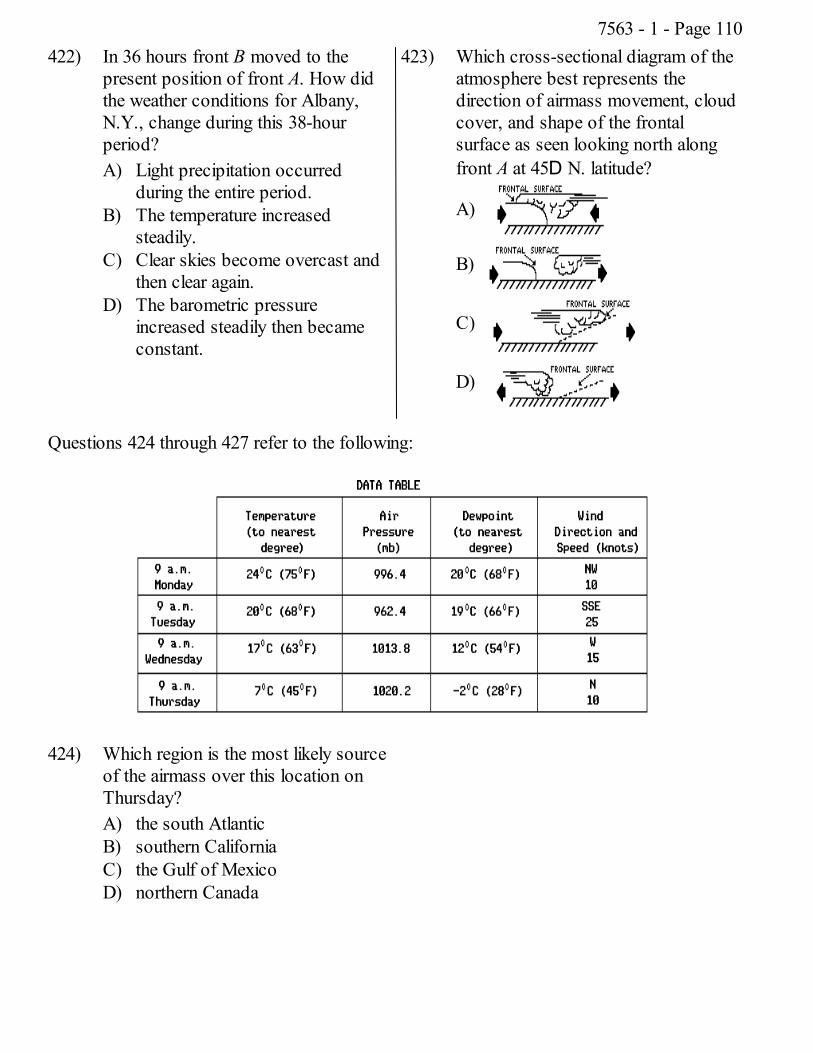
422) In 36 hours front B moved to thepresent position of front A. How didthe weather conditions for Albany,N.Y., change during this 38-hourperiod?A) Light precipitation occurred
during the entire period.B) The temperature increased
steadily.C) Clear skies become overcast and
then clear again.D) The barometric pressure
increased steadily then becameconstant.
423) Which cross-sectional diagram of theatmosphere best represents thedirection of airmass movement, cloudcover, and shape of the frontalsurface as seen looking north alongfront A at 45D N. latitude?
A)
B)
C)
D)
Questions 424 through 427 refer to the following:
424) Which region is the most likely sourceof the airmass over this location onThursday?A) the south AtlanticB) southern CaliforniaC) the Gulf of MexicoD) northern Canada
7563 - 1 - Page 110
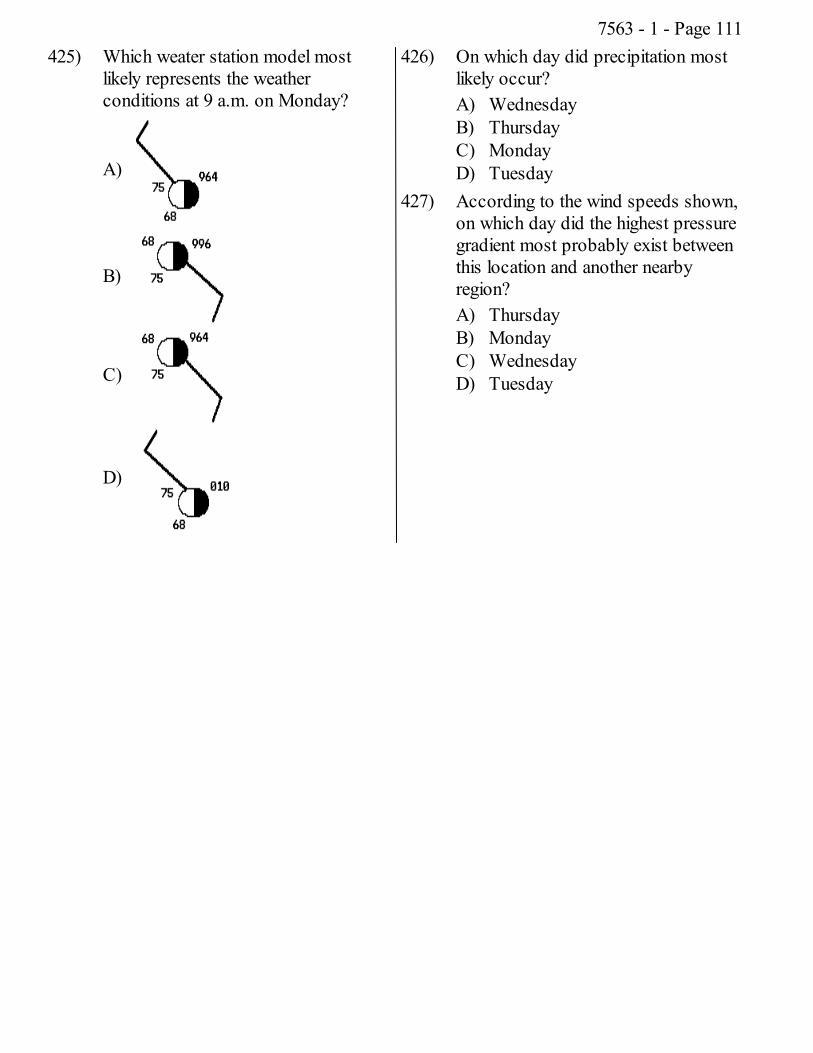
425) Which weater station model mostlikely represents the weatherconditions at 9 a.m. on Monday?
A)
B)
C)
D)
426) On which day did precipitation mostlikely occur?A) WednesdayB) ThursdayC) MondayD) Tuesday
427) According to the wind speeds shown,on which day did the highest pressuregradient most probably exist betweenthis location and another nearbyregion?A) ThursdayB) MondayC) WednesdayD) Tuesday
7563 - 1 - Page 111
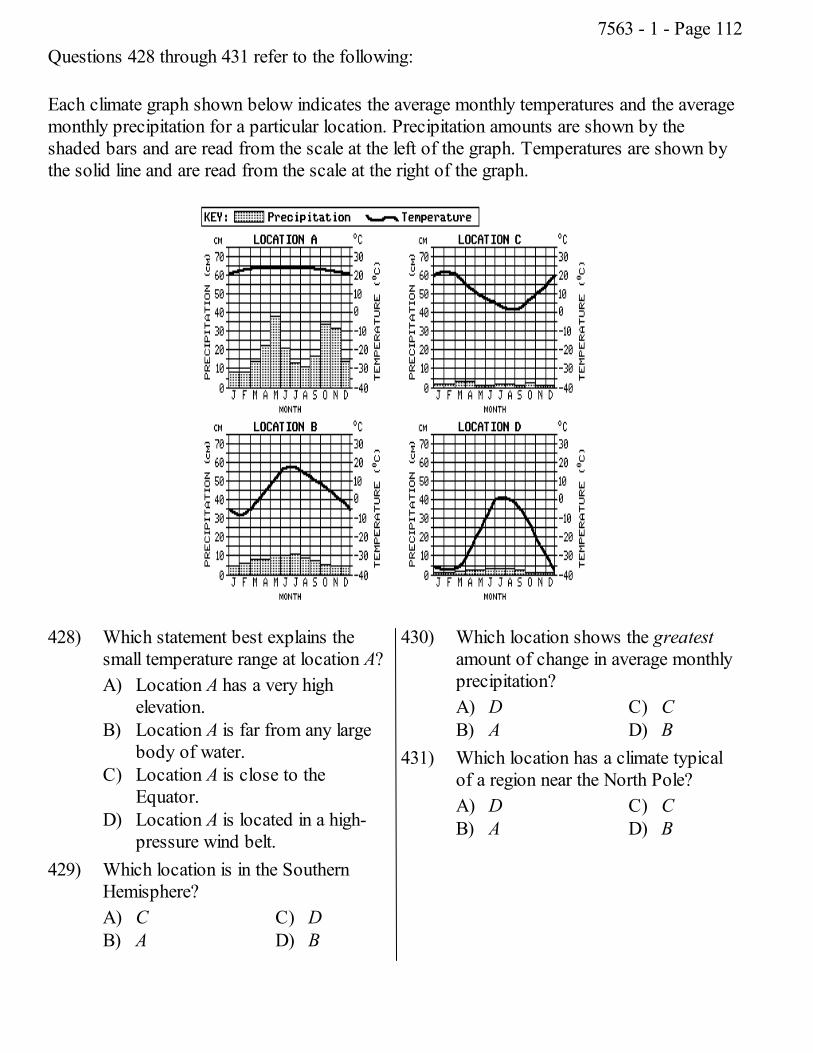
Questions 428 through 431 refer to the following:
Each climate graph shown below indicates the average monthly temperatures and the averagemonthly precipitation for a particular location. Precipitation amounts are shown by theshaded bars and are read from the scale at the left of the graph. Temperatures are shown bythe solid line and are read from the scale at the right of the graph.
428) Which statement best explains thesmall temperature range at location A?A) Location A has a very high
elevation.B) Location A is far from any large
body of water.C) Location A is close to the
Equator.D) Location A is located in a high-
pressure wind belt.429) Which location is in the Southern
Hemisphere?A) CB) A
C) DD) B
430) Which location shows the greatestamount of change in average monthlyprecipitation?A) DB) A
C) CD) B
431) Which location has a climate typicalof a region near the North Pole?A) DB) A
C) CD) B
7563 - 1 - Page 112
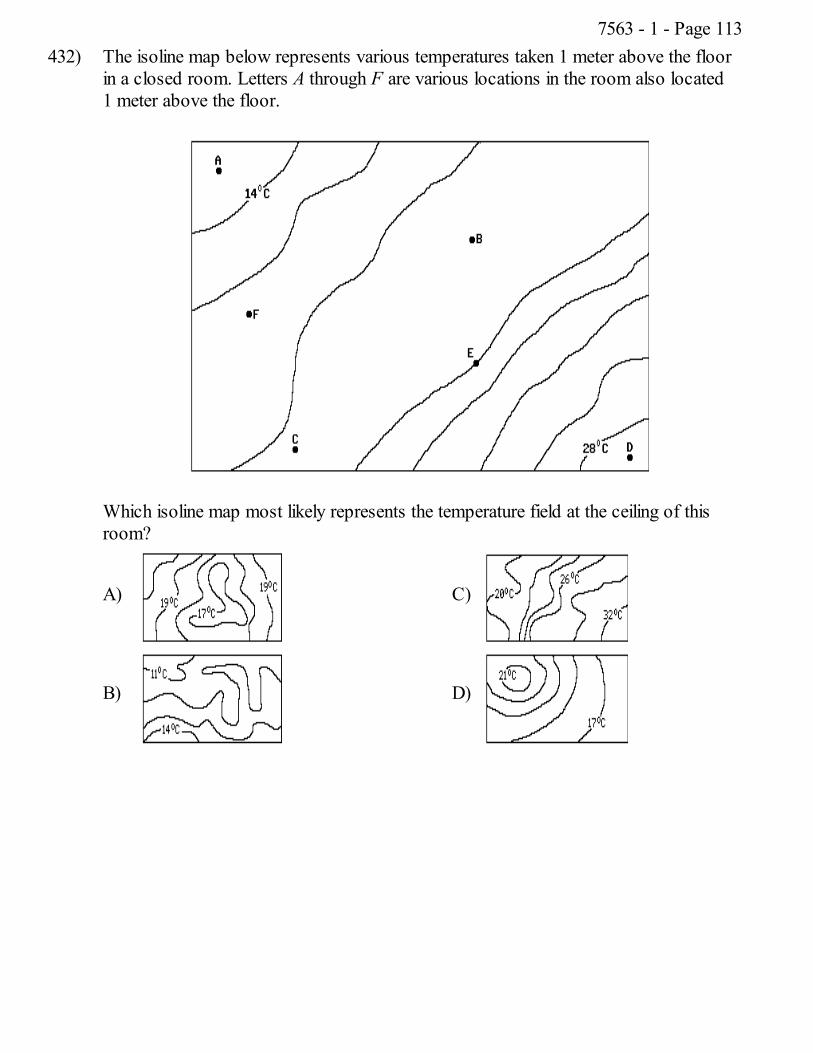
432) The isoline map below represents various temperatures taken 1 meter above the floorin a closed room. Letters A through F are various locations in the room also located1 meter above the floor.
Which isoline map most likely represents the temperature field at the ceiling of thisroom?
A)
B)
C)
D)
7563 - 1 - Page 113
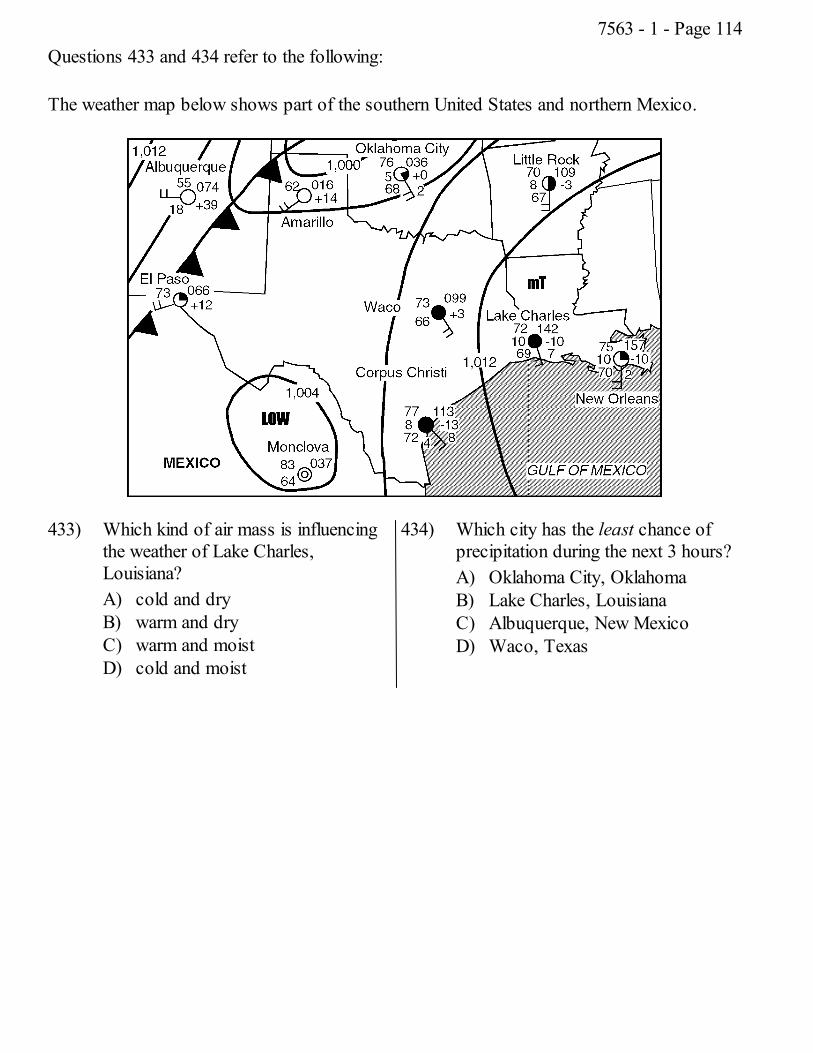
Questions 433 and 434 refer to the following:
The weather map below shows part of the southern United States and northern Mexico.
433) Which kind of air mass is influencingthe weather of Lake Charles,Louisiana?A) cold and dryB) warm and dryC) warm and moistD) cold and moist
434) Which city has the least chance ofprecipitation during the next 3 hours?A) Oklahoma City, OklahomaB) Lake Charles, LouisianaC) Albuquerque, New MexicoD) Waco, Texas
7563 - 1 - Page 114
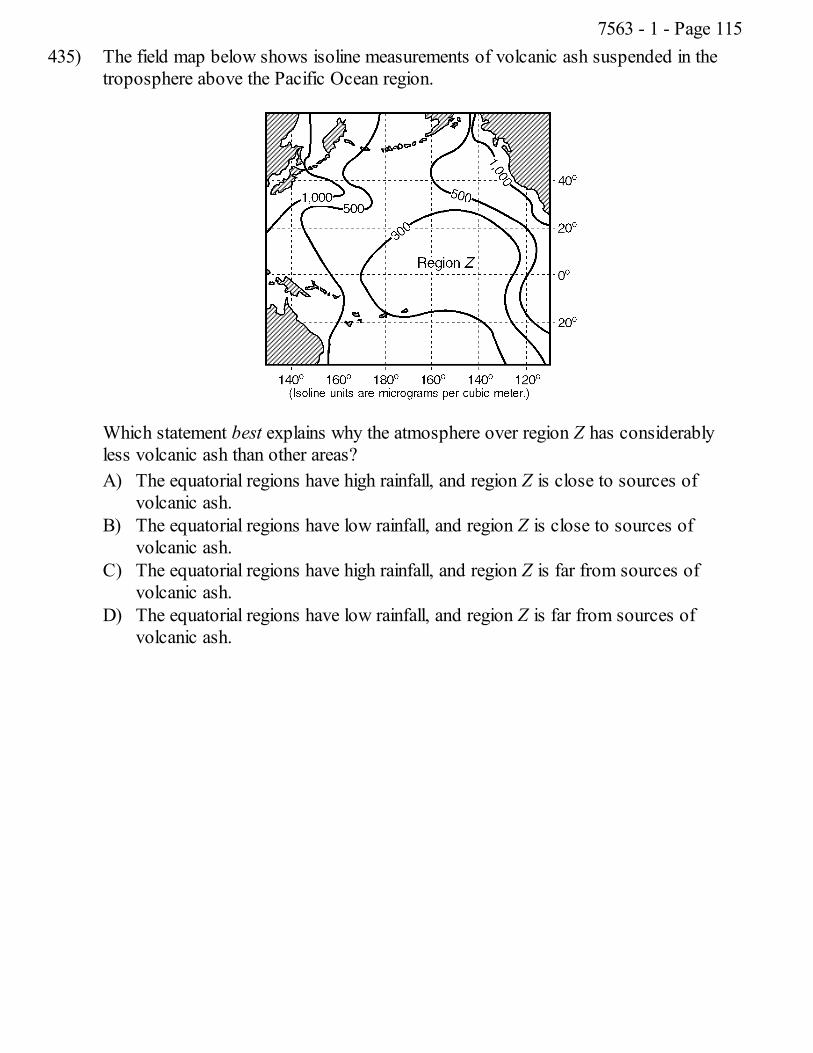
435) The field map below shows isoline measurements of volcanic ash suspended in thetroposphere above the Pacific Ocean region.
Which statement best explains why the atmosphere over region Z has considerablyless volcanic ash than other areas?A) The equatorial regions have high rainfall, and region Z is close to sources of
volcanic ash.B) The equatorial regions have low rainfall, and region Z is close to sources of
volcanic ash.C) The equatorial regions have high rainfall, and region Z is far from sources of
volcanic ash.D) The equatorial regions have low rainfall, and region Z is far from sources of
volcanic ash.
7563 - 1 - Page 115
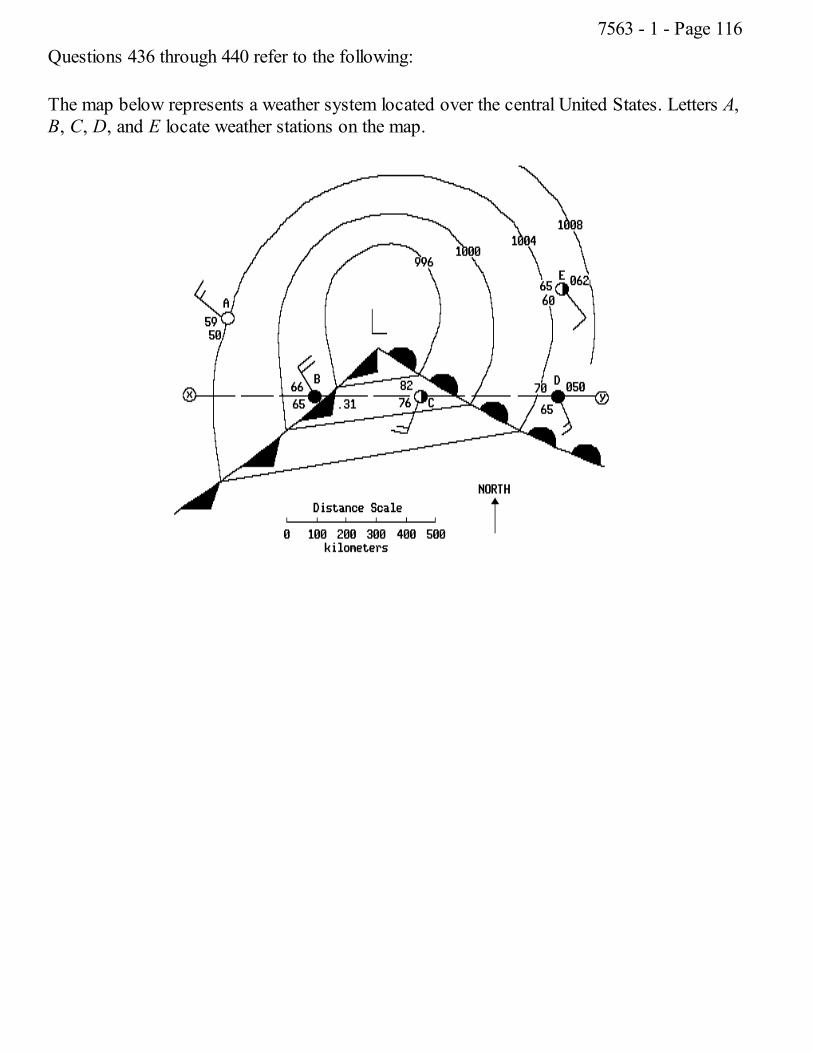
Questions 436 through 440 refer to the following:
The map below represents a weather system located over the central United States. Letters A,B, C, D, and E locate weather stations on the map.
7563 - 1 - Page 116
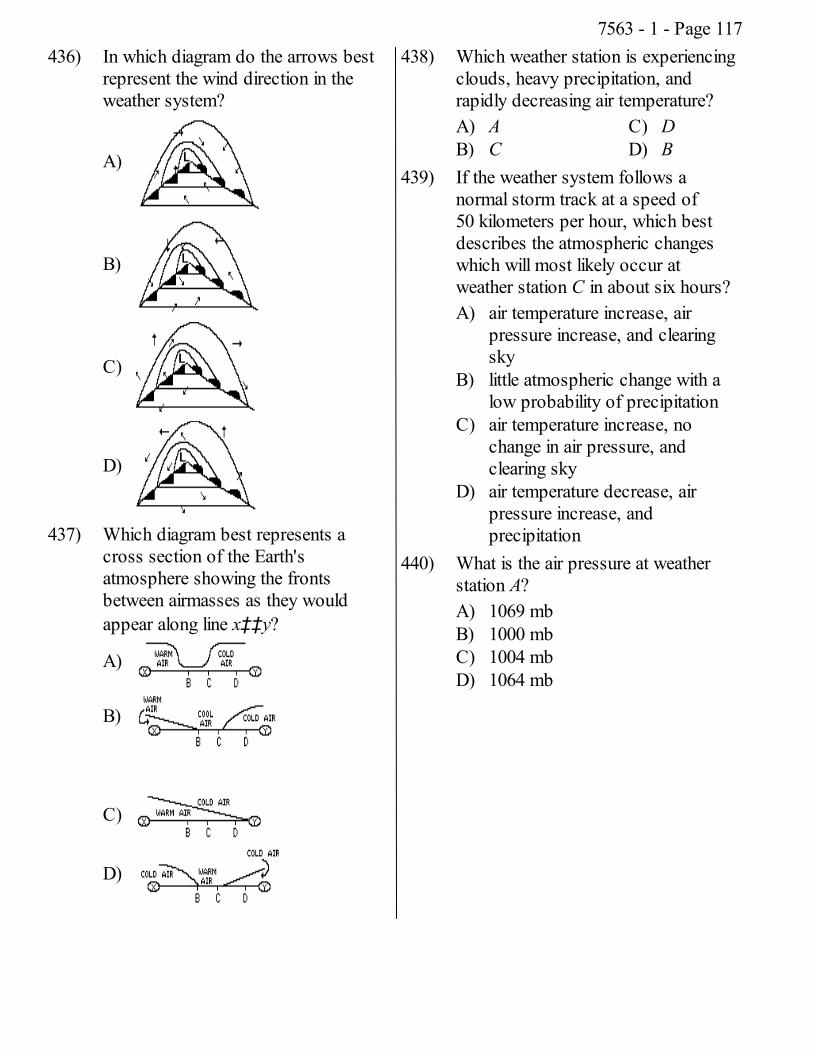
436) In which diagram do the arrows bestrepresent the wind direction in theweather system?
A)
B)
C)
D)
437) Which diagram best represents across section of the Earth'satmosphere showing the frontsbetween airmasses as they wouldappear along line x‡‡y?
A)
B)
C)
D)
438) Which weather station is experiencingclouds, heavy precipitation, andrapidly decreasing air temperature?A) AB) C
C) DD) B
439) If the weather system follows anormal storm track at a speed of50 kilometers per hour, which bestdescribes the atmospheric changeswhich will most likely occur atweather station C in about six hours?A) air temperature increase, air
pressure increase, and clearingsky
B) little atmospheric change with alow probability of precipitation
C) air temperature increase, nochange in air pressure, andclearing sky
D) air temperature decrease, airpressure increase, andprecipitation
440) What is the air pressure at weatherstation A?A) 1069 mbB) 1000 mbC) 1004 mbD) 1064 mb
7563 - 1 - Page 117
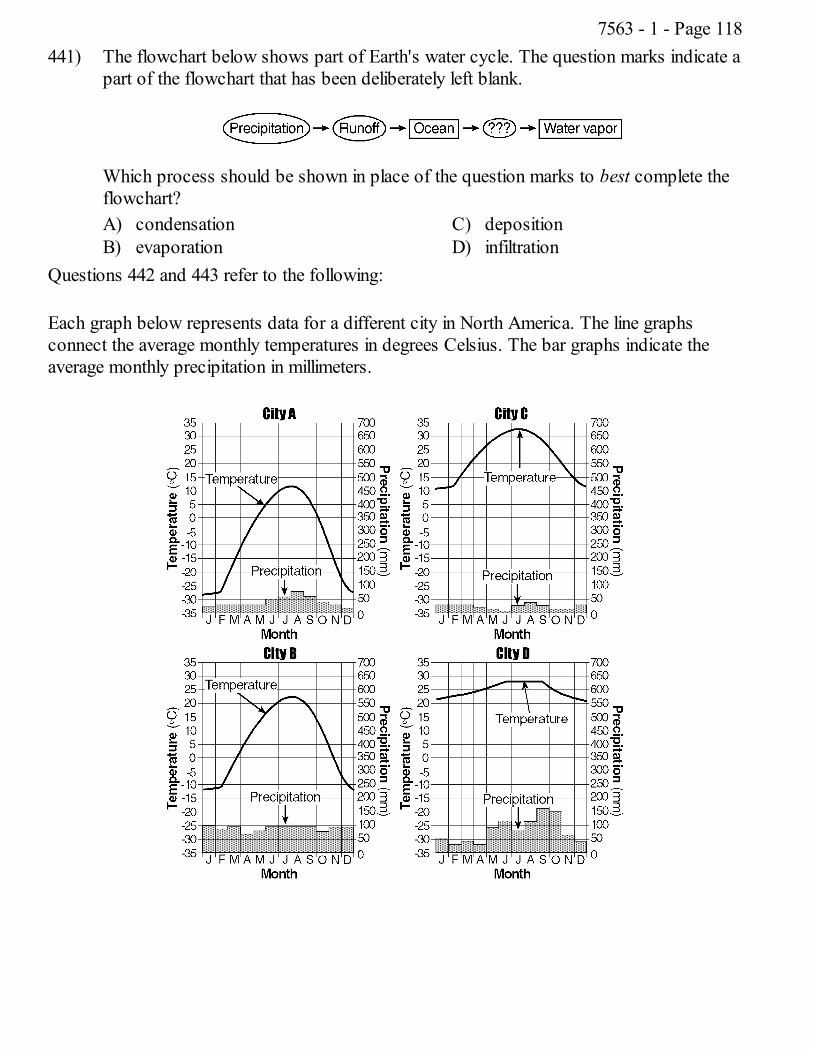
441) The flowchart below shows part of Earth's water cycle. The question marks indicate apart of the flowchart that has been deliberately left blank.
Which process should be shown in place of the question marks to best complete theflowchart?A) condensationB) evaporation
C) depositionD) infiltration
Questions 442 and 443 refer to the following:
Each graph below represents data for a different city in North America. The line graphsconnect the average monthly temperatures in degrees Celsius. The bar graphs indicate theaverage monthly precipitation in millimeters.
7563 - 1 - Page 118
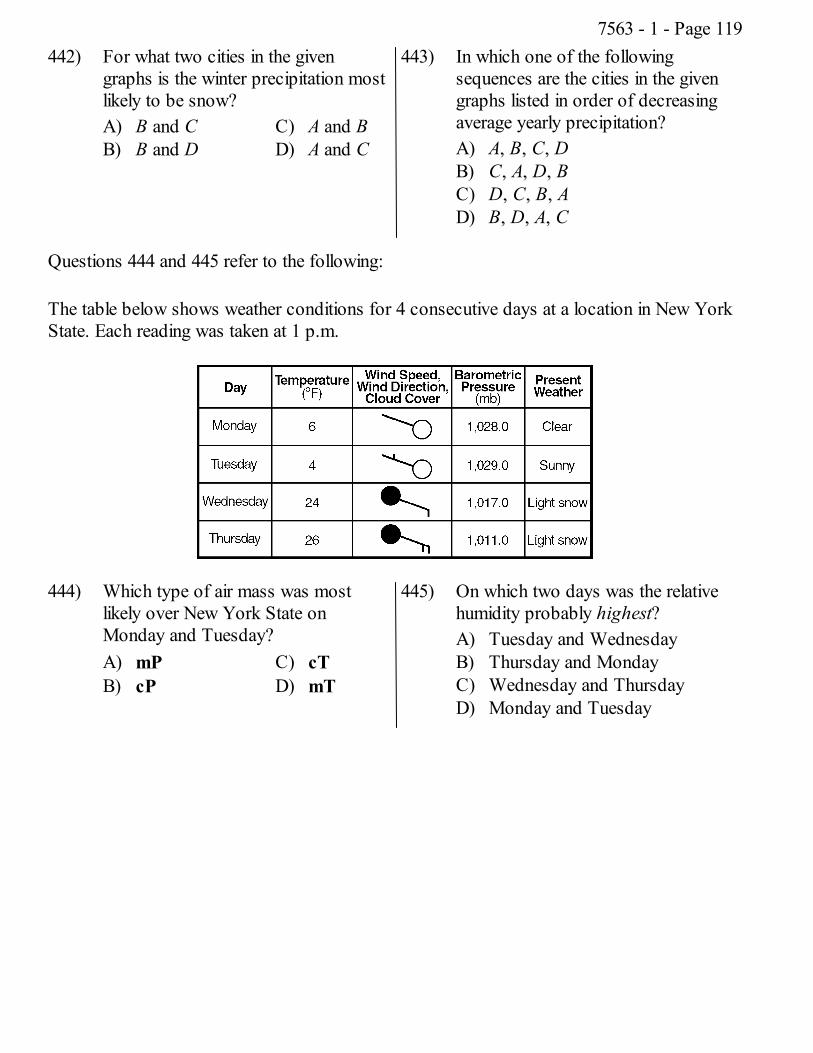
442) For what two cities in the givengraphs is the winter precipitation mostlikely to be snow?A) B and CB) B and D
C) A and BD) A and C
443) In which one of the followingsequences are the cities in the givengraphs listed in order of decreasingaverage yearly precipitation?A) A, B, C, DB) C, A, D, BC) D, C, B, AD) B, D, A, C
Questions 444 and 445 refer to the following:
The table below shows weather conditions for 4 consecutive days at a location in New YorkState. Each reading was taken at 1 p.m.
444) Which type of air mass was mostlikely over New York State onMonday and Tuesday?A) mPB) cP
C) cTD) mT
445) On which two days was the relativehumidity probably highest?A) Tuesday and WednesdayB) Thursday and MondayC) Wednesday and ThursdayD) Monday and Tuesday
7563 - 1 - Page 119
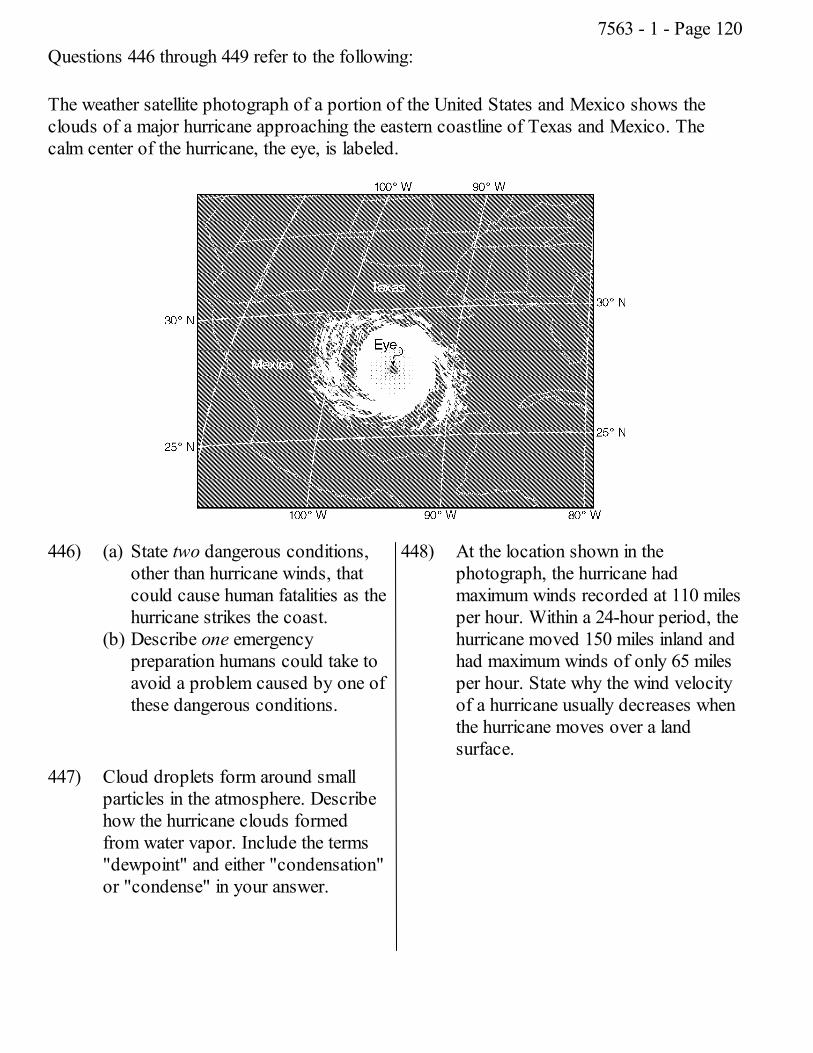
Questions 446 through 449 refer to the following:
The weather satellite photograph of a portion of the United States and Mexico shows theclouds of a major hurricane approaching the eastern coastline of Texas and Mexico. Thecalm center of the hurricane, the eye, is labeled.
446) (a) State two dangerous conditions,other than hurricane winds, thatcould cause human fatalities as thehurricane strikes the coast.
(b) Describe one emergencypreparation humans could take toavoid a problem caused by one ofthese dangerous conditions.
447) Cloud droplets form around smallparticles in the atmosphere. Describehow the hurricane clouds formedfrom water vapor. Include the terms"dewpoint" and either "condensation"or "condense" in your answer.
448) At the location shown in thephotograph, the hurricane hadmaximum winds recorded at 110 milesper hour. Within a 24-hour period, thehurricane moved 150 miles inland andhad maximum winds of only 65 milesper hour. State why the wind velocityof a hurricane usually decreases whenthe hurricane moves over a landsurface.
7563 - 1 - Page 120
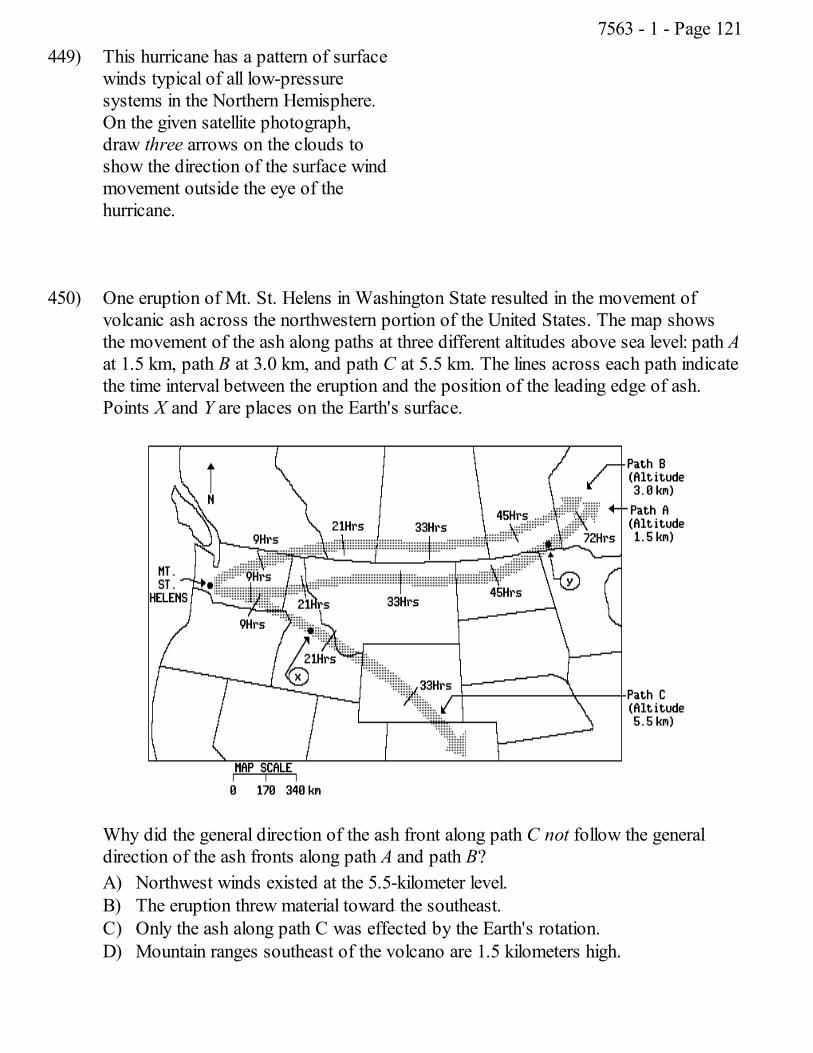
449) This hurricane has a pattern of surfacewinds typical of all low-pressuresystems in the Northern Hemisphere.On the given satellite photograph,draw three arrows on the clouds toshow the direction of the surface windmovement outside the eye of thehurricane.
450) One eruption of Mt. St. Helens in Washington State resulted in the movement ofvolcanic ash across the northwestern portion of the United States. The map showsthe movement of the ash along paths at three different altitudes above sea level: path Aat 1.5 km, path B at 3.0 km, and path C at 5.5 km. The lines across each path indicatethe time interval between the eruption and the position of the leading edge of ash.Points X and Y are places on the Earth's surface.
Why did the general direction of the ash front along path C not follow the generaldirection of the ash fronts along path A and path B?A) Northwest winds existed at the 5.5-kilometer level.B) The eruption threw material toward the southeast.C) Only the ash along path C was effected by the Earth's rotation.D) Mountain ranges southeast of the volcano are 1.5 kilometers high.
7563 - 1 - Page 121
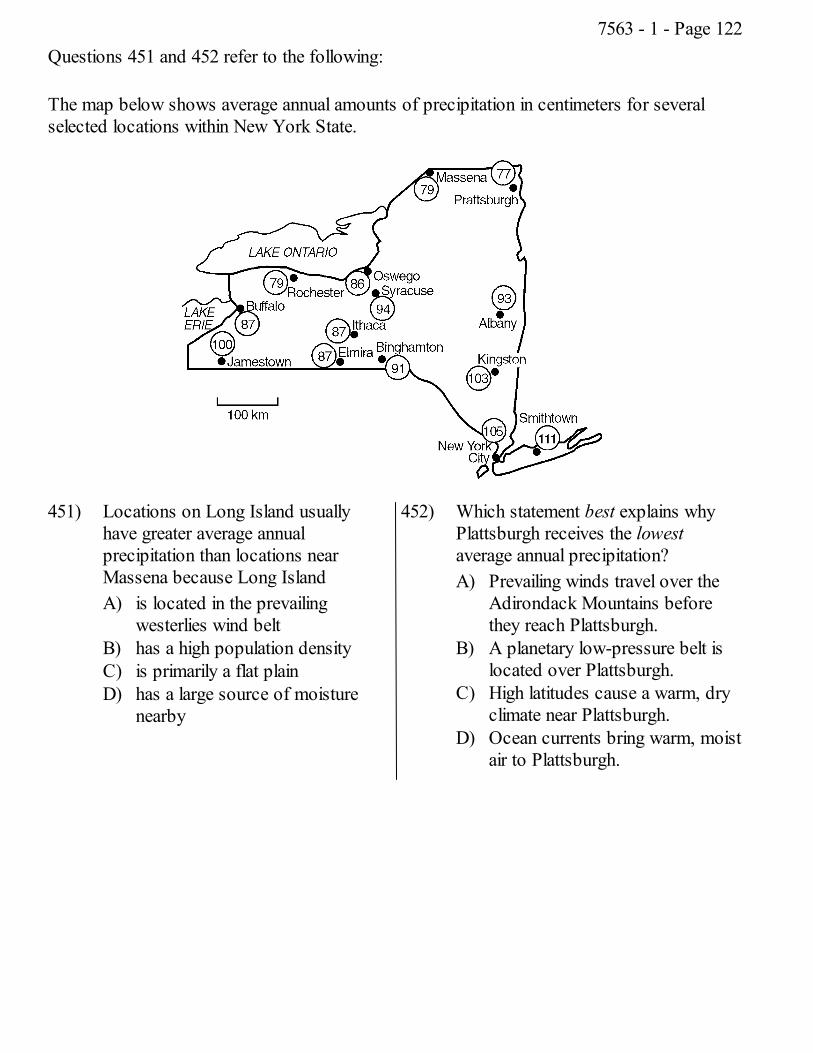
Questions 451 and 452 refer to the following:
The map below shows average annual amounts of precipitation in centimeters for severalselected locations within New York State.
451) Locations on Long Island usuallyhave greater average annualprecipitation than locations nearMassena because Long IslandA) is located in the prevailing
westerlies wind beltB) has a high population densityC) is primarily a flat plainD) has a large source of moisture
nearby
452) Which statement best explains whyPlattsburgh receives the lowestaverage annual precipitation?A) Prevailing winds travel over the
Adirondack Mountains beforethey reach Plattsburgh.
B) A planetary low-pressure belt islocated over Plattsburgh.
C) High latitudes cause a warm, dryclimate near Plattsburgh.
D) Ocean currents bring warm, moistair to Plattsburgh.
7563 - 1 - Page 122
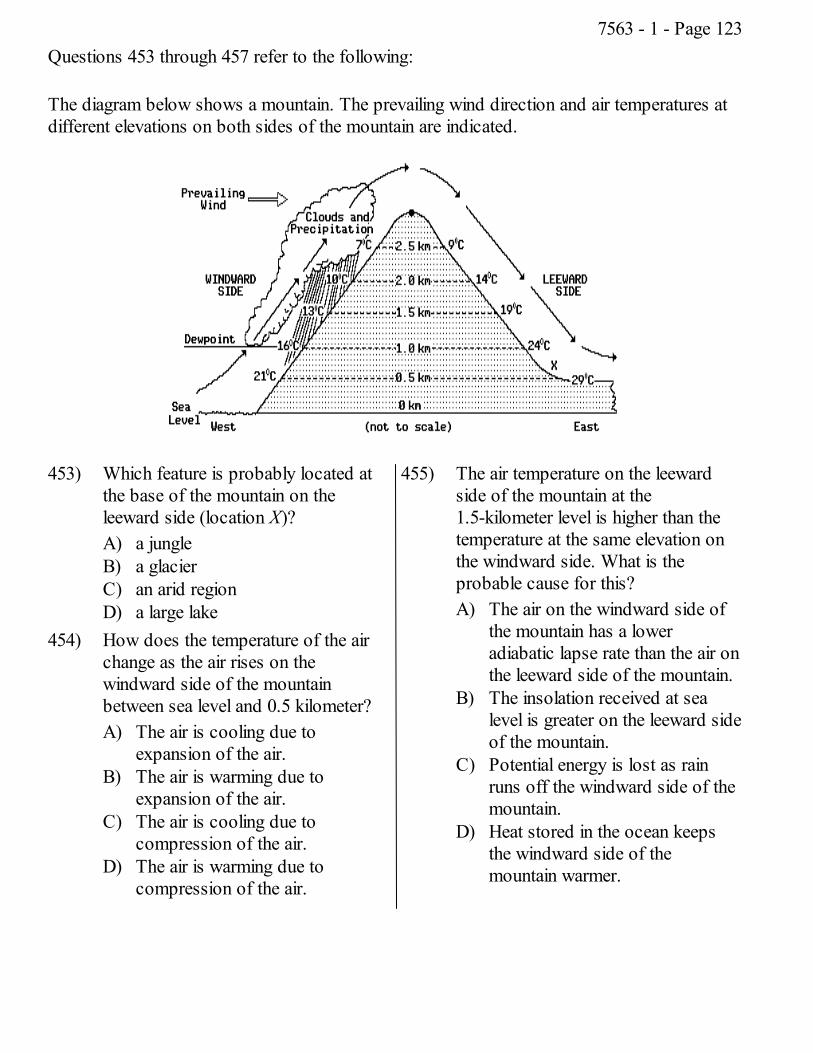
Questions 453 through 457 refer to the following:
The diagram below shows a mountain. The prevailing wind direction and air temperatures atdifferent elevations on both sides of the mountain are indicated.
453) Which feature is probably located atthe base of the mountain on theleeward side (location X)?A) a jungleB) a glacierC) an arid regionD) a large lake
454) How does the temperature of the airchange as the air rises on thewindward side of the mountainbetween sea level and 0.5 kilometer?A) The air is cooling due to
expansion of the air.B) The air is warming due to
expansion of the air.C) The air is cooling due to
compression of the air.D) The air is warming due to
compression of the air.
455) The air temperature on the leewardside of the mountain at the1.5-kilometer level is higher than thetemperature at the same elevation onthe windward side. What is theprobable cause for this?A) The air on the windward side of
the mountain has a loweradiabatic lapse rate than the air onthe leeward side of the mountain.
B) The insolation received at sealevel is greater on the leeward sideof the mountain.
C) Potential energy is lost as rainruns off the windward side of themountain.
D) Heat stored in the ocean keepsthe windward side of themountain warmer.
7563 - 1 - Page 123
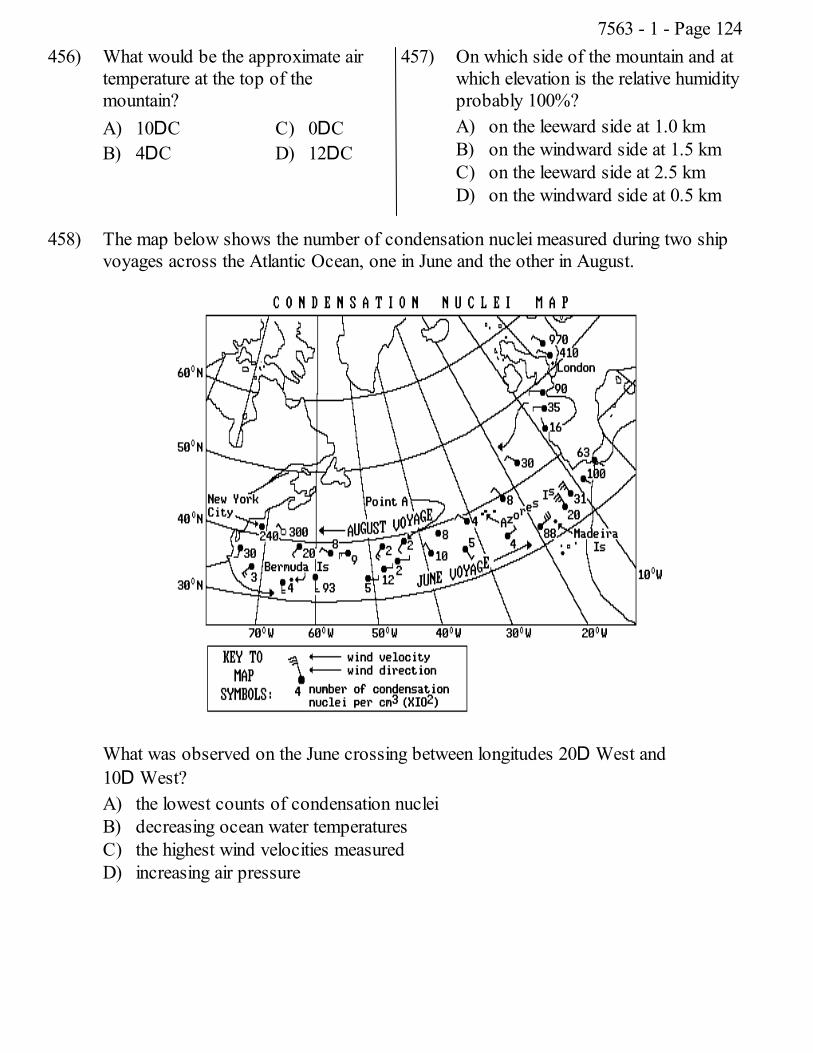
456) What would be the approximate airtemperature at the top of themountain?A) 10DCB) 4DC
C) 0DCD) 12DC
457) On which side of the mountain and atwhich elevation is the relative humidityprobably 100%?A) on the leeward side at 1.0 kmB) on the windward side at 1.5 kmC) on the leeward side at 2.5 kmD) on the windward side at 0.5 km
458) The map below shows the number of condensation nuclei measured during two shipvoyages across the Atlantic Ocean, one in June and the other in August.
What was observed on the June crossing between longitudes 20D West and10D West?A) the lowest counts of condensation nucleiB) decreasing ocean water temperaturesC) the highest wind velocities measuredD) increasing air pressure
7563 - 1 - Page 124
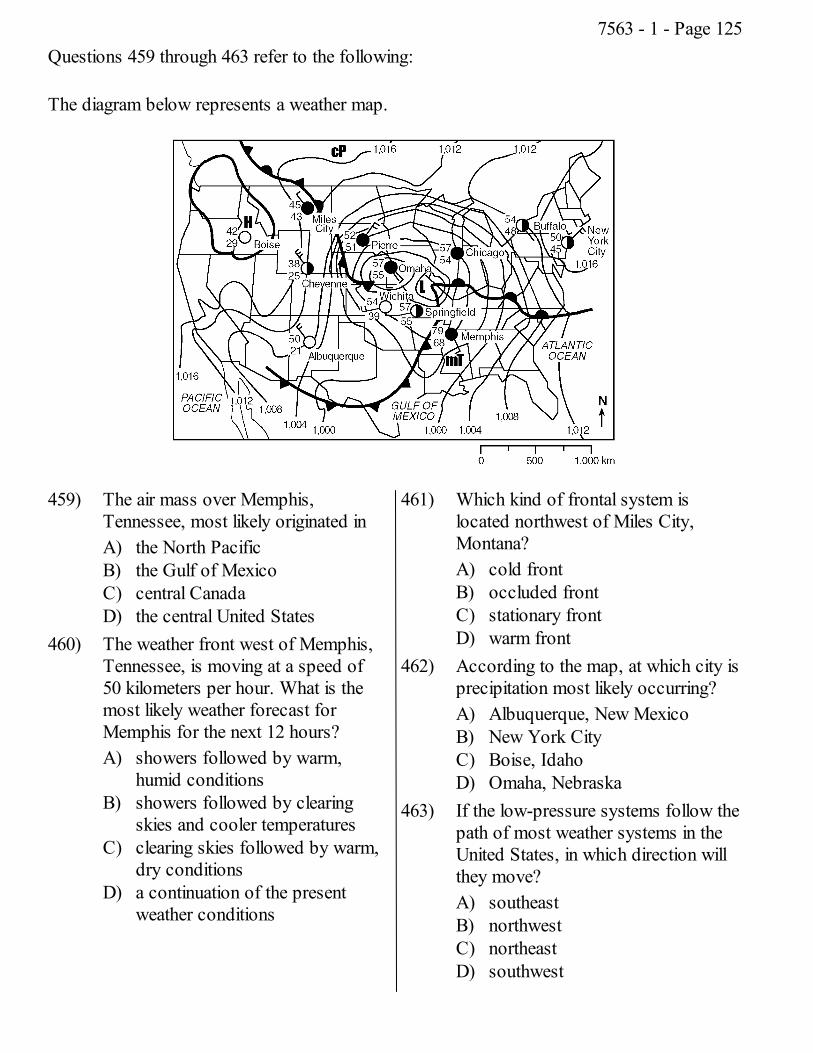
Questions 459 through 463 refer to the following:
The diagram below represents a weather map.
459) The air mass over Memphis,Tennessee, most likely originated inA) the North PacificB) the Gulf of MexicoC) central CanadaD) the central United States
460) The weather front west of Memphis,Tennessee, is moving at a speed of50 kilometers per hour. What is themost likely weather forecast forMemphis for the next 12 hours?A) showers followed by warm,
humid conditionsB) showers followed by clearing
skies and cooler temperaturesC) clearing skies followed by warm,
dry conditionsD) a continuation of the present
weather conditions
461) Which kind of frontal system islocated northwest of Miles City,Montana?A) cold frontB) occluded frontC) stationary frontD) warm front
462) According to the map, at which city isprecipitation most likely occurring?A) Albuquerque, New MexicoB) New York CityC) Boise, IdahoD) Omaha, Nebraska
463) If the low-pressure systems follow thepath of most weather systems in theUnited States, in which direction willthey move?A) southeastB) northwestC) northeastD) southwest
7563 - 1 - Page 125
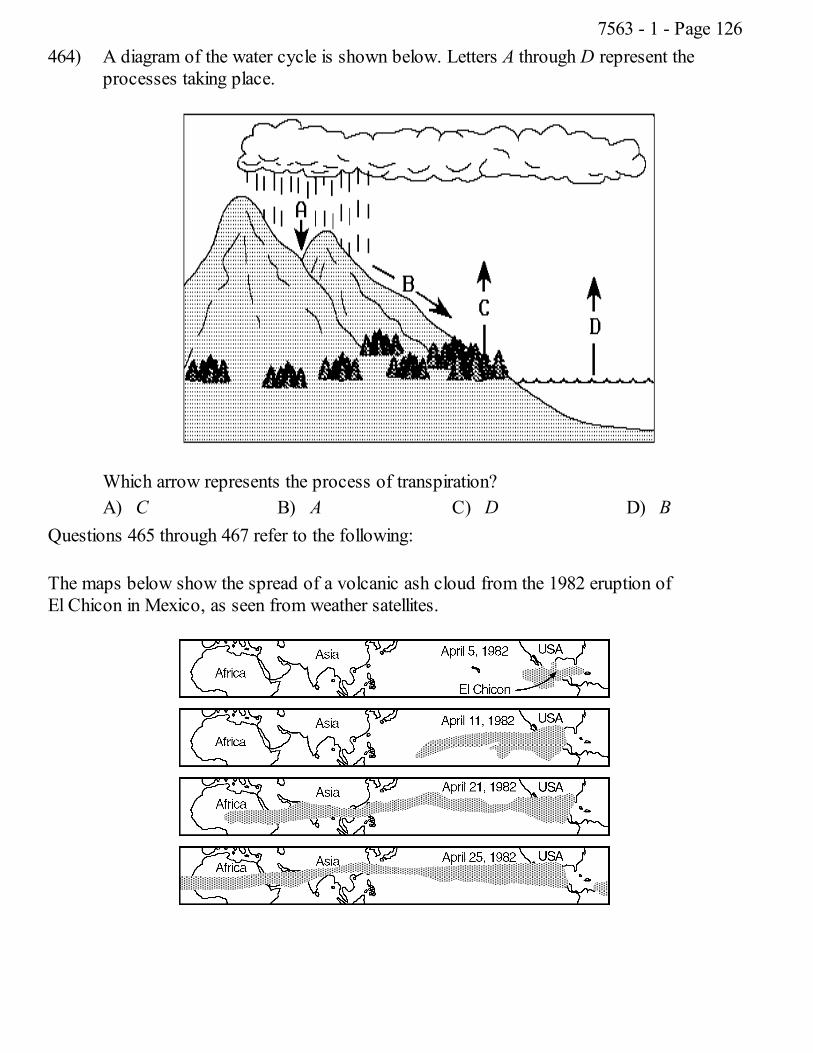
464) A diagram of the water cycle is shown below. Letters A through D represent theprocesses taking place.
Which arrow represents the process of transpiration?A) C B) A C) D D) B
Questions 465 through 467 refer to the following:
The maps below show the spread of a volcanic ash cloud from the 1982 eruption ofEl Chicon in Mexico, as seen from weather satellites.
7563 - 1 - Page 126
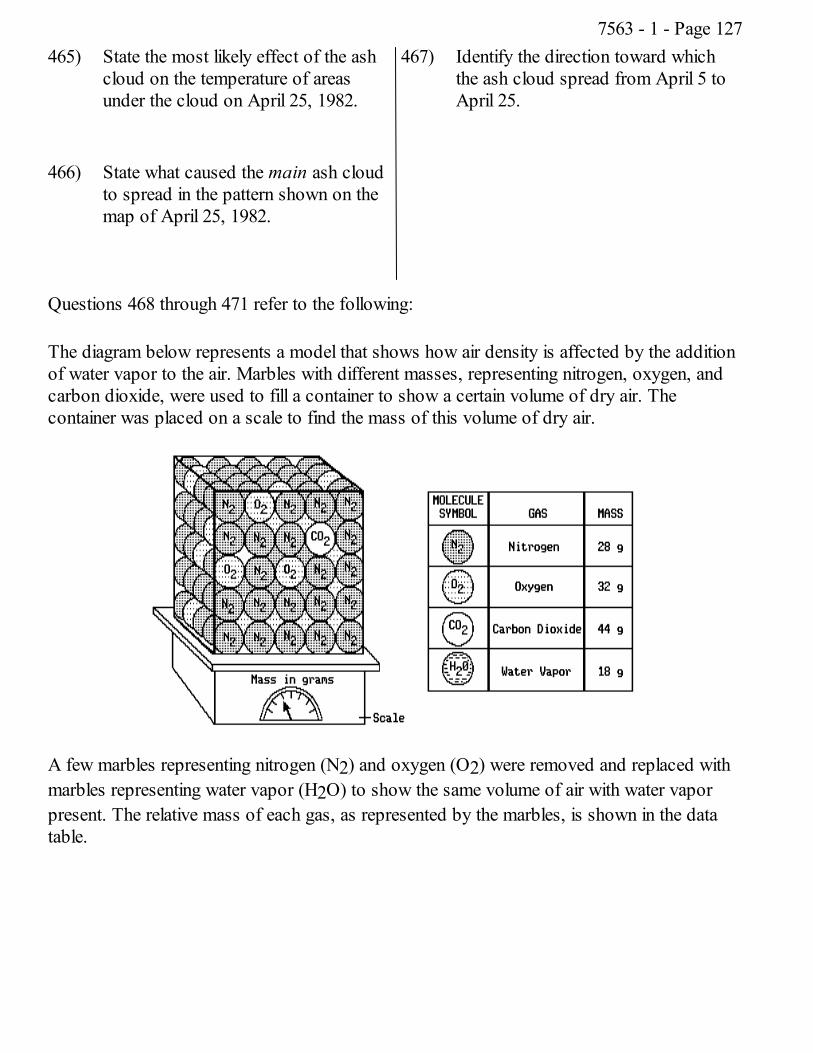
465) State the most likely effect of the ashcloud on the temperature of areasunder the cloud on April 25, 1982.
466) State what caused the main ash cloudto spread in the pattern shown on themap of April 25, 1982.
467) Identify the direction toward whichthe ash cloud spread from April 5 toApril 25.
Questions 468 through 471 refer to the following:
The diagram below represents a model that shows how air density is affected by the additionof water vapor to the air. Marbles with different masses, representing nitrogen, oxygen, andcarbon dioxide, were used to fill a container to show a certain volume of dry air. Thecontainer was placed on a scale to find the mass of this volume of dry air.
A few marbles representing nitrogen (N2) and oxygen (O2) were removed and replaced withmarbles representing water vapor (H2O) to show the same volume of air with water vaporpresent. The relative mass of each gas, as represented by the marbles, is shown in the datatable.
7563 - 1 - Page 127
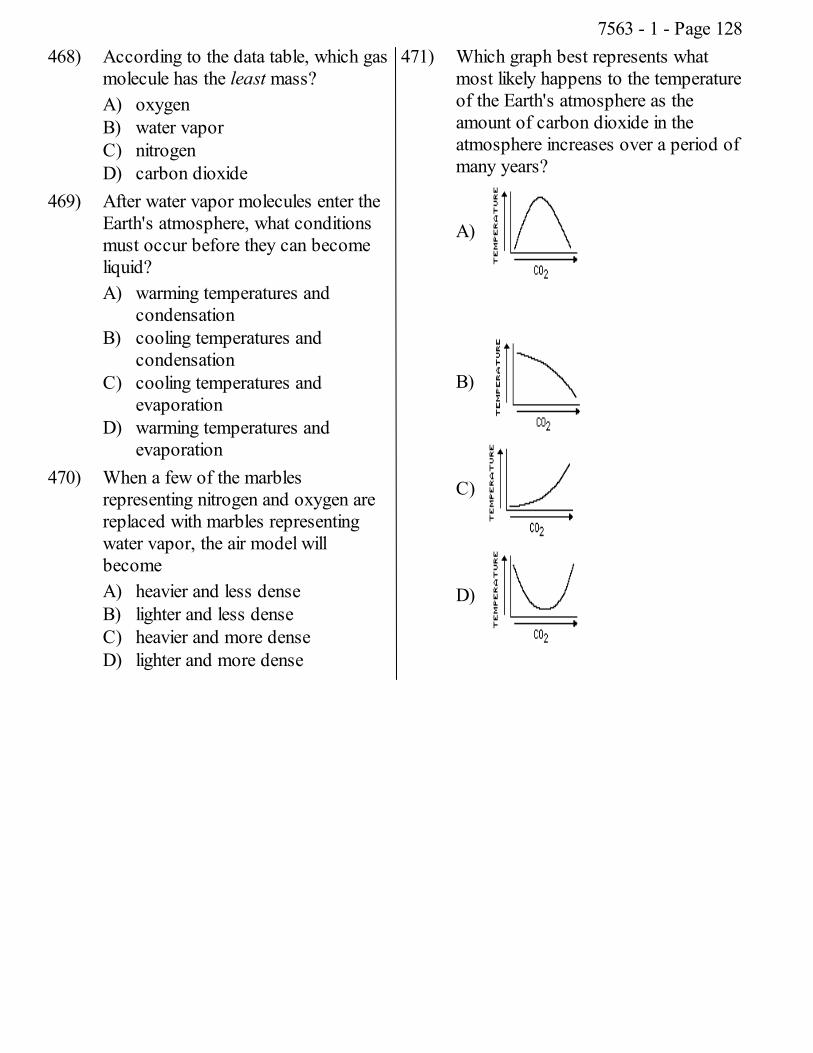
468) According to the data table, which gasmolecule has the least mass?A) oxygenB) water vaporC) nitrogenD) carbon dioxide
469) After water vapor molecules enter theEarth's atmosphere, what conditionsmust occur before they can becomeliquid?A) warming temperatures and
condensationB) cooling temperatures and
condensationC) cooling temperatures and
evaporationD) warming temperatures and
evaporation470) When a few of the marbles
representing nitrogen and oxygen arereplaced with marbles representingwater vapor, the air model willbecomeA) heavier and less denseB) lighter and less denseC) heavier and more denseD) lighter and more dense
471) Which graph best represents whatmost likely happens to the temperatureof the Earth's atmosphere as theamount of carbon dioxide in theatmosphere increases over a period ofmany years?
A)
B)
C)
D)
7563 - 1 - Page 128
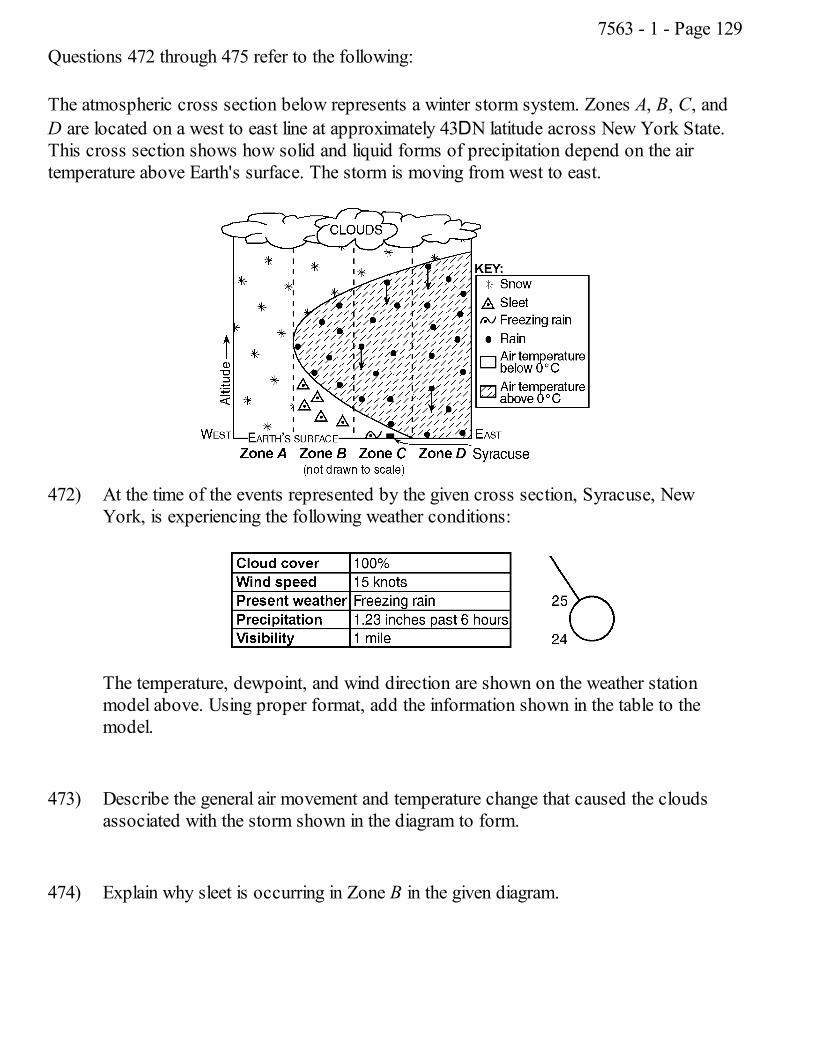
Questions 472 through 475 refer to the following:
The atmospheric cross section below represents a winter storm system. Zones A, B, C, andD are located on a west to east line at approximately 43DN latitude across New York State.This cross section shows how solid and liquid forms of precipitation depend on the airtemperature above Earth's surface. The storm is moving from west to east.
472) At the time of the events represented by the given cross section, Syracuse, NewYork, is experiencing the following weather conditions:
The temperature, dewpoint, and wind direction are shown on the weather stationmodel above. Using proper format, add the information shown in the table to themodel.
473) Describe the general air movement and temperature change that caused the cloudsassociated with the storm shown in the diagram to form.
474) Explain why sleet is occurring in Zone B in the given diagram.
7563 - 1 - Page 129
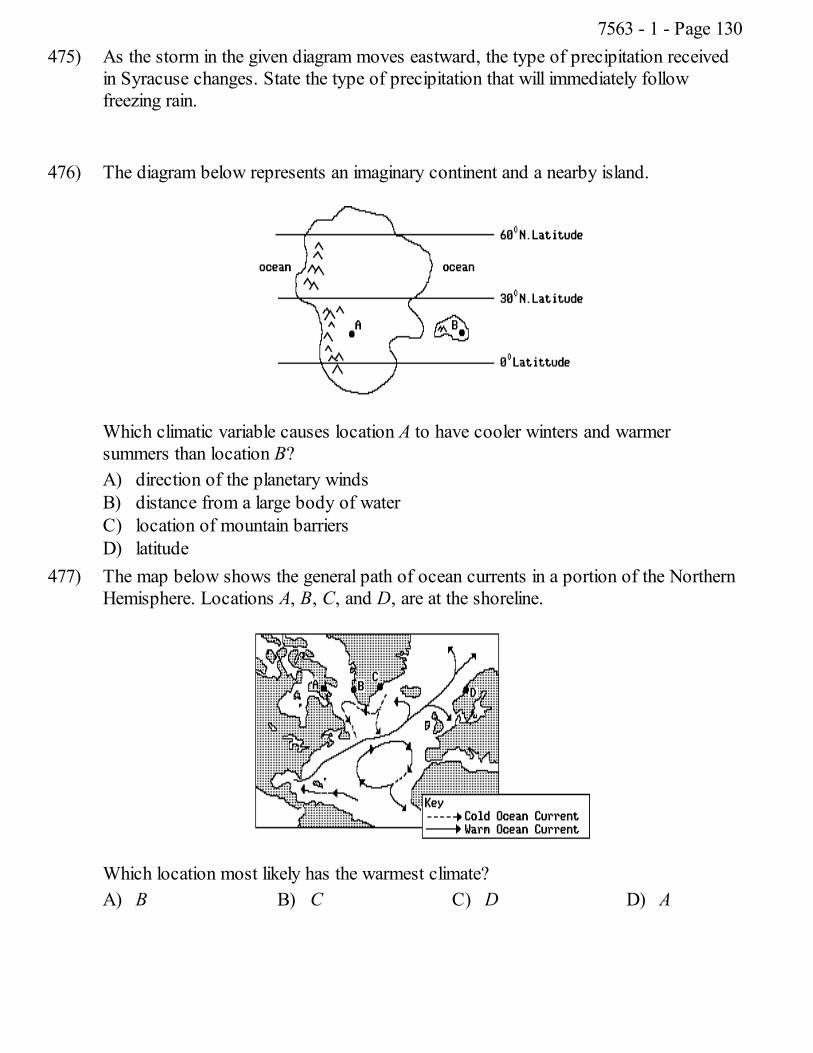
475) As the storm in the given diagram moves eastward, the type of precipitation receivedin Syracuse changes. State the type of precipitation that will immediately followfreezing rain.
476) The diagram below represents an imaginary continent and a nearby island.
Which climatic variable causes location A to have cooler winters and warmersummers than location B?A) direction of the planetary windsB) distance from a large body of waterC) location of mountain barriersD) latitude
477) The map below shows the general path of ocean currents in a portion of the NorthernHemisphere. Locations A, B, C, and D, are at the shoreline.
Which location most likely has the warmest climate?A) B B) C C) D D) A
7563 - 1 - Page 130
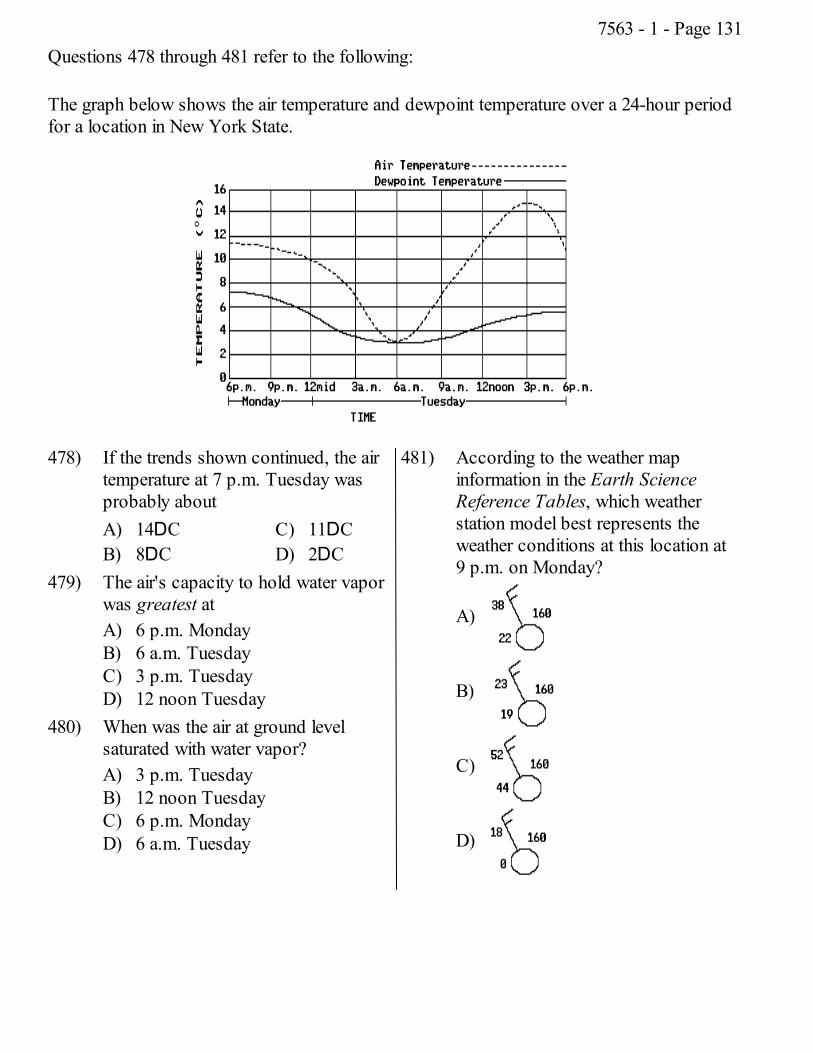
Questions 478 through 481 refer to the following:
The graph below shows the air temperature and dewpoint temperature over a 24-hour periodfor a location in New York State.
478) If the trends shown continued, the airtemperature at 7 p.m. Tuesday wasprobably aboutA) 14DCB) 8DC
C) 11DCD) 2DC
479) The air's capacity to hold water vaporwas greatest atA) 6 p.m. MondayB) 6 a.m. TuesdayC) 3 p.m. TuesdayD) 12 noon Tuesday
480) When was the air at ground levelsaturated with water vapor?A) 3 p.m. TuesdayB) 12 noon TuesdayC) 6 p.m. MondayD) 6 a.m. Tuesday
481) According to the weather mapinformation in the Earth ScienceReference Tables, which weatherstation model best represents theweather conditions at this location at9 p.m. on Monday?
A)
B)
C)
D)
7563 - 1 - Page 131
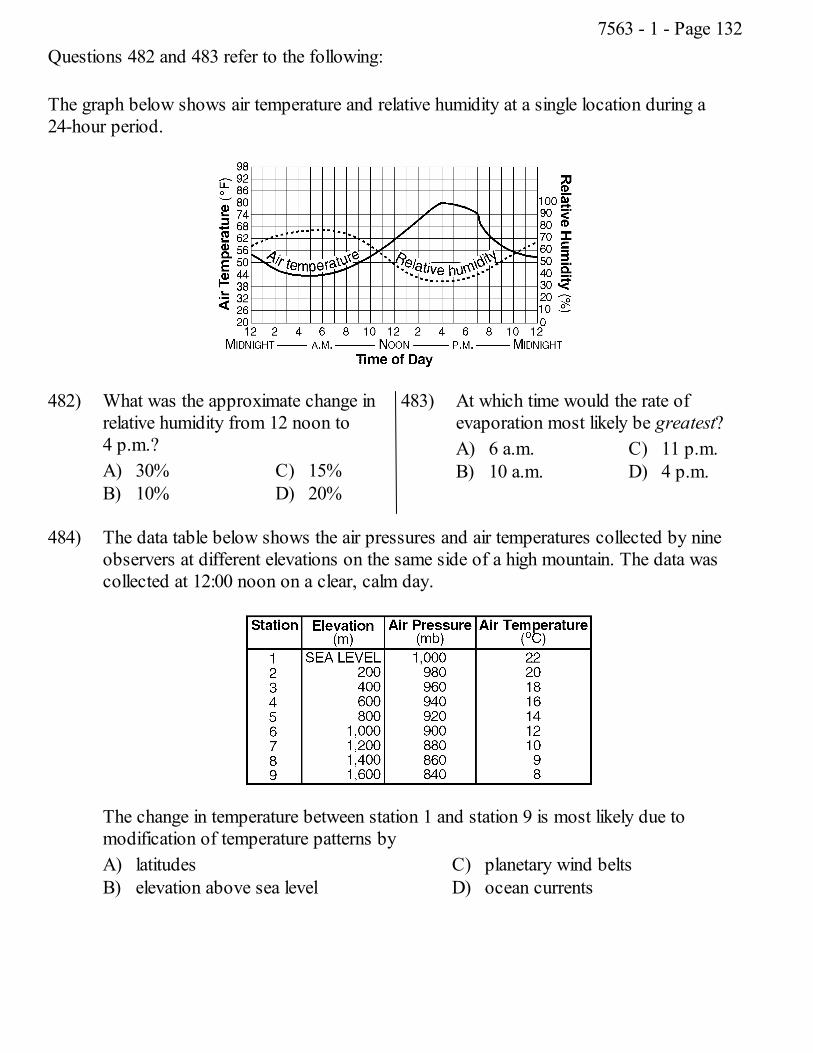
Questions 482 and 483 refer to the following:
The graph below shows air temperature and relative humidity at a single location during a24-hour period.
482) What was the approximate change inrelative humidity from 12 noon to4 p.m.?A) 30%B) 10%
C) 15%D) 20%
483) At which time would the rate ofevaporation most likely be greatest?A) 6 a.m.B) 10 a.m.
C) 11 p.m.D) 4 p.m.
484) The data table below shows the air pressures and air temperatures collected by nineobservers at different elevations on the same side of a high mountain. The data wascollected at 12:00 noon on a clear, calm day.
The change in temperature between station 1 and station 9 is most likely due tomodification of temperature patterns byA) latitudesB) elevation above sea level
C) planetary wind beltsD) ocean currents
7563 - 1 - Page 132
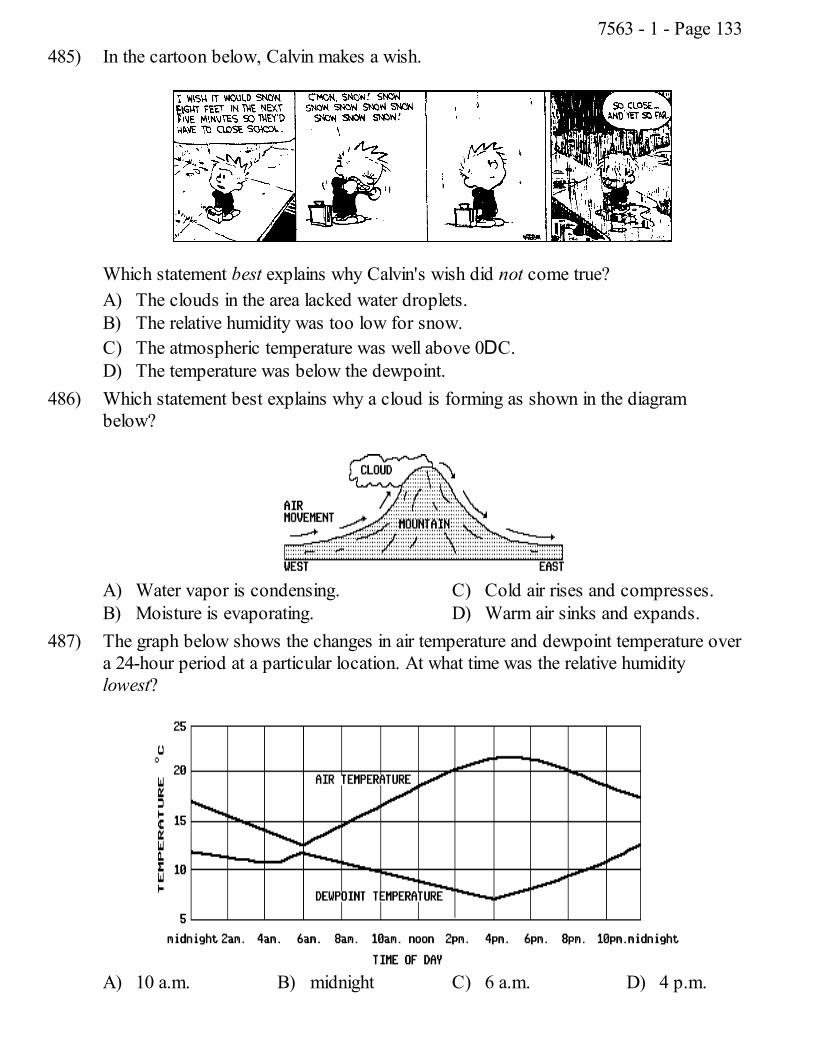
485) In the cartoon below, Calvin makes a wish.
Which statement best explains why Calvin's wish did not come true?A) The clouds in the area lacked water droplets.B) The relative humidity was too low for snow.C) The atmospheric temperature was well above 0DC.D) The temperature was below the dewpoint.
486) Which statement best explains why a cloud is forming as shown in the diagrambelow?
A) Water vapor is condensing.B) Moisture is evaporating.
C) Cold air rises and compresses.D) Warm air sinks and expands.
487) The graph below shows the changes in air temperature and dewpoint temperature overa 24-hour period at a particular location. At what time was the relative humiditylowest?
A) 10 a.m. B) midnight C) 6 a.m. D) 4 p.m.
7563 - 1 - Page 133
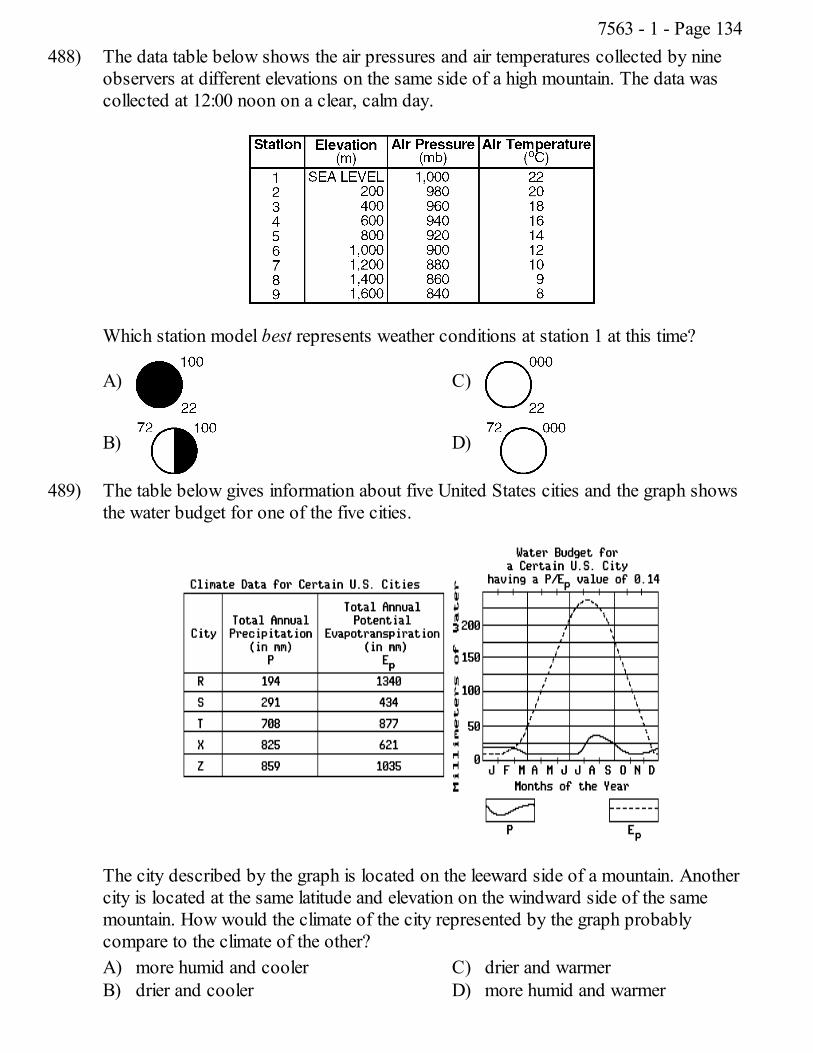
488) The data table below shows the air pressures and air temperatures collected by nineobservers at different elevations on the same side of a high mountain. The data wascollected at 12:00 noon on a clear, calm day.
Which station model best represents weather conditions at station 1 at this time?
A)
B)
C)
D)
489) The table below gives information about five United States cities and the graph showsthe water budget for one of the five cities.
The city described by the graph is located on the leeward side of a mountain. Anothercity is located at the same latitude and elevation on the windward side of the samemountain. How would the climate of the city represented by the graph probablycompare to the climate of the other?A) more humid and coolerB) drier and cooler
C) drier and warmerD) more humid and warmer
7563 - 1 - Page 134
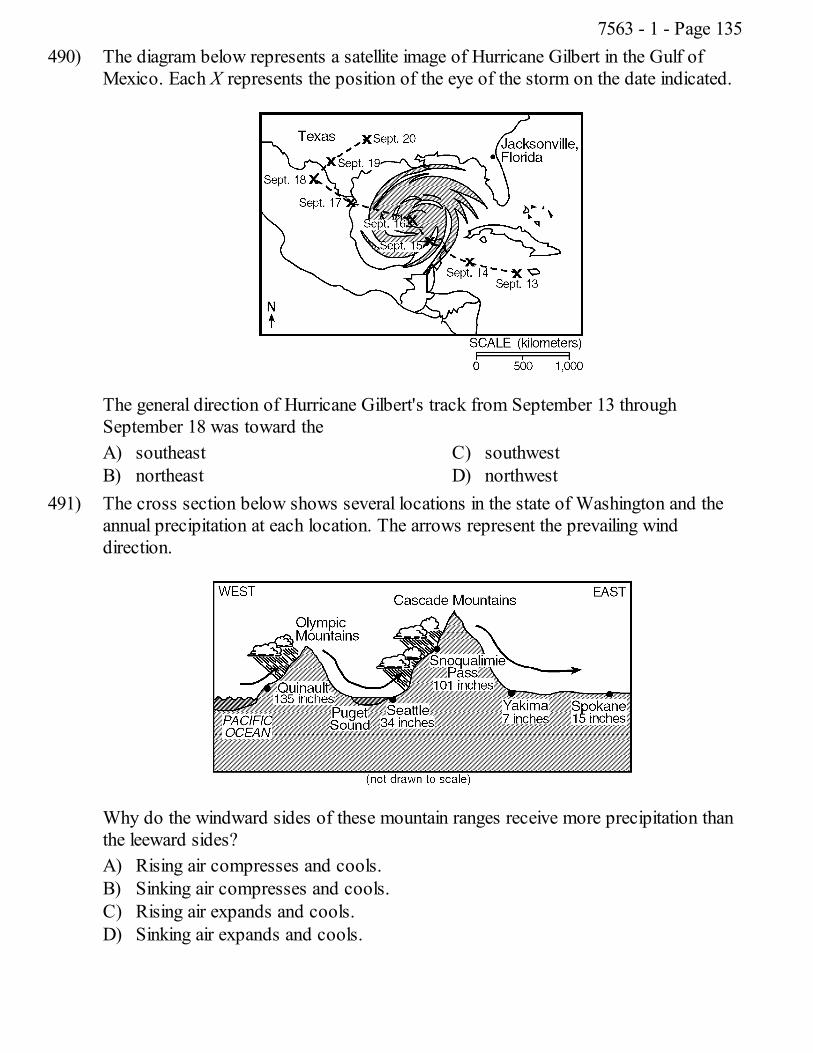
490) The diagram below represents a satellite image of Hurricane Gilbert in the Gulf ofMexico. Each X represents the position of the eye of the storm on the date indicated.
The general direction of Hurricane Gilbert's track from September 13 throughSeptember 18 was toward theA) southeastB) northeast
C) southwestD) northwest
491) The cross section below shows several locations in the state of Washington and theannual precipitation at each location. The arrows represent the prevailing winddirection.
Why do the windward sides of these mountain ranges receive more precipitation thanthe leeward sides?A) Rising air compresses and cools.B) Sinking air compresses and cools.C) Rising air expands and cools.D) Sinking air expands and cools.
7563 - 1 - Page 135
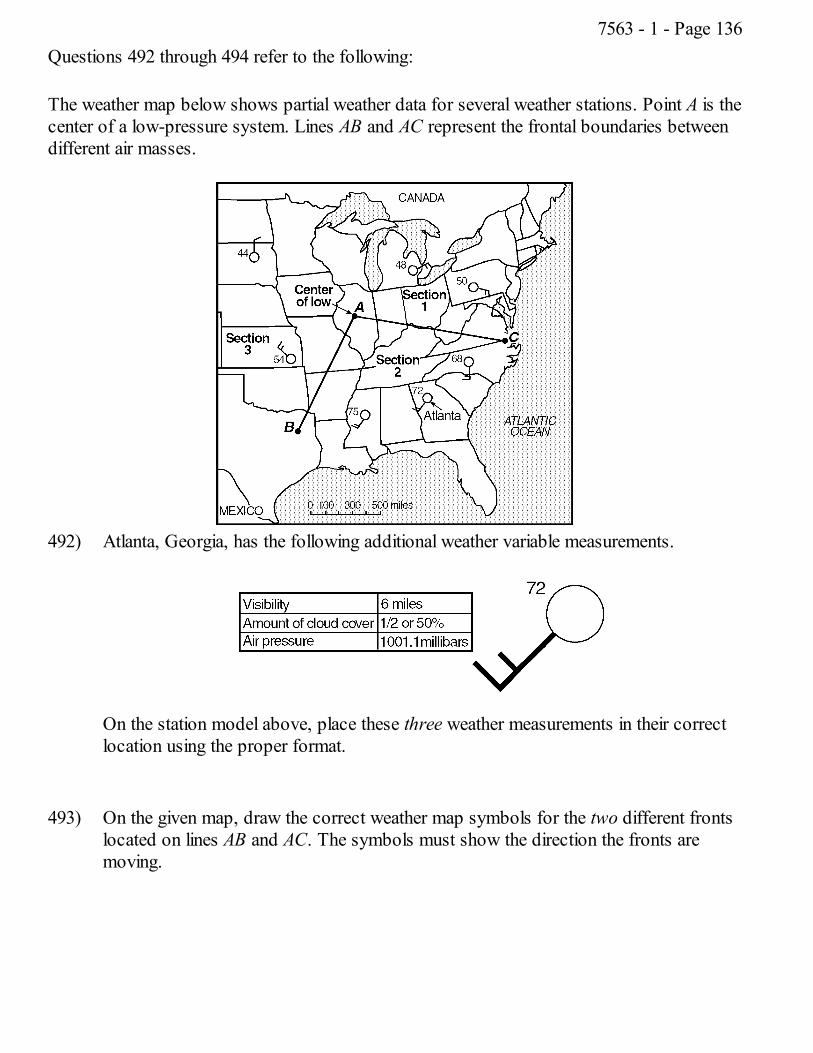
Questions 492 through 494 refer to the following:
The weather map below shows partial weather data for several weather stations. Point A is thecenter of a low-pressure system. Lines AB and AC represent the frontal boundaries betweendifferent air masses.
492) Atlanta, Georgia, has the following additional weather variable measurements.
On the station model above, place these three weather measurements in their correctlocation using the proper format.
493) On the given map, draw the correct weather map symbols for the two different frontslocated on lines AB and AC. The symbols must show the direction the fronts aremoving.
7563 - 1 - Page 136
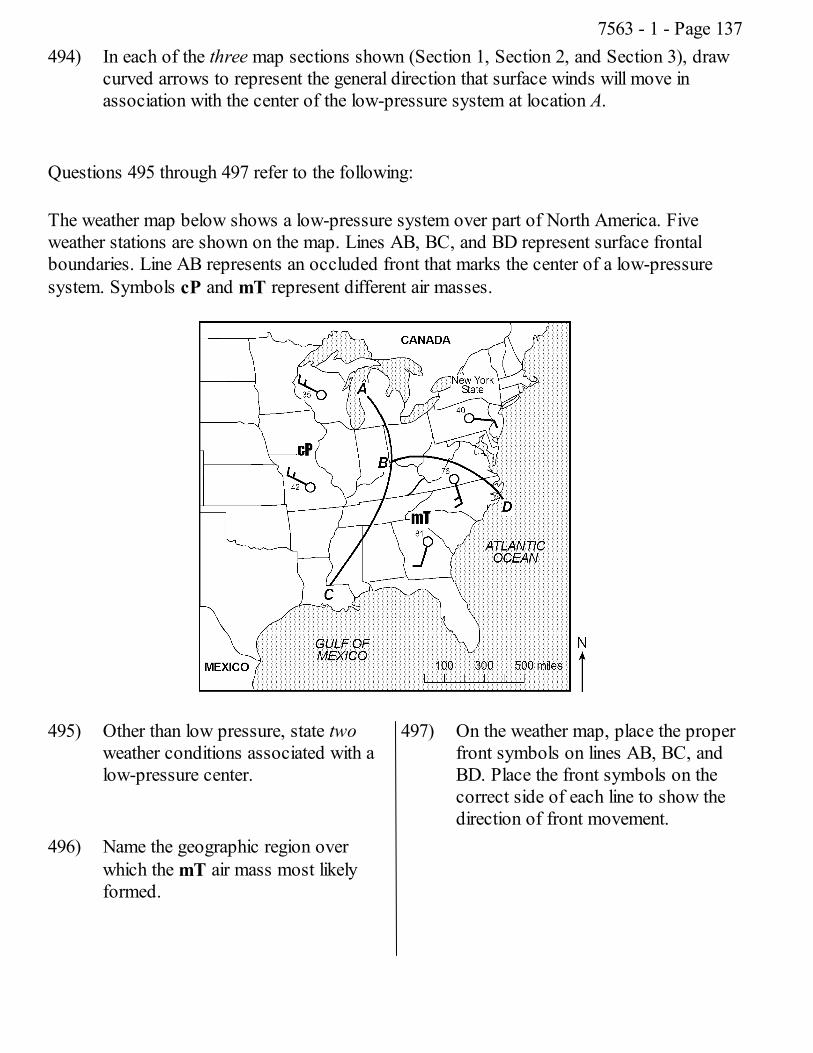
494) In each of the three map sections shown (Section 1, Section 2, and Section 3), drawcurved arrows to represent the general direction that surface winds will move inassociation with the center of the low-pressure system at location A.
Questions 495 through 497 refer to the following:
The weather map below shows a low-pressure system over part of North America. Fiveweather stations are shown on the map. Lines AB, BC, and BD represent surface frontalboundaries. Line AB represents an occluded front that marks the center of a low-pressuresystem. Symbols cP and mT represent different air masses.
495) Other than low pressure, state twoweather conditions associated with alow-pressure center.
496) Name the geographic region overwhich the mT air mass most likelyformed.
497) On the weather map, place the properfront symbols on lines AB, BC, andBD. Place the front symbols on thecorrect side of each line to show thedirection of front movement.
7563 - 1 - Page 137
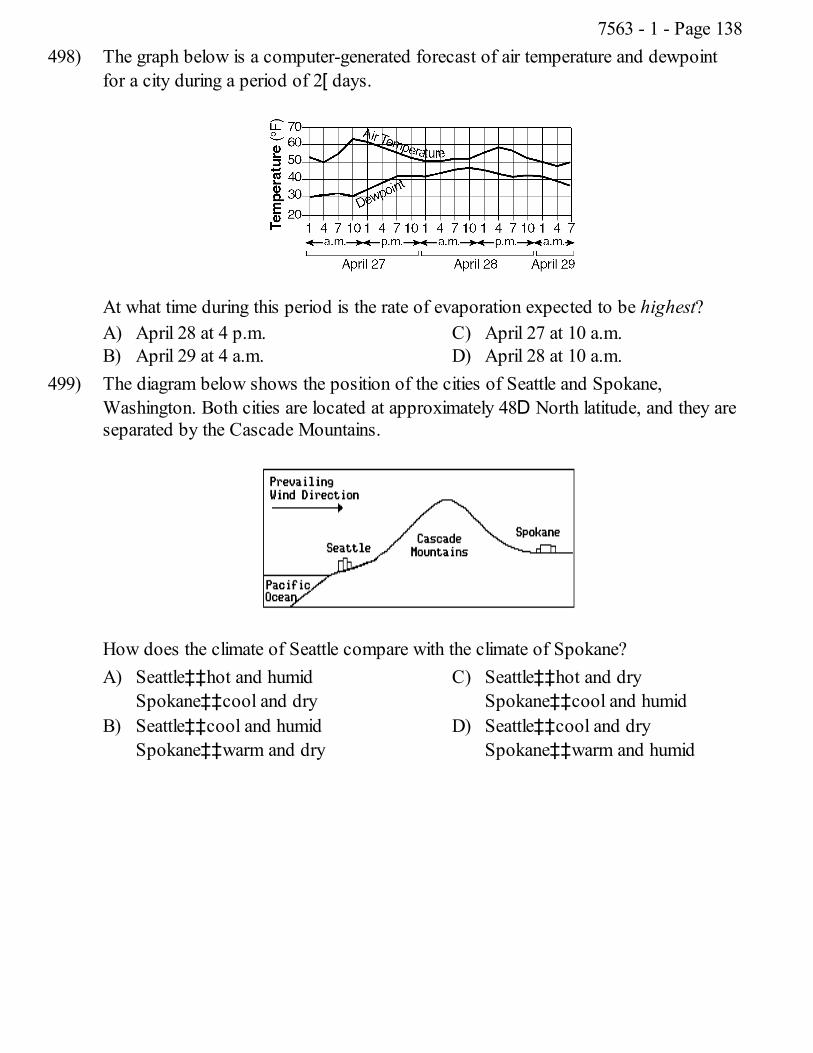
498) The graph below is a computer-generated forecast of air temperature and dewpointfor a city during a period of 2[ days.
At what time during this period is the rate of evaporation expected to be highest?A) April 28 at 4 p.m.B) April 29 at 4 a.m.
C) April 27 at 10 a.m.D) April 28 at 10 a.m.
499) The diagram below shows the position of the cities of Seattle and Spokane,Washington. Both cities are located at approximately 48D North latitude, and they areseparated by the Cascade Mountains.
How does the climate of Seattle compare with the climate of Spokane?A) Seattle‡‡hot and humid
Spokane‡‡cool and dryB) Seattle‡‡cool and humid
Spokane‡‡warm and dry
C) Seattle‡‡hot and drySpokane‡‡cool and humid
D) Seattle‡‡cool and drySpokane‡‡warm and humid
7563 - 1 - Page 138
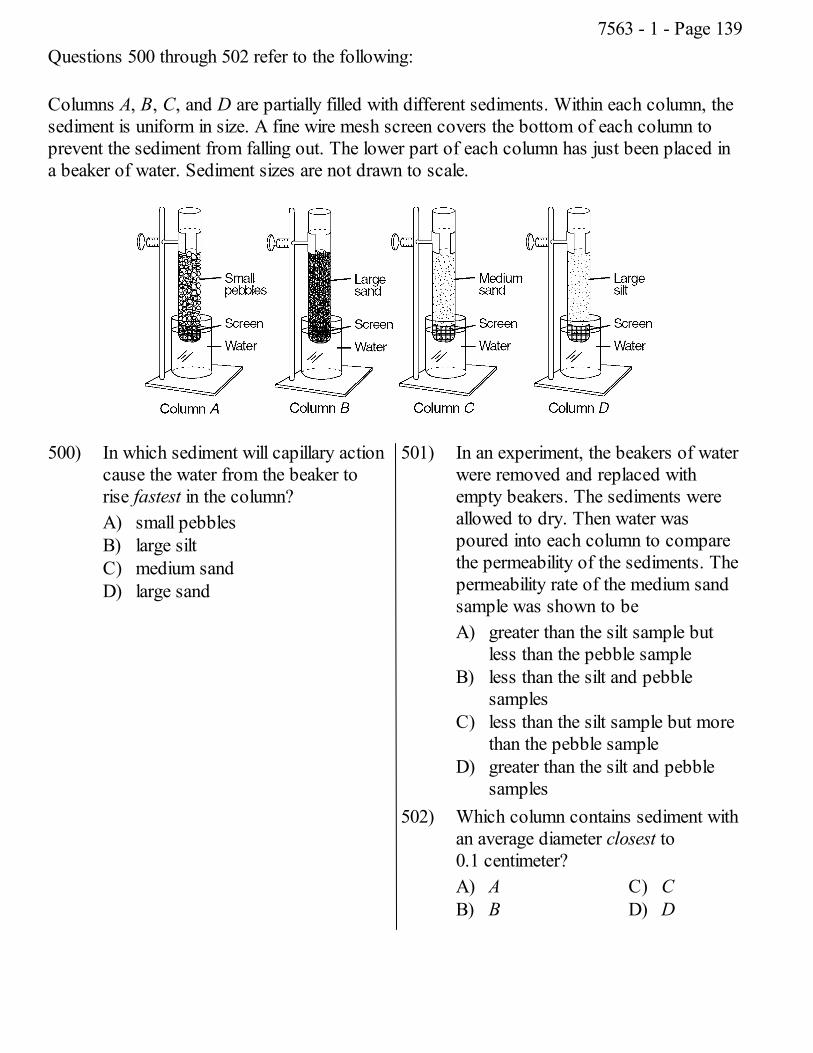
Questions 500 through 502 refer to the following:
Columns A, B, C, and D are partially filled with different sediments. Within each column, thesediment is uniform in size. A fine wire mesh screen covers the bottom of each column toprevent the sediment from falling out. The lower part of each column has just been placed ina beaker of water. Sediment sizes are not drawn to scale.
500) In which sediment will capillary actioncause the water from the beaker torise fastest in the column?A) small pebblesB) large siltC) medium sandD) large sand
501) In an experiment, the beakers of waterwere removed and replaced withempty beakers. The sediments wereallowed to dry. Then water waspoured into each column to comparethe permeability of the sediments. Thepermeability rate of the medium sandsample was shown to beA) greater than the silt sample but
less than the pebble sampleB) less than the silt and pebble
samplesC) less than the silt sample but more
than the pebble sampleD) greater than the silt and pebble
samples502) Which column contains sediment with
an average diameter closest to0.1 centimeter?A) AB) B
C) CD) D
7563 - 1 - Page 139
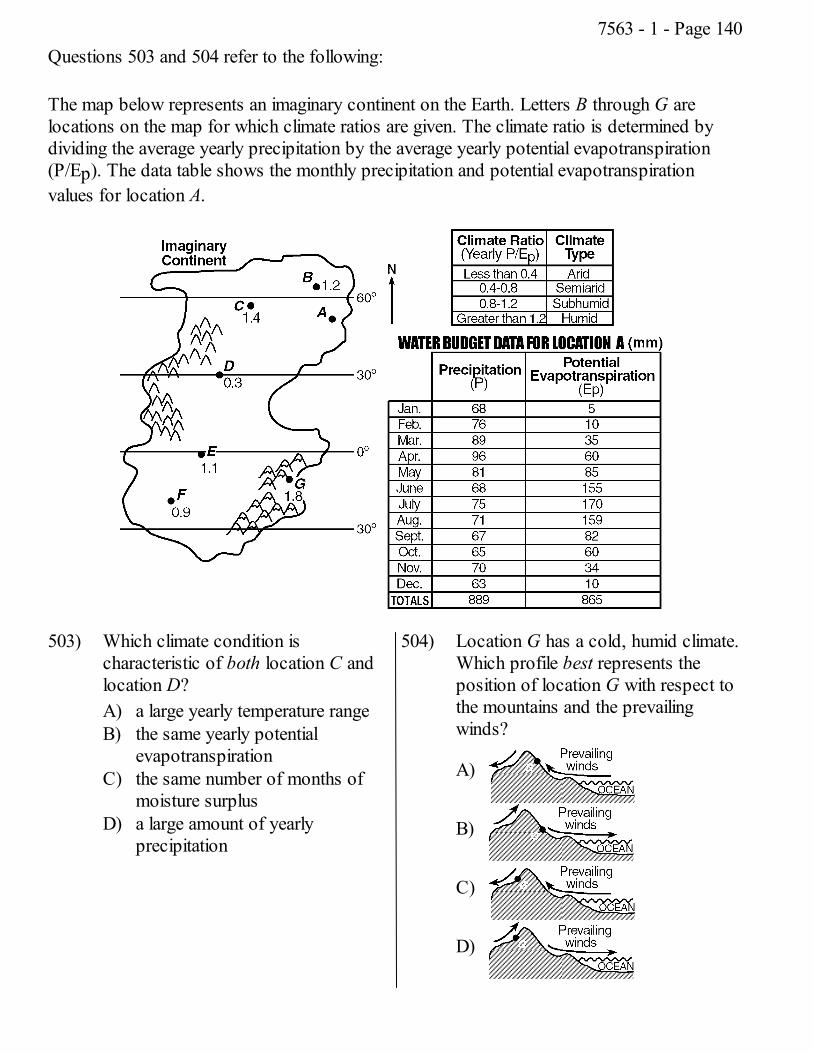
Questions 503 and 504 refer to the following:
The map below represents an imaginary continent on the Earth. Letters B through G arelocations on the map for which climate ratios are given. The climate ratio is determined bydividing the average yearly precipitation by the average yearly potential evapotranspiration(P/Ep). The data table shows the monthly precipitation and potential evapotranspirationvalues for location A.
503) Which climate condition ischaracteristic of both location C andlocation D?A) a large yearly temperature rangeB) the same yearly potential
evapotranspirationC) the same number of months of
moisture surplusD) a large amount of yearly
precipitation
504) Location G has a cold, humid climate.Which profile best represents theposition of location G with respect tothe mountains and the prevailingwinds?
A)
B)
C)
D)
7563 - 1 - Page 140