Embed Size (px)
Citation preview
C. David (Dave) WarrenField Technical Manager
Transportation Materials Research
Oak Ridge National LaboratoryP.O. Box 2009, M/S 8050
Oak Ridge, Tennessee 37831-8050Phone: 865-574-9693
Fax: 865-574-0740Email: [email protected]
Lower Cost, Higher Performance Carbon Fiber14 February 2011
2 Managed by UT-Battellefor the U.S. Department of Energy Presentation_name
Questions for TodayMaterials
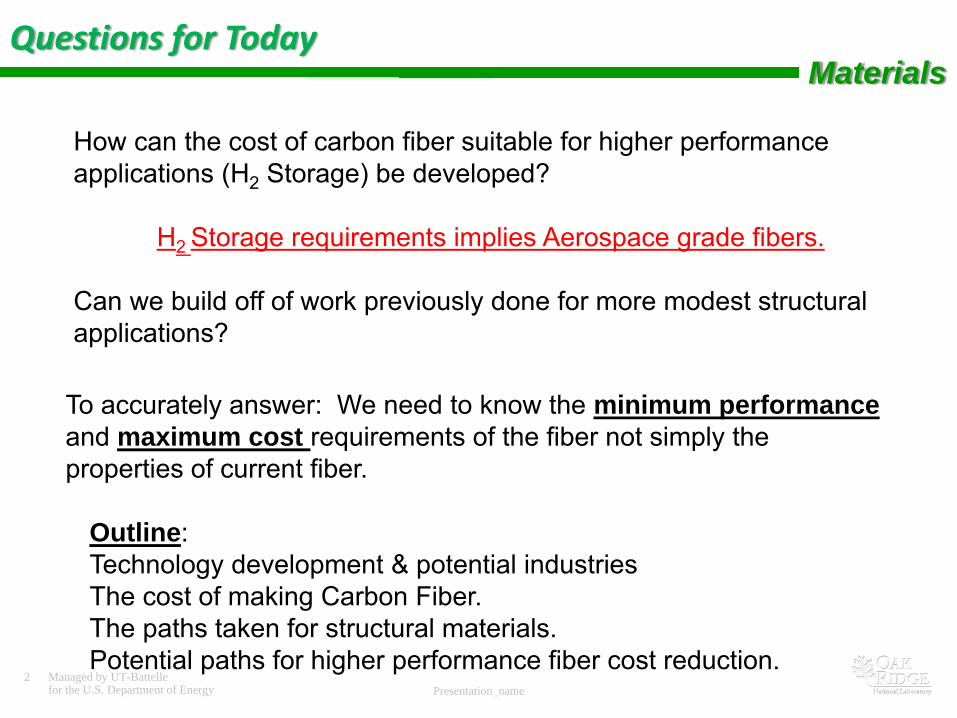
How can the cost of carbon fiber suitable for higher performance applications (H2 Storage) be developed?
H2 Storage requirements implies Aerospace grade fibers.
Can we build off of work previously done for more modest structural applications?
To accurately answer: We need to know the minimum performance and maximum cost requirements of the fiber not simply the properties of current fiber.
Outline:Technology development & potential industriesThe cost of making Carbon Fiber.The paths taken for structural materials.Potential paths for higher performance fiber cost reduction.
3 Managed by UT-Battellefor the U.S. Department of Energy Presentation_name
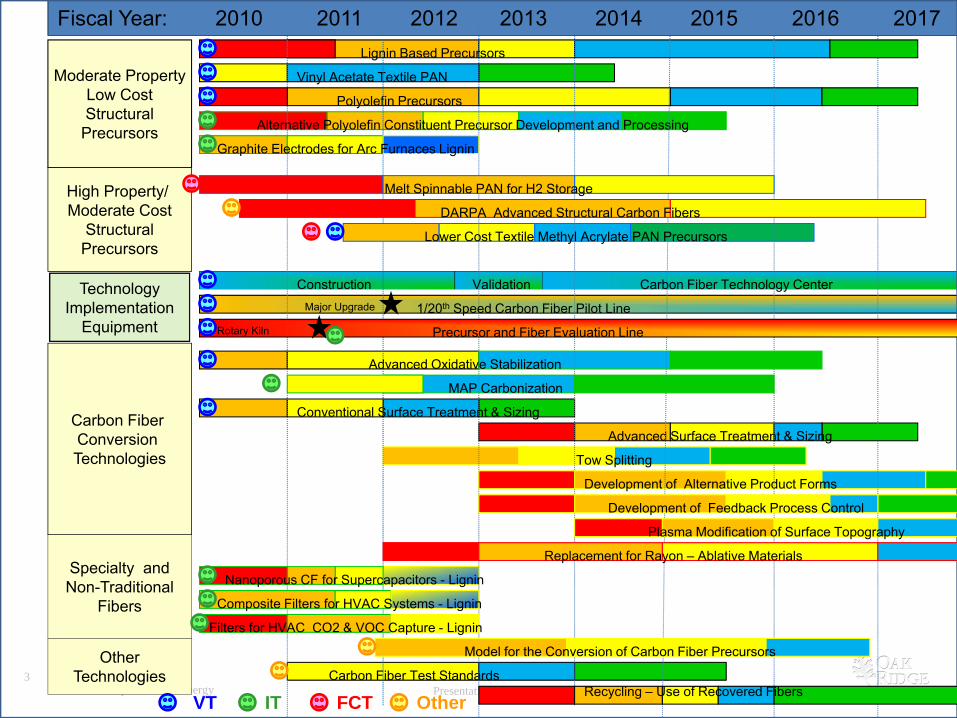
Fiscal Year: 2010 2011 2012 2013 2014 2015 2016 2017
Moderate PropertyLow CostStructural
Precursors
High Property/ Moderate Cost
StructuralPrecursors
Specialty andNon-Traditional
Fibers
TechnologyImplementation
Equipment
Lignin Based Precursors
Vinyl Acetate Textile PAN
Polyolefin Precursors
Alternative Polyolefin Constituent Precursor Development and Processing
Advanced Oxidative Stabilization
MAP Carbonization
Conventional Surface Treatment & Sizing
Advanced Surface Treatment & Sizing
Tow Splitting
Development of Alternative Product Forms
Carbon Fiber Test Standards
Carbon Fiber Conversion Technologies
Validation Carbon Fiber Technology CenterConstruction
1/20th Speed Carbon Fiber Pilot Line
Precursor and Fiber Evaluation Line
Major Upgrade
Replacement for Rayon – Ablative Materials
Model for the Conversion of Carbon Fiber Precursors
Development of Feedback Process Control
Other Technologies
Graphite Electrodes for Arc Furnaces Lignin
Nanoporous CF for Supercapacitors - Lignin
Composite Filters for HVAC Systems - Lignin
Filters for HVAC CO2 & VOC Capture - Lignin
Plasma Modification of Surface Topography
Rotary Kiln
Recycling – Use of Recovered Fibers VT
DARPA Advanced Structural Carbon Fibers
Lower Cost Textile Methyl Acrylate PAN Precursors
Melt Spinnable PAN for H2 Storage
IT FCT Other

4 Managed by UT-Battellefor the U.S. Department of Energy Presentation_name
Cost Performance CategoriesCarbon Fibers can be divided into 4 BroadCost/Performance Categories:
High Performance >750 KSI Cost is not Limiting> 35 MSI Performance Driven
Moderate Grade 500 – 750 KSI Cost and Performance25 – 35 MSI Balance
High Volume Grade 250 – 500 KSI Cost Sensitive< 25 MSI Performance Enabling
Non Structural Chemical & Physical Usually Low Cost andProperties of Carbon Chosen for Uniqueness
Most High Volume Industries would require the last 2 Categories
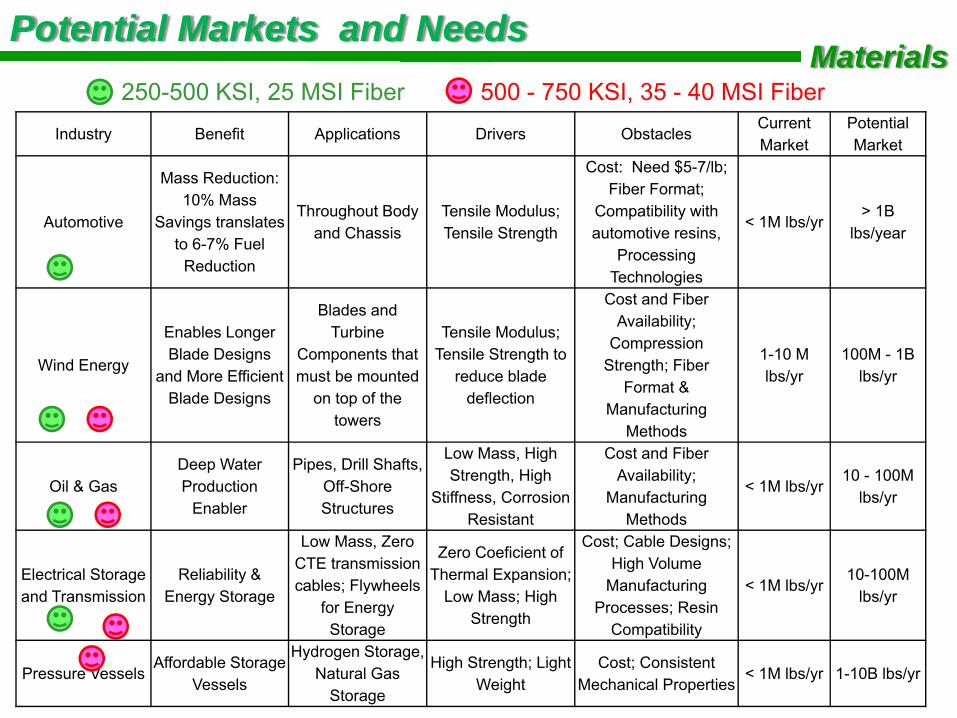
Industry Benefit Applications Drivers ObstaclesCurrent Market
Potential Market
Automotive
Mass Reduction: 10% Mass
Savings translates to 6-7% Fuel
Reduction
Throughout Body and Chassis
Tensile Modulus; Tensile Strength
Cost: Need $5-7/lb; Fiber Format;
Compatibility with automotive resins,
Processing Technologies
< 1M lbs/yr> 1B
lbs/year
Wind Energy
Enables Longer Blade Designs
and More Efficient Blade Designs
Blades and Turbine
Components that must be mounted
on top of the towers
Tensile Modulus; Tensile Strength to
reduce blade deflection
Cost and Fiber Availability;
Compression Strength; Fiber
Format & Manufacturing
Methods
1-10 M lbs/yr
100M - 1B lbs/yr
Oil & GasDeep Water Production
Enabler
Pipes, Drill Shafts, Off-Shore Structures
Low Mass, High Strength, High
Stiffness, Corrosion Resistant
Cost and Fiber Availability;
Manufacturing Methods
< 1M lbs/yr10 - 100M
lbs/yr
Electrical Storage and Transmission
Reliability & Energy Storage
Low Mass, Zero CTE transmission cables; Flywheels
for Energy Storage
Zero Coeficient of Thermal Expansion;
Low Mass; High Strength
Cost; Cable Designs; High Volume
Manufacturing Processes; Resin
Compatibility
< 1M lbs/yr10-100M
lbs/yr
Pressure VesselsAffordable Storage
Vessels
Hydrogen Storage, Natural Gas
Storage
High Strength; Light Weight
Cost; Consistent Mechanical Properties
< 1M lbs/yr 1-10B lbs/yr
Potential Markets and NeedsMaterials
250-500 KSI, 25 MSI Fiber 500 - 750 KSI, 35 - 40 MSI Fiber
6 Managed by UT-Battellefor the U.S. Department of Energy Presentation_name
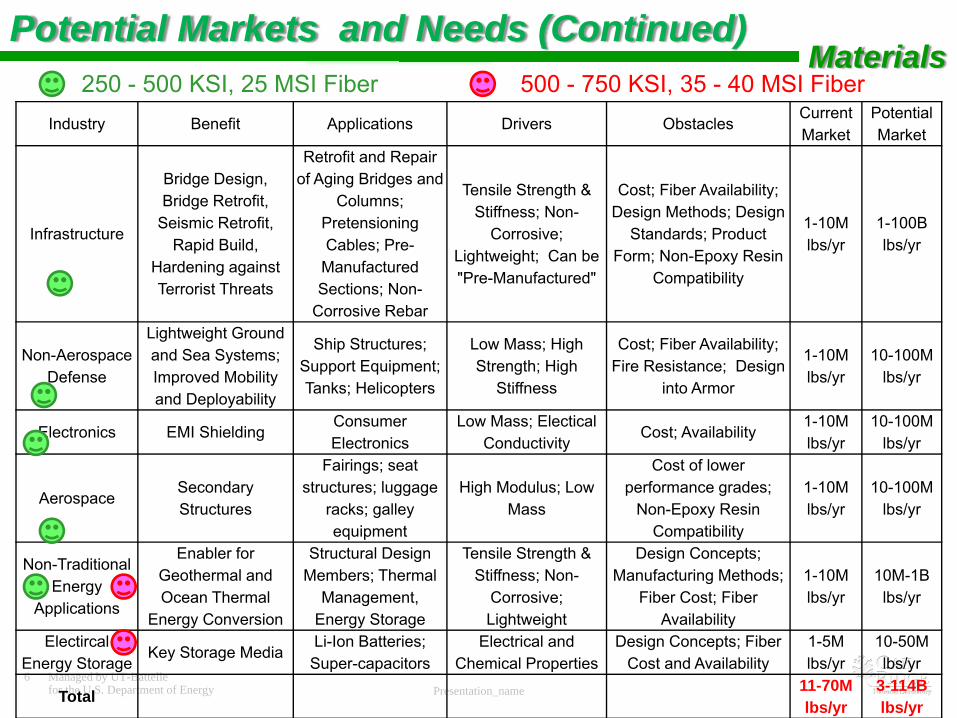
Industry Benefit Applications Drivers ObstaclesCurrent Market
Potential Market
Infrastructure
Bridge Design, Bridge Retrofit,
Seismic Retrofit, Rapid Build,
Hardening against Terrorist Threats
Retrofit and Repair of Aging Bridges and
Columns; Pretensioning Cables; Pre-
Manufactured Sections; Non-
Corrosive Rebar
Tensile Strength & Stiffness; Non-
Corrosive; Lightweight; Can be "Pre-Manufactured"
Cost; Fiber Availability; Design Methods; Design
Standards; Product Form; Non-Epoxy Resin
Compatibility
1-10M lbs/yr
1-100B lbs/yr
Non-AerospacDefense
e Lightweight Ground and Sea Systems; Improved Mobility and Deployability
Ship Structures; Support Equipment; Tanks; Helicopters
Low Mass; High Strength; High
Stiffness
Cost; Fiber Availability; Fire Resistance; Design
into Armor
1-10M lbs/yr
10-100M lbs/yr
Electronics EMI ShieldingConsumer Electronics
Low Mass; Electical Conductivity
Cost; Availability1-10M lbs/yr
10-100M lbs/yr
AerospaceSecondary Structures
Fairings; seat structures; luggage
racks; galley equipment
High Modulus; Low Mass
Cost of lower performance grades;
Non-Epoxy Resin Compatibility
1-10M lbs/yr
10-100M lbs/yr
Non-Traditional Energy
Applications
Enabler for Geothermal and Ocean Thermal
Energy Conversion
Structural Design Members; Thermal
Management, Energy Storage
Tensile Strength & Stiffness; Non-
Corrosive; Lightweight
Design Concepts; Manufacturing Methods;
Fiber Cost; Fiber Availability
1-10M lbs/yr
10M-1B lbs/yr
Electircal Energy Storage
Key Storage MediaLi-Ion Batteries; Super-capacitors
Electrical and Chemical Properties
Design Concepts; Fiber Cost and Availability
1-5M lbs/yr
10-50M lbs/yr
Total 11-70Mlbs/yr
3-114B lbs/yr
Potential Markets and Needs (Continued)Materials
250 - 500 KSI, 25 MSI Fiber 500 - 750 KSI, 35 - 40 MSI Fiber
7 Managed by UT-Battellefor the U.S. Department of Energy Presentation_name
Materials
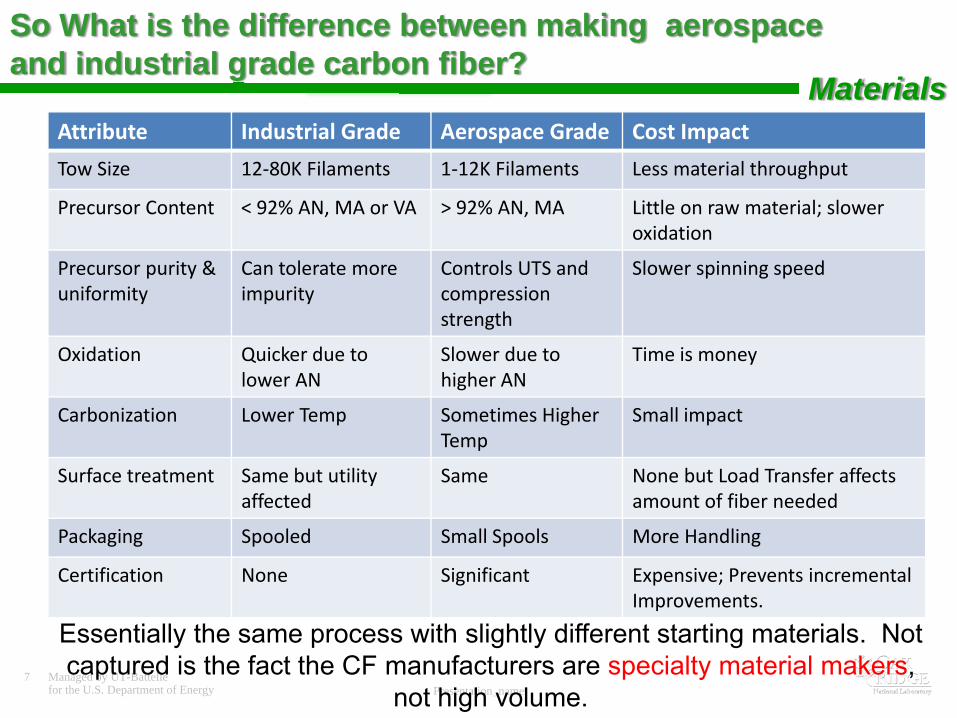
So What is the difference between making aerospace and industrial grade carbon fiber?
Attribute Industrial Grade Aerospace Grade Cost Impact
Tow Size 12‐80K Filaments 1‐12K Filaments Less material throughput
Precursor Content < 92% AN, MA or VA > 92% AN, MA Little on raw material; slower oxidation
Precursor purity & uniformity
Can tolerate more impurity
Controls UTS and compression strength
Slower spinning speed
Oxidation Quicker due to lower AN
Slower due to higher AN
Time is money
Carbonization Lower Temp Sometimes Higher Temp
Small impact
Surface treatment Same but utility affected
Same None but Load Transfer affects amount of fiber needed
Packaging Spooled Small Spools More Handling
Certification None Significant Expensive; Prevents incremental Improvements.
Essentially the same process with slightly different starting materials. Not captured is the fact the CF manufacturers are specialty material makers,
not high volume.
8 Managed by UT-Battellefor the U.S. Department of Energy Presentation_name
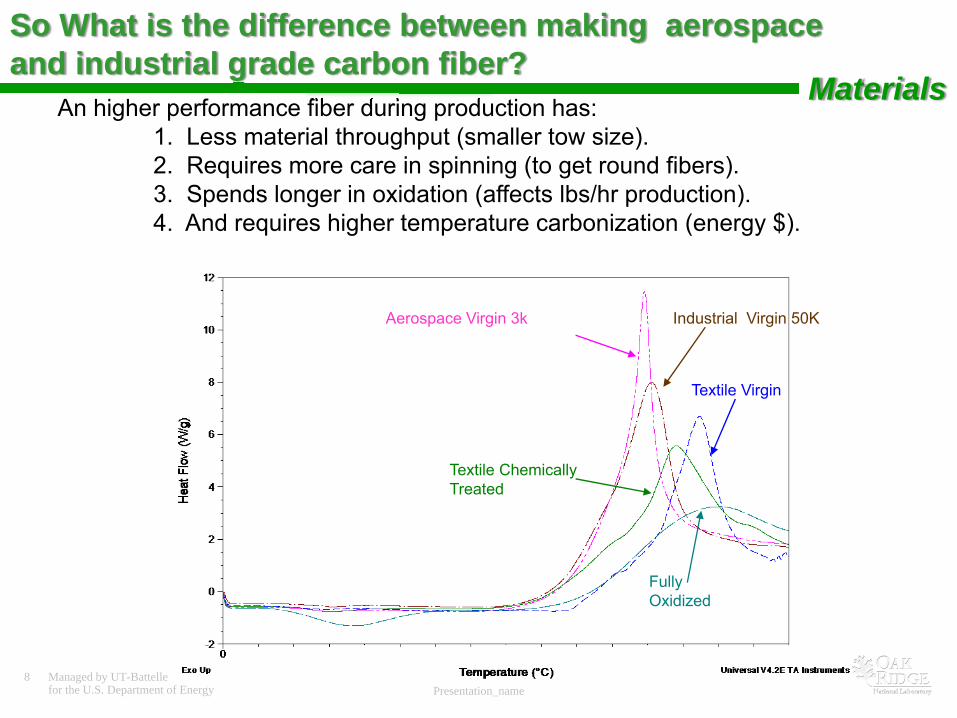
Aerospace Virgin 3k Industrial Virgin 50K
Textile Virgin
Fully Oxidized
Textile Chemically Treated
An higher performance fiber during production has:1. Less material throughput (smaller tow size).2. Requires more care in spinning (to get round fibers).3. Spends longer in oxidation (affects lbs/hr production).4. And requires higher temperature carbonization (energy $).
Materials
So What is the difference between making aerospace and industrial grade carbon fiber?
9 Managed by UT-Battellefor the U.S. Department of Energy Presentation_name
0
50
100
150
200
250
300
350
400
450
Stretched Unstretched
Strength (KSI)
0
5
10
15
20
25
30
35
Stretched Unstretched
Modulus (MSI)
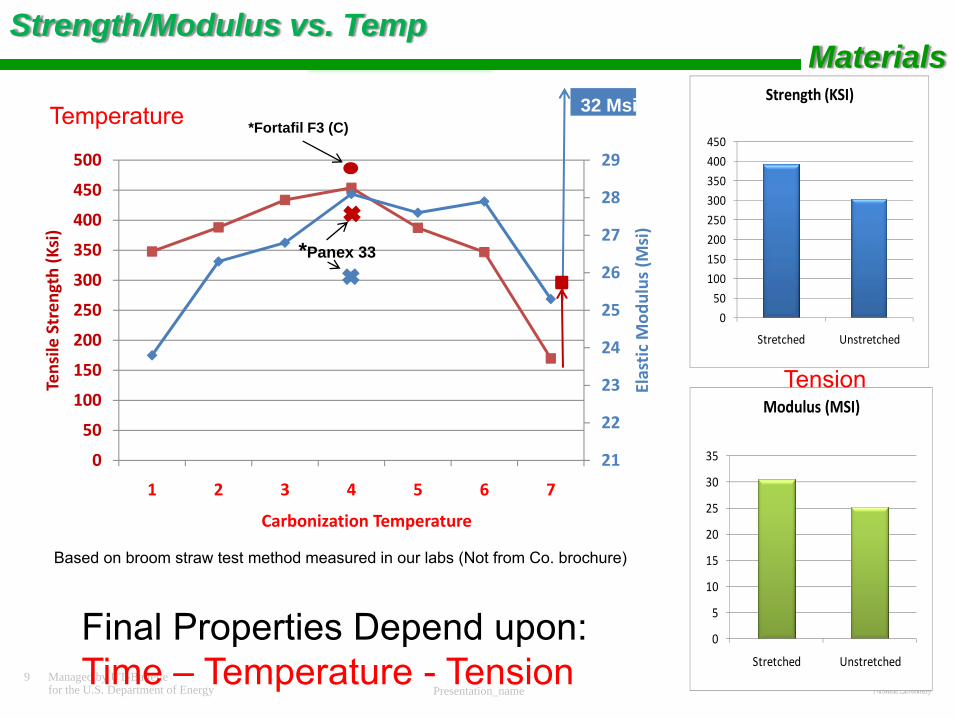
Final Properties Depend upon:Time – Temperature - Tension
21
22
23
24
25
26
27
28
29
0
50
100
150
200
250
300
350
400
450
500
1 2 3 4 5 6 7
Elastic Mod
ulus (M
si)
Tensile
Stren
gth (Ksi)
Carbonization Temperature
*Panex 33
*Fortafil F3 (C)
Based on broom straw test method measured in our labs (Not from Co. brochure)
32 Msi
Textile Based PrecursorsTextile Based PrecursorsStrength/Modulus vs. Temp
Materials
Temperature
Tension
10 Managed by UT-Battellefor the U.S. Department of Energy Presentation_name
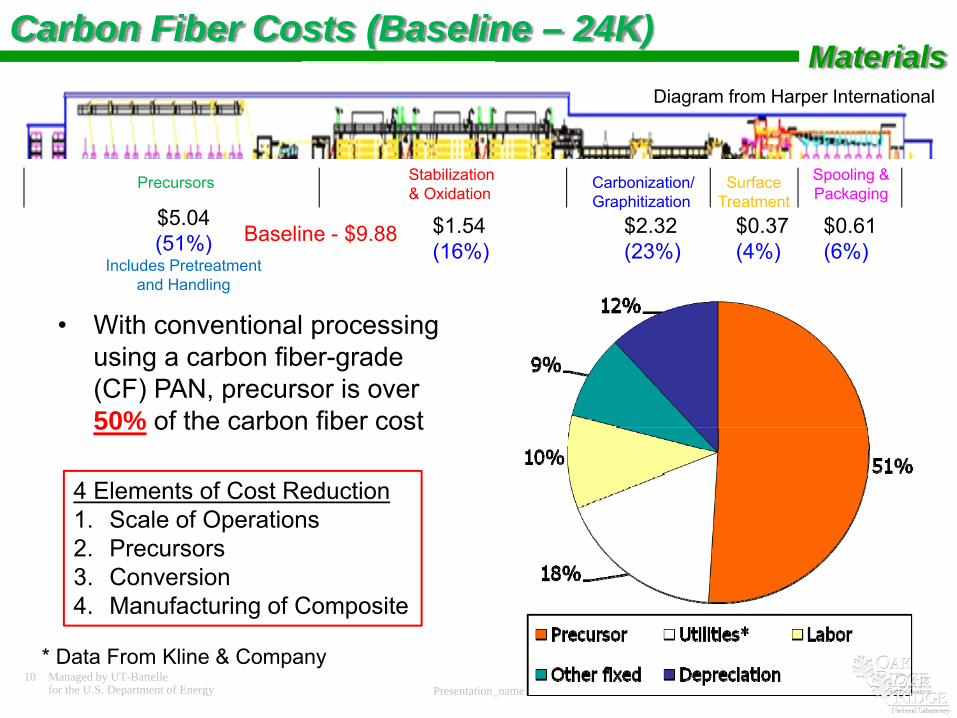
Baseline - $9.88$5.04(51%)
Includes Pretreatment and Handling
$1.54(16%)
$2.32(23%)
$0.37(4%)
$0.61(6%)
• With conventional processing using a carbon fiber-grade (CF) PAN, precursor is over 50% of the carbon fiber cost
Carbon Fiber Costs (Baseline – 24K)
* Data From Kline & Company
4 Elements of Cost Reduction1. Scale of Operations2. Precursors3. Conversion4. Manufacturing of Composite
Materials
Precursors Stabilization& Oxidation
Carbonization/Graphitization
SurfaceTreatment
Spooling &Packaging
Diagram from Harper International

11 Managed by UT-Battellefor the U.S. Department of Energy Presentation_name
Carbon Fiber Costs (1. Scale of Operations)
Precursors Stabilization& Oxidation
Carbonization/Graphitization
SurfaceTreatment
Spooling &Packaging
Baseline Today - $9.88High Volume - $7.85
$5.04$4.64
$1.54$0.99
$2.32$1.48
$0.37$0.33
$0.61$0.41
Diagram from Harper International
Significant Cost Reduction can be achieved by increased Scale-
up of Plant and Line Size
* Baseline Data From Kline & Company
ButNot All the Needed Cost
Reduction
Cost US$
Baseline Scale-Up
Materials
Mfg
Cos
t $
per l
b of
CF
Annual Production Capacity
12 Managed by UT-Battellefor the U.S. Department of Energy Presentation_name
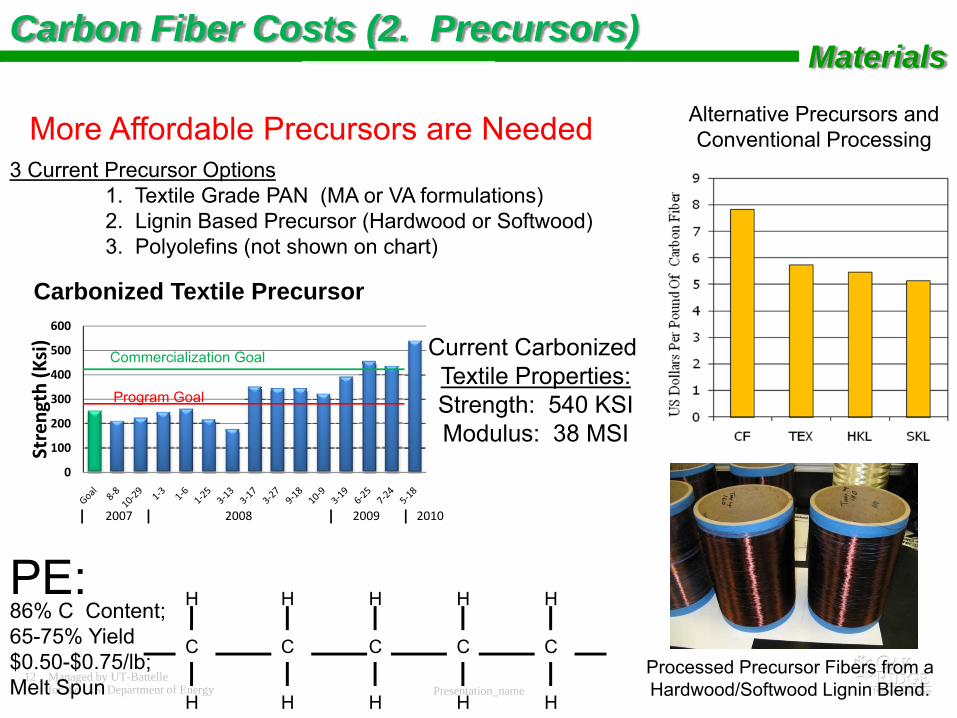
Alternative Precursors andConventional Processing
3 Current Precursor Options1. Textile Grade PAN (MA or VA formulations)2. Lignin Based Precursor (Hardwood or Softwood)3. Polyolefins (not shown on chart)
Carbon Fiber Costs (2. Precursors)
More Affordable Precursors are Needed
Processed Precursor Fibers from a Hardwood/Softwood Lignin Blend.
H
C C CC C
H H H H
H H H H H
86% C Content; 65-75% Yield$0.50-$0.75/lb; Melt Spun
PE:
Materials
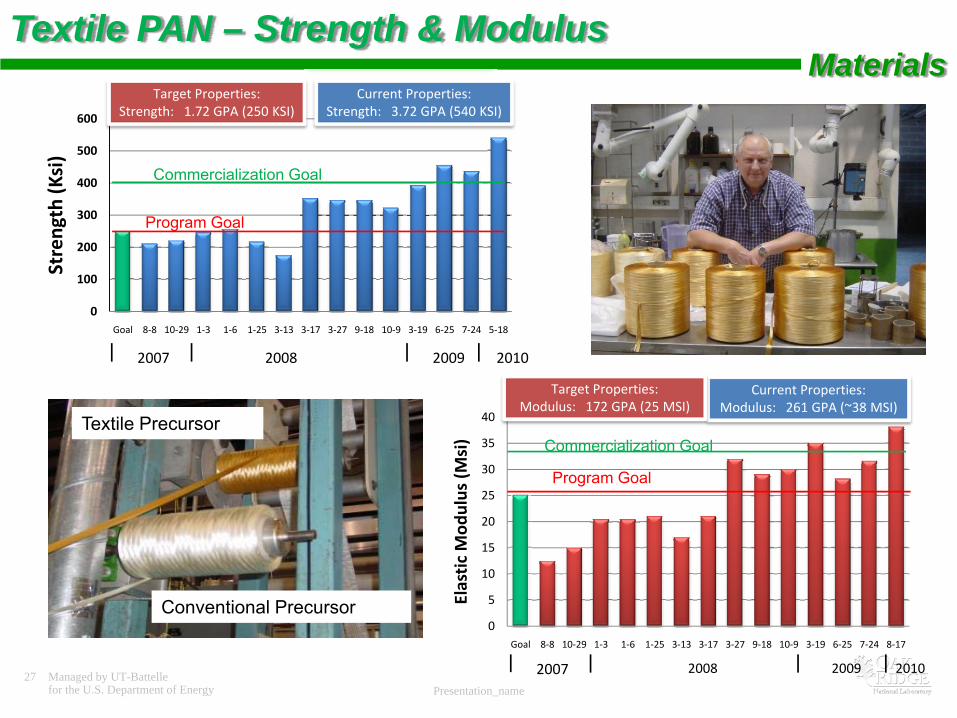
Carbonized Textile Precursor
Current Carbonized Textile Properties:Strength: 540 KSIModulus: 38 MSI
0
100
200
300
400
500
600
Strength (K
si)
2007 2008 2009 2010
Program Goal
Commercialization Goal
13 Managed by UT-Battellefor the U.S. Department of Energy Presentation_name
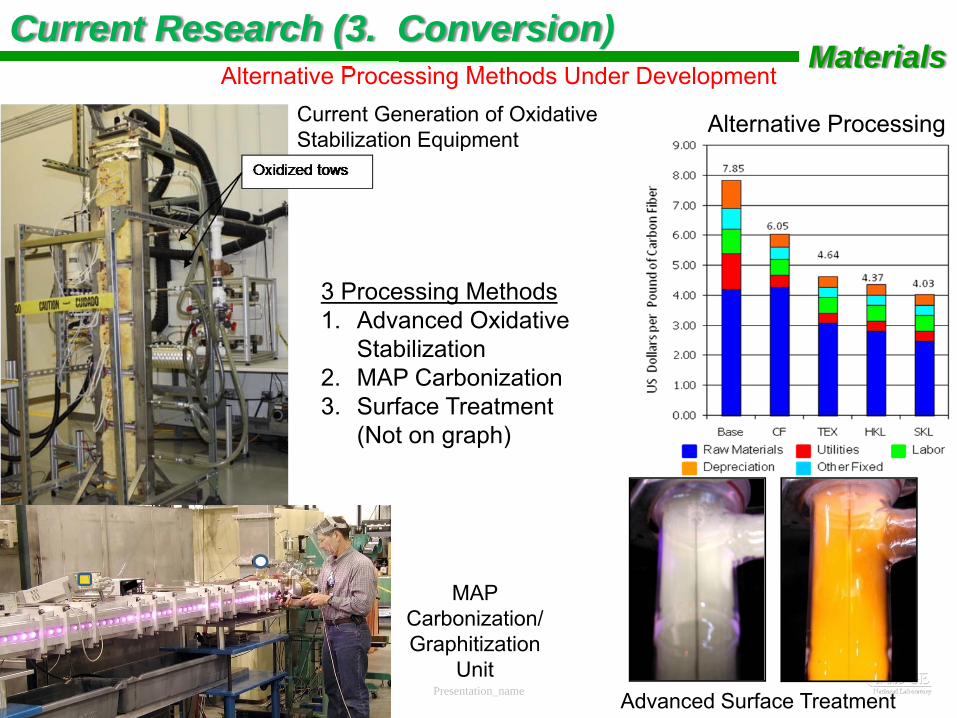
Alternative Processing
3 Processing Methods1. Advanced Oxidative
Stabilization2. MAP Carbonization3. Surface Treatment
(Not on graph)
Current Research (3. Conversion)Alternative Processing Methods Under Development
Advanced Surface Treatment
MAP Carbonization/Graphitization
Unit
MaterialsCurrent Generation of Oxidative Stabilization Equipment
14 Managed by UT-Battellefor the U.S. Department of Energy Presentation_name
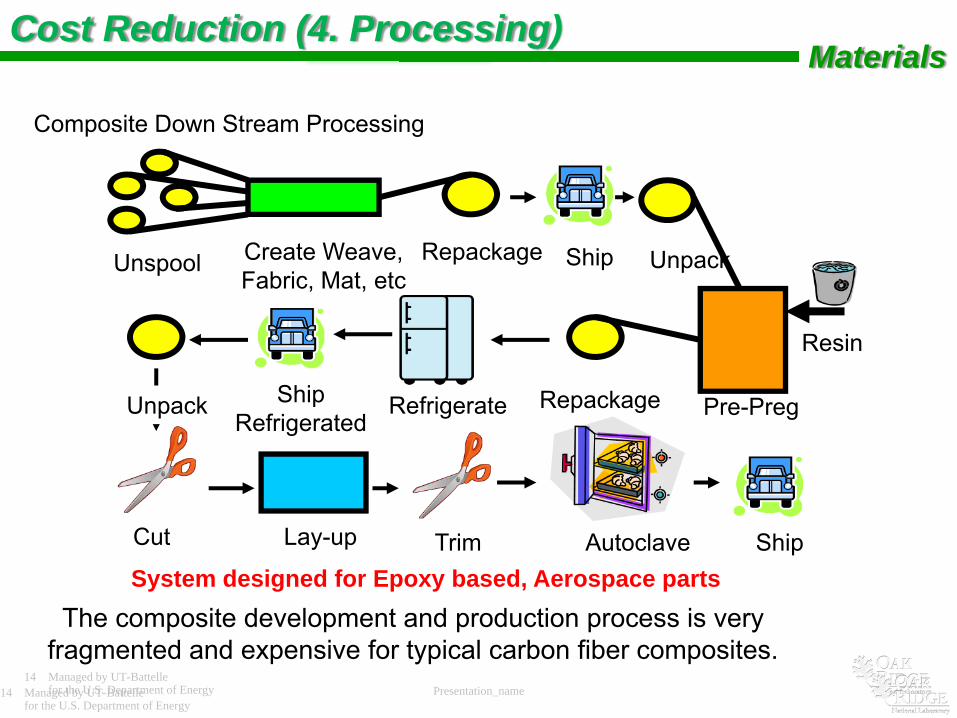
Cost Reduction (4. Processing)
Composite Down Stream Processing
Unspool Create Weave,Fabric, Mat, etc
Repackage Ship Unpack
Pre-Preg
Resin
RefrigerateShipRefrigerated
Repackage
Cut Lay-up Trim Autoclave ShipSystem designed for Epoxy based, Aerospace parts
Unpack
The composite development and production process is very fragmented and expensive for typical carbon fiber composites.
14 Managed by UT-Battellefor the U.S. Department of Energy
Materials

15 Managed by UT-Battellefor the U.S. Department of Energy Presentation_name
Potential Paths for Higher Performance CF cost reduction
1. Textile PAN that is MA-based(Shorter Term)
Challenges:1. Adapting high speed processes for higher AN concentration.2. Adapting high speed processes to increase precursor purity (minimize
defects).3. Spinning of round fibers (air gap spinning).4. Improving consistency, fiber to fiber and along fibers without sacrificing speed.
Can be done. Largely a quality control and willingness issue.
Target Properties:Strength: 1.72 GPA
(250 KSI)
Current Properties:Strength: 3.72 GPA
(540 KSI)
Done with VA Comonomer
Materials
0
100
200
300
400
500
600
Goal 8‐8 10‐29 1‐3 1‐6 1‐25 3‐13 3‐17 3‐27 9‐18 10‐9 3‐19 6‐25 7‐24 5‐18
Strength (K
si)
2007 2008 2009 2010
Program Goal
Commercialization Goal
16 Managed by UT-Battellefor the U.S. Department of Energy Presentation_name
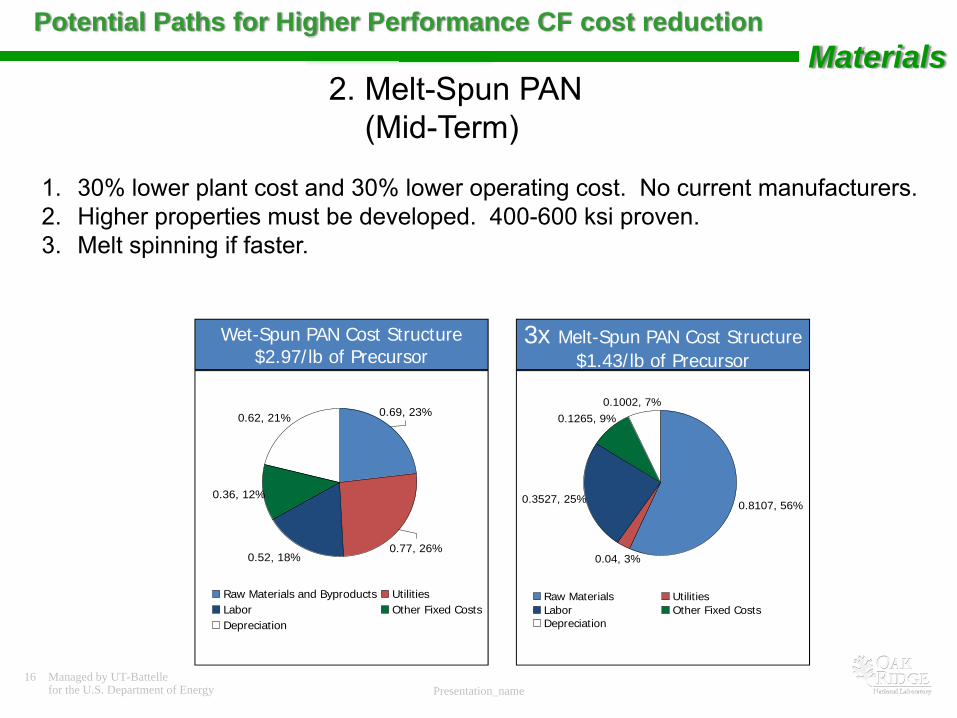
2. Melt-Spun PAN (Mid-Term)
Potential Paths for Higher Performance CF cost reductionMaterials
1. 30% lower plant cost and 30% lower operating cost. No current manufacturers.2. Higher properties must be developed. 400-600 ksi proven.3. Melt spinning if faster.
Wet-Spun PAN Cost Structure$2.97/lb of Precursor
3x Melt-Spun PAN Cost Structure$1.43/lb of Precursor
0.1265, 9%
0.3527, 25% 0.8107, 56%
0.1002, 7%
0.04, 3%
Raw Materials UtilitiesLabor Other Fixed CostsDepreciation
0.36, 12%
0.52, 18%
0.69, 23%0.62, 21%
0.77, 26%
Raw Materials and Byproducts UtilitiesLabor Other Fixed CostsDepreciation
17 Managed by UT-Battellefor the U.S. Department of Energy Presentation_name
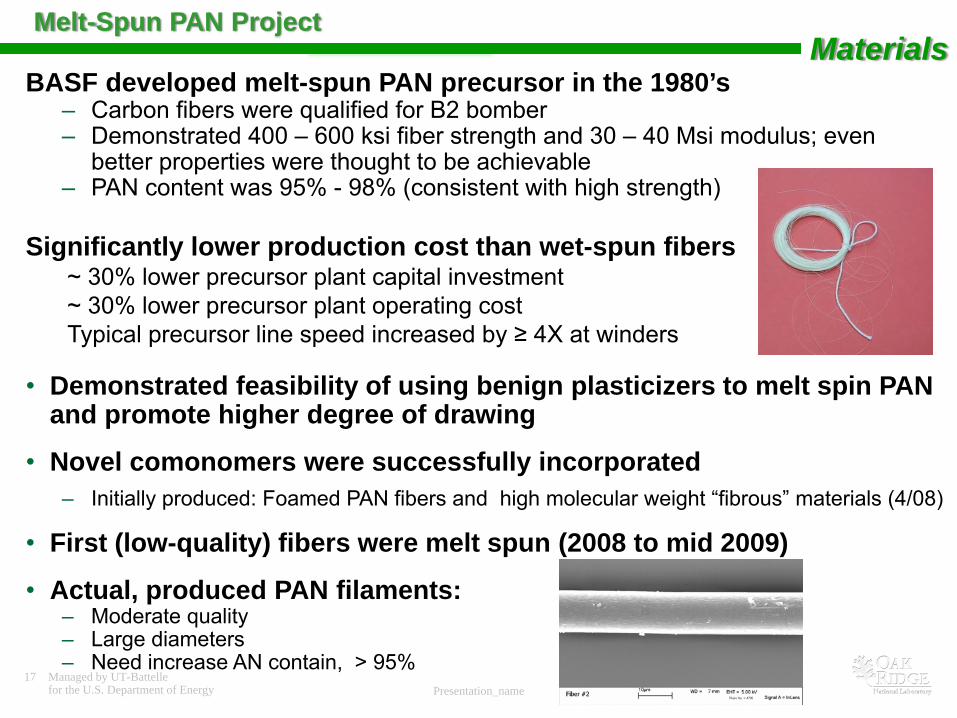
BASF developed melt-spun PAN precursor in the 1980’s– Carbon fibers were qualified for B2 bomber– Demonstrated 400 – 600 ksi fiber strength and 30 – 40 Msi modulus; even
better properties were thought to be achievable– PAN content was 95% - 98% (consistent with high strength)
Significantly lower production cost than wet-spun fibers~ 30% lower precursor plant capital investment~ 30% lower precursor plant operating costTypical precursor line speed increased by ≥ 4X at winders
• Demonstrated feasibility of using benign plasticizers to melt spin PAN and promote higher degree of drawing
• Novel comonomers were successfully incorporated– Initially produced: Foamed PAN fibers and high molecular weight “fibrous” materials (4/08)
• First (low-quality) fibers were melt spun (2008 to mid 2009)
• Actual, produced PAN filaments:– Moderate quality– Large diameters– Need increase AN contain, > 95%
Melt-Spun PAN ProjectMaterials

18 Managed by UT-Battellefor the U.S. Department of Energy Presentation_name
3. Develop a New Precursor(Longer-Term)
Potential Paths for Higher Performance CF cost reductionMaterials
1. Polyolefins are the leading candidate, however, technology very premature.2. Lignin achieving that level of properties unlikely due to inhomogenity.3. Any other suitable precursor candidates would be even more suitable for lower
performance fibers.4. Micro/Nano-Doped Precursors (strength & seeding) [My #1 alternative]5. New precursors must be proven at lower strength levels before obtaining higher
strengths.
19 Managed by UT-Battellefor the U.S. Department of Energy Presentation_name
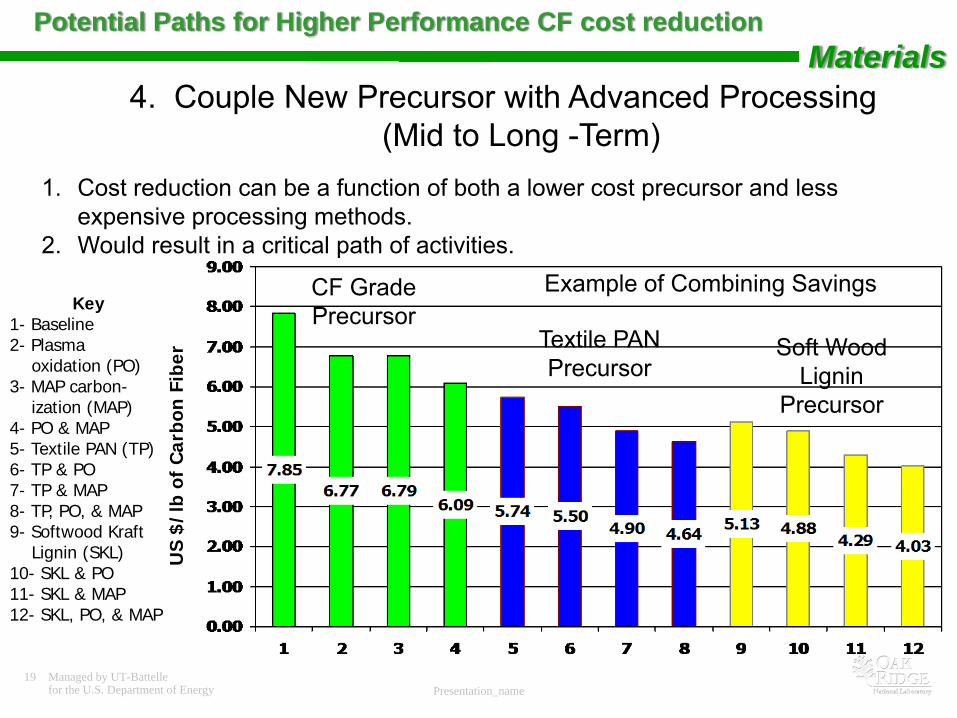
4. Couple New Precursor with Advanced Processing(Mid to Long -Term)
Potential Paths for Higher Performance CF cost reduction
1. Cost reduction can be a function of both a lower cost precursor and less expensive processing methods.
2. Would result in a critical path of activities.
Key1- Baseline2- Plasma
oxidation (PO)3- MAP carbon-
ization (MAP)4- PO & MAP5- Textile PAN (TP)6- TP & PO7- TP & MAP8- TP, PO, & MAP9- Softwood Kraft
Lignin (SKL)10- SKL & PO11- SKL & MAP12- SKL, PO, & MAP
US
$/l
b of
Car
bon
Fib
er
CF GradePrecursor
Textile PANPrecursor
Soft WoodLignin
Precursor
Example of Combining Savings
Materials
20 Managed by UT-Battellefor the U.S. Department of Energy Presentation_name
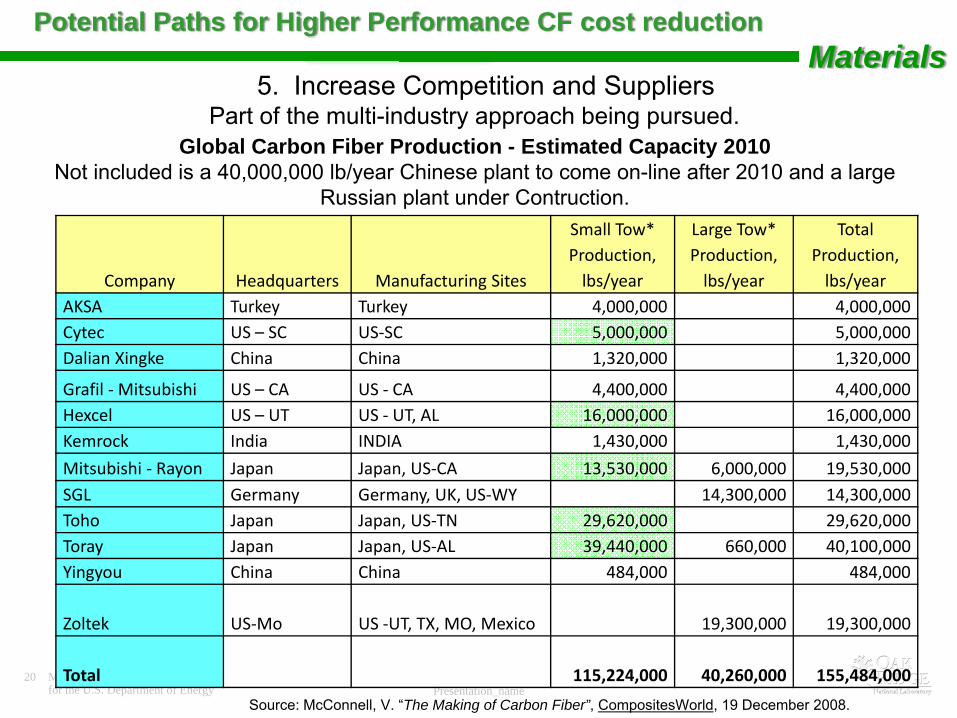
Potential Paths for Higher Performance CF cost reductionMaterials
5. Increase Competition and SuppliersPart of the multi-industry approach being pursued.
Company Headquarters Manufacturing Sites
Small Tow* Production, lbs/year
Large Tow* Production, lbs/year
Total Production, lbs/year
AKSA Turkey Turkey 4,000,000 4,000,000Cytec US – SC US‐SC 5,000,000 5,000,000Dalian Xingke China China 1,320,000 1,320,000
Grafil ‐Mitsubishi US – CA US ‐ CA 4,400,000 4,400,000Hexcel US – UT US ‐ UT, AL 16,000,000 16,000,000Kemrock India INDIA 1,430,000 1,430,000
Mitsubishi ‐ Rayon Japan Japan, US‐CA 13,530,000 6,000,000 19,530,000SGL Germany Germany, UK, US‐WY 14,300,000 14,300,000Toho Japan Japan, US‐TN 29,620,000 29,620,000Toray Japan Japan, US‐AL 39,440,000 660,000 40,100,000Yingyou China China 484,000 484,000
Zoltek US‐Mo US ‐UT, TX, MO, Mexico 19,300,000 19,300,000
Total 115,224,000 40,260,000 155,484,000
Global Carbon Fiber Production - Estimated Capacity 2010 Not included is a 40,000,000 lb/year Chinese plant to come on-line after 2010 and a large
Russian plant under Contruction.
Source: McConnell, V. “The Making of Carbon Fiber”, CompositesWorld, 19 December 2008.
21 Managed by UT-Battellefor the U.S. Department of Energy Presentation_name
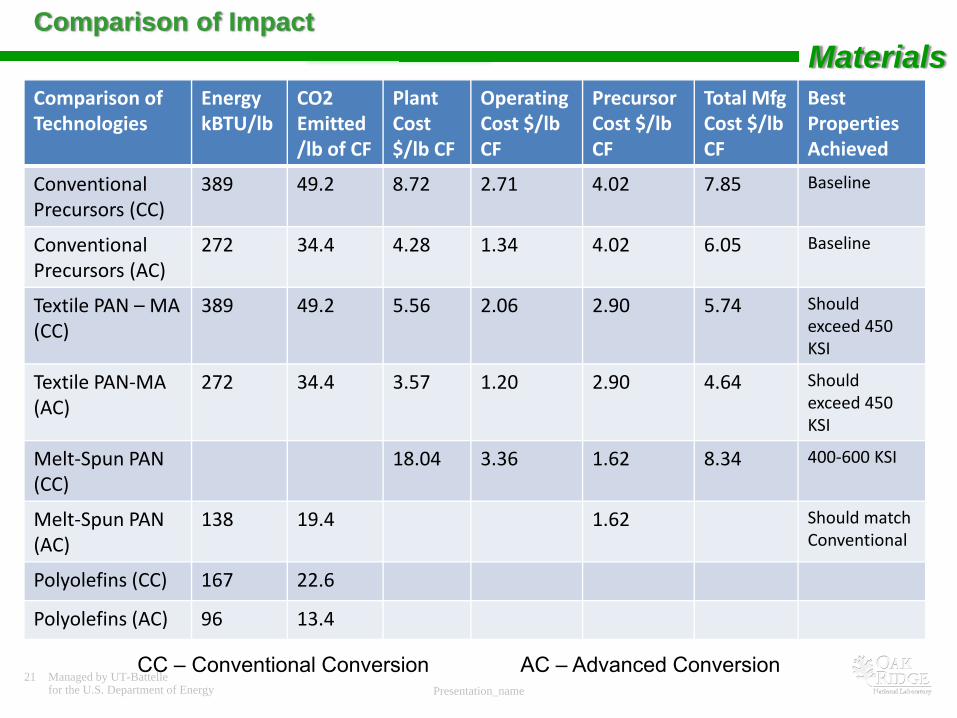
Comparison of Technologies
Energy kBTU/lb
CO2 Emitted/lb of CF
Plant Cost $/lb CF
Operating Cost $/lb CF
Precursor Cost $/lb CF
Total Mfg Cost $/lb CF
Best Properties Achieved
Conventional Precursors (CC)
389 49.2 8.72 2.71 4.02 7.85 Baseline
Conventional Precursors (AC)
272 34.4 4.28 1.34 4.02 6.05 Baseline
Textile PAN – MA(CC)
389 49.2 5.56 2.06 2.90 5.74 Shouldexceed 450 KSI
Textile PAN‐MA (AC)
272 34.4 3.57 1.20 2.90 4.64 Should exceed 450 KSI
Melt‐Spun PAN (CC)
18.04 3.36 1.62 8.34 400‐600 KSI
Melt‐Spun PAN (AC)
138 19.4 1.62 Should match Conventional
Polyolefins (CC) 167 22.6
Polyolefins (AC) 96 13.4
Comparison of ImpactMaterials
CC – Conventional Conversion AC – Advanced Conversion

22 Managed by UT-Battellefor the U.S. Department of Energy Presentation_name
Questions?LM002
23 Managed by UT-Battellefor the U.S. Department of Energy Presentation_name
Dave WarrenMohamed Abdallah
Frederick Baker
Nidia Gallego
Amit Naskar Felix Paulauskas
Cliff Eberle
Soydan Ozcan
The Carbon Fiber TeamMaterials
Ken Yarborough Fue XiongRobert Norris Ronny Lomax
24 Managed by UT-Battellefor the U.S. Department of Energy Presentation_name
Tomonori Saito
Daniel Webb
The Carbon Fiber TeamMaterials
Kelby Cassity
Rebecca Brown
Pol Grappe
Marcus Hunt
Brian Eckhart
Future Staff
The entire team contributed to this
presentation!!!!
25 Managed by UT-Battellefor the U.S. Department of Energy Presentation_name
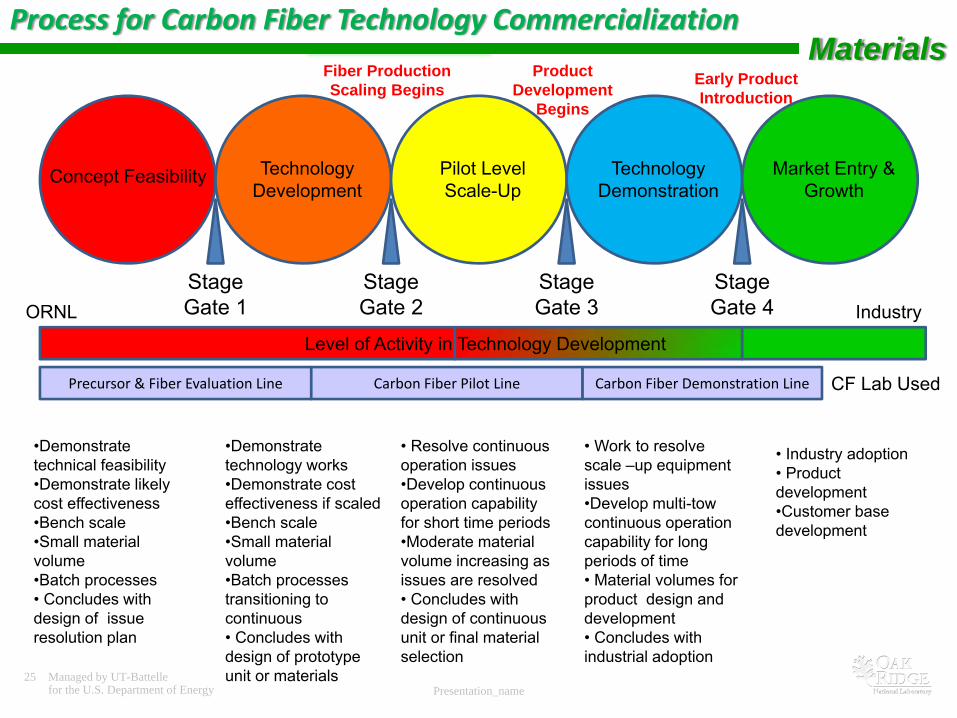
Concept Feasibility Technology Development
Pilot Level Scale-Up
Technology Demonstration
Market Entry & Growth
Stage Gate 1
Stage Gate 2
Stage Gate 3
Stage Gate 4
Process for Carbon Fiber Technology Commercialization
•Demonstrate technical feasibility•Demonstrate likely cost effectiveness•Bench scale•Small material volume•Batch processes• Concludes with design of issue resolution plan
•Demonstrate technology works•Demonstrate cost effectiveness if scaled•Bench scale•Small material volume•Batch processes transitioning to continuous• Concludes with design of prototype unit or materials
• Resolve continuous operation issues•Develop continuous operation capability for short time periods•Moderate material volume increasing as issues are resolved• Concludes with design of continuous unit or final material selection
• Work to resolve scale –up equipment issues•Develop multi-tow continuous operation capability for long periods of time• Material volumes for product design and development • Concludes with industrial adoption
• Industry adoption• Product development•Customer base development
ORNL Industry
Level of Activity in Technology Development
Precursor & Fiber Evaluation Line Carbon Fiber Pilot Line Carbon Fiber Demonstration Line CF Lab Used
MaterialsProduct
Development Begins
Early Product Introduction
Fiber Production Scaling Begins
26 Managed by UT-Battellefor the U.S. Department of Energy Presentation_name
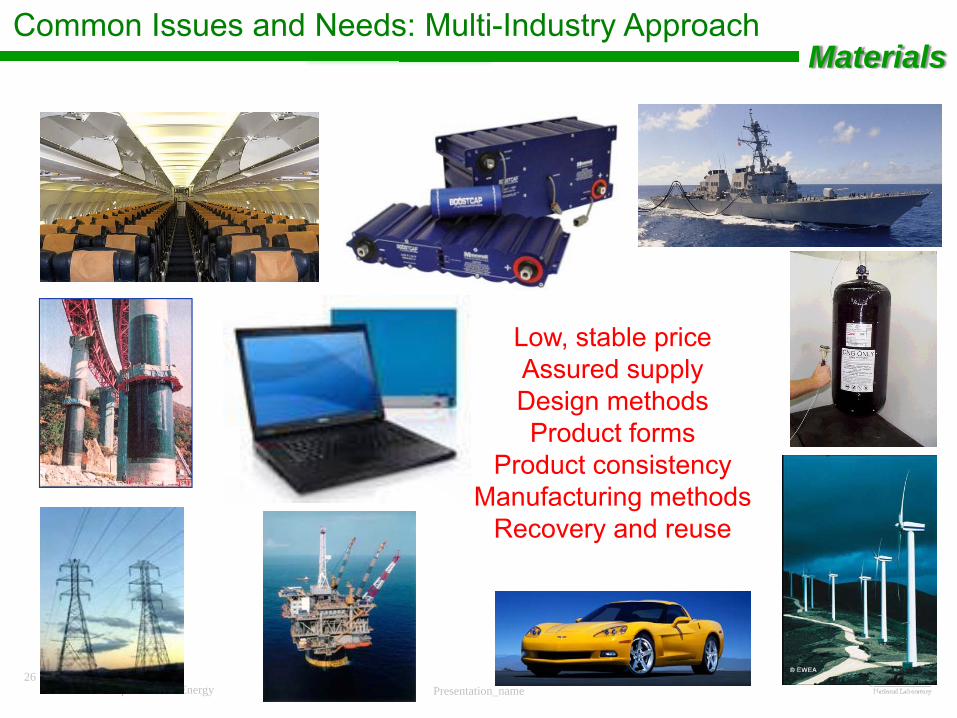
Common Issues and Needs: Multi-Industry Approach
Low, stable priceAssured supplyDesign methodsProduct forms
Product consistencyManufacturing methods
Recovery and reuse
Materials
27 Managed by UT-Battellefor the U.S. Department of Energy Presentation_name
0
5
10
15
20
25
30
35
40
Goal 8‐8 10‐29 1‐3 1‐6 1‐25 3‐13 3‐17 3‐27 9‐18 10‐9 3‐19 6‐25 7‐24 8‐17
Elastic Mod
ulus (M
si)
2007 2008 2009
Textile Based PrecursorsTextile PAN – Strength & ModulusMaterials
Conventional Precursor
Textile Precursor
0
100
200
300
400
500
600
Goal 8‐8 10‐29 1‐3 1‐6 1‐25 3‐13 3‐17 3‐27 9‐18 10‐9 3‐19 6‐25 7‐24 5‐18
Strength (K
si)
2007 2008 2009 2010
Target Properties:Strength: 1.72 GPA (250 KSI)
Current Properties:Strength: 3.72 GPA (540 KSI)
Program Goal
Commercialization Goal
Current Properties:Modulus: 261 GPA (~38 MSI)
Target Properties:Modulus: 172 GPA (25 MSI)
2010
Program Goal
Commercialization Goal
28 Managed by UT-Battellefor the U.S. Department of Energy Presentation_name
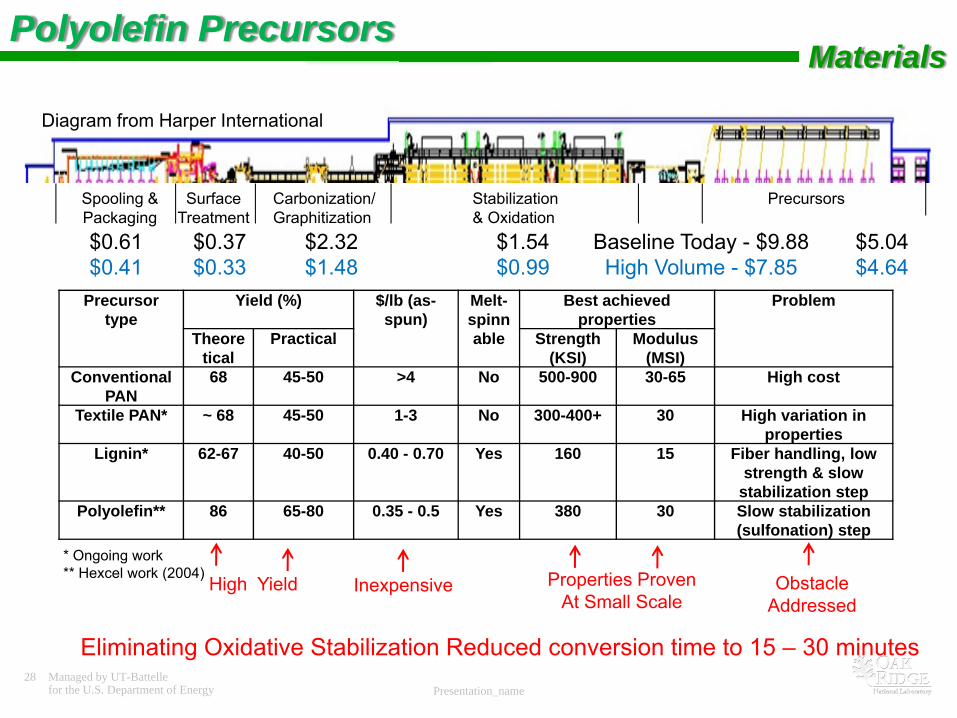
PrecursorsStabilization& Oxidation
Carbonization/Graphitization
SurfaceTreatment
Spooling &Packaging
Baseline Today - $9.88High Volume - $7.85
$5.04$4.64
$1.54$0.99
$2.32$1.48
$0.37$0.33
$0.61$0.41
Diagram from Harper International
Precursor type
Yield (%) $/lb (as-spun)
Melt-spinnable
Best achieved properties
Problem
Theoretical
Practical Strength (KSI)
Modulus (MSI)
Conventional PAN
68 45-50 >4 No 500-900 30-65 High cost
Textile PAN* ~ 68 45-50 1-3 No 300-400+ 30 High variation in properties
Lignin* 62-67 40-50 0.40 - 0.70 Yes 160 15 Fiber handling, low strength & slow
stabilization stepPolyolefin** 86 65-80 0.35 - 0.5 Yes 380 30 Slow stabilization
(sulfonation) step
High Yield Inexpensive ObstacleAddressed
Eliminating Oxidative Stabilization Reduced conversion time to 15 – 30 minutes
Properties ProvenAt Small Scale
* Ongoing work** Hexcel work (2004)
Polyolefin Precursors Materials

29 Managed by UT-Battellefor the U.S. Department of Energy Presentation_name
PrecursorsStabilization& Oxidation
Carbonization/Graphitization
SurfaceTreatment
Spooling &Packaging
Baseline Today - $9.88High Volume - $7.85
$5.04$4.64
$1.54$0.99
$2.32$1.48
$0.37$0.33
$0.61$0.41
Diagram from Harper International
High $0.41 $0.33 $1.48 $0.20 $3.32 $0.90
Low $0.41 $0.33 $1.25 $0.10 $2.74 $0.65Less Effluents
Faster throughputLess Incineration
Large tow CF Precursor
Small tow (<24k) CF Precursor
Textile Precursor
Polyolefin Precursor
As-Spun Fiber ($/lb) $ 3-5 $ 4-6 $ 2-3 $ 0.50 - $ 0.60
Carbon Yield ~45% ~50% ~50% 65 - 80%
Precursor Cost ($ /lb CF) $ 6.5-11 $ 8-12 $ 4-6 $ 0.65 - $ 0.90
Stabilization 85 - 120 min 75 -100 min 75 - 100 min 60 min **
Carbonization Same Same Same Same
Polyolefin Precursors – Cost Potential Materials
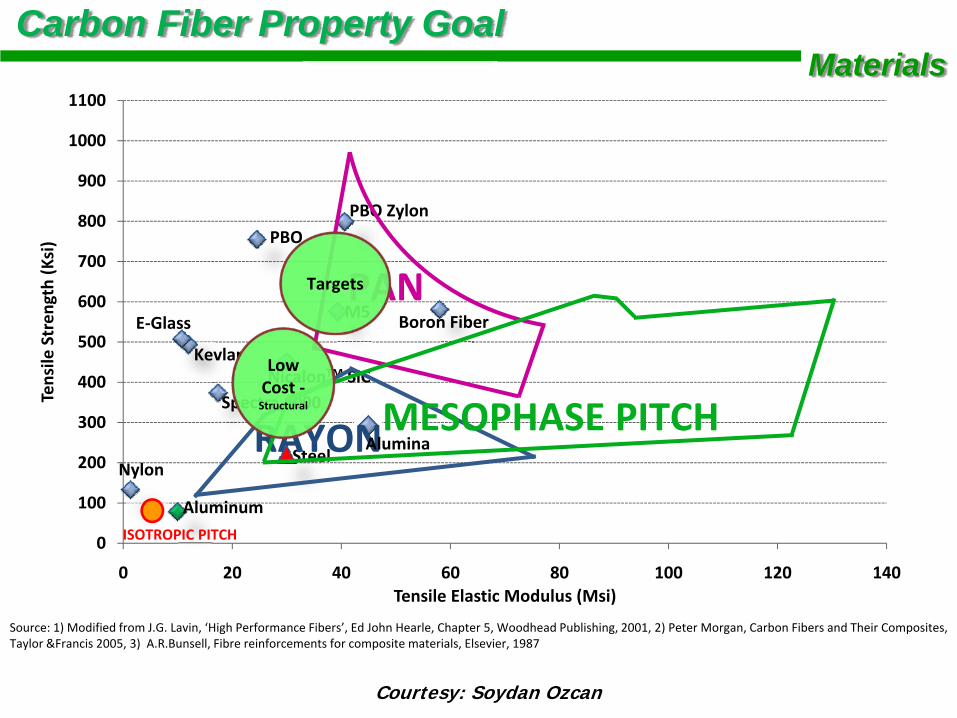
0
100
200
300
400
500
600
700
800
900
1000
1100
0 20 40 60 80 100 120 140
Tensile
Stren
gth (Ksi)
Tensile Elastic Modulus (Msi)
Steel
Aluminum
Boron Fiber
Spectra 1000
PBO Zylon
PBO
E‐Glass
Nylon
Kevlar
M5PAN
ISOTROPIC PITCH
Source: 1) Modified from J.G. Lavin, ‘High Performance Fibers’, Ed John Hearle, Chapter 5, Woodhead Publishing, 2001, 2) Peter Morgan, Carbon Fibers and Their Composites, Taylor &Francis 2005, 3) A.R.Bunsell, Fibre reinforcements for composite materials, Elsevier, 1987
NicalonTM SiC
RAYONAluminaMESOPHASE PITCH
Low Cost ‐Structural
Courtesy: Soydan Ozcan
Targets
Carbon Fiber Property Goal Materials

31 Managed by UT-Battellefor the U.S. Department of Energy Presentation_name
PAN Dependence on Oil Price
120
100
80
60
40
20
0
Cru
de O
il P
rice
($/B
arre
l)
Acrylic Fiber
Brent Crude Oil
Propylene
2008-2009
Current Carbon Fiber Raw Materials are Tied to Oil
AN Monomor Price VolatilitySeptember: 2150 US$ per TonDecember: 1350 US$ per TonJanuary: 800 US$ per Ton
Materials