Embed Size (px)
Citation preview
Basin 13
Lower Connecticut River Direct Drainage Assessment Report
Agency of Natural Resources . Department of Environmental Conservation
Water Quality Division
April 2002
Contents
General Description of the Basin . . . . . . . . . . . . . . . . . . . . . . . . . . . . . . . . . . . . . . . . . . . 1
Uses, Values and Features of Basin 13 Rivers and Streams . . . . . . . . . . . . . . . . . . . . . . 4
Swimming, boating, fishing . . . . . . . . . . . . . . . . . . . . . . . . . . . . . . . . . . . . . . . . . . 4
Waterfalls, cascades and other natural features ......................... 4
Significant natural communities . . . . . . . . . . . . . . . . . . . . . . . . . . . . . . . . . . . . . . . 5
Lakes with Special Significance or Features . . . . . . . . . . . . . . . . . . . . . . . . . . . . . . . . . . 6
Activities or Projects in the Basin . . . . . . . . . . . . . . . . . . . . . . . . . . . . . . . . . . . . . . . . . . . 7
Basin 13 River and Stream Assessment Summary . . . . . . . . . . . . . . . . . . . . . . . . . . . . . 8
Designated use support status . . . . . . . . . . . . . . . . . . . . . . . . . . . . . . . . . . . . . . . 8
Causes and sources of threats and impacts . . . . . . . . . . . . . . . . . . . . . . . . . . . . . 9
Basin 13 Lake and Pond Assessment Summary . . . . . . . . . . . . . . . . . . . . . . . . . . . . . . 11
Designated use support status .............. ·. . . . . . . . . . . . . . . . . . . . . . . . 11
Causes and sources of threats and impacts . . . . . . . . . . . . . . . . . . . . . . . . . . . . 12
Lakes and ponds in need of further assessment . . . . . . . . . . . . . . . . . . . . . . . . . 15
Municipal Discharges in Basin 13 . . . . . . . . . . . . . . . . . . . . . . . . . . . . . . . . . . . . . . . . . . 16
303(d) Listed Waters in Basin 13 . . . . . . . . . . . . . . . . . . . . . . . . . . . . . . . . . . . . . . . . . . 16
Basin 13 References and Resources . . . . . . . . . . . . . . . . . . . . . . . . . . . . . . . . . . . . . . . 17
Appendix A: Macroinvertebrate Sites in Basin 13 1992 -1999 . . . . . . . . . . . . . . . . . . . . 18
Appendix B: Dams of Basin 13 ............................................ 20
Appendix C: Individual Waterbody Reports fo Basin 13 Rivers and Streams . . . . . . . . 23

General Description of Basin 13
Basin 13 is one of four "basins" that are atypical basins or planning units in Vermont. Thirteen of the seventeen basins in the state are comprised of one or more major watersheds such as Basin 7, which is the Lamoille River watershed. Basin 13 and Basin 16 consist of Connecticut River mainstem segments and mostly small drainages that go directly to the Connecticut River. Basins 4 and 5 are mainly small drainages going directly to Lake Champlain.
Waterbodies 13-01 through 13-05 are segments of the Connecticut River itself from the Wilder dam in Hartford to the Massachusetts border and comprise 79.0 miles. The Connecticut River is largely a New Hampshire river although Vermont does take note of problems in the river of which it is aware. Waterbodies 13-06 through 13-17 are drainage areas with relatively small streams or brooks that go directly to the Connecticut River (versus to a river such as the West River that then flows into the Connecticut) and include 188.8 miles.
As with most basins in Vermont, the dominant land cover type is forest with almost 72% of Basin 13 either deciduous, coniferous, or mixed forest. Agricultural land accounts for a substantial portion of the landscape with just over 10% of the land area in this use. Developed land including transportation occupies 7 % %. Surface waters comprise over 6 % % of the basin area. Wetlands account for approximately 3 % % of the area. The acres and percent of the basin area for each land use or cover type are given in Table 1 below.
Table 1. Land Use/Land Cover in Basin 13
l.:.:Eaod)Ua:.:.:.:.:.:.:::.:.: .• ..:.: ......... : ....• :.: ..• :.:.:.:;:;: .. ;..: .. :,.: .... ·.·., ..... J: ........ :.; ............................. · ... :Acr.e .... : .... ......................... , .. ... .. t ....... , .. ·.· .. ::.:·.:·:.. .... : ... s .• outo.tat·: .... :::::.· .... ;:.;::::::>::. • .JForested 130,461 71.9
Agriculture 18,578 10.2
Surface Water 11,977 6.6
Developed Land 11,330 6.2
Wetlands 6,220 3.4
Transportation 2,355 1.3
Old Field & Barren 620 0.3
Total: 181,541 99.9
1
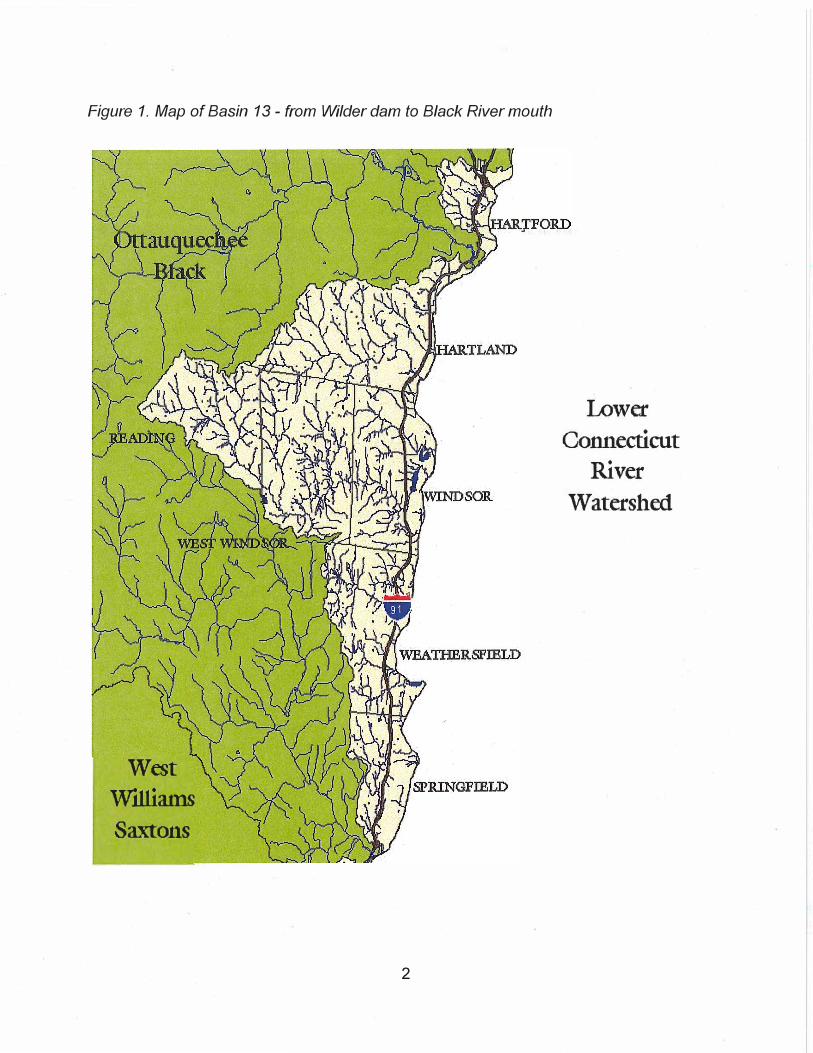
Figure 1. Map of Basin 13 - from Wilder dam to Black River mouth
West
Williams
Saxtons
2
Lower
Connecticut
River
Watershed
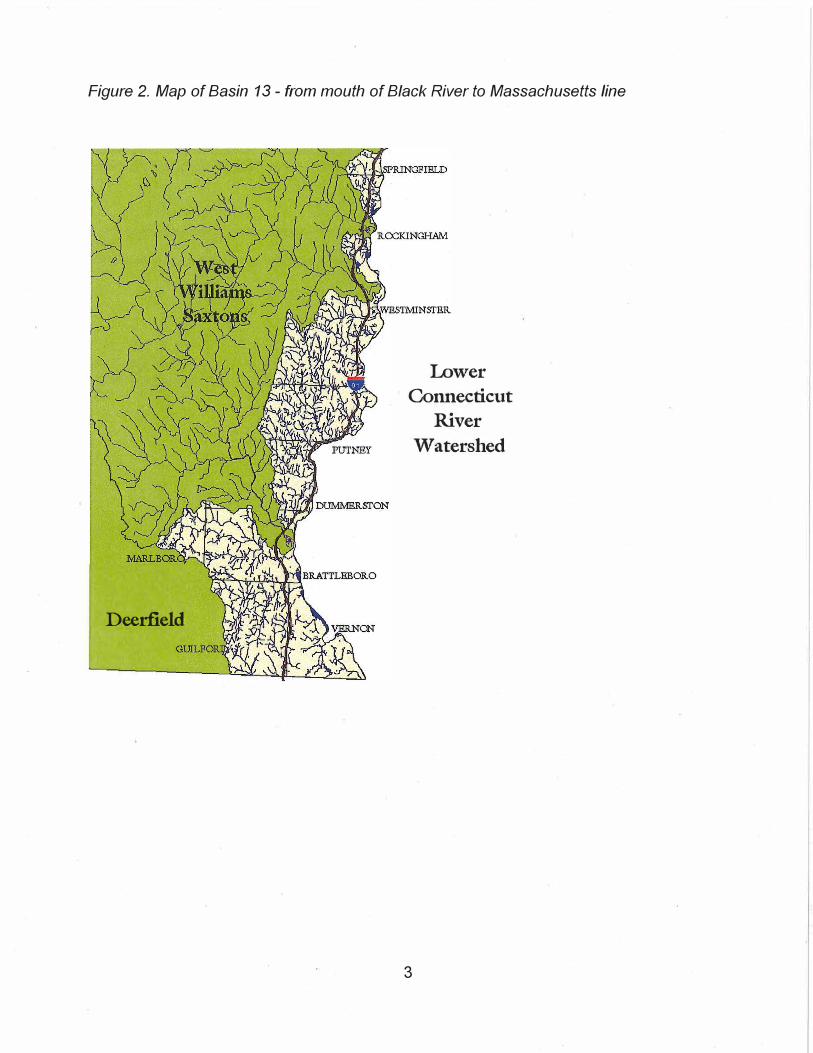
Figure 2. Map of Basin 13 - from mouth of Black River to Massachusetts line
Deerfield
Lower
Connecticut
River
Watershed
3

Uses, Values and Features of Basin 13 Rivers and Streams
Swimming
Only two sites were identified as swimming holes in the Vermont Swimming Hole Study. Sumner Falls on the Connecticut River near Hartland is a popular recreation site with a wooded shoreline, river shore ledges, rapids, falls, and a large eddy pool. People swim in the pool and smaller cascades. The area is also used for whitewater boating, fishing, and picnicking. A license has been recently issued (April 8, 2002) by FERC for the Fifteen Miles Falls hydroelectric project to PG&E National Energy Group and the company has agreed to donate the land adjacent to Sumner Falls as part of the license agreement.
The second site identified in the study is The Ledges on Broad Brook on the Guilford -Vernon border where Broad Brook Road crosses. The upper part above the road bridge is a small gorge with low cascades and deep pools. The land along this part is public. Below the bridge is a medium-sized cascade and several pools. The adjacent land is private.
Another important swimming area is the town beach on Mill Pond which is an impoundment of Mill Brook in Windsor. Concerns about the pond filling in and swimming being affected has led in part to the formation of a watershed association.
Boating
The length of the southern Connecticut River can be canoed and kayaked. Boating guides developed by both the Connecticut River Joint Commissions and the Connecticut River Watershed Council describe the different stretches and the location of portages. Sumner Falls mentioned above is a destination for whitewater boaters wanting to test themselves in the challenging rapids. Power boats also use the river. There are boat launches on both sides of the river that provide access to most reaches.
Fishing
Most of the direct tributaries to the Connecticut River in this basin support healthy populations of wild brook trout. In addition, many of these streams support wild rainbow trout in their lowermost portions up to the first barrier to fish passage upstream of the Connecticut River. These rainbow trout run up out of the Connecticut River into these streams for spawning. In addition, some of these streams support wild brown trout. A variety of non-game fish species are also present. Catchable brook trout are stocked in the following streams to support recreational fishing: Broad Brook, Sacketts Brook, Whetstone Brook, Lulls Brook.
The Connecticut River supports a popular fishery for a mix of warmwater and coldwater fish including walleye, smallmouth and largemouth bass, northern pike, rainbow and brown trout, and a variety of panfish. Fishing for the recently restored American shad is increasingly popular especially downstream of Vernon and Bellows Falls dams.
4

Waterfalls, cascades and other natural features
Only three sites were identified in the publication Watetfalls, Cascades and Gorges of
Vermont for Basin 13. One of the sites is Sumner Falls on the Connecticut River, which is mentioned above in both the swimming and boating sections. Sumner Falls is more a set of rapids than true falls (the falls are only three feet) but as noted above, it is an important boating and swimming site as well as a good fishing, picnicking, and botanizing site.
Lulls Brook Gorge is a 600 foot long, 30 - 50 foot deep, steep-sided ravine in Hartland. It has several small cascades and pools.
Bellows Falls is the third site mentioned and it has lost its aesthetic value due to hydropower development. A large dam diverts much of the Connecticut River's flow at Bellows Falls into a canal and the water goes to the hydropower station. There is a second, smaller dam, then a remnant cascade and a 300 foot long, 40 foot high gorge. The gorge is impressive when water runs through it but not so when dry according to the authors of Waterfalls, Cascades and Gorges.
Significant natural communities
Several significant natural communities have been identified in Basin 13 during community inventories conducted by the Vermont Department of Fish & Wildlife Nongame and Natural Heritage Program. During an inventory of floodplain forests in Vermont, four significant examples were found in Basin 13.
The Hartland Rivershore site consists of a Silver Maple-Ostrich Fern floodplain forest containing two uncommon species of grass. The site is small but significant because it is one of the few floodplain forests remaining on the Vermont side of the Connecticut River and because it is a mature and diverse floodplain forest.
The North Vernon Floodplain site consists of a Sugar Maple-Basswood-Ostrich Fern community of about 10 acres in size covering a narrow peninsula of land in the Connecticut River. Downstream of this sugar maple dominated floodplain is the Vernon Dam site with a Silver Maple-Ostrich Fern floodplain forest community. It is located on an outside bend of the Connecticut River just below Vernon dam and again is a narrow strip of forest.
Mill Brook Floodplain is the only significant floodplain forest named in Basin 13 that is not on the Connecticut River. It is a small Silver Maple-Ostrich Fern community occupying less than 5 acres located at the southern end of Mill Pond where Mill Brook enters.
In addition to the four floodplain forest communities mentioned above, there has been a rich fen identified in the town of Guilford. It is a very small, half-acre, fen located among rolling hills.
5

Values and Features of Basin 13 Lakes and Ponds
The Vermont Department of Environmental Conservation (DEC)'s Lake Protection Classification System is a framework within which lakes can be evaluated for their special significance when compared to other lakes statewide. The Lake Protection Classification System identifies unique lakes based on: wilderness status; occurrence of scenic and natural features; existence of very high water quality; and/or the presence of very rare, threatened, and/or endangered species. In the lower Connecticut River drainages, three ponds are significant for these reasons.
Lily Pond, Vernon: This pond supports a particularly scenic assemblage of aquatic plants, the overall appearance of which is considered extremely rare compared to other waterbodies statewide. In addition, Lily Pond supports populations of the extremely rare watermilfoil Myriophyllum verticil/atum, and the rare pondweeds Potamogeton bicupu/atus and P. confervoides.
Mill Pond, Windsor: This pond supports populations of two noteworthy aquatic plants, the threatened naiad Najas guada/upensis, and the rare P. strictifo/ius.
Lake Runnemede, Windsor: This pond supports a population of the threatened Ogden's pondweed (P. ogdenil). This particular species is considered to be globally threatened, and therefore this population is of particular importance to the maintenance of biological diversity.
6
Activities or Projects in the Basin
Connecticut River Joint Commissions work
The Connecticut River Joint Commissions consist of the New Hampshire Connecticut River Valley Resource Commission created in 1987 and the Vermont Connecticut River Watershed Advisory Commission created in 1988, which have met together since 1989. In 1993, five Local River Subcommittees comprised of representatives from the 53 New Hampshire and Vermont riverfront communities began meeting to develop the Connecticut River Corridor Management Plan. The two Local River Subcommittees that are active in Basin 13 are the Mt. Ascutney Local River Subcommittee, which includes the Vermont towns of Hartland, Windsor, Weathersfield, Springfield, and Rockingham and the Wantastiquet Region Local River Subcommittee, which includes the Vermont towns of Westminster, Putney, Dummerston, Brattleboro, and Vernon.
The Joint Commissions, the local river subcommittees, and the recipients of partnership grants have focused on numerous issues and solutions including: creation of the Connecticut River Corridor Plan; production of an erosion control fact sheet series and a riparian buffer fact sheet series; agricultural marketing; support of a Scenic Byway Council and ten waypoint communities; flow policy development; and river access identification and acquisition.
Bi-state Connecticut River Water Quality Assessment
From 1992 to 1994, a bi-state Connecticut River watershed water quality assessment was done by New Hampshire Department of Environmental Services (DES) and Vermont Department of Environmental Conservation (DEC) in response to a request by the Joint Commissions and with funding from EPA. The resulting report addressed eight questions: is the water drinkable?; can the fish be eaten?; are existing dams contributing to a water quality problem?; is the river healthy from an aquatic life point of view?; can I safely swim in the river?; can I use the water for water supply, irrigation and other purposes?; can I discharge additional treated waste to the river?; and do NH and VT contribute to the nitrogen pollution of Long Island Sound?
Mill Brook watershed studies
Several studies have been conducted in the Mill Brook watershed in recent years. The Southern Windsor County Regional Planning Commission conducted chemical and biological monitoring at 5 sites on Mill Brook in 1997 and 7 sites in 1998. In response to concerns about the Mill Pond swimming area filling in, the Regional Planning Commission conducted a two year streambank erosion inventory. They documented 55 sites on Mill Brook and 40 sites on the main tributaries to the brook. The residents who were brought together to give input to the erosion study and the residents who were first concerned about Mill Pond sedimentation decided to form the Mill Brook Watershed Association. The group meets regularly and hears reports from the RPC on its work in the watershed.
7
Designated Use Support Status for Rivers
For each river use or value that is assessed, the miles of river or stream fully supported, fully supported but threatened, partially supported, or not supported are determined. For example, river miles that are fully supported for aquatic biota have macroinvertebrate and fish communities in good to excellent health and good physical habitat. River miles that are fully supported for swimming have no known high levels of E. coli, a bacteria that is used as an indicator for pathogens. Table 2 gives the miles in each support category for seven uses or values: aquatic biota and/or habitat, contact recreation (swimming, tubing), secondary contact recreation (boating, fishing), aesthetics, drinking water supply, agricultural water supply and fish consumption. The use called "overall" reflects the miles for which one or more of the uses are not supported, partially supported, or threatened or for which all uses are fully supported. The fish consumption use is not factored into the "overall" category because all miles of river and stream are at least threatened for fish consumption due to a statewide fish consumption advisory. If taken into account in "overall," this status would mask the extent of other threats. There are 258.9 river miles assessed for this basin out of 267.8 measured miles overall.
The miles assessed include the Connecticut River mainstem. The Connecticut River is primarily a New Hampshire resource, however, the mainstem was evaluated by Vermont DEC based on the data and information available from EPA and USGS studies and reports as well as data and information from Vermont projects, facilities or activities. The information presented is not the whole picture because it does not include recent data and information from New Hampshire. The Vermont assessment will be provided to New Hampshire Department of Environmental Services.
The designated use most affected by various impacts is the aquatic biota/habitat use with 90.7 miles not fully supported. The stretches of the Connecticut River altered by the impoundments and flow fluctuations are included in this number as are portions of a few tributaries such as Mill Brook, Sacketts Brook, Whetstone Brook and Newtons Brook. Aesthetics was not fully supported for many of the miles (63.2) where aquatic habitat and biota were not supported. Secondary contact recreation, fishing, and the fishery were not fully supported for 46.5 miles. These miles are a mixture of river stretches where habitat alterations have affected game fish populations and where metals and organics are at levels in sediments or tissue so as to affect health of the fish. Swimming was documented as not fully supported only on a portion of Whetstone Brook, however, many miles (94.4) of threats exist due to activities and land use that are likely to result in the indicator E. coli
being above standard. Fish consumption is partially supported for 21.5 Connecticut River miles where fish tissue studies found relatively high levels of PCBs in the tissue. DDT and chlordane were also present in significant quantities in the fish tissue in this stretch. Fish consumption is threatened for the remainder of the basin miles due to mercury and other contaminants.
8

Table 2. Use Support Status of Basin 13 Rivers and Streams
Overall 144.4 23.8 88.2 2.5 8.9
Aquatic biota/habitat 144.4 23.8 88.2 2.5 8.9
Contact recreation 162.7 94.0 2.2 0 8.9
Secondary contact 159.9 52.5 46.5 0 8.9 recreation
Aesthetics 152.9 42.8 61.7 1.5 8.9
Drinking water supply 65.4 81.0 0 1.0 120.4
Agricultural water 11.0 82.0 0 1.0 173.8 supply
Fish consumption 0 246.3 21.5 0 0
Causes and Sources of Threats and Impacts to Basin 13 Rivers and Streams
The greatest cause of impacts to river and stream aquatic habitat in this basin is sedimentation, which affects about 81 miles. Reservoir level fluctuations and other activities that result in streambank erosion account for the sediments that affect aquatic habitat. Metals are the second greatest cause of problems in Basin 13 rivers and streams. Sediment, fish tissue, and water column sampling have found levels of various metals (chromium, copper, nickel, and zinc among others) above effects levels or standards. Flow alteration is the third greatest cause of problems to waters in this basin with the biggest impact on the Connecticut River itself. Organic enrichment and turbidity are the fourth and fifth greatest causes followed by habitat alterations, thermal modification, nutrients, and pathogens as shown in Table 3 below.
Table 3. Causes of Impacts and Threats to Basin 13 Rivers and Streams
Sedimentation 0 80.7 80.7 38.6
Metals 0 66.0 66.0 15.0
Flow alteration 37.0 27.5 64.5 0
Organic enrichment 0 47.7 47.7 10.0
9
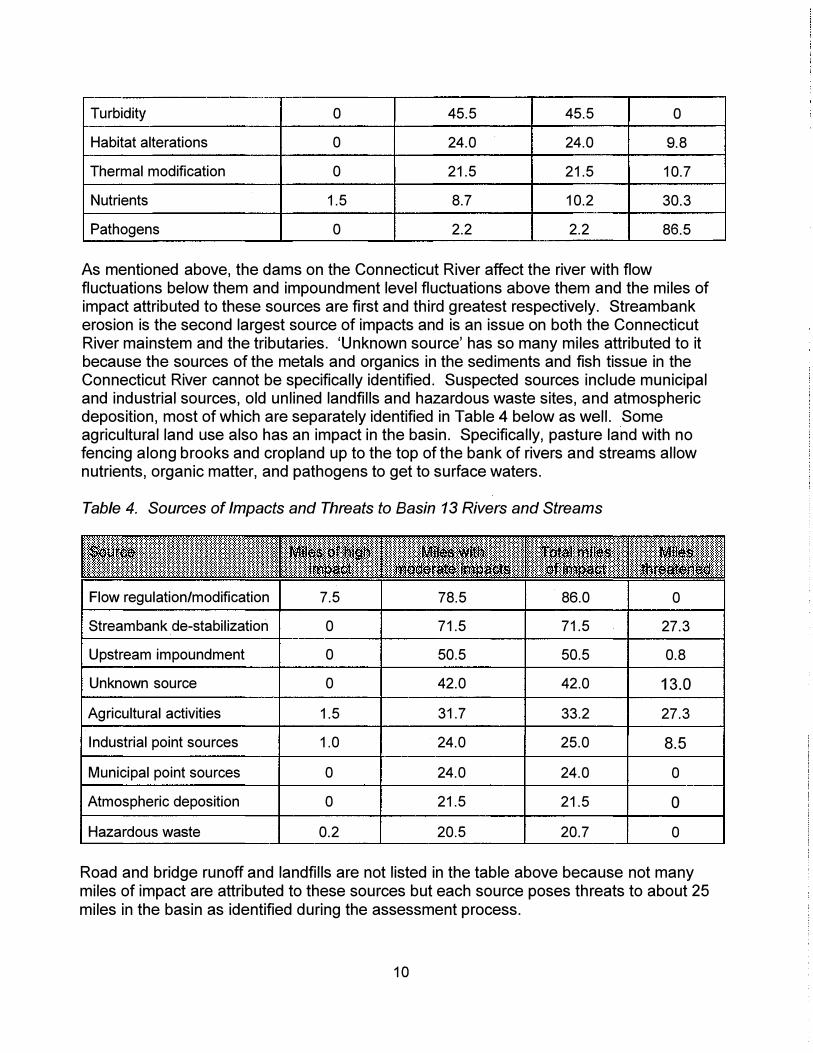
Turbidity 0 45.5 45.5 0
Habitat alterations 0 24.0 24.0 9.8
Thermal modification 0 21.5 21.5 10.7
Nutrients 1.5 8.7 10.2 30.3
Pathogens 0 2.2 2.2 86.5
As mentioned above, the dams on the Connecticut River affect the river with flow fluctuations below them and impoundment level fluctuations above them and the miles of impact attributed to these sources are first and third greatest respectively. Streambank erosion is the second largest source of impacts and is an issue on both the Connecticut River mainstem and the tributaries. 'Unknown source' has so many miles attributed to it because the sources of the metals and organics in the sediments and fish tissue in the Connecticut River cannot be specifically identified. Suspected sources include municipal and industrial sources, old unlined landfills and hazardous waste sites, and atmospheric deposition, most of which are separately identified in Table 4 below as well. Some agricultural land use also has an impact in the basin. Specifically, pasture land with no fencing along brooks and cropland up to the top of the bank of rivers and streams allow nutrients, organic matter, and pathogens to get to surface waters.
Table 4. Sources of Impacts and Threats to Basin 13 Rivers and Streams
Flow regulation/modification 7.5 78.5 86.0 0
Streambank de-stabilization 0 71.5 71.5 27.3
Upstream impoundment 0 50.5 50.5 0.8
Unknown source 0 42.0 42.0 13.0
Agricultural activities 1.5 31.7 33.2 27.3
Industrial point sources 1.0 24.0 25.0 8.5
Municipal point sources 0 24.0 24.0 0
Atmospheric deposition 0 21.5 21.5 0
Hazardous waste 0.2 20.5 20.7 0
Road and bridge runoff and landfills are not listed in the table above because not many miles of impact are attributed to these sources but each source poses threats to about 25 miles in the basin as identified during the assessment process.
10

The lower direct Connecticut River drainage area is characterized by having only 31 lakes and ponds, comprising 494 acres. Twenty of these lakes (451 acres) are tracked in Vermont DEC's Lake Assessment Database. For these 451 acres, 321 (8 lakes) are or have been monitored, and assessments are based on these data. For the remaining 130 acres (12 lakes), assessments are based on evaluation of available information.
Overall, there are 14 lake acres in this drainage area which only partially support one or more uses, and no acres where one or more uses are precluded. All designated uses are fully supported on 431 assessed lake and pond acres. Six acres (one pond) are currently unassessed for all uses. Table 5 provides an accounting of lake acres where designated uses are supported, threatened, or not fully supported.
Designated Use Support Status for Basin 13 Lakes and Ponds
Table 5. Use Support Status for Basin 13·Lakes and Ponds
Overall Uses 218 213 14 0 6
Aquatic Life Use 218 213 14 0 6
Support
Swimming Uses 220 125 14 0 92
Secondary 220 125 14 0 92 Contact Uses
Aesthetics 235 196 14 0 6
Drinking Water 82 0 0 0 369 Supply
Agricultural Water 0 0 0 0 451 Supply
Fish 374 0 0 0 77 Consumption
11

Causes and Sources of Threats and Impacts to Basin 13 Lakes and Ponds
The single lake impairment in this drainage area is caused by the presence of a 14 acre Eurasian watermilfoil infestation. Threats to uses are also caused by low pH (104 acres}, algae (77 acres), exotic species (62 acres), phosphorus (25 acres), and siltation (5 acres). Table 6 provides an accounting of the causes of impairments and threats to lakes in this drainage system.
Table 6. Causes of Impacts and Threats to Basin 13 Lakes and Ponds (in acres)
0910 Phosphorus O
1000 pH O
1100 Siltation O
2210 Noxious aquatic plants -Algae O
2600 Existing Species 14
0
0
0
0
0
0 0
0 0
0 0
0 0
0 14
25
104
5
77
62
The following sources impair or threaten lake uses in the lower direct Connecticut River drainages. Recreational boating activities impair 14 acres, and threaten an additional 62 acres, due either to infestation or potential spread of Eurasian watermilfoil. Acid precipitation (and associated natural conditions) threaten uses on 104 lake acres due to low pH, and flow regulation (specifically, the impoundment of rivers to create reservoirs) threatens uses on 102 lake acres. Table 7 provides an accounting of the sources of impairment and threats to lakes in this drainage area.
Table 7. Sources of Impacts and Threats to Basin 13 Lakes and Ponds (in acres)
7 400 Flow Regulation/Modification 0 0 0 0 102
7900 Marinas and Recreational 14 0 0 14 62 Boating
7910 In-Water releases 14 0 0 14 62
8100 Atmospheric Deposition 0 0 0 0 104
8600 Natural Source 0 0 0 0 104
8700 Recreational and Tourism 0 0 0 0 Activities (not boating)
12

A summary of overall use support by individual lake (Table 8) provides useful information about lakes in the lower direct Connecticut River drainages. The paragraphs following Table 8 found on page 14 describe impacts and major threats to specific lakes.
Table 8. Basin 13 Lakes and Ponds - Individual Assessment Summary
Beaver (Hartld) 2 200109 Evaluated 2 0 0 0
Beaver(Weafld); 49 200109 Evaluated 49 0 0 0
Hickory; 16 200109 Evaluated 16 0 0 0
Hidden 17 200109 Evaluated 0 17 0 0
Lily (Vernon) 41 200109 Monitored 0 41 0 0
Lower Hurricane 7 200109 Evaluated 7 0 0 0
Marlboro-431; 10 200109 Evaluated 10 0 0 0
Mill (Windsor) 77 200109 Monitored 0 63 8 6
Minards 46 200109 Monitored 46 0 0 0
Pleasant Valley 25 200109 Monitored 0 25 0 0
Prison; 5 200109 Evaluated 0 5 0 0
Runnemede 62 200109 Monitored 0 62 0 0
Salmon; 6 200109 Evaluated 0 0 0 0
Simonds 1 200109 Evaluated 1 0 0 0
Sweet 20 200109 Monitored 20 0 0 0
Upper Hurricane 4 200109 Evaluated 4 0 0 0
Vernon 10 200109 Evaluated 10 0 0 0 Hatchery;
Weatherhead 33 200109 Monitored 33 0 0 0 Hollow
Westminster-E; 16 200109 Evaluated 16 0 0 0
Wright 4 200109 Evaluated 4 0 0 0
* A semi-colon after the lake name indicates an unnamed pond with a name assigned by DEC fordatabase and tracking purposes
13

Hidden Pond, Marlboro: This secluded 17-acre pond is threatened by acidification due to its low acid buffering capacity.
Lily Pond, Vernon: This 41-acre pond is threatened by acidic precipitation due to its low acid buffering capacity.
Mill Pond, Windsor: This 77-acre pond is impaired by a 14-acre infestation of Eurasian watermilfoil, and is sufficiently shallow to support milfoil growth on the pond's remaining 63 acres. This was originally a wetland on the Mill Brook, which was impounded to support mill uses. The impoundment of the system, in concert with a very large upstream watershed, renders the pond vulnerable to algae growth as well.
Pleasant Valley Reservoir, Brattleboro: This 25-acre public water supply reservoir is threatened by nutrients. Other conditions that exist on this pond include low dissolved oxygen, some algal growth, and sediment release of minerals. Although these in-lake conditions can negatively influence drinking water treatment, system operators are able to treat the lake water to continually provide high quality drinking water to end users. The lake is extremely well buffered, and the majority of the watershed is fenced, with public access prohibited. Thus, the observed water quality conditions are likely the result of the original impoundment of this reservoir. This reservoir is currently the subject of a joint project between Vermont DEC and the water system operators to reduce water treatment costs by understanding and mitigating the in-lake conditions described above.
Lake Runnemede, Windsor: This 62-acre artificially impounded oxbow is threatened by potential Eurasian watermilfoil infestation, due to the proximity of the lake to the nearby milfoil-infested Mill Pond.
14
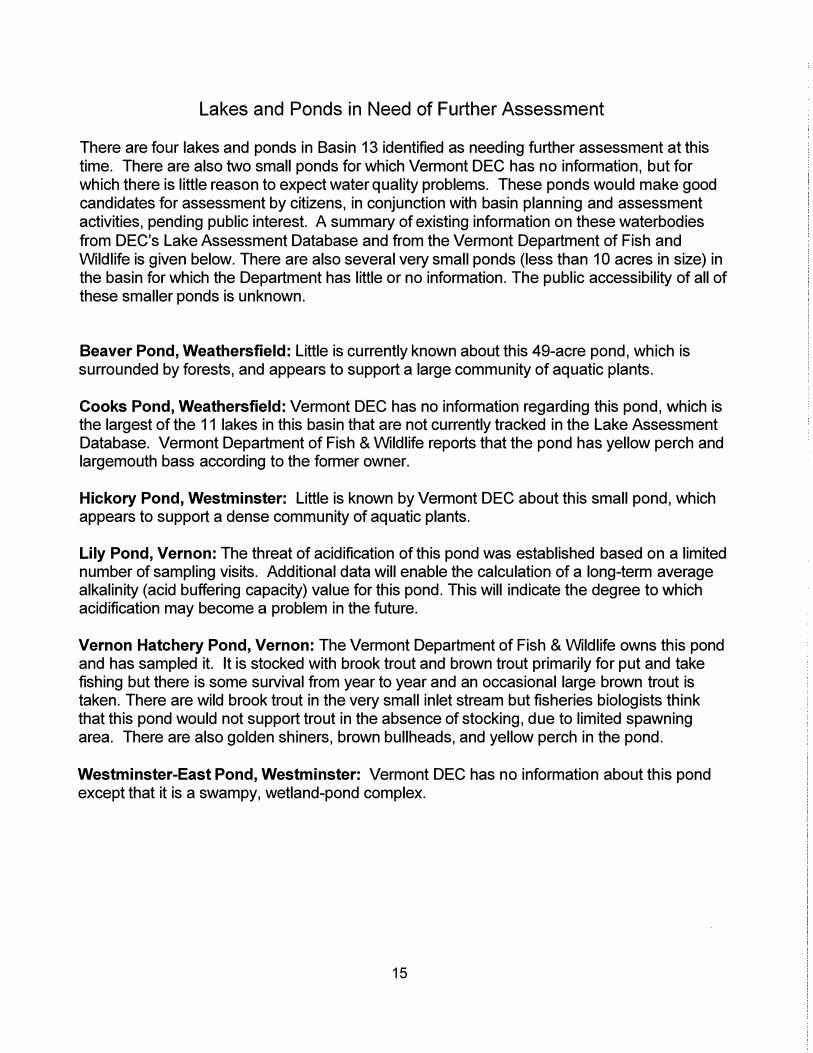
Lakes and Ponds in Need of Further Assessment
There are four lakes and ponds in Basin 13 identified as needing further assessment at this time. There are also two small ponds for which Vermont DEC has no information, but for which there is little reason to expect water quality problems. These ponds would make good candidates for assessment by citizens, in conjunction with basin planning and assessment activities, pending public interest. A summary of existing information on these waterbodies from DEC's Lake Assessment Database and from the Vermont Department of Fish and Wildlife is given below. There are also several very small ponds (less than 10 acres in size) in the basin for which the Department has little or no information. The public accessibility of all of these smaller ponds is unknown.
Beaver Pond, Weathersfield: Little is currently known about this 49-acre pond, which is surrounded by forests, and appears to support a large community of aquatic plants.
Cooks Pond, Weathersfield: Vermont DEC has no information regarding this pond, which is the largest of the 11 lakes in this basin that are not currently tracked in the Lake Assessment Database. Vermont Department of Fish & Wildlife reports that the pond has yellow perch and largemouth bass according to the former owner.
Hickory Pond, Westminster: Little is known by Vermont DEC about this small pond, which appears to support a dense community of aquatic plants.
Lily Pond, Vernon: The threat of acidification of this pond was established based on a limited number of sampling visits. Additional data will enable the calculation of a long-term average alkalinity (acid buffering capacity) value for this pond. This will indicate the degree to which acidification may become a problem in the future.
Vernon Hatchery Pond, Vernon: The Vermont Department of Fish & Wildlife owns this pond and has sampled it. It is stocked with brook trout and brown trout primarily for put and take fishing but there is some survival from year to year and an occasional large brown trout is taken. There are wild brook trout in the very small inlet stream but fisheries biologists think that this pond would not support trout in the absence of stocking, due to limited spawning area. There are also golden shiners, brown bullheads, and yellow perch in the pond.
Westminster-East Pond, Westminster: Vermont DEC has no information about this pond except that it is a swampy, wetland-pond complex.
15

Municipal Discharges in Basin 13
Six municipal wastewater treatment facilities discharge treated effluent to waters of Basin 13. Five of the six facilities discharge to the Connecticut River mainstem and onedischarges to Sacketts Brook, a tributary to the Connecticut River in Putney.
Table 9. Municipal Wastewater Treatment Facilities in Basin 13
------Hartford WRJ VT13-01 Connecticut River 1,215,000 833,000
Weston Heights VT13-01 Connecticut River 15,000 17,500
Windsor Main VT13-01 Connecticut River 1, 130,000 495,200
Bellows Falls VT13-03 Connecticut River 1,500,000 504,000
Brattleboro VT13-04 Connecticut River 3,000,000 1,658,100
Putney VT13-12 Sacketts Brook 80,000 40,100
303( d) Listed Waters in Basin 13
There are only three waterbodies in the basin that are listed on the Vermont Year 2000 List of Impaired Surface Waters. Impaired surface waters are those where chemical, physical or biological data gathered from monitoring shows a violation of one or more Vermont Water Quality Standards criteria.
Table 10. 303( d) Listed Waters in Basin 13
Water- Segment Pollutant Problem body ID
VT13-03 Connecticut River below sediments, Fair biological condition found through Bellows Falls dam nutrients biological sampling; streambank erosion
and physical habitat problems known
VT13-12 Sacketts Brook undefined Poor biological condition; periodic spills from Putney Paper
VT13-14 Whetstone Brook - pathogens, E. coli counts above standards, fairBrattleboro organics, biological condition; urban runoff, loss of
oil/grease riparian vegetation, leaking sewer lines
16

References and Resources for Basin 13 Assessment Report
1) Boating on the Connecticut River in Vermont and New Hampshire, 1999. Connecticut RiverJoint Commissions.
2) The Complete Boating Guide to the Connecticut River for New Hampshire, Vermont,Massachusetts and Connecticut, 1986. Edited by Mark C. Borton for The Connecticut RiverWatershed Council and Embassy Imprint, Inc.
3) Connecticut River Corridor Management Plan, Volumes I-VI, May 1997. Prepared by SharonF. Francis and Adair D. Mulligan for the Connecticut River Joint Commissions.
4) Connecticut River Water Quality Assessment Report, September 1994. Prepared by RichardFlanders, NH DES and Michael Kline, VT DEC for the Connecticut River Joint Commissions.
5) Mill Brook Watershed Erosion Study, February 2001. Prepared by Southern Windsor CountyRegional Planning Commission.
6) Significant Calcareous Fens and Riverside Seeps of Vermont, 1995. Elizabeth Thompsonand Robert Popp, Vermont Department of Fish and Wildlife Nongame and Natural HeritageProgram.
7) Significant Floodplain Forests of Vermont, 1998. Eric Sorenson, Marc Lapin, Brett Engstrom,and Robert Popp for the Vermont Department of Fish and Wildlife Nongame and NaturalHeritage Program.
8) Upper Connecticut River Sediment/Water Quality Analysis Project Report, October 1999.Peter M. Nolan and W. Timothy Bridges, U.S. Environmental Protection Agency, Region I, NewEngland.
9) State of Vermont Year 2000 List of Waters: Part A - List of Impaired Surface Waters, July2000. Prepared for EPA by Vermont Department of Environmental Conservation Water QualityDivision.
10) Vermont Swimming Hole Study, 1992, Jerry Jenkins, Deborah Benjamin, and Jane Dorneyfor Vermont Department of Environmental Conservation Water Quality Division.
11) Waterfalls, Cascades and Gorges of Vermont, 1985. Jerry Jenkins & Peter Zika for theVermont Department of Environmental Conservation and Department of Forests, Parks andRecreation.
12) The Whetstone Brook Citizen Water Quality Report 1996-2000. Frances Doyle, BonnyvaleEnvironmental Education Center.
13) Whitewater Rivers of Vermont, 1989. Jerry Jenkins for Vermont Department ofEnvironmental Conservation.
17

Appendix A
Macroinvertebrate Sampling Sites in Basin 13
1992 - 1999
18

Table A.1. Macroinvertebrate Sampling Sites in Basin 13 1992 - 1999.
·················•·····
····•·············
······
·········•·•··
········· ·•··
·•············································································································•···· ·
•·················
········•····················•····
··············
········· ···
·······•··················································· ···································································· · ················· · · · · · · · · · · · · · · · · · · · · · · · · · · · · · · · · · · · · · ·
VT13-01 Connecticut River 213.0 09/1992 Hartford good
VT13-02 Connecticut River 172.4 09/1992 Westminster fair
VT13-05 Connecticut River 141.2 09/1992 Vernon poor
VT13-07 Lulls Brook 3.4 10/1998 Hartland good
VT13-08 Mill Brook 11.4 10/1993 West Windsor exc
VT13-08 Mill Brook 11.4 09/1997 West Windsor exc
VT13-08 Soapstone Brk T3 0.4 10/1993 Ludlow fair
VT13-11 East Putney Brook 0.3 10/1994 Putney exc
VT13-11 East Putney Brook 0.3 10/1995 Putney exc
VT13-12 Sacketts Brook 1.0 10/1992 Putney poor
VT13-12 Sacketts Brook 1.0 10/1995 Putney poor
VT13-12 Sacketts Brook 1.0 10/1996 Putney poor
VT13-12 Sacketts Brook 1.0 08/1996 Putney poor
VT13-12 Sacketts Brook 1.0 09/1998 Putney poor
VT13-12 Sacketts Brook 1.2 10/1992 Putney fair
VT13-12 Sacketts Brook 1.2 10/1996 Putney good
VT13-12 Sacketts Brook 3.5 10/1996 Putney exc
VT13-13 Salmon Brook 0.8 10/1992 Dummerston good
VT13-14 Whetstone Brook 0.2 09/1998 Brattleboro fair
VT13-14 Whetstone Brook 2.4 09/1998 Brattleboro exc
VT13-15 Broad Brook 0.9 09/1998 Brattleboro exc
VT13-16 Newton Brook 0.6 09/1998 Vernon poor
VT13-16 Newton Brook 0.6 09/1998 Vernon poor
VT13-16 Scooter Brook 0.8 09/1998 Vernon fair
19
Appendix B
Dams of Basin 13
20

Table B.1. River Assessment Dam Summary for Basin 13
�����.�·-Upper Hurricane Kilburn Brook Reservoir (13-06)
Lower Hurricane Kilburn Brook Reservoir (13-06)
Simonds Reservoir Kilburn Brook (13-06)
Wright Reservoir Connecticut River-TR (13-06)
Sunny Acres Connecticut River-TR (13-07)
Stokien Weed Brook (13-07)
Martinsville Lulls Brook (13-07)
Rawson Lulls Brook-TR (13-07)
Bronson Lulls Brook-TR (13-07)
Prison Pond Hubbard Brook-TR (13-07)
Lake Runnemede Connecticut River-TR (13-07)
Lake Runnemede Connecticut River-Dike TR (13-07)
Windsor Upper Mill Brook ( 13-08)
Howland Mill Brook-TR (13-08)
Minards Pond Connecticut River-TR (13-10)
Hidden Lake Dike Whetstone Brook (13-14)
Mill Pond Whetstone Brook (13-14)
Pleasant Valley Whetstone Brook-Reservoir TR (13-14)
Hartford Abandoned
Hartford Abandoned
Hartford Abandoned
Hartford Abandoned
Hartland Unknown
Hartland Unknown
Hartland In Service
West In Service Windsor
West In Service Windsor
Windsor In Service
Windsor In Service
Windsor In Service
Windsor In Service
West In Service Windsor
Rocking- In Service ham
Marlboro In Service
Marlboro In Service
Brattleboro In Service
21
0
0
0
0
H
R
R
R
R
R
R
s
RO
R
s
1900 94.03
1900 94.04
1890 94.06
1930 94.05
95.04
1964 95.02
95.03
1970 239.02
1976 239.04
1925 1989 248.07
1883 1999 248.01
1883 248.08
1834 1961 248.02
1969 239.01
1900 1981 169.02
1850 122.08
1978 122.05
1909 1954 27.01
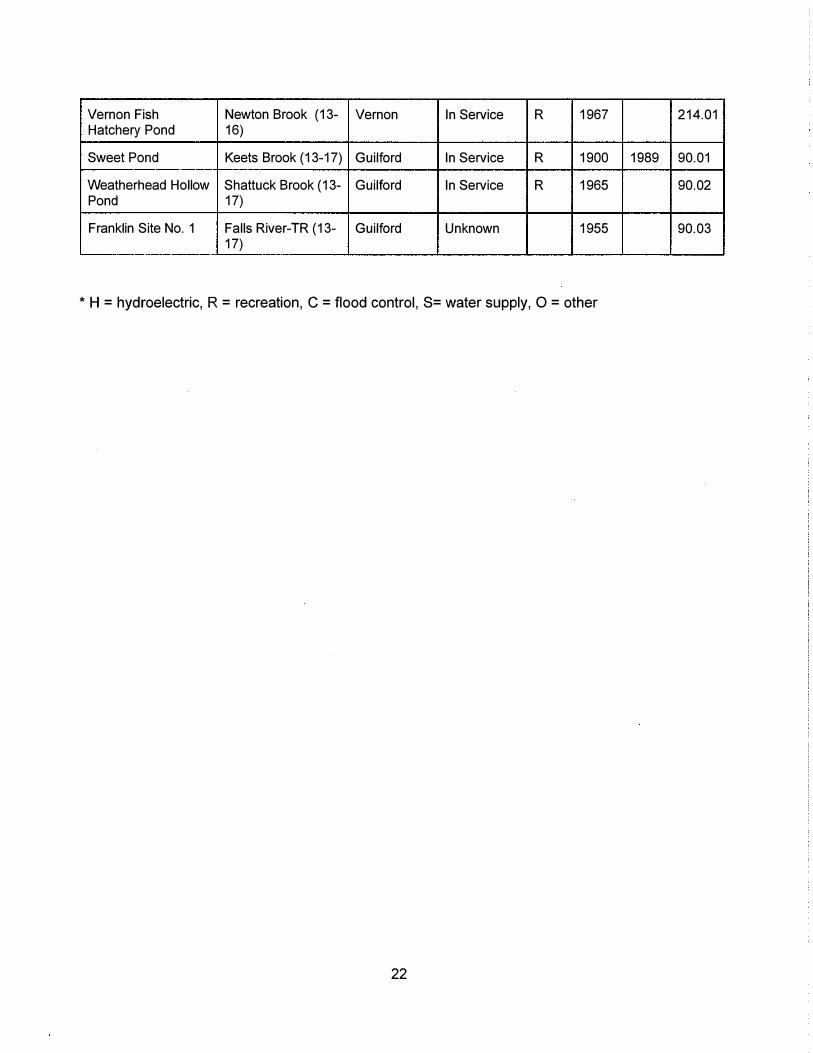
Vernon Fish Newton Brook (13- Vernon In Service R 1967 214.01 Hatchery Pond 16)
Sweet Pond Keets Brook ( 13-17) Guilford In Service R 1900 1989 90.01
Weatherhead Hollow Shattuck Brook ( 13- Guilford In Service R 1965 90.02 Pond 17)
Franklin Site No. 1 Falls River-TR (13- Guilford Unknown 1955 90.03 17)
* H = hydroelectric, R = recreation, C = flood control, S= water supply, 0 = other
22

Appendix C
Individual River Waterbody Reports
for Basin 13
23
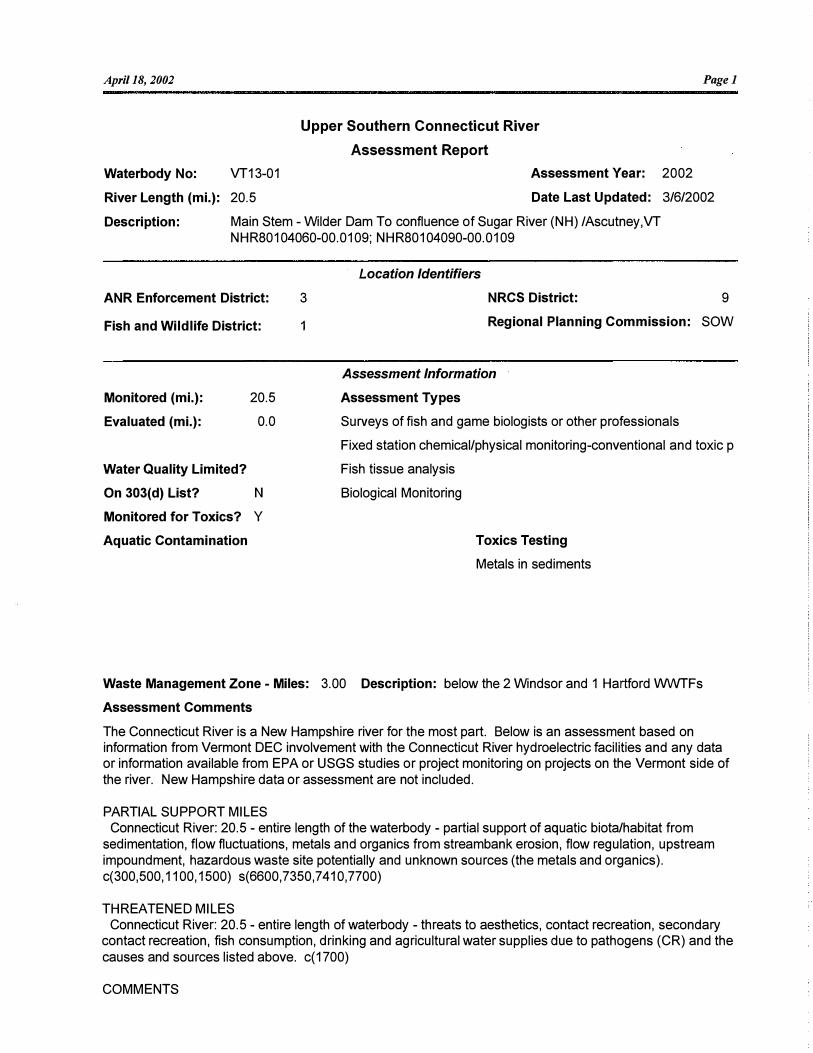
April 18, 2002 Pagel
Waterbody No: VT13-01
River Length (mi.): 20.5
Upper Southern Connecticut River
Assessment Report
Assessment Year: 2002
Date Last Updated: 3/6/2002
Description: Main Stem - Wilder Dam To confluence of Sugar River (NH) /Ascutney,VT NHR80104060-00.0109; NHR80104090-00.0109
Location Identifiers
ANR Enforcement District: NRCS District: 9
Fish and Wildlife District:
3
1 Regional Planning Commission: SOW
Monitored (mi.):
Evaluated (mi.):
20.5
0.0
Water Quality Limited?
On 303( d) List? N
Monitored for Toxics? Y
Aquatic Contamination
Assessment Information
Assessment Types
Surveys of fish and game biologists or other professionals
Fixed station chemical/physical monitoring-conventional and toxic p
Fish tissue analysis
Biological Monitoring
Toxics Testing
Metals in sediments
Waste Management Zone - Miles: 3.00 Description: below the 2 Windsor and 1 Hartford WWTFs
Assessment Comments
The Connecticut River is a New Hampshire river for the most part. Below is an assessment based on information from Vermont DEC involvement with the Connecticut River hydroelectric facilities and any data or information available from EPA or USGS studies or project monitoring on projects on the Vermont side of the river. New Hampshire data or assessment are not included.
PARTIAL SUPPORT MILES Connecticut River: 20.5 - entire length of the waterbody - partial support of aquatic biota/habitat from
sedimentation, flow fluctuations, metals and organics from streambank erosion, flow regulation, upstream impoundment, hazardous waste site potentially and unknown sources (the metals and organics). c(300,500, 1100, 1500) s(6600, 7350, 7 410, 7700)
THREATENED MILES Connecticut River: 20.5 - entire length of waterbody - threats to aesthetics, contact recreation, secondary
contact recreation, fish consumption, drinking and agricultural water supplies due to pathogens (CR) and the causes and sources listed above. c( 1700)
COMMENTS

April 18, 2002 Page2
Upper Southern Connecticut River VT13-01 Sediment and water quality sampling and analysis done by EPA in July 1998 (site UCTR06 in their study)
found 6.3 mg/liter DO, temperature at 21 C and pH of 7.1. Seven metals were sampled from the sediments at this site. Chromium, copper and nickel concentrations exceeded the low effects level threshold: chromium found at 29.5 mg/kg with LEL of 26; copper at 33.8 mg/kg with LEL of 16; and nickel at 34.8 mg/kg with LEL of 16. Chrysene (PAH) exceeded the LEL for this chemical.
A hazardous waste site is located adjacent to the Connecticut River in this stretch. It was first the site of Windsor Manufacturing and the Goodyear Tire company. There are a number of groundwater monitoring wells on the site and some plasticizers and lubricants were found above GES in several of the montoring wells. The site is still under investigation - Phase II Site Investigation - per DEC Hazardous Waste Section communications. Many organics and metals are the targets of future sampling.
U.S. Fish and Wildlife Service and New Hampshire Division of Public Health Services fish tissue sampling in West Lebanon in 1986 found that the acceptable levels of cadmium and chromium (0.1 ppm and 0.8 ppm, respectively) were exceeded in small mouth bass, yellow perch, and white perch. These values represent threats to growth and reproductive success to fish.
Wilder Dam operates in peaking mode and fluctuating flows in the river below the dam are dramatic. There is upstream and downstream fish passage in place for anadromous fish at Wilder. The license for the hydro facility at Wilder Dam expires in 2018.
Three wastewater treatment facilities have outfalls on the Connecticut River in this stretch: Windsor Main WWTF, Windsor Weston Heights WWTF, and the Hartford White River Junction (WRJ) VVWTF. The Hartford WRJ facility had six combined sewer overflows (CSOs) at one point. Three of the CSOs have been separated and the DEC Wastewater Management Division is going to have the town do an effectiveness survey on the work; one of the CSOs has been bricked up and therefore is eliminated, and two of the CSOs are under a 1272 order to be eliminated by December 2003. At the Windsor Main WWTF, a WET test is required by December 2002.
Connecticut River Watch data from 1990 at 6 locations found 4/5, 4/5, 1/5, 1/5, 1/5, 3/5 samples with high levels (100-636 organisms per 100 ml.) of E. coli. High turbidity was seen in each River Watch location on 8/8/90 - a date with high flows. 1992-93 sampling found very high E. coli numbers in the Lebanon-Sumner Falls area and below Windsor (200-10,000 org./100 ml.). 1990 and 1992 sampling years were high flow years.
The endangered dwarf wedgemussel, which historically was found throughout the reach, is now known from Hartland to Weathersfield and in a few other locations.
Earlier assessments named leaking storage tanks and a landfill but as these sources were in N.H., we have no new information. They have been removed from this record as Vermont DEC can only practically track Vermont water quality problems.
INFORMATION SOURCES Hugo Martinez Cazon, Vermont DEC Waste Management Division - information about Goodyear Tire site
(2002) Upper Connecticut River Sediment/Water Quality Analysis Project Report, October 1999. Prepared by
Peter M. Nolan and W. Timothy Bridges, U.S. Environmental Protection Agency, Region I, New England. Randy Bean, DEC Wastewater Management Division and WWMD files - information on the three WWTFS
and the CSO status at the Hartford WRJ WWTF (2002) New Hampshire Department of Environmental Services - 1992-1993 water quality sampling - findings that
. 7 of 16 samples violated their water quality standards for bacteria. Steve Fiske - Vt. DEC Ambient Biomonitoring Program - macroinvertebrate sampling in 1992 - biometrics
show a community with a "good" rating. However, the community is dominated by hydropsychid caddis flies which indicates a simplifying of the river habitat that occurs when it is modified by flow fluctuations and receives a constant source of fine particulate matter from the impoundment.
Connecticut River Watch - data from 1990 - 1993. Metals and Organics Survey of Fish from the Connecticut River in New Hampshire, 1989. U.S. Fish and
Wildlife Service and New Hampshire Division of Public Health Services.
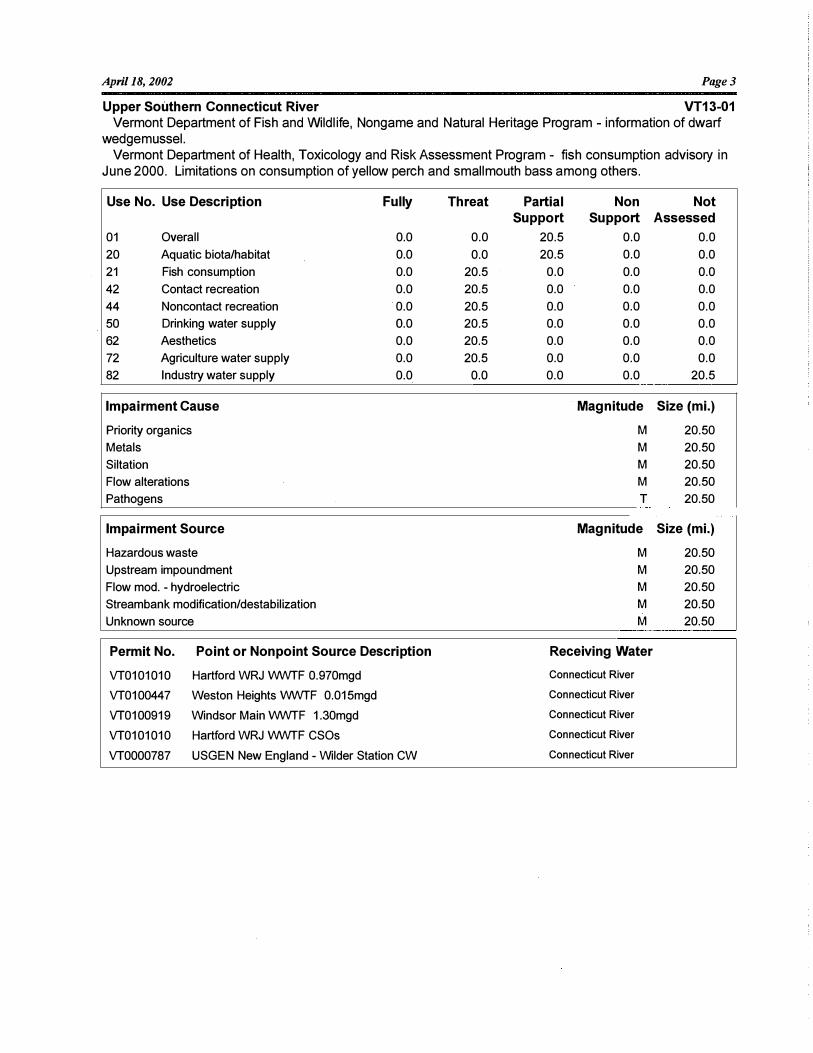
April 18, 2002 Page3
Upper Southern Connecticut River VT13-01 Vermont Department of Fish and Wildlife, Nongame and Natural Heritage Program - information of dwarf
wedgemussel. Vermont Department of Health, Toxicology and Risk Assessment Program - fish consumption advisory in
June 2000. Limitations on consumption of yellow perch and smallmouth bass among others.
Use No. Use Description
01 Overall
20 Aquatic biota/habitat
21 Fish consumption
42 Contact recreation
44 Noncontact recreation
50 Drinking water supply
62 Aesthetics
72 Agriculture water supply
82 Industry water supply
Impairment Cause
Priority organics
Metals
Siltation
Flow alterations
Pathogens
Impairment Source
Hazardous waste
Upstream impoundment
Flow mod. - hydroelectric
Streambank modification/destabilization
Unknown source
Fully
0.0
0.0
0.0
0.0
0.0
0.0
0.0
0.0
0.0
Permit No.
VT0101010
VT0100447
VT0100919
VT0101010
VT0000787
Point or Nonpoint Source Description
Hartford WRJ \fll\NTF 0.970mgd
Weston Heights \fll\NTF 0.015mgd
Windsor Main \fll\NTF 1.30mgd
Hartford WRJ \fll\NTF CSOs
USGEN New England - Wilder Station CW
Threat
0.0
0.0
20.5
20.5
20.5
20.5
20.5
20.5
0.0
Partial Non Not Support Support Assessed
20.5 0.0 0.0
20.5 0.0 0.0
0.0 0.0 0.0
0.0 0.0 0.0
0.0 0.0 0.0
0.0 0.0 0.0
0.0 0.0 0.0
0.0 0.0 0.0
0.0 0.0 20.5
Magnitude Size (mi.)
M 20.50
M 20.50
M 20.50
M 20.50
T 20.50
Magnitude Size (mi.)
M 20.50
M 20.50
M 20.50
M 20.50
M 20.50
Receiving Water
Connecticut River
Connecticut River
Connecticut River
Connecticut River
Connecticut River

March 28, 2002 Pagel
Waterbody No: VT13-02
River Length (mi.): 21.5
Upper Mid-Southern Connecticut River
Assessment Report
Assessment Year: 2002
Date Last Updated: 3/13/2002
Description: Mainstem from the confluence of Sugar River, NH/Ascutney,VT to Bellows Falls
Dam NHR80104130-00.0109
Location Identifiers
ANR Enforcement District: 2 NRCS District: 9
Fish and Wildlife District: Regional Planning Commission: SOW
Monitored (mi.):
Evaluated (mi.):
Water Quality Limited?
On 303( d) List?
Monitored for Toxics?
Aquatic Contamination
21.5
0.0
N
N
Assessment Information
Assessment Types
Occurrence of conditions judged to cause impairment
Fish tissue analysis
Water column surveys (e.g. fecal coliform)
Sediment analysis
Toxics Testing
Fish tissue contamination above FDA or NAS level
Restricted consumption for general population
No consumption for subpopulation (e.g. children ... )
Waste Management Zone - Miles: Description:
Assessment Comments
The Connecticut River is a New Hampshire river for the most part. Below is an assessment based on information from Vermont DEC involvement with the Connecticut River hydroelectric facilities and any data
or information available from EPA or USGS studies or project monitoring on projects on the Vermont side of
the river. New Hampshire data or assessment are not included.
PARTIAL SUPPORT MILES Connecticut River: 21.5 - partial support of aquatic biota/habitat, secondary contact recreation, fish
consumption and aesthetics due to siltation, organic enrichment, turbidity, temperature, reservoir pool fluctuations (habitat alterations), metals and organic compounds due to river bank erosion, Bellows Falls
dam operations and unknown sources. c(300,500, 1100, 1200, 1600,2500) s(7410, 7700,9000)
THREATENED MILES Connecticut River: 21.5 - threats to contact recreation and drinking water supply due to pathogens,
turbidity, and the presence of PAHs from the sources listed above and unknown sources.
c(300, 1700,2500) s(7 410, 7700,8800)
COMMENTS

March 28, 2002 Pagel
Upper Mid-Southern Connecticut River VT13-02
Above the Bellows Falls Dam, the water level of the reservoir fluctuates from the dam's operation. The fluctuating water level results in de-watered shorelines and wetlands and de-stabilized riverbanks. The license expires in 2018.
A Browning-Ferris landfill site is located just west of the Connecticut River in Rockingham. Ongoing monitoring of volatile organic compounds and inorganics occurs in wells that have not yet met cleanup criteria. Monitoring wells 6, 9 and 10 are downgradient of the landfill and located between Route 5 and the Connecticut River. In MW-6, benzene, arsenic, and manganese exceeded the clean-up criteria. In MW-9, tetrachloroethene, chromium, manganese, and nickel exceeded the clean-up criteria. In MW-10, tetrachloroethene exceeded the clean-up criterion. Volatile organics and semi-volatile organics were not sampled in the river. lnorganics were sampled and lead levels exceeded the EPA Ambient Water Quality Criteria (AWQC) at 3 sites and iron at one. Mercury levels are not known because of the high lab detection limit.
Sediment and water quality sampling and analysis done by EPA in July 1998 (site UCTR07 in their study) found 9.1 mg/liter DO, temperature at 26.6 C and pH of 8.2. Seven metals were sampled from the sediments at this site and none were above the low effects level (LEL) in samples from this stretch of the river. Samples for pesticides, PCBs, and PAHs were also taken. Four different compounds (PAHs) were above the LEL in the sediment in this stretch. This was the only site where more than one PAH was above the LEL.
In 1993, the United States Geological Survey (USGS) collected fish for organochlorine analysis from the Connecticut River at South Charlestown, N.H. At site C-3, the fish tissue contained 80 ug/kg of DDT, 14 ug/kg of chlordane, and 690 ug/kg of PCB. The PCB concentration exceeds the NAS/NAE recommended guideline of 500 ug/kg for protection of fish-eating wildlife.
In 1993, USGS also collected and analyzed sediment in the Connecticut River at South Charlestown, N.H. Nickel was found at 37 micrograms/gram and the probable effects level for nickel in sediment is 35.9 ppm.
A metals and organics survey of fish from the Connecticut River in New Hampshire done by the U.S. Fish and Wildlife Service and N.H. Division of Public Health Service found the acceptable level of PCBs in fish established by the National Academy of Science, was exceeded in yellow perch. The survey also found that the acceptable concentration for chromium (0.8 ppm) was exceeded in small mouth bass, yellow perch, and white perch. Sampling was done near Claremont in June and July of 1986.
INFORMATION SOURCES Vermont Dept. of Health, Toxicology and Risk Assessment Program, June 2000 - fish consumption
advisory. Upper Connecticut River Sediment/Water Quality Analysis Project Report, October 1999. Prepared by
Peter M. Nolan and W. Timothy Bridges, U.S. Environmental Protection Agency, Region I, New England. Organochlorine Compounds in Fish Tissue from the Connecticut, Housatonic, and Thames River Basins
Study Unit, 1992-1994, 1998. James F. Coles, National Water Quality Assessment Program, U.S. Geological Survey.
Inorganic and Organic Constituents and Grain-Size Distribution in Streambed Sediment and Ancillary Data for the Connecticut, Housatonic, and Thames River Basins Study Unit, 1992-1994, 1997. Sandra L. Harris, National Water Quality Assessment Program, U.S. Geological Survey.
Geographical Distribution and Potential for Adverse Biological Effects of Selected Trace Elements and Organic Compounds in Streambed Sediment in the Connecticut, Housatonic, and Thames River Basins, 1992-1994, 1997. Robert F. Breault and Sandra L. Harris, National Water Quality Assessment program, U.S. Geological Survey.
River Watch Network - Connecticut River data from 1990, 1992, and 1993 found E. coli violations af water quality standards in the samples taken in 1990 and 1992 but not in 1993. High values were found in high flow years. Compliance Inspection Report Wilder P-1892/Bellows Falls P-1855, 18 September 1992, Environmental
Resources Management, Inc. - information about causes of riverbank erosion. N.H. Department of Environmental Services - Conn. River 1989-1991 sampling data included violations of
N.H. (and Vt.) bacteria standards. Metals and Organics Survey of Fish from the Connecticut River in New Hampshire, 1989. U.S. Fish and
Wildlife Service and N.H. Division of Public Health Service.
March 28, 2002 Page3
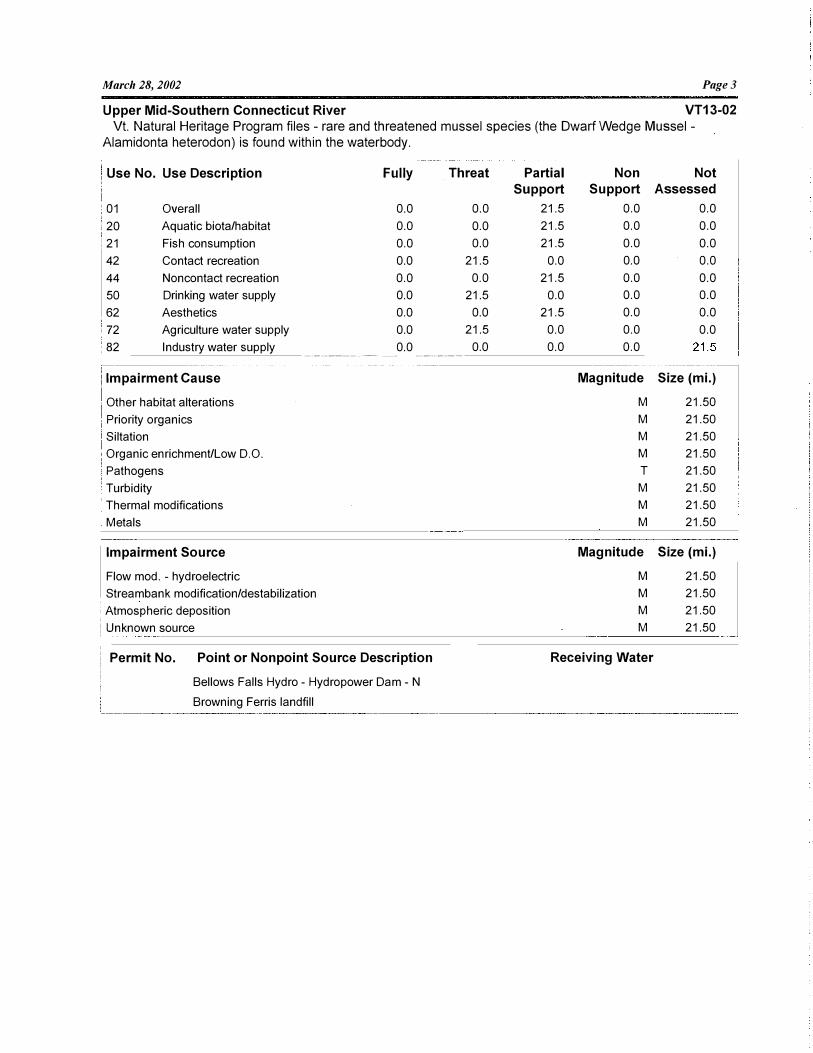
Upper Mid-Southern Connecticut River VT13-02
Vt. Natural Heritage Program files - rare and threatened mussel species (the Dwarf Wedge Mussel -Alamidonta heterodon) is found within the waterbody.
Use No. Use Description Fully Threat
01 Overall 0.0 0.0
: 20 Aquatic biota/habitat 0.0 0.0
: 21 Fish consumption 0.0 0.0
42 Contact recreation 0.0 21.5
44 Noncontact recreation 0.0 0.0
50 Drinking water supply 0.0 21.5
62 Aesthetics 0.0 0.0
72 Agriculture water supply 0.0 21.5
82 Industry water supply 0.0 0.0 --------------�--------------
Impairment Cause
Other habitat alterations
Priority organics
Siltation
Organic enrichment/Low D.O.
Pathogens
Turbidity
Thermal modifications
Metals
Impairment Source
Flow mod. - hydroelectric
Streambank modification/destabilization
Atmospheric deposition
I Unknown source
Permit No. Point or Nonpoint Source Description
Bellows Falls Hydro - Hydropower Dam - N
Browning Ferris landfill
Partial Non Not
Support Support Assessed
21.5 0.0 0.0
21.5 0.0 0.0
21.5 0.0 0.0
0.0 0.0 0.0
21.5 0.0 0.0
0.0 0.0 0.0
21.5 0.0 0.0
0.0 0.0 0.0
0.0 0.0
Magnitude Size (mi.)
M 21.50
M 21.50
M 21.50
M 21.50
T 21.50
M 21.50
M 21.50
M 21.50
Magnitude Size (mi.)
M 21.50
M 21.50
M 21.50
M 21.50
Receiving Water

April 16, 2002
Waterbody No: VT13-03
Mid-Southern Connecticut River
Assessment Report
Assessment Year: 2002
Pagel
River Length (mi.): 24 Date Last Updated: 3/13/2002
Description: Main Stem - Bellows Falls Dam to confluence of West River NHR80104172-00.0109; NHR80104176-00.2009
ANR Enforcement District:
Fish and Wildlife District:
Monitored (mi.): 24.0
Evaluated (mi.): 0.0
Water Quality Limited?
On 303( d) List? y
Monitored for Toxics? N
Aquatic Contamination
2
1
Location Identifiers
NRCS District: 8
Regional Planning Commission: WIN
Assessment Information
Assessment Types
Surveys of fish and game biologists or other professionals
Fixed station chemical/physical monitoring-conventional and toxic p
Biological Monitoring
Water column surveys (e.g. fecal coliform)
Toxics Testing
No consumption for subpopulation (e.g. children ... )
No consumption for general population
Waste Management Zone - Miles: Description:
Assessment Comments
The Connecticut River is a New Hampshire river for the most part. Below is an assessment based on information from Vermont DEC involvement with the Connecticut River hydroelectric facilities and any data or information available from EPA or USGS studies or project monitoring on projects on the Vermont side of the river. New Hampshire data or assessment are not included.
PARTIAL SUPPORT MILES: Connecticut River: 24.0 - entire length of waterbody - partial support of aquatic biota/habitat, secondary
contact recreation, and aesthetics due to sand embeddedness, turbidity, organic enrichment, metals and organics from upstream impoundment, flow fluctuations, municipal and industrial discharges, streambank erosion, and agricultural land runoff. c(300,500,1100,1200,1500,2500) s(100,200,1000,7350,7410,7700)
THREATENED MILES Connecticut River: 24.0 - entire length of waterbody - threats to contact recreation (swimming), fish
consumption, drinking and ag water supply due· to pathogens, turbidity, enrichment, and metals and organics from streambank erosion, municipal and industrial discharges, and possible landfill impact. c(300, 1100, 1200, 1700,2500) s(100,200,6300,7700)

April 16, 2002
Mid-Southern Connecticut River COMMENTS
Pagel
VT13-03
Due to peaking hydropower generation, flows at Bellows Falls fluctuate severely (1000 to 10000 cfs with no ramping for example). There is however upstream and downstream passage for anadromous fish. The license for this facility expires in 2018.
The Windham Solid Waste Management District unlined landfill (Brattleboro landfill) has been used as a landfill since 1960 and has been owned and operated by the district since 1989. A portion of the landfill was capped in 1992, another section was capped in 1994 and the rest capped in 1996. The groundwater was reclassified from Class Ill to Class IV, which allows it to remain contaminated and not have to be remediated. Monitoring occurs two times a year in May and October. The latest data seen, October 2000 sampling event, showed no VOCs in either the upstream or downstream surface water sample. Zinc was above both the maximum and average allowable concentration for the protection of aquatic organisms at both surface water sampling sites. Arsenic, cadmium, chromium, copper, lead and nickel were not detected at either site. Organic chemicals were found above standards (VGES) in some of the groundwater wells over a number of years.
Sediment and water quality sampling was done on the Connecticut River in 1998 by the U.S. Environmental Protection Agency, Region I. The water quality sample had a D.O. value of 7.5, temperature of 23.8 C, and a pH value of 7.2. Seven metals were sampled from the sediments at this site. Copper and nickel concentrations exceeded the low effects level threshold: copper at 19.9 mg/kg with LEL of 16; and nickel at 22.9 mg/kg with LEL of 16. Chrysene (PAH) also exceeded the LEL for this chemical.
Vermont DEC sampled macroinvertebrates below the Bellows Falls hydro facility (at a site below the Saxtons River mouth) in 1992 and found the macroinvertebrate community to be "fair". "The community at this point is moderately enriched with a Bl value just under 3.0. The EPT value is just in the good range as is the richness number. The habitat evaluation showed the substrate to be over 50% embedded with sand. The moderate Bl value indicated organic enrichment to be significant. The low EPT & richness metrics are probably partially due to the hydrofacility impoundment..."
INFORMATION SOURCES Bryan Harrington, Vt. DEC Waste Management Division - reports on Windham SWMD landfill listed below
(2002) Semi-Annual Water Quality Monitoring Report October 2000, February 2001. Prepared for Windham Solid
Waste Management district by Marin Environmental, Richmond, Vermont. Vermont Department of Health, Toxicology and Risk Assessment Program - fish consumption advisory in
June 2000. Limitations on consumption of yellow perch and smallmouth bass among others. Upper Connecticut River Sediment/Water Quality Analysis Project Report, October 1999. Prepared by
Peter M. Nolan and W. Timothy Bridges, U.S. Environmental Protection Agency, Region I, New England. Findings of Fact & Reclassification Order for the Windham Solid Waste District Unlined Landfill, 1992. Barry Cahoon - Vt.DEC Stream Alteration Program - noted streambank erosion and ag. land use as
impacting water quality. USGS Water Resources Data for N.H. & Vt., sampling 1983-1985 - noted fecal coliform standard of
200/100ml frequently exceeded (esp. during spring and fall periods). Elevated turbidity during spring. Steve Fiske, Vermont DEC Ambient Biomonitoring Network - macroinvertebrate sampling data
Use No. Use Description Fully Threat Partial Non Not Support Support Assessed
01 Overall 0.0 0.0 24.0 0.0 0.0
20 Aquatic biota/habitat 0.0 0.0 24.0 0.0 0.0
21 Fish consumption 0.0 24.0 0.0 0.0 0.0
42 Contact recreation 0.0 24.0 0.0 0.0 0.0
44 Noncontact recreation 0.0 0.0 24.0 0.0 0.0
50 Drinking water supply 0.0 24.0 0.0 0.0 0.0
62 Aesthetics 0.0 0.0 24.0 0.0 0.0
72 Agriculture water supply 0.0 24.0 0.0 0.0 0.0
82 Industry water supply 0.0 0.0 0.0 0.0 24.0

April 16, 2002
Mid-Southern Connecticut River
Impairment Cause
Priority organics
Siltation
Organic enrichment/Low D.O.
Pathogens
Turbidity
Metals
Flow alterations
Impairment Source
Industrial point sources
Municipal point sources
Agriculture
Landfills
Upstream impoundment
Flow mod. - hydroelectric
Streambank modification/destabilization
Permit No. Point or Nonpoint Source Description
VT0000108 Putney Paper - treated paper mill wastes
VT0100013 Bellows Falls WWTF 1.5mgd
Windham SWMD landfill
Magnitude
M
M
M
T
M
M
H
Magnitude
M
M
M
T
M
M
M
Receiving Water
Connecticut River
Connecticut River
Connecticut River
Page3
VT13-03
Size (mi.)
24.00
24.00
24.00
24.00
24.00
24.00
24.00
Size (mi.)
24.00
24.00
24.00
24.00
24.00
24.00
24.00
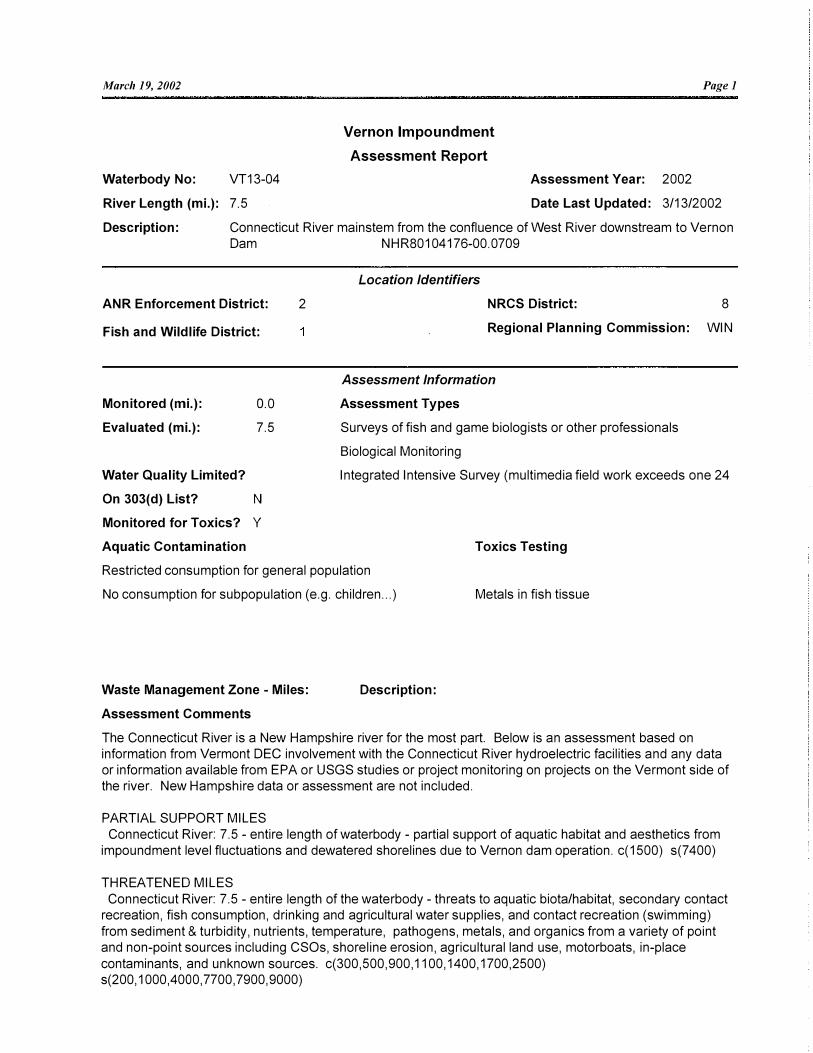
March 19, 2002 Pagel
Waterbody No: VT13-04
River Length (mi.): 7.5
Vernon lmpoundment
Assessment Report
Assessment Year: 2002
Date Last Updated: 3/13/2002
Description: Connecticut River mainstem from the confluence of West River downstream to Vernon Dam NHR80104176-00.0709
Location Identifiers
ANR Enforcement District: 2 NRCS District: 8
Fish and Wildlife District: Regional Planning Commission: WIN
Monitored (mi.): 0.0
Evaluated (mi.): 7.5
Water Quality Limited?
On 303(d) List? N
Monitored for Toxics? Y
Aquatic Contamination
Assessment Information
Assessment Types
Surveys of fish and game biologists or other professionals
Biological Monitoring
Integrated Intensive Survey (multimedia field work exceeds one 24
Toxics Testing
Restricted consumption for general population
No consumption for subpopulation (e.g. children ... ) Metals in fish tissue
Waste Management Zone - Miles: Description:
Assessment Comments
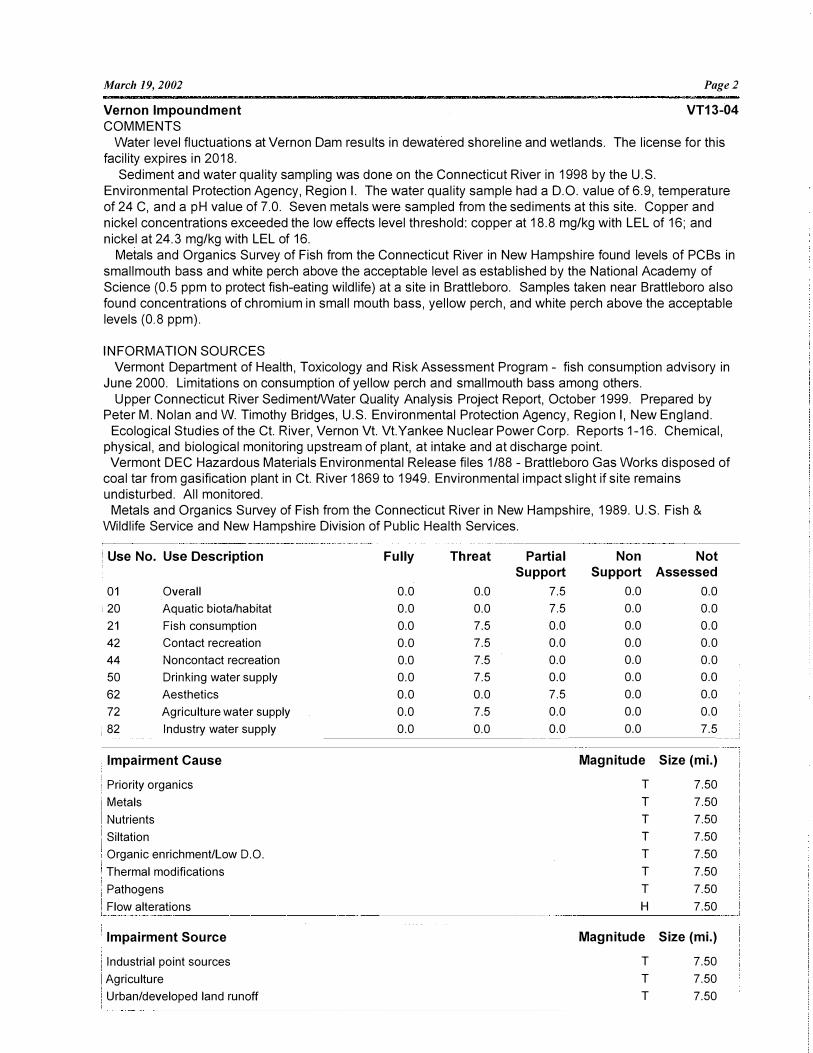
The Connecticut River is a New Hampshire river for the most part. Below is an assessment based on information from Vermont DEC involvement with the Connecticut River hydroelectric facilities and any data or information available from EPA or USGS studies or project monitoring on projects on the Vermont side of the river. New Hampshire data or assessment are not included.
PARTIAL SUPPORT MILES Connecticut River: 7.5 - entire length of waterbody - partial support of aquatic habitat and aesthetics from
impoundment level fluctuations and dewatered shorelines due to Vernon dam operation. c(1500) s(7 400)
THREATENED MILES
Connecticut River: 7.5 - entire length of the waterbody - threats to aquatic biota/habitat, secondary contact recreation, fish consumption, drinking and agricultural water supplies, and contact recreation (swimming)
from sediment & turbidity, nutrients, temperature, pathogens, metals, and organics from a variety of point and non-point sources including CSOs, shoreline erosion, agricultural land use, motorboats, in-place
contaminants, and unknown sources. c(300,500,900, 1100, 1400, 1700,2500) s(200, 1000,4000, 7700, 7900,9000)
March 19, 2002
Vernon lmpoundment
COMMENTS
Pagel
VT13-04
Water level fluctuations at Vernon Dam results in dewatered shoreline and wetlands. The license for this facility expires in 2018.
Sediment and water quality sampling was done on the Connecticut River in 1998 by the U.S.
Environmental Protection Agency, Region I. The water quality sample had a D.O. value of 6.9, temperature of 24 C, and a pH value of 7.0. Seven metals were sampled from the sediments at this site. Copper and
nickel concentrations exceeded the low effects level threshold: copper at 18.8 mg/kg with LEL of 16; and nickel at 24.3 mg/kg with LEL of 16.
Metals and Organics Survey of Fish from the Connecticut River in New Hampshire found levels of PCBs in
smallmouth bass and white perch above the acceptable level as established by the National Academy of Science (0.5 ppm to protect fish-eating wildlife) at a site in Brattleboro. Samples taken near Brattleboro also found concentrations of chromium in small mouth bass, yellow perch, and white perch above the acceptable levels (0.8 ppm).
INFORMATION SOURCES Vermont Department of Health, Toxicology and Risk Assessment Program - fish consumption advisory in
June 2000. Limitations on consumption of yellow perch and smallmouth bass among others.
Upper Connecticut River Sediment/Water Quality Analysis Project Report, October 1999. Prepared by Peter M. Nolan and W. Timothy Bridges, U.S. Environmental Protection Agency, Region I, New England.
Ecological Studies of the Ct. River, Vernon Vt. Vt.Yankee Nuclear Power Corp. Reports 1-16. Chemical, physical, and biological monitoring upstream of plant, at intake and at discharge point.
Vermont DEC Hazardous Materials Environmental Release files 1/88 - Brattleboro Gas Works disposed of coal tar from gasification plant in Ct. River 1869 to 1949. Environmental impact slight if site remains undisturbed. All monitored.
Metals and Organics Survey of Fish from the Connecticut River in New Hampshire, 1989. U.S. Fish & Wildlife Service and New Hampshire Division of Public Health Services.
Use No. Use Description Fully Threat Partial Non Not
Support Support Assessed
01 Overall 0.0 0.0 7.5 0.0 0.0
i 20 Aquatic biota/habitat 0.0 0.0 7.5 0.0 0.0
21 Fish consumption 0.0 7.5 0.0 0.0 0.0
42 Contact recreation 0.0 7.5 0.0 0.0 0.0
44 Noncontact recreation 0.0 7.5 0.0 0.0 0.0
50 Drinking water supply 0.0 7.5 0.0 0.0 0.0
62 Aesthetics 0.0 0.0 7.5 0.0 0.0
72 Agriculture water supply 0.0 7.5 0.0 0.0 0.0
I 82 Industry water supply 0.0 0.0 0.0 0.0 7.5
Impairment Cause Magnitude Size (mi.)
Priority organics T 7.50
Metals T 7.50
Nutrients T 7.50
Siltation T 7.50
Organic enrichment/Low D.O. T 7.50
Thermal modifications T 7.50
Pathogens T 7.50
Flow alterations H 7.50
Impairment Source Magnitude Size (mi.)
Industrial point sources T 7.50
Agriculture T 7.50
Urban/developed land runoff T 7.50
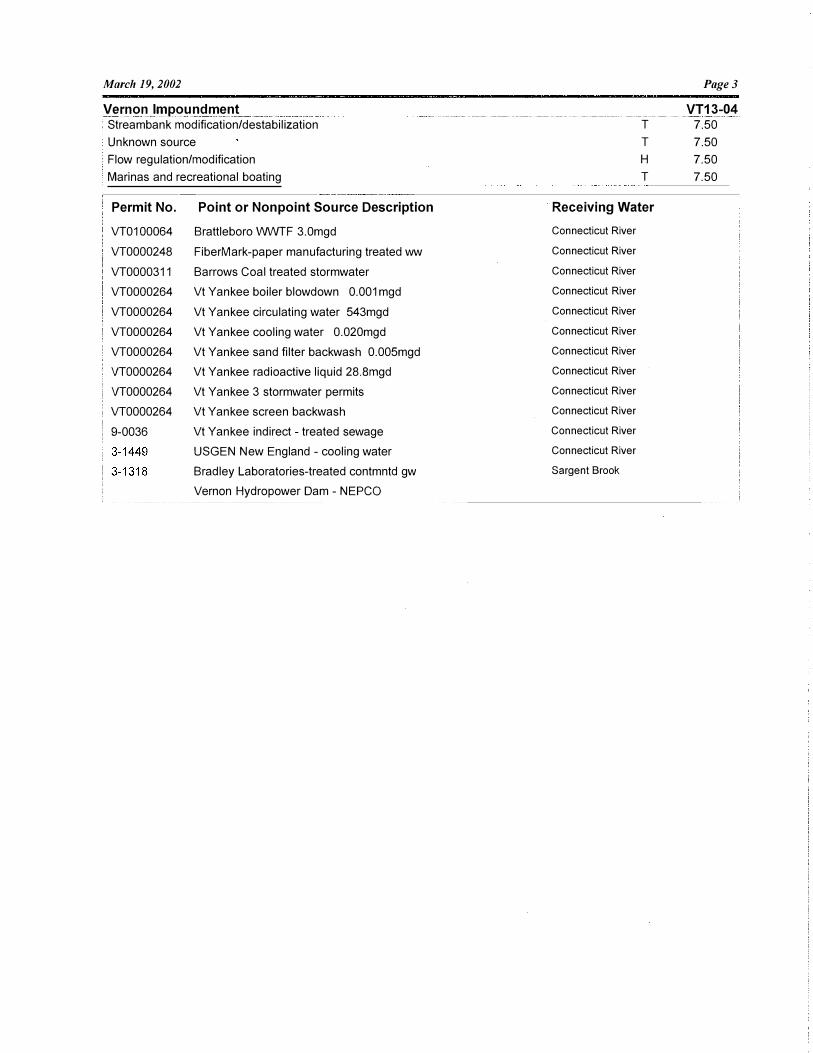
March 19, 2002
Y�mol! lf!lpqu_ng_me_nt Streambank modification/destabilization
Unknown source
Flow regulation/modification
Marinas and recreational boating
Permit No. Point or Nonpoint Source Description
VT0100064 Brattleboro WNTF 3.0mgd
VT0000248 FiberMark-paper manufacturing treated ww
VT0000311 Barrows Coal treated stormwater
VT0000264 Vt Yankee boiler blowdown 0.001 mgd
VT0000264 Vt Yankee circulating water 543mgd
VT0000264 Vt Yankee cooling water 0.020mgd
VT0000264 Vt Yankee sand filter backwash 0.005mgd
VT0000264 Vt Yankee radioactive liquid 28.Smgd
VT0000264 Vt Yankee 3 stormwater permits
VT0000264 Vt Yankee screen backwash
9-0036 Vt Yankee indirect - treated sewage
USGEN New England - cooling water
Bradley Laboratories-treated contmntd gw
Vernon Hydropower Dam - NEPCO
T
T
H
T
Receiving Water
Connecticut River
Connecticut River
Connecticut River
Connecticut River
Connecticut River
Connecticut River
Connecticut River
Connecticut River
Connecticut River
Connecticut River
Connecticut River
Connecticut River
Sargent Brook
Page3
VT13-04 7.50
7.50
7.50
7.50

April 16, 2002
Waterbody No: VT13-05
River Length (mi.): 5.5
Lower Connecticut River
Assessment Report
Pagel
Assessment Year: 2002
Date Last Updated: 3/13/2002
Description: Connecticut River mainstem from the Vernon Dam downstream to the Massachusetts
border NHR80104176-00.0109; NHR80201070-00.0109
ANR Enforcement District:
Fish and Wildlife District:
Monitored (mi.):
Evaluated (mi.):
0.0
5.5
Water Quality Limited? Y
On 303( d) List? N
Monitored for Toxics? Y
Aquatic Contamination
2
1
Location Identifiers
NRCS District: 8
Regional Planning Commission: WIN
Assessment Information
Assessment Types
Surveys of fish and game biologists or other professionals
Chemical/physical monitoring
Fixed station chemical/physical monitoring-conventional and toxic p
Fish tissue analysis
Biological Monitoring
Toxics Testing
Restricted consumption for general population
No consumption for subpopulation (e.g. children ... ) Metals in fish tissue
Waste Management Zone - Miles: Description:
Assessment Comments
The Connecticut River is a New Hampshire river for the most part. Below is an assessment based on information from Vermont DEC involvement with the Connecticut River hydroelectric facilities and any data or information available from EPA or USGS studies or project monitoring on projects on the Vermont side of the river. New Hampshire data or assessment are not included.
PARTIAL SUPPORT MILES Connecticut River: 5.5 - entire length of the waterbody - partial support of aquatic biota/habitat and
aesthetics due to flow fluctuations from hydropower flow regulation and due to nutrient enrichment from bank erosion, ag land runoff. c(900,1500) s(1000,7410,7700)
THREATENED MILES Connecticut River: 5.5 - entire length of the waterbody - threats to aquatic biota, contact and secondary
contact recreation, drinking and agricultural water supplies due to metals and PCBs from unknown sources. c(300,500, 1700) s(9000)
COMMENTS There are fluctuating flows below Vernon Dam due to peaking hydropower production. There is upstream

April 16, 2002 Page2
Lower Connecticut River VT13-05 and downstream passage for anadromous fish at Vernon. The license expires in 2018. The operation of Turners Falls in Massachusetts also affects this stretch of the river in Vermont.
A metals and organics survey of fish from the Connecticut River in New Hampshire found that "the acceptable level for PCBs in fish, established by the National Academy of Science (0.5 ppm to protect fisheating wildlife), was exceeded in several species sampled ... below the Ashuelot River." Samples of white perch, small mouth bass, and pickerel also had concentrations of chromium above acceptable levels (0.8 ppm)
INFORMATION SOURCES Vermont Department of Health, June 2000 - fish consumption advisory in June 2000. Limitations on
consumption of yellow perch and smallmouth bass among others. Connecticut River Corridor Management Plan, Volume VI, Wantastiquet Region, May 1997 - description of
known and potential water quality problems and recommendations for action on numerous river topics Ecological Studies of the Connecticut River, Vernon Vt. VermontYankee Nuclear Power Corp. Report 1-
28 - contains chemical, physical and biological monitoring data below hydro facility. Metals and Organics Survey of Fish from the Connecticut River in New Hampshire, 1989. U.S. Fish &
Wildlife Service and New Hampshire Division of Public Health Services. Fish tissue sample results (see above).
Al Confalone, Soil Conservation Service - noted road construction along Route 142 without erosion control. (1996)
Steve Fiske - Vt. DEC Ambient Biomonitoring Program - community assessment of "poor" at a site below the Vernon dam in 1992. "The sample collected here is not completely representative of the river ... the Connecticut River is moderately enriched at this point.."
Use No. Use Description Fully Threat Partial Non Not Support Support Assessed
01 Overall 0.0 0.0 5.5 0.0 0.0
20 Aquatic biota/habitat 0.0 0.0 5.5 0.0 0.0
21 Fish consumption 0.0 5.5 0.0 0.0 0.0
42 Contact recreation 0.0 5.5 0.0 0.0 0.0
44 Noncontact recreation 0.0 5.5 0.0 0.0 0.0
50 Drinking water supply 0.0 5.5 0.0 0.0 0.0
62 Aesthetics 0.0 0.0 5.5 0.0 0.0
72 Agriculture water supply 0.0 5.5 0.0 0.0 0.0
82 Industry water supply 0.0 0.0 0.0 0.0 5.5
Impairment Cause Magnitude Size (mi.)
Priority organics T 5.50
Metals T 5.50
Siltation M 5.50
Flow alterations H 5.50
Nutrients M 5.50
Impairment Source Magnitude Size (mi.)
Agriculture s 5.50
Land development M 5.50
Upstream impoundment M 3.50
Flow mod. - hydroelectric M 5.50
Streambank modification/destabilization M 5.50
Unknown source T 5.50
April 16, 2002
Lower Connecticut River
Permit No. Point or Nonpoint Source Description
9-0273 Vernon Green Nursing Home-treated sewage
Receiving Water
Connecticut River
Page3
VT13-05
March 18, 2002 Pagel
Waterbody No: VT13-06
River Length (mi.): 7.5
Hartford Direct Drainage
Assessment Report
Assessment Year: 2002
Date Last Updated: 3/13/2002
Description: Small tributaries directly to the Connecticut River mainstem (13-01) from the Town of
Hartford including Kilburn Brook
Location Identifiers
ANR Enforcement District: NRCS District: 9
Fish and Wildlife District:
3
4 Regional Planning Commission: TWO
Monitored (mi.):
Evaluated (mi.):
1.0
6.5
Water Quality Limited?
On 303( d) List? N
Monitored for Toxics? Y
Aquatic Contamination
None detected
Waste Management Zone - Miles:
Assessment Comments
THREATENED MILES
Assessment Information
Assessment Types
Surveys of fish and game biologists or other professionals
Non-fixed station chemical/physical monitoring-conventional and tox
Description:
Toxics Testing
Metals in discharges
Unnamed tributary: 1.0 - from landfill site west of 1-91 to mouth at Connecticut River - threats to aquatic
biota/habitat, drinking water supply, agricultural water supply due to arsenic and mercury exceeding
standard instream. Mercury, benzene and 1,2-Dichloroethane above standards in seep adjacent to stream
also. c(300,500) s(6300)
COMMENTS
The closed Hartford town landfill as well as Phase I of a construction and demolition waste landfill are
adjacent to an unnamed stream in Hartford. Phase I was closed in 1998 and Phase II was never built.
Ongoing sampling has occurred since 1980. The latest report on sampling results (October 2000) found
that arsenic exceeds surface water standards in the sample taken from surface water sample 1 and Seep
#2. Mercury exceeds the standard in surface water sample 1 (SW-1) as well in October 2000 sampling.
Benzene exceeds the standard for water & organisms in Seep 1 and 1,2-dichloroethane exceeds the
standard for water & organisms in Seep 1 and Seep 2 at that same time. Arsenic has exceeded the
standards in most samples since 1994. 1,2 dichloroethane has also exceeded the standard frequently in
Seep 2 back to 1994.
Kilburn Brook was visted in May 1999 and no problems were noted in the stream. The water was clear,
March 18, 2002 Page2
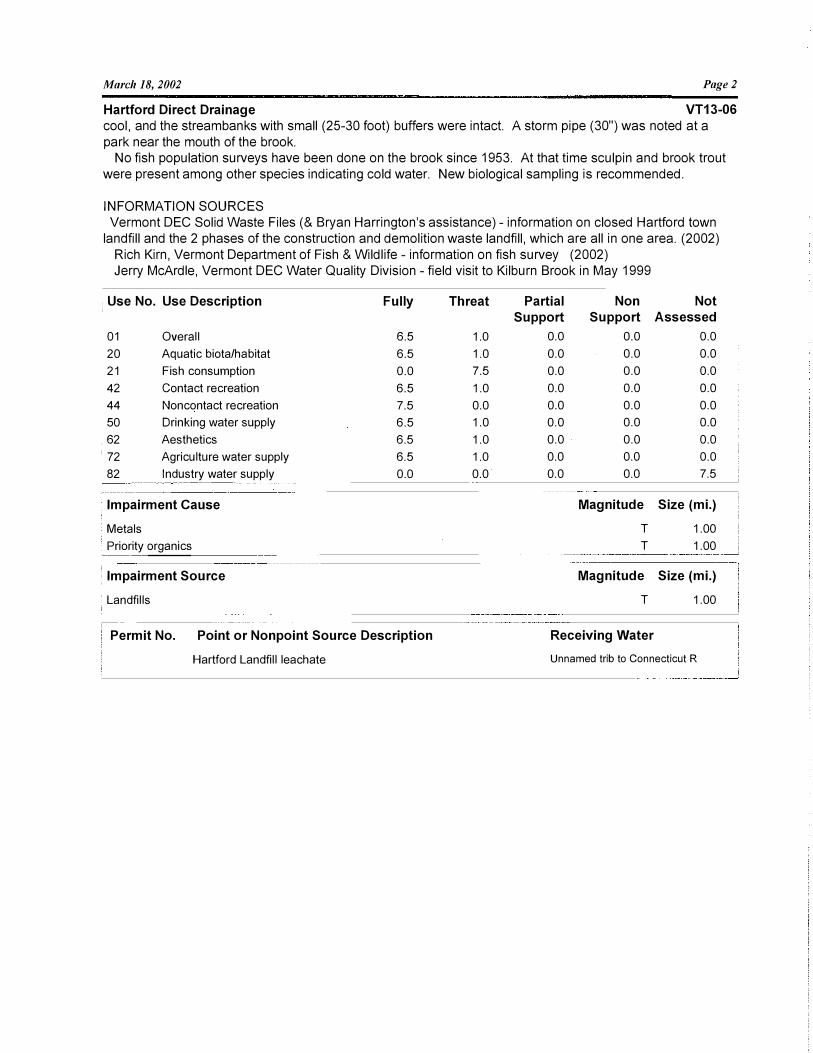
Hartford Direct Drainage VT13-06 cool, and the streambanks with small (25-30 foot) buffers were intact. A storm pipe (30") was noted at a
park near the mouth of the brook. No fish population surveys have been done on the brook since 1953. At that time sculpin and brook trout
were present among other species indicating cold water. New biological sampling is recommended.
INFORMATION SOURCES
Vermont DEC Solid Waste Files ( & Bryan Harrington's assistance) - information on closed Hartford town
landfill and the 2 phases of the construction and demolition waste landfill, which are all in one area. (2002)
Rich Kirn, Vermont Department of Fish & Wildlife - information on fish survey (2002)
Jerry McArdle, Vermont DEC Water Quality Division - field visit to Kilburn Brook in May 1999
: Use No. Use Description
01
20
21
42
44
50
. 62
I 72
82
Overall
Aquatic biota/habitat
Fish consumption
Contact recreation
Noncontact recreation
Drinking water supply
Aesthetics
Agriculture water supply
Industry water supply ----·---- -- --·---�---
Impairment Cause
Metals
Priority organics
; Impairment Source
: Landfills
!�-
Fully
6.5
6.5
0.0
6.5
7.5
6.5
6.5
6.5
0.0
Permit No. Point or Nonpoint Source Description
Hartford Landfill leachate
Threat
1.0
1.0
7.5
1.0
0.0
1.0
1.0
1.0
0.0
Partial Support
0.0
0.0
0.0
0.0
0.0
0.0
0.0
0.0
0.0
Non Not Support Assessed
0.0 0.0
0.0 0.0
0.0 0.0
0.0 0.0
0.0 0.0
0.0 0.0
0.0 0.0
0.0 0.0
0.0 7.5
Magnitude Size (mi.)
T
T
1.00
1.00
Magnitude Size (mi.)
T 1.00
Receiving Water
Unnamed trib to Connecticut R
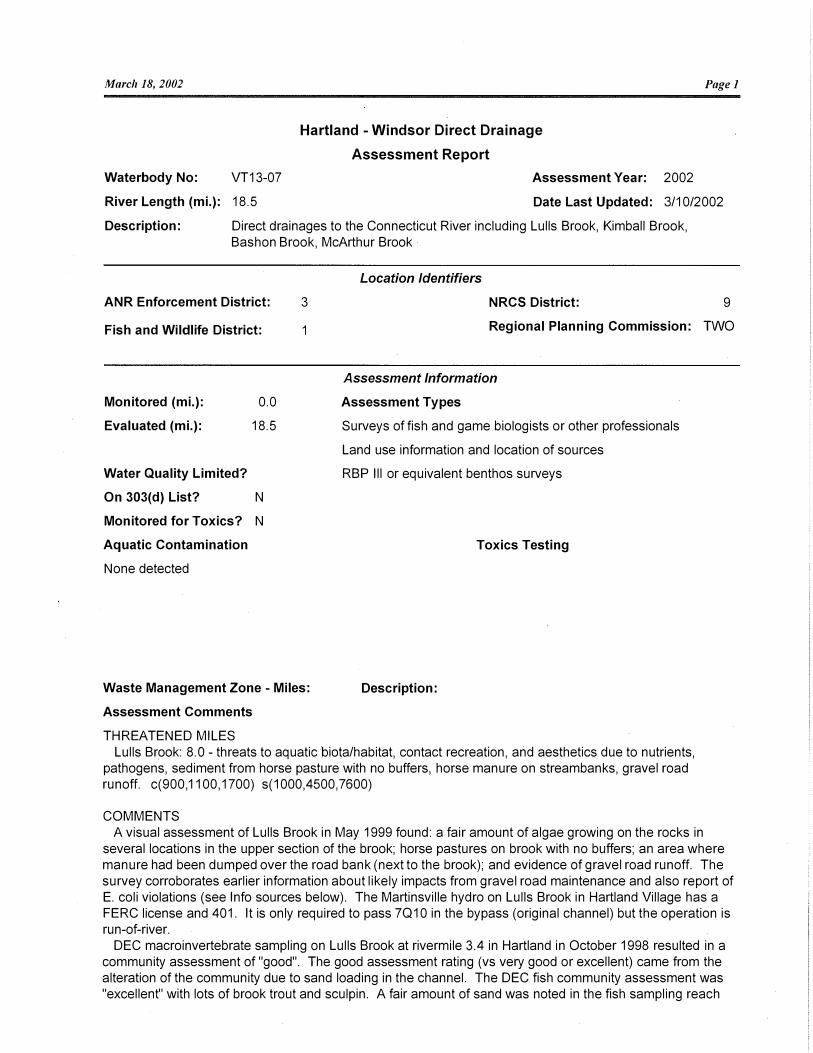
March 18, 2002 Pagel
Waterbody No: VT13-07
River Length (mi.): 18.5
Hartland - Windsor Direct Drainage
Assessment Report
Assessment Year: 2002
Date Last Updated: 3/10/2002
Description: Direct drainages to the Connecticut River including Lulls Brook, Kimball Brook, Bashon Brook, McArthur Brook
Location Identifiers
ANR Enforcement District: 3 NRCS District: 9
Fish and Wildlife District: Regional Planning Commission: TWO
Monitored (mi.):
Evaluated (mi.):
0.0
18.5
Water Quality Limited?
On 303( d) List? N
Monitored for Toxics? N
Aquatic Contamination
None detected
Waste Management Zone - Miles:
Assessment Comments
THREATENED MILES
Assessment Information
Assessment Types
Surveys of fish and game biologists or other professionals
Land use information and location of sources
RBP Ill or equivalent benthos surveys
Toxics Testing
Description:
Lulls Brook: 8.0 - threats to aquatic biota/habitat, contact recreation, and aesthetics due to nutrients, pathogens, sediment from horse pasture with no buffers, horse manure on streambanks, gravel road runoff. c(900, 1100, 1700) s(1000,4500, 7600)
COMMENTS A visual assessment of Lulls Brook in May 1999 found: a fair amount of algae growing on the rocks in
several locations in the upper section of the brook; horse pastures on brook with no buffers; an area where manure had been dumped over the road bank (next to the brook); and evidence of gravel road runoff. The survey corroborates earlier information about likely impacts from gravel road maintenance and also report of E. coli violations (see Info sources below). The Martinsville hydro on Lulls Brook in Hartland Village has aFERC license and 401. It is only required to pass 7010 in the bypass (original channel) but the operation isrun-of-river.
DEC macroinvertebrate sampling on Lulls Brook at rivermile 3.4 in Hartland in October 1998 resulted in a community assessment of "good". The good assessment rating (vs very good or excellent) came from the alteration of the community due to sand loading in the channel. The DEC fish community assessment was "excellent" with lots of brook trout and sculpin. A fair amount of sand was noted in the fish sampling reach
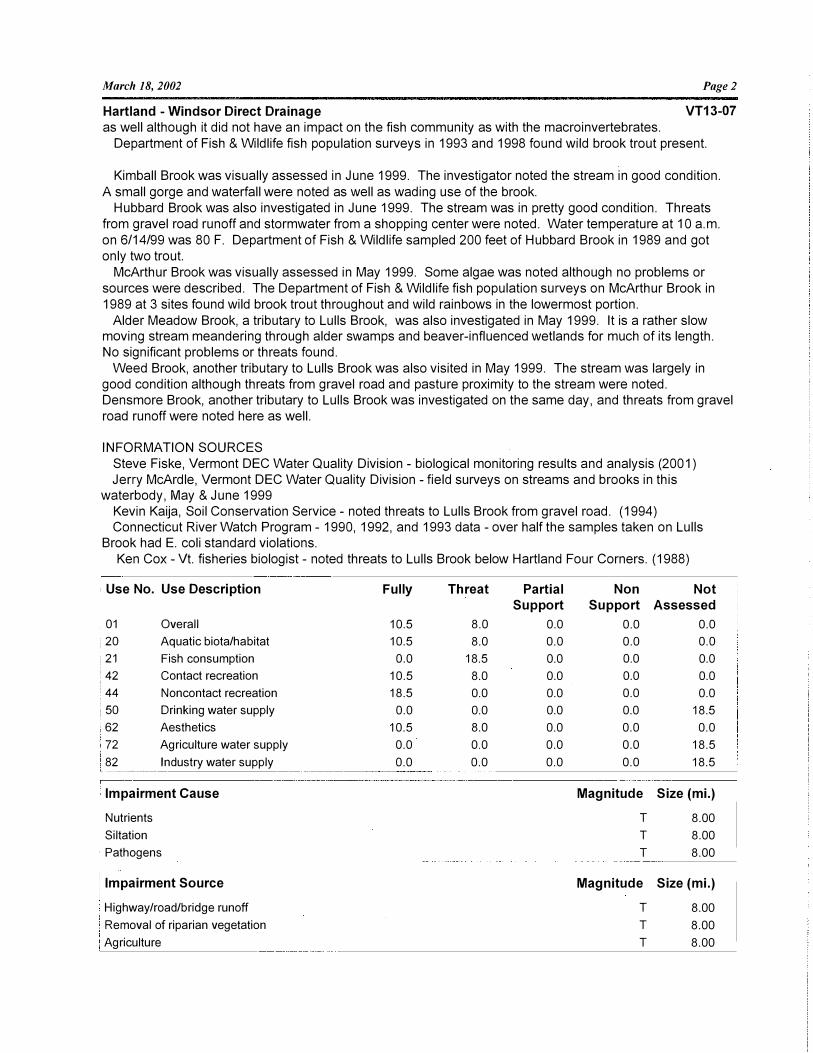
March 18, 2002 Page2
Hartland - Windsor Direct Drainage VT13-07
as well although it did not have an impact on the fish community as with the macroinvertebrates.
Department of Fish & Wildlife fish population surveys in 1993 and 1998 found wild brook trout present.
Kimball Brook was visually assessed in June 1999. The investigator noted the stream in good condition.
A small gorge and waterfall were noted as well as wading use of the brook. Hubbard Brook was also investigated in June 1999. The stream was in pretty good condition. Threats
from gravel road runoff and stormwater from a shopping center were noted. Water temperature at 10 a.m.
on 6/14/99 was 80 F. Department of Fish & Wildlife sampled 200 feet of Hubbard Brook in 1989 and got only two trout.
McArthur Brook was visually assessed in May 1999. Some algae was noted although no problems or sources were described. The Department of Fish & Wildlife fish population surveys on McArthur Brook in
1989 at 3 sites found wild brook trout throughout and wild rainbows in the lowermost portion.
Alder Meadow Brook, a tributary to Lulls Brook, was also investigated in May 1999. It is a rather slow moving stream meandering through alder swamps and beaver-influenced wetlands for much of its length. No significant problems or threats found.
Weed Brook, another tributary to Lulls Brook was also visited in May 1999. The stream was largely in good condition although threats from gravel road and pasture proximity to the stream were noted. Densmore Brook, another tributary to Lulls Brook was investigated on the same day, and threats from gravel road runoff were noted here as well.
INFORMATION SOURCES Steve Fiske, Vermont DEC Water Quality Division - biological monitoring results and analysis (2001) Jerry McArdle, Vermont DEC Water Quality Division - field surveys on streams and brooks in this
waterbody, May & June 1999 Kevin Kaija, Soil Conservation Service - noted threats to Lulls Brook from gravel road. (1994) Connecticut River Watch Program - 1990, 1992, and 1993 data - over half the samples taken on Lulls
Brook had E. coli standard violations. Ken Cox - Vt. fisheries biologist - noted threats to Lulls Brook below Hartland Four Corners. (1988)
, Use No. Use Description
01
20
21
42
44
50
62
'72
82 ------- -�---
Overall
Aquatic biota/habitat
Fish consumption
Contact recreation
Noncontact recreation
Drinking water supply
Aesthetics
Agriculture water supply
Industry water supply
Impairment Cause
Nutrients
Siltation
· Pathogens
Impairment Source
Highway/road/bridge runoff
Removal of riparian vegetation
Agriculture
Fully
10.5
10.5
0.0
10.5
18.5
0.0
10.5
0.0
0.0
Threat Partial Non Not Support Support Assessed
8.0 0.0 0.0 0.0
8.0 0.0 0.0 0.0
18.5 0.0 0.0 0.0
8.0 0.0 0.0 0.0
0.0 0.0 0.0 0.0
0.0 0.0 0.0 18.5
8.0 0.0 0.0 0.0
0.0 0.0 0.0 18.5
0.0 0.0 0.0 18.5
Magnitude Size (mi.)
T 8.00
T 8.00
T 8.00
Magnitude Size (mi.)
T 8.00
T 8.00
T 8.00
March 18, 2002
Hartland- Windsor Direct Drainag�----
Permit No. Point or Nonpoint Source Description
9-0164 Hartland Elementary - Indirect - sewage
9-0271 The Dharma Center - Indirect - sewage
Martinsville Hydro - Hydropower Dam - Pr
Receiving Water
Lulls Brook
Lulls Brook
Page3
VT13-07

March 18, 2002 Pagel
Waterbody No: VT13-08
River Length (mi.): 35
Reading - Windsor Direct Drainages
Assessment Report
Assessment Year: 2001
Date Last Updated: 3/10/2002
Description: Mill Brook from headwaters to Connecticut River including Willow Brook, Beaver Brook, Reading Hill Brook, and Bailey Brook
Location Identifiers
ANR Enforcement District: 2 NRCS District: 9
Fish· and Wildlife District: Regional Planning Commission: SOW
Monitored (mi.):
Evaluated (mi.):
Water Quality Limited?
On 303(d) List?
8.0
27.0
N
Monitored for Toxics? Y
Aquatic Contamination
Waste Management Zone - Miles:
Assessment Comments
PARTIAL SUPPORT MILES
Assessment Information
Assessment Types
Surveys of fish and game biologists or other professionals
Land use information and location of sources
Occurrence of conditions judged to cause impairment
Modeling
Discharger self-monitoring data (effluent)
Toxics Testing
Description:
Mill Brook: 7.0 - from snowmaking water withdrawal point downstream (includes the 1 miles in PS below and is a subset of the 9.8 miles in T below) - partial support of aquatic biota/habitat due to snowmaking
water withdrawal. c(1500) s(7420)
Mill Brook: 1.0 - from Mill Pond Dam to Connecticut River (subset of the 7 miles above) - partial support of aesthetics, aquatic biota/habitat, and secondary contact recreation due to sedimentation, nutrients, and flow
and habitat alteration caused by upstream impoundment and its de-silting, urban and road runoff, and land
development. c(900, 1100, 1500, 1600) s(3200,4000,4500,8800)
THREATENED MILES
Mill Brook: 9.8 - from Mill Pond upstream - threats to aquatic biota/habitat, aesthetics, and secondary
contact recreation due to sedimentation, habitat alteration, nutrients, likely temperature (not listed in causes though) from riparian encroachment (roads, lawns, pasture .. ), streambank instability and erosion, road
runoff, agricultural land uses. c(900,1100,1600) s(1000,4500,7600,7700) Mill Brook: 1.0 (an estimate and a subset of the 9.8 miles above)) - from Luzenac Mine at West
Windsor/Reading townline downstream - threats to aquatic biota/habitat, contact recreation, and drinking water supply due to arsenic in discharge from talc processing plant. c(500) s(100)

March 18, 2002 Page2
Reading - Windsor Direct Drainages VT13-08
Willow Brook: 4.5 - headwaters to confluence with Mill Brook - threats to aquatic biota/habitat due to
sedimentation from bank erosion and town road maintenance. c(1100) s(4500,7700)
COMMENTS
Biological monitoring on Mill Brook at rivermile 11.4 in West Windsor in 1993 and 1997 found the
macroinvertebrate community in excellent condition. This sampling site is located about 1 /4 mile below the
Luzenac discharge. The Department of Fish & Wildlife sampled two sites annually from 1982 to 1992. They found a good wild
brown trout population and some wild brook trout at their lower site at Bests covered bridge and wild brook and brown trout at the upper site in Reading.
In the summer of 2000, Southern Windsor County Regional Planning Commission (SWCRPC) surveyed the entire Mill Brook and its principal tributaries documenting each erosion site with digital photographs and information on a worksheet. They found 55 sites on Mill Brook and 40 sites on the principal tributaries. The report on their erosion study discussed possible causes of the erosion but more study is needed on the stream system to understand the dynamics.
The Southern Windsor County Regional Planning Commission sampled 5 sites on Mill Brook in 1997 and 7 sites in 1998. In 1997, the pH and D.O. values met standards, turbidity numbers were below standard, fecal coliform levels met standards, but phosphorus was high (about 0.7 to 0.85 mg/liter). In 1998, the same 5 sites as in 1997 were sampled plus 2 additional sites upstream. The only numbers that stood out were: one E. coli sample at one site was over standard Uust over 100) and phosphorus numbers that were lower thanin 1997 but still high with all sites over 0.1 mg/liter and one site above 0.2 mg/liter.
Luzenac America West Windsor talc processing mill discharges wastewater from the processing to Mill Brook. The wastewater contains arsenic that is a byproduct of the talc processing. The discharge has in
the past had concentrations of arsenic exceeding the permit limits which are 90.8 grams per day monthly average.
Earlier assessments had "Mill Brook: 0.1 - threats to aquatic biota, fish consumption, and public and agricultural water supplies from indescriminate disposal of 16,000 gal. of liquid waste containing organic solvents and petroleum products by Goodyear Tire and Cone-Blanchard Co. between 1950 and 1971. c(300,400) s(6600)" . Additional information on this site .. the site was originally a town gravel pit that then became a town dump. While it was a dump, there was the disposal of the above-mentioned wastes by Goodyear and Cone Blanchard. It seems however that much of the waste was burned. Cone Blanchard and Goodyear under DEC oversight investigated the site. No organics or petroleum products were found and the one area where the vegetation seemed stressed was capped to be safe. There has been four of five years of required groundwater monitoring and nothing at or down gradient of the site has been found. Mill Brook and its sediments were also sampled and nothing was found. There are deed restrictions on the site. At the end of the required monitoring, it is likely that the site will be closed as no problems or pollution sources have been found. (2002)
INFORMATION SOURCES
Jay McMenemy, Vermont Department of Fish & Wildlife - summary of results from fish population surveys (2002)
Southern Windsor County Regional Planning Commission 604(b) Projects - water quality monitoring results from Mill Brook in 1997 and 1998 (2002)
Vermont DEC Wastewater Management Division files - information on Luzenac West Windsor discharges
(2002) Jerry McArdle, Vermont DEC Water Quality Division - field observations on Mill Brook and tributaries
(1999) Michael Smith, Vermont DEC Waste Management Division - information on the Tafron-Hoisington
(Goodyear/Cone-Blanchard) site near Mill Brook. (2002)
Use Attainment for Streams Affected By Snowmaking Water Withdrawals in Vermont, David Bottamini,
1996, ANR DEC Water Quality Division. (1998) Kevin Kaija - Soil Conservation Service - noted erosion on Willow Brook and Mill Brook below Willow
Brook confluence. (1994)

March 18, 2002
�eading - Windsor Direct c:>rai11ages
Use No. Use Description
01 Overall 20 Aquatic biota/habitat
i 21 Fish consumption 42 Contact recreation 44 Noncontact recreation 50 Drinking water supply 62 Aesthetics 72 Agriculture water supply 82 Industry water supply
Impairment Cause
Siltation Siltation Flow alterations
i Other habitat alterations Nutrients Other habitat alterations
· NutrientsMetals
Impairment Source
Agriculture Land development
· Urban/developed land runoffI Highway/road/bridge runoff: Upstream impoundmentFlow mod.- snowmaking water withdrawalRemoval of riparian vegetationStreambank modification/destabilizationHighway/road/bridge runoffIndustrial point sources
Fully
24.2 24.2
0.0 34.0 24.2 34.0 24.2
0.0 0.0
Permit No. Point or Nonpoint Source Description
VT0000132 Luzenac America - West Windsor Mine
770024 Trafton/Hoisington - hazardous waste
Threat
3.8 3.8
35.0 1.0 9.8 1.0 9.8 0.0 0.0
---�-�---�----�-
Page3
VT13-08
Partial Non Not Support Support Assessed
7.0 0.0 0.0 7.0 0.0 0.0 0.0 0.0 0.0 0.0 0.0 0.0 1.0 0.0 0.0 0.0 0.0 0.0 1.0 0.0 0.0 0.0 0.0 35.0 0.0 0.0 35.0
Magnitude Size (mi.)
M 5.50 T 14.30 M 7.00 T 9.80 M 1.00 M 1.00 T 9.80 T 1.00
-----�-
Magnitude Size (mi.)
T 9.80 M 1.00 M 1.00 M 1.00 M 1.00 M 7.00 T 9.80 T 14.30 T 14.30 T 1.00
Receiving Water
Mill Brook
Mill Brook
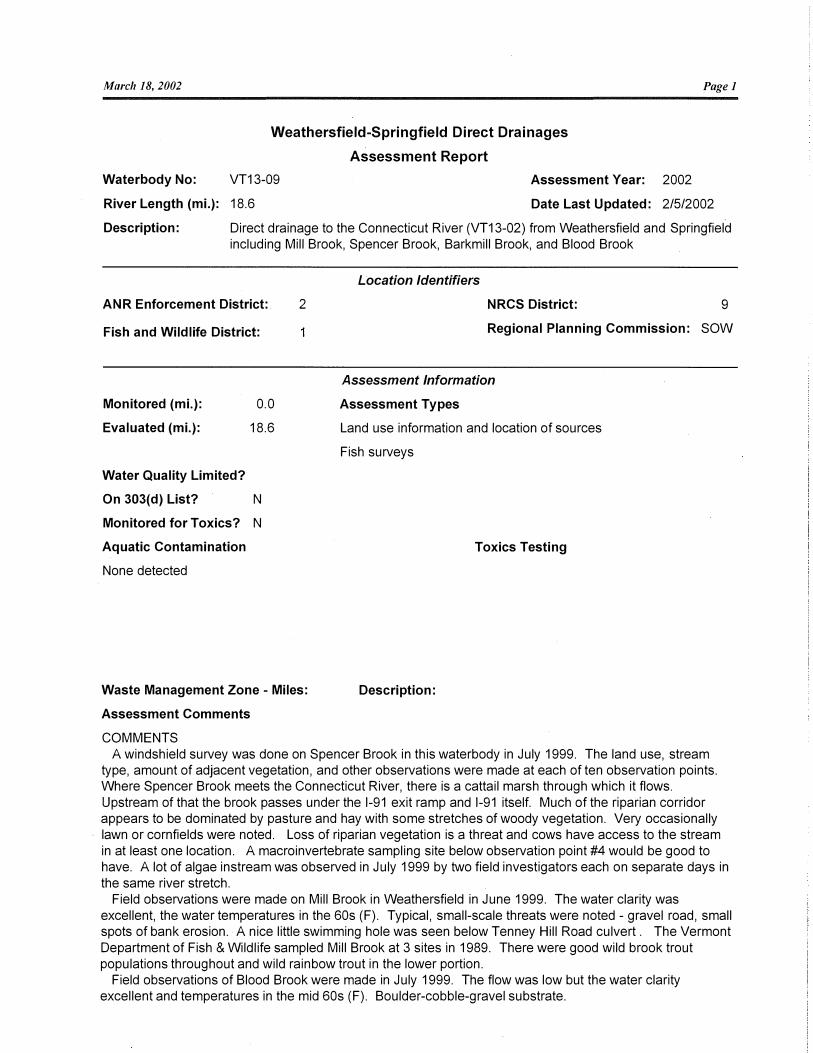
March 18, 2002 Pagel
Weathersfield-Springfield Direct Drainages
Assessment Report
Waterbody No: VT13-09 Assessment Year: 2002
Date Last Updated: 2/5/2002 River Length (mi.): 18.6
Description: Direct drainage to the Connecticut River (VT13-02) from Weathersfield and Springfield including Mill Brook, Spencer Brook, Barkmill Brook, and Blood Brook
Location Identifiers
ANR Enforcement District: 2 NRCS District: 9
Fish and Wildlife District: Regional Planning Commission: SOW
Monitored (mi.):
Evaluated (mi.):
0.0
18.6
Water Quality Limited?
On 303( d) List? N
Monitored for Toxics? N
Aquatic Contamination
None detected
Waste Management Zone - Miles:
Assessment Comments
COMMENTS
Assessment Information
Assessment Types
Land use information and location of sources
Fish surveys
Toxics Testing
Description:
A windshield survey was done on Spencer Brook in this waterbody in July 1999. The land use, stream type, amount of adjacent vegetation, and other observations were made at each of ten observation points. Where Spencer Brook meets the Connecticut River, there is a cattail marsh through which it flows.
Upstream of that the brook passes under the 1-91 exit ramp and 1-91 itself. Much of the riparian corridor appears to be dominated by pasture and hay with some stretches of woody vegetation. Very occasionally
lawn or cornfields were noted. Loss of riparian vegetation is a threat and cows have access to the stream
in at least one location. A macroinvertebrate sampling site below observation point #4 would be good to have. A lot of algae instream was observed in July 1999 by two field investigators each on separate days in
the same river stretch. Field observations were made on Mill Brook in Weathersfield in June 1999. The water clarity was
excellent, the water temperatures in the 60s (F). Typical, small-scale threats were noted - gravel road, small spots of bank erosion. A nice little swimming hole was seen below Tenney Hill Road culvert . The Vermont
Department of Fish & Wildlife sampled Mill Brook at 3 sites in 1989. There were good wild brook trout populations throughout and wild rainbow trout in the lower portion.
Field observations of Blood Brook were made in July 1999. The flow was low but the water clarity excellent and temperatures in the mid 60s (F). Boulder-cobble-gravel substrate.

March 18, 2002 Page2
Weathersfield-Springfield Direct Drainages VT13-09
Barkmill Brook was also observed in June 1999. No water quality problems were seen. The water clarity
was excellent, the water temperature was 63 F (air temp about 80 F). Boulder-cobble stream.
INFORMATION SOURCES
Jerry McArdle, Vermont DEC Water Quality Division - field observations on Spencer Brook, Mill Brook,
Blood Brook, and Barkmill Brook. June and July 1999. (2002)
Dan Farrell, Vermont DEC Water Quality Division - field observations on Spencer Brook, July 1999. (2002)
Jay McMenemy, Vermont Department of Fish & Wildlife - fish survey information on Mill Brook (200)
Use No. Use Description Fully Threat Partial Non Not
Support Support Assessed
01 Overall 18.6 0.0 0.0 0.0 0.0
20 Aquatic biota/habitat 18.6 0.0 0.0 0.0 0.0
21 Fish consumption 0.0 18.6 0.0 0.0 0.0
42 Contact recreation 18.6 0.0 0.0 0.0 0.0
44 Noncontact recreation 18.6 0.0 0.0 0.0 0.0
50 Drinking water supply 0.0 0.0 0.0 0.0 18.6
62 Aesthetics 18.6 0.0 0.0 0.0 0.0
72 Agriculture water supply 0.0 0.0 0.0 0.0 18.6
82 Industry water supply 0.0 0.0 0.0 0.0 18.6 ---��--�----
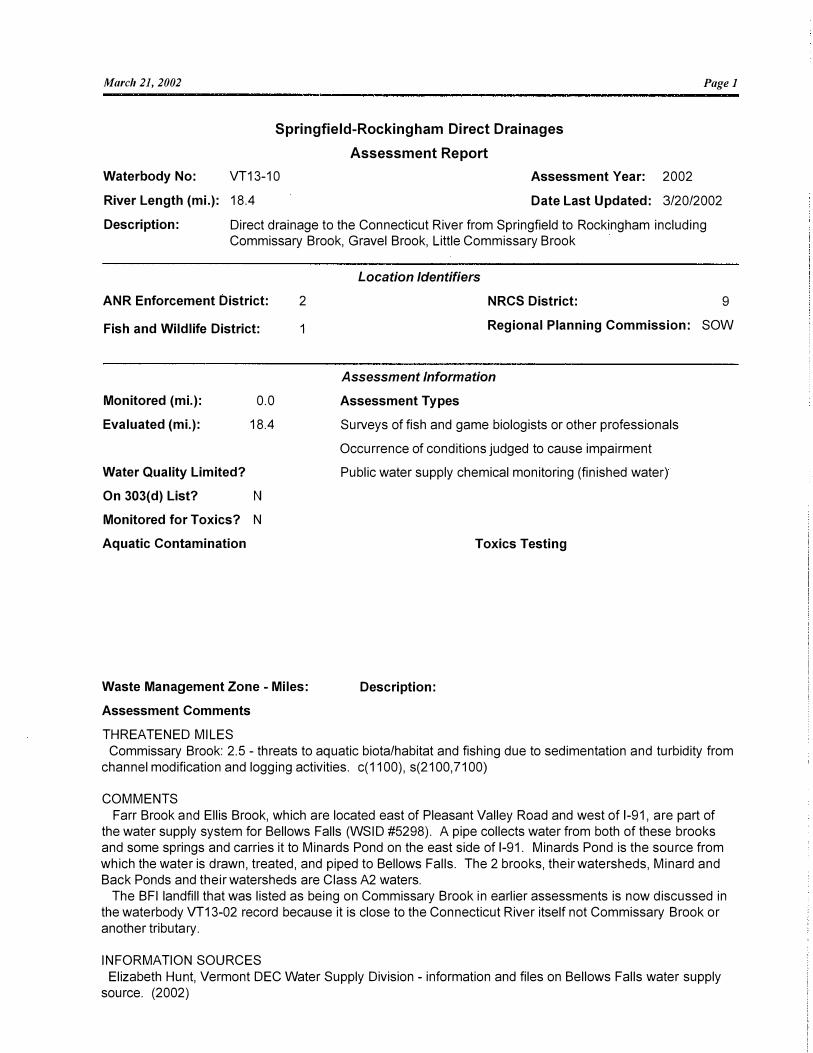
March 21, 2002 Pagel
Waterbody No:
Springfield-Rockingham Direct Drainages
Assessment Report
VT13-10
River Length (mi.): 18.4
Assessment Year: 2002
Date Last Updated: 3/20/2002
Description: Direct drainage to the Connecticut River from Springfield to Rockingham including Commissary Brook, Gravel Brook, Little Commissary Brook
Location Identifiers
ANR Enforcement District: NRCS District: 9
Fish and Wildlife District:
2
1 Regional Planning Commission: SOW
Monitored (mi.): 0.0
Evaluated (mi.): 18.4
Assessment Information
Assessment Types
Surveys of fish and game biologists or other professionals
Occurrence of conditions judged to cause impairment
Water Quality Limited? Public water supply chemical monitoring (finished water)
On 303(d) List? N
Monitored for Toxics? N
Aquatic Contamination
Waste Management Zone - Miles:
Assessment Comments
THREATENED MILES
Toxics Testing
Description:
Commissary Brook: 2.5 - threats to aquatic biota/habitat and fishing due to sedimentation and turbidity from channel modification and logging activities. c(1100), s(2100,7100)
COMMENTS Farr Brook and Ellis Brook, which are located east of Pleasant Valley Road and west of 1-91, are part of
the water supply system for Bellows Falls (WSID #5298). A pipe collects water from both of these brooks and some springs and carries it to Minards Pond on the east side of 1-91. Minards Pond is the source from which the water is drawn, treated, and piped to Bellows Falls. The 2 brooks, their watersheds, Minard and Back Ponds and their watersheds are Class A2 waters.
The BFI landfill that was listed as being on Commissary Brook in earlier assessments is now discussed in the waterbody VT13-02 record because it is close to the Connecticut River itself not Commissary Brook or another tributary.
INFORMATION SOURCES Elizabeth Hunt, Vermont DEC Water Supply Division - information and files on Bellows Falls water supply
source. (2002)
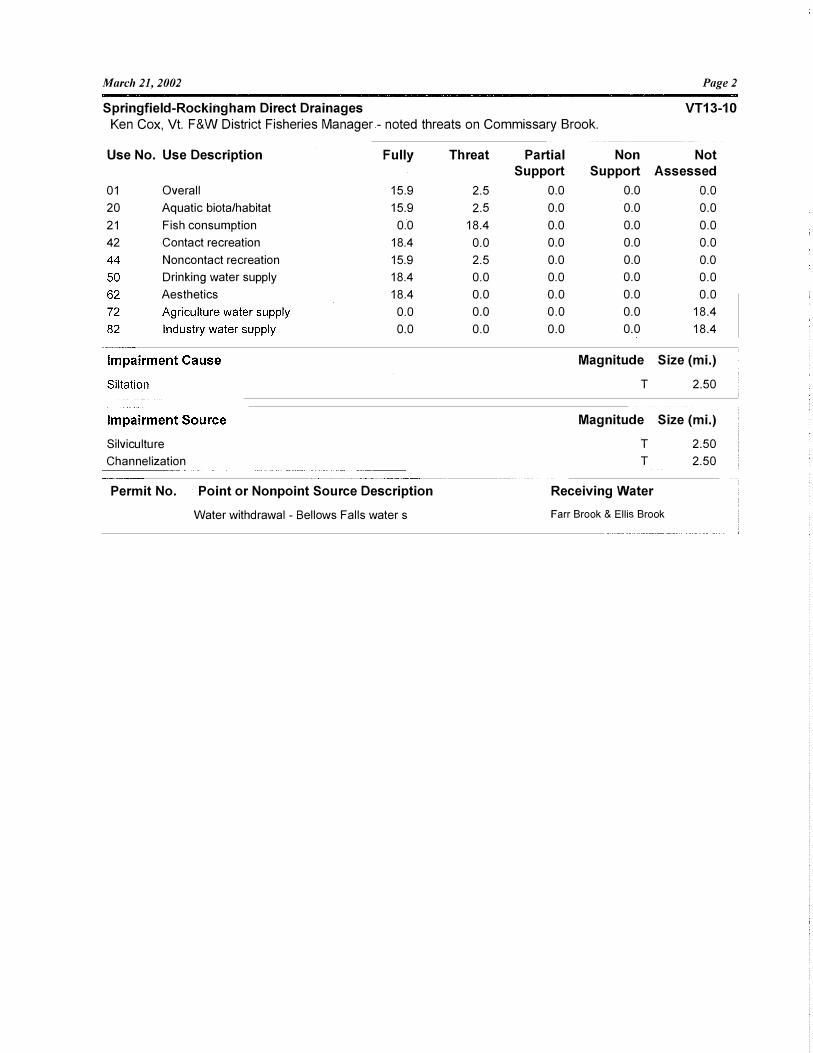
March 21, 2002 Page2
Springfield-Rockingham Direct Drainages VT13-10 Ken Cox, Vt. F&W District Fisheries Manager - noted threats on Commissary Brook.
Use No. Use Description
01 Overall
20 Aquatic biota/habitat
21 Fish consumption
42 Contact recreation
Noncontact recreation
Drinking water supply
Aesthetics
Silviculture
Channelization
Fully
15.9
15.9
0.0
18.4
15.9
18.4
18.4
0.0
0.0
Permit No. Point or Nonpoint Source Description
Water withdrawal - Bellows Falls water s
Threat
2.5
2.5
18.4
0.0
2.5
0.0
0.0
0.0
0.0
Partial Non Not Support Support Assessed
0.0 0.0 0.0
0.0 0.0 0.0
0.0 0.0 0.0
0.0 0.0 0.0
0.0 0.0 0.0
0.0 0.0 0.0
0.0 0.0 0.0
0.0 0.0 18.4
0.0 0.0 18.4
Magnitude Size (mi.)
T 2.50
Magnitude Size (mi.)
T 2.50
T 2.50
Receiving Water
Farr Brook & Ellis Brook
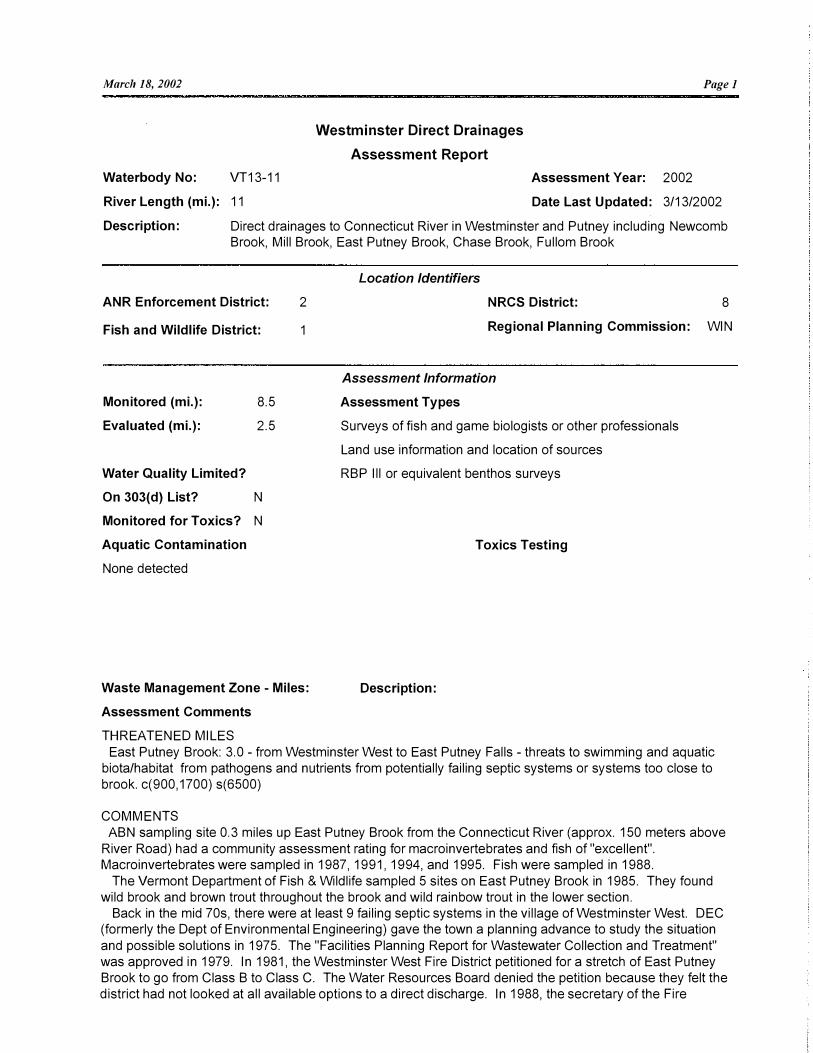
March 18, 2002
Waterbody No: VT13-11
River Length (mi.): 11
Westminster Direct Drainages
Assessment Report
Pagel
Assessment Year: 2002
Date Last Updated: 3/13/2002
Description: Direct drainages to Connecticut River in Westminster and Putney including Newcomb Brook, Mill Brook, East Putney Brook, Chase Brook, Fullam Brook
ANR Enforcement District:
Fish and Wildlife District:
Monitored (mi.): 8.5
Evaluated (mi.): 2.5
2
1
Location Identifiers
NRCS District: 8
Regional Planning Commission: WIN
Assessment Information
Assessment Types
Surveys of fish and game biologists or other professionals
Land use information and location of sources
Water Quality Limited? RBP Ill or equivalent benthos surveys
On 303(d) List? N
Monitored for Toxics? N
Aquatic Contamination
None detected
Waste Management Zone - Miles:
Assessment Comments
THREATENED MILES
Toxics Testing
Description:
East Putney Brook: 3.0 - from Westminster West to East Putney Falls - threats to swimming and aquatic biota/habitat from pathogens and nutrients from potentially failing septic systems or systems too close to
brook. c(900, 1700) s(6500)
COMMENTS
ABN sampling site 0.3 miles up East Putney Brook from the Connecticut River (approx. 150 meters above
River Road) had a community assessment rating for macroinvertebrates and fish of "excellent". Macroinvertebrates were sampled in 1987, 1991, 1994, and 1995. Fish were sampled in 1988.
The Vermont Department of Fish & Wildlife sampled 5 sites on East Putney Brook in 1985. They found
wild brook and brown trout throughout the brook and wild rainbow trout in the lower section. Back in the mid 70s, there were at least 9 failing septic systems in the village of Westminster West. DEC
(formerly the Dept of Environmental Engineering) gave the town a planning advance to study the situation
and possible solutions in 1975. The "Facilities Planning Report for Wastewater Collection and Treatment" was approved in 1979. In 1981, the Westminster West Fire District petitioned for a stretch of East Putney
Brook to go from Class B to Class C. The Water Resources Board denied the petition because they felt the district had not looked at all available options to a direct discharge. In 1988, the secretary of the Fire

March 18, 2002 Page2
Westminster Direct Drainages VT13-11
District, Alison Taylor, wrote to DEC wondering about re-activating the project which was "never undertaken." The health officer from Westminster who has been in government for 30 years remembers
rumblings about a system for Westminster West but nothing came of it. She said that several of the individual onsite systems near the brook had been upgraded over the years - they had done the best the
could to alleviate the problems with some of the systems. She thought it was time to re-evaluate the water
quality in the stream and see if problems still exist. The upgrades might have taken care of the problems
from the 70s but if not, it is "time to get going." (2002)
INFORMATION SOURCES
DEC Water Quality Division files - classification petition a.nd other pre-1982 information on Westminster
West failed systems (2002) Ruth Grandee, Westminster Health Officer - information about septic systems upgrades in Westminster
West (2002)
DEC Wastewater Management Division and Regional Office staff - historical information on Westminster West failed systems (2002)
Steve Fiske, Vermont DEC Water Quality Division Biomonitoring and.Aquatic Studies Section -macroinvertebrate sampling results (1996)
Henry Feenan, VACD On Site Specialist - notes onsite sewage problems due to poor site planning (1988)
Use No. Use Description Fully
01 Overall 8.0 20 Aquatic biota/habitat 8.0 21 Fish consumption 0.0
. 42 Contact recreation 8.0 , 44 Noncontact recreation 11.0 I 50 Drinking water supply 0.0 62 Aesthetics 11.0 72 Agriculture water supply 0.0 82 Industry water supply 0.0
--------�- --------- --------- ---------�--� -------�---- --------
Impairment Cause
· NutrientsPathogens
Impairment Source
Onsite wastewater systems (septic tanks)
Permit No. Point or Nonpoint Source Description
9-0081 New England Kum Hattin Homes
Threat
3.0 3.0
11.0
3.0
0.0 0.0 0.0
0.0 0.0
Partial Non Not Support Support Assessed
0.0 0.0 0.0 0.0 0.0 0.0 0.0 0.0 0.0 0.0 0.0 0.0 0.0 0.0 0.0 0.0 0.0 11.0 0.0 0.0 0.0 0.0 0.0 11.0
0.0 0.0 11.0
Magnitude Size (mi.)
T 3.00 T 3.00
Magnitude Size (mi.)
T 3.00
Receiving Water
Mill Brook (Westminster)
March 19, 2002
Waterbody No: VT13-12
River Length (mi.): 7.5
Sacketts Brook
Assessment Report
Pagel
Assessment Year: 2002
Date Last Updated: 3/13/2002
Description: Mouth to headwaters and tributaries
ANR Enforcement District:
Fish and Wildlife District:
Monitored (mi.):
Evaluated (mi.):
3.5
4.0
Water Quality Limited? Y
On 303( d) List? Y
Monitored for Toxics?
Aquatic Contamination
2
1
Waste Management Zone - Miles:
Assessment Comments
NON-SUPPORT MILES
Location Identifiers
NRCS District: 8
Regional Planning Commission: WIN
Assessment Information
Assessment Types
RBP Ill or equivalent benthos surveys
Fish surveys
RBP V or equivalent fish surveys
Toxics Testing
Description:
Sacketts Brook: 1.0 - from 20 meters below Putney Mill downstream.., non-support of aquatic biota and
water supplies due to suspected toxic impairment from Putney Paper mill and lagoons. c( 100) s( 100)
THREATENED MILES
Sacketts Brook: 2.0 - threats to aquatic biota/habitat, swimming, fishing, and agric. water supply due to
algae, periphyton, nutrients, siltation, and some pathogens from agricultural land uses, development, road
runoff, and streambank erosion. c(900, 1100, 1700,2200) s(1000,3200, 7700,8300)
Sacketts Brook: 0.8 - below Town of Putney fire pond (subset of mile of non-support) - threats to aquatic
biota/habitat due to sedimentation from desilting of fire pond. c(1100) s(8800)
COMMENTS
Vermont DEC macroinvertebrate sampling site below Putney Paper Mill (1.0) has poor macroinvertebrate
community richness and EPT values. In 1992, there was a lot of algae and the water was blue-green in
color at the site. Low EPT density values "strongly indicate a toxic impairment." Sampling in 1995, 1996
and 1998 all showed non-support (community assessment of poor) as well. Aquatic biota at site 3.5 well above the mill is fully supported (sampled in 1996).

March 19, 2002 Page2
Sacketts Brook VT13-12 Vermont DEC fish sampling was done in 1986, 1988, and 1995. Around rivermile 0.9 in 1986, the fish
community was found to be in fair condition; at rivermile 0.8 in 1988, it was in fair condition; and at rivermile
1.0 in 1995, it was in good condition.
Vermont Department of Fish & Wildlife fish population sampling at 2 sites in 1993 found wild brook and
brown trout. The two sites were located at Putney Central School and Hickory Ridge Road. The
populations were fairly low.
Putney Paper Mill's discharge (treated paper mill waste) is piped from the plant to the Connecticut River.
The pipe runs along the edge of Sacketts Brook and used to break and leak. It has been replaced and
should no longer be a problem. The company has also de-commissioned 2 1/2 of 3 lagoons - it has re-lined
a portion of one for emergency use. The site should be sampled again to look for improvements. (2002)
INFORMATION SOURCES
Brian Kooiker and Carol Carpenter, Vermont DEC Wastewater Management Division - information on Putney Paper (2002)
Tim Blake, Vt. DEC Water Resources Investigator - noted fire pond threat. (1990) Ken Cox, Vt. F&W District Fisheries Manager - noted additional threats to Sacketts Brook above WWTF
(1988)
Steve Fiske - Vt. DEC Ambient Biomonitoring Network - data and information from macroinvertebrate sampling on Sacketts Brook
Use No. Use Description
'01 Overall
20 Aquatic biota/habitat
21 Fish consumption
42 Contact recreation
44 Noncontact recreation
50 Drinking water supply
62 Aesthetics
72 Agriculture water supply
82 Industry water
Impairment Cause
Unknown toxicity
Nutrients
Siltation
Pathogens
Noxious aquatic plants
Impairment Source
Industrial point sources
Agriculture
Land development
Highway/road/bridge runoff
Upstream impoundment
Streambank modification/destabilization
Fully
4.5
4.5
0.0
5.5
5.5
6.5
7.5
4.5
0.0
Permit No. Point or Nonpoint Source Description
VT0100277 Putney WWTF 0.080mgd
Threat
2.0
2.0
7.5
2.0
2.0
0.0
0.0
2.0
0.0
Partial Non Not Support Support Assessed
0.0 1.0 0.0
0.0 1.0 0.0
0.0 0.0 0.0
0.0 0.0 0.0
0.0 0.0 0.0
0.0 1.0 0.0
0.0 0.0 0.0
0.0 1.0 0.0
0.0 0.0 7.5
Magnitude Size (mi.)
H 1.00
T 2.00
T 2.80
T 2.00
T
Magnitude Size (mi.)
H 1.00
T 2.00
T 2.00
T 2.00
T 0.80
T 2.00
Receiving Water
March 18, 2002
Waterbody No: VT13-13
River Length (mi.): 12.5
Dummerston Direct Drainages
Assessment Report
Pagel
Assessment Year: 2002
Date Last Updated: 2/12/2002
Description: Direct drainages into the Connecticut River including Mill, Canoe, and Salmon Brooks
ANR Enforcement District:
Fish and Wildlife District:
Monitored (mi.):
Evaluated (mi.):
0.0
12.5
Water Quality Limited?
On 303( d) List? N
Monitored for Toxics? N
Aquatic Contamination
None detected
2
1
Waste Management Zone - Miles:
Assessment Comments
COMMENTS
Location Identifiers
NRCS District: 8
Regional Planning Commission: WIN
Assessment Information
Assessment Types
Visual observation, use of maps, reference conditions, professional
Toxics Testing
Description:
The Salmon Brook watershed is mostly forested with some hayfields present located mostly in the lower
part of the watershed. Dummerston Center and the area between Route 5 and East Dummerston have
many houses some with large lawns. The riparian zone, as well as could be seen from the road, was generally intact. The canopy cover was usually between 70 and 90%. The brook is dominated by riffle with
a cobble and boulder substrate. There was a consistent cover of silt in the slow areas, but the water was
clear. More information is available in a write-up of the survey.
The Canoe Brook watershed is mostly forested with some hayfields. At the time of the survey (1999) the
USGS topographic map represented the open areas well. Development, however, was seen to be
somewhat more extensive than shown on the topo map. There was a closed canopy for most of the brook's
length. The stream is riffle-dominated with boulders, cobble and some gravel at the upstream end and
cobble/gravel dominating in the lower half. The stream and riparian vegetation are described in more detail
in a write-up of the stream survey.
Biological sampling was done on Salmon Brook at rivermile 0.8 in 1992. The macroinvertebrate
community was found to be "good" at that time.
March 18, 2002
Dummerston Direct Drainages INFORMATION SOURCES
Page2
VT13-13
Dan Farrell, Vermont DEC Water Quality Division summer assessment assistant - field observations on Salmon Brook and Canoe Brook, June 1999.
Vermont DEC Water Quality Division biological sampling results 1992
Use No. Use Description
• 01
20
21
42
44
50
62
: 72
I 82
Overall
Aquatic biota/habitat
Fish consumption
Contact recreation
Noncontact recreation
Drinking water supply
Aesthetics
Agriculture water supply
Industry water supply ----- -----·--------------- ----- -- --·-
Fully
12.5
12.5
0.0
12.5
12.5
0.0
12.5
0.0
0.0
Permit No. Point or Nonpoint Source Description
none
Threat
0.0
0.0
12.5
0.0
0.0
0.0
0.0
0.0
0.0
Partial Non Support Support
0.0 0.0
0.0 0.0
0.0 0.0
0.0 0.0
0.0 0.0
0.0 0.0
0.0 0.0
0.0 0.0
0.0 0.0
Not Assessed
0.0
0.0
0.0
0.0
0.0
12.5
0.0
12.5
12.5 - - ---�---� '
Receiving Water
March 18, 2002
Waterbody No: VT13-14
River Length (mi.): 19.5
Whetstone Brook
Assessment Report
Pagel
Assessment Year: 2002
Date Last Updated: 2/20/2002
Description: Mouth to headwaters and tributaries including Ames Hill Brook and Halliday Brook
ANR Enforcement District:
Fish and Wildlife District:
Monitored (mi.):
Evaluated (mi.):
19.5
0.0
Water Quality Limited?
On 303(d) List? Y
Monitored for Toxics? N
Aquatic Contamination
2
Waste Management Zone - Miles:
Assessment Comments
PARTIAL SUPPORT MILES
Location Identifiers
NRCS District: 8
Regional Planning Commission: WIN
Assessment Information
Assessment Types
Land use information and location of sources
RBP Ill or equivalent benthos surveys
Fish surveys
Chem/physical monitoring data by quality-assured volunteer progra
Bacteria water column sampling by quality-assured volunteer progr
Toxics Testing
Description:
Whetstone Brook: 2.2 - from the bend in the stream NW of the Living Memorial Park swimming pool (upstream of covered bridge) downstream to Conn. River - partial support of aquatic biota/habitat, contact recreation, and aesthetics (threats to secondary contact recreation) from enrichment, pathogens, petroleum products, other toxics in runoff, temperature, some sedimentation caused by land development, developed land runoff, removal of riparian vegetation, likely failed sewage lines, a hazardous site (Rice Oil) near the mouth, some ag land uses. c(900, 1100, 1200, 1400, 1700,2400) s(1000,3200,4000,6200, 7600,8250)
THREATENED MILES
Whetstone Brook: 2.5 - upstream from bend in the stream NW of the Living Memorial Park swimming pool -threats to aquatic biota/habitat, secondary contact recreation, and aesthetics from sediments, enrichment
from streambank erosion and developed land runoff. c(1100, 1200) s(4000, 7700)
COMMENTS Vermont DEC biological sampling results from September 1998 found a macroinvertebrate community in
fair condition at rivermile 0.2 and in excellent condition at rivermile 2.4. At rivermile 0.2, the EPT metric was low, the EPT:Chironomid ratio was low, and the site dominated by dipterans (70%). The site was also about

March 18, 2002 Pagel
Whetstone Brook VT13-14 30% filamentous and blue-green algae. The metrics indicated moderate levels of enrichment and toxic/urban runoff-type impacts. While electroshocking fish at rivermile 0.3, oil sheens were stirred up from the channel substrate.
Nutrient sampling was done by Vermont DEC Water Quality Division in 1999 once a month from June through September. At the upstream Brattleboro site (NW of the Living Memorial Park swimming pool), the TP concentrations ranged from .009 mg/liter to .012 mg/liter and the TN concentrations ranged from 0.36 mg/liter to 0.51 mg/liter. The site, however, was described as highly eroded, full of filamentous green and blue-green algae and silt, and has canopy cover of 10 - 15%. The downstream Brattleboro site behind the Brattleboro Food Coop had TP concentrations ranging from .008 mg/liter to .017 mg/liter and TN concentrations from 0.45 mg/liter to 0.60 mg/liter.
Petroleum contamination of Whetstone Brook near the mouth has been an issue for many years. The suspected source has been identified as the Rice Oil Canal Street Mobil. Clean-up at this facility was completed from 1991 to 1996 at which time 3000 to 4000 gallons of product were removed from the site. However, prior to site clean-up a lot of petroleum had migrated on and beyond the site resulting in a 4000 foot long groundwater contaminant plume. The petroleum was surfacing as seeps on the banks of Whetstone Brook. Four options have been discussed as follow-up to the information about the site's conditions - three options are forms of mitigating impacts to the brook and the fourth is to monitor and wait to see results. The latter is what has occurred to date. Since late 1999 or 2000, there have been no complaints about petroleum to the brook. Sampling is done annually - a dozen piezometers are on the banks of the brook and the levels of contaminants are declining.
There was a history of fish kills on Whetstone Brook which are hopefully a thing of the past. In the 1980s, fish kills occurred when the town water department would add chlorine to water lines then open fire hydrants to flush out lines. Water with chlorine would go down the streets to stormwater drains that went to Whetstone Brook. ANR personnel worked with the town to develop an alternative that involves discharging the water onto vacant lots so it doesn't get into the storm drains. There have been no reports of fish kills from this source in many years. However, in 1992 there was a chlorine spill from the Brattleboro swimming pool in Living Memorial Park that caused a fish kill over 4400 feet of the brook.
Fish sampling by the Dept of Fish and Wildlife was done at 3 sites in 1994 and 1998. In 1994, at the uppermost site young-of-year (yoy) wild brook and wild brown trout were found although a relatively low density of trout. At the middle site, both yoy and larger brook and brown trout were found. At the lower site, a number of yoy brown were found (39) and a few larger brook and brown trout. In 1998, at the uppermost site, all brook trout were found and both yoy and larger. At the middle site ( downstream of Pleasant Valley Reservoir brook), there were low numbers of both brook and brown trout but some yoy and yearling of each were present. At the lower site, there were fair numbers of yoy brown trout and multiple age classes of brown and brook trout.
Bonnyvale Center Results The water temperature results are good for all eleven sites sampled from May to November on Whetstone
Brook by the BEEC Monitoring Project in the year 2000. Water temperature data were collected from 1996 through 1999 and the data might lead to a conclusion that Whetstone Brook does not experience a summer temperature problem. However, temperature measurements were taken in the morning (8 am - 10 am) when temperatures typically are cool. Had temperatures been measured in the afternoon hours when daily maximum values occur, the data may have been more revealing of a thermal stress problem. [Fish & Wildlife Dept data from 1977 at two sites found maximum temperatures ranges from 75 to 82 degrees F (one miles above mouth) and from 64 to 73 degrees F (6.3 miles above the mouth). It is unlikely that temperatures have improved over the last 25 years given the additional alterations to the riparian zone and additional development in the watershed so the stream is likely prone to temperature stress in terms of supporting trout.]
Except for the second half of the sampling season in 1999 where most of the sites sampled dropped below the state standard of 6.5, the pH results from the eleven sites on Whetstone Brook are within state standards from 1996 to 1999. In the 2000 sampling season, the pH values were below standards on most sampling dates for sampling sites 9 and 10 at the Brattleboro/Marlboro town line and in Marlboro respectively.
Over the five year sampling effort on Whetstone Brook, there have been a number of dissolved oxygen Class B coldwater fishery standards violations. There does not seem to be a clear pattern in the occurrence
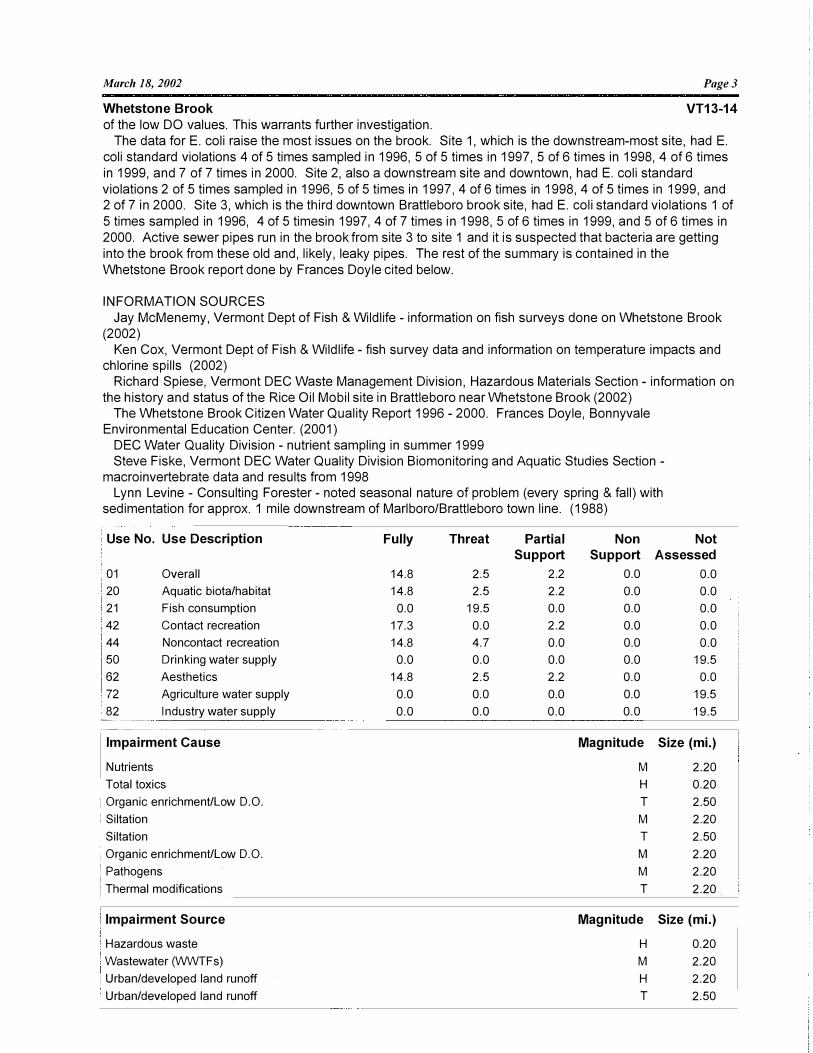
March 18, 2002 Page3
Whetstone Brook VT13-14
of the low DO values. This warrants further investigation.
The data for E. coli raise the most issues on the brook. Site 1, which is the downstream-most site, had E.
coli standard violations 4 of 5 times sampled in 1996, 5 of 5 times in 1997, 5 of 6 times in 1998, 4 of 6 times
in 1999, and 7 of 7 times in 2000. Site 2, also a downstream site and downtown, had E. coli standard
violations 2 of 5 times sampled in 1996, 5 of 5 times in 1997, 4 of 6 times in 1998, 4 of 5 times in 1999, and 2 of 7 in 2000. Site 3, which is the third downtown Brattleboro brook site, had E. coli standard violations 1 of
5 times sampled in 1996, 4 of 5 timesin 1997, 4 of 7 times in 1998, 5 of 6 times in 1999, and 5 of 6 times in
2000. Active sewer pipes run in the brook from site 3 to site 1 and it is suspected that bacteria are getting
into the brook from these old and, likely, leaky pipes. The rest of the summary is contained in the
Whetstone Brook report done by Frances Doyle cited below.
INFORMATION SOURCES
Jay McMenemy, Vermont Dept of Fish & Wildlife - information on fish surveys done on Whetstone Brook (2002)
Ken Cox, Vermont Dept of Fish & Wildlife - fish survey data and information on temperature impacts and chlorine spills (2002)
Richard Spiese, Vermont DEC Waste Management Division, Hazardous Materials Section - information on
the history and status of the Rice Oil Mobil site in Brattleboro near Whetstone Brook (2002) The Whetstone Brook Citizen Water Quality Report 1996 - 2000. Frances Doyle, Bonnyvale
Environmental Education Center. (2001) DEC Water Quality Division - nutrient sampling in summer 1999 Steve Fiske, Vermont DEC Water Quality Division Biomonitoring and Aquatic Studies Section -
macroinvertebrate data and results from 1998 Lynn Levine - Consulting Forester - noted seasonal nature of problem (every spring & fall) with
sedimentation for approx. 1 mile downstream of Marlboro/Brattleboro town line. (1988)
Use No. Use Description Fully Threat Partial Non Not Support Support Assessed
01 Overall 14.8 2.5 2.2 0.0 0.0
20 Aquatic biota/habitat 14.8 2.5 2.2 0.0 0.0
21 Fish consumption 0.0 19.5 0.0 0.0 0.0
42 Contact recreation 17.3 0.0 2.2 0.0 0.0
44 Noncontact recreation 14.8 4.7 0.0 0.0 0.0
50 Drinking water supply 0.0 0.0 0.0 0.0 19.5
62 Aesthetics 14.8 2.5 2.2 0.0 0.0
72 Agriculture water supply 0.0 0.0 0.0 0.0 19.5
82 Industry water supply 0.0 0.0 0.0 0.0 19.5 -----
-�� -------------
Impairment Cause
Nutrients
Total toxics
i Organic enrichment/Low D.O. I Siltation
Siltation
Organic enrichment/Low D.O.
Pathogens
I Thermal modifications
Impairment Source
Hazardous waste
'Wastewater (WWfFs)
: Urban/developed land runoff
Urban/developed land runoff
Magnitude Size (mi.)
M 2.20
H 0.20
T 2.50
M 2.20
T 2.50
M 2.20
M 2.20
T 2.20
Magnitude Size (mi.)
H 0.20
M 2.20
H 2.20
T 2.50
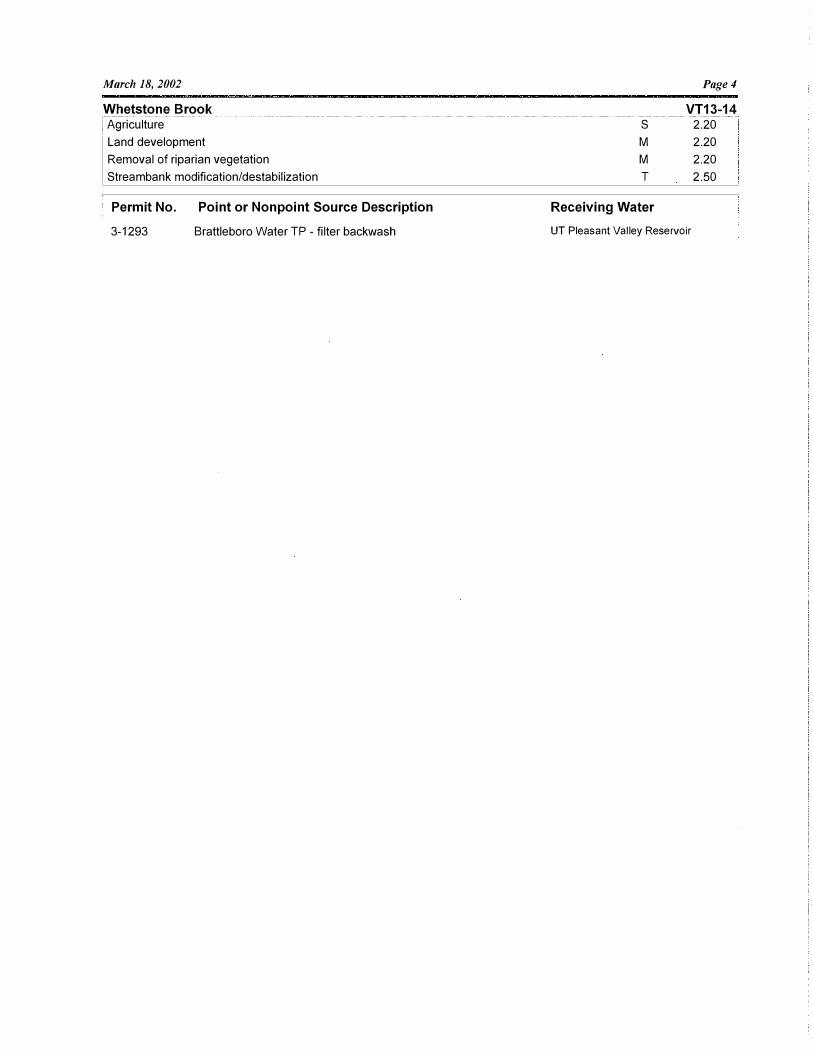
March 18, 2002
Whetstone Brook i Agriculture
Land development
Removal of riparian vegetation
Strea mba n k mod ification/desta bi I ization
Permit No. Point or Nonpoint Source Description
3-1293 Brattleboro Water TP - filter backwash
Page4
VT13-14 s 2.20
M 2.20
M 2.20
T 2.50
Receiving Water
UT Pleasant Valley Reservoir
March 18, 2002 Pagel
Waterbody No: VT13-15
River Length (mi.): 14
Broad Brook
Assessment Report
Assessment Year: 2002
Date Last Updated: 2/25/2002
Description: Mouth to headwaters & tributaries including Weatherhead Hollow brook
Location Identifiers
ANR Enforcement District: 2 NRCS District: 8
Fish and Wildlife District: Regional Planning Commission: WIN
Monitored (mi.):
Evaluated (mi.):
5.0
9.0
Assessment Information
Assessment Types
Land use information and location of sources
RBP 111 or equivalent benthos surveys
Water Quality Limited? Fish surveys
On 303(d) List? N
Monitored for Toxics? N
Aquatic Contamination
Waste Management Zone - Miles:
Assessment Comments
COMMENTS
Toxics Testing
Description:
Vermont DEC biological sampling at rivermile 0.9 in September 1998 found the macroinvertebrate community to be in "excellent" condition.
Vermont Department of Fish & Wildlife sampled game fish at three sites in 1993. Wild brook trout and brown trout were seen.
A windshield survey of Broad Brook and its tributaries occurred in June 1999. The investigator estimated
that perhaps up to half of the stream possesses limited, intermittent, or no riparian zone between it and hay field, lawn, or road. "The substrate is diverse but is dominated by boulder and cobble. Larger material and
bedrock occurs in the steep areas and smaller material including a lot of sand occurs in the areas of of more moderate slope. Silt was present everywhere. Except for the mouth, the substrate embeddedness was
approximately 25 to 50%." At the mouth it was extremely embedded - 75% +.
INFORMATION SOURCES
Vermont DEC Water Quality Division summer assessment assistant - noted instream and watershed conditions of Broad Brook in a report and map, 1999. (2002)
Vermont DEC Water Quality Division Biomonitoring and Aquatic Studies Section (BASS) -macroinvertebrate data and analysis, 1998 (2002)

March 18, 2002
Broad Brook
Jay McMenemy, Vermont Dept of Fish & Wildlife - information on fish sampling.
Use No. Use Description
01 Overall
20 Aquatic biota/habitat
21 Fish consumption
42 Contact recreation
44 Noncontact recreation
50 Drinking water supply
62 Aesthetics
72 Agriculture water supply
I 82 Industry water supply
-------�----
Fully Threat
14.0 0.0
14.0 0.0
0.0 14.0
14.0 0.0
14.0 0.0
0.0 0.0
14.0 0.0
0.0 0.0
0.0 0.0
Partial
Support
0.0
0.0
0.0
0.0
0.0
0.0
0.0
0.0
0.0 -�-- ------------
Pagel
VT13-15 (2002)
Non Not Support Assessed
0.0 0.0
0.0 0.0
0.0 0.0
0.0 0.0
0.0 0.0
0.0 14.0
0.0 0.0
0.0 14.0
0.0 14.0

March 18, 2002
Waterbody No: VT13-16
River Length (mi.): 14.8
Vernon Direct Drainages
Assessment Report
Pagel
Assessment Year: 2002
Date Last Updated: 2/25/2002
Description: Direct drainage into the Connecticut River (13-05) from Vernon including Newton Brook and Central Park Brook
ANR Enforcement District:
Fish and Wildlife District:
Monitored (mi.):
Evaluated (mi.):
2.5
12.3
2
1
Location Identifiers
NRCS District: 8
Regional Planning Commission: WIN
Assessment Information
Assessment Types
Land use information and location of sources
Non-fixed station chemical/physical monitoring-conventional polluta
Water Quality Limited? RBP Ill or equivalent benthos surveys
On 303( d) List? N
Monitored for Toxics? N
Aquatic Contamination
Waste Management Zone - Miles:
Assessment Comments
NON-SUPPORT MILES
Toxics Testing
Description:
Newton Brook: 1.5 - non-support of aquatic biota/habitat (partial support of aesthetics) due to nutrients, sediments, likely temperature, physical habitat alteration due to loss of riparian vegetation, cows instream and crossing the stream, an onstream fire pond. c(900, 1100, 1600) s(1000,7350,7600)
THREATENED MILES Central Park Brook: 1.0 - threats to aquatic biota and habitat due to acidification and low buffering ability of
stream, sedimentation, and temperature from road runoff, loss of riparian vegetation and streambank erosion. c(1000, 1100, 1400) s(4500, 7600, 7700)
COMMENTS Biological sampling was done on Newton Brook and Central Park Brook in 1998 and 2000.
Macroinvertebrate sampling in 1998 on Newton Brook found a community in poor condition. Fish sampling in 1998 and 2000 on Newton Brook also found a community in poor condition. Sampling was done at rivermile 0.6. Macroinvertebrate sampling in 1998 on Central Park Brook found a community in fair/good condition. Low EPT richness (particularly some Mayflies species which are most sensitive to acidification) was the main metric that caused the fair assessment. The brook has low alkalinity. The fish community

March 18, 2002 Page2
Vernon Direct Drainages VT13-16
was also sampled in 1998 on Central Park Brook and was in excellent condition. Nutrient sampling was done in summer 1999 at the firepond upstream of Route 142 on Newton Brook.
Results from the samples are as follows: on 6/29/1999 - TP = 107 ug/liter and TN= 0.86 mg/liter; on
8/5/1999 - TP = 76 ug/liter and TN = 0.89 mg/liter; and on 9/7/1999 - TP = 153 ug/liter and TN= 1.05 mg/liter
The report from a stream walk in July 1999 noted that Scooter is a cobble dominated riffle/pool stream with some deep (to 1 meter) muddy pools some of which extend up to 75 feet in the old field and beaver areas. Two significant beaver dams were observed downstream of Central Park Road. The brook has
several 100 foot long sections of riprap. It also has section of eroding, unstable banks. There are forested riparian stretches as well as areas of field and old field dominated by shrubs or herbs.
The total miles for this waterbody had been listed as 38.5 miles but Webster has Newton Brook as 3.0 miles to the state line and Central Park Brook also as 3.0 miles to the state line and measuring from the USGS topographic map, the miles for the these two brooks and their tributaries are approximately 14.8 miles. This number has replace the 38.5 above.
INFORMATION SOURCES Steve Fiske, Vermont DEC Water Quality Division - macroinvertebrate data and analysis (2002)
Vermont DEC Water Quality Division - nutrient samples and streamwalks done by summer assessment assistants (1999)
Rick White, Vt Dept of Forests and Parks - checked on the logging threats that had been listed above by Ken. There are no known specific threats now from logging so the threat was removed. (1997)
Use No. Use Description
01 Overall 20 Aquatic biota/habitat 21 Fish consumption 42 Contact recreation 44 Noncontact recreation 50 Drinking water supply 62 Aesthetics
'72 Agriculture water supply i 82 Industry water supply
I Impairment Cause
Nutrients ,pH Siltation Other habitat alterations Siltation Thermal modifications
Impairment Source
Agriculture Upstream impoundment Removal of riparian vegetation Removal of riparian vegetation
------"--�--�-
I Streambank modification/destabilization
L__lj����y/road/bridQ� ��off
Fully
12.3 12.3
0.0 14.8 14.8
0.0 12.3
0.0 0.0
Permit No. Point or Nonpoint Source Description
9-0007 Fox Hill Subdivision-treated dom sewage
Threat Partial Non Not Support Support Assessed
1.0 0.0 1.5 0.0 1.0 0.0 1.5 0.0
14.8 0.0 0.0 0.0 0.0 0.0 0.0 0.0 0.0 0.0 0.0 0.0 0.0 0.0 0.0 14.8 1.0 0.0 1.5 0.0 0.0 0.0 0.0 14.8 0.0 0.0 0.0 14.8
Magnitude Size (mi.)
H 1.50 T 1.50 M 1.50 M 1.50 T 1.00 T 1.00
Magnitude Size (mi.)
H 1.50 M 1.50 H 1.50 T 1.00 T 1.00 T 1.00
Receiving Water
Trib Newton Brook

March 18, 2002
Waterbody No: VT13-17
River Length (mi.): 11.5
Mass Direct Drainage
Assessment Report
Page I
Assessment Year: 2002
Date Last Updated: 2/27/2002
Description: Tributaries to the Connecticut that flow into Massachusetts including Fall River, West Brook and Keets Brook
ANR Enforcement District:
Fish and Wildlife District:
Monitored (mi.):
Evaluated (mi.):
2.6
0.0
Water Quality Limited?
On 303( d) List? N
Monitored for Toxics? N
Aquatic Contamination
None detected
2
1
Waste Management Zone - Miles:
Assessment Comments
Location Identifiers
NRCS District: 8
Regional Planning Commission: WIN
Assessment Information
Assessment Types
Surveys of fish and game biologists or other professionals
Fish surveys
Toxics Testing
Description:
Vermont Dept of Fish & Wildlife sampled Keets Brook in 1996. Wild brook trout were found.
INFORMATION SOURCES
Jay McMenemy, Vermont Dept of Fish & Wildlife - information on fish survey (200)
Use No. Use Description
01
20
21
42
44
! 50
62
72
82" --- ------------
Overall
Aquatic biota/habitat
Fish consumption
Contact recreation
Noncontact recreation
Drinking water supply
Aesthetics
Agriculture water supply
Industry water supply
Fully
2.6
2.6
0.0
2.6
2.6·
0.0
2.6
0.0
0.0
Threat Partial Non Support Support
0.0 0.0 0.0
0.0 0.0 0.0
11.5 0.0 0.0
0.0 0.0 0.0
0.0 0.0 0.0
0.0 0.0 0.0
0.0 0.0 0.0
0.0 0.0 0.0
0.0 0.0 0.0 -----��---
Not Assessed
8.9
8.9
0.0
8.9
8.9
11.5
8.9
11.5
11.5