Embed Size (px)
Citation preview

LOW TUNNEL STRATEGIES FOR MICROCLIMATE MODIFICATION
AND EARLY VEGETABLE PRODUCTION
By
Rebekah Marie Struck Faivor
A THESIS
Submitted to
Michigan State University
in partial fulfillment of the requirements
for the degree of
Horticulture—Master of Science
2014
ABSTRACT
LOW TUNNEL STRATEGIES FOR MICROCLIMATE MODIFICATION
AND EARLY VEGETABLE PRODUCTION
By
Rebekah Marie Struck Faivor
Profitability of vegetable production in Michigan is limited by a short season because of the
temperate climate. Therefore, most growers’ plant and harvest at the same time, which drives
prices down (sometimes below breakeven point) negatively affecting income. The goal of this
study was to investigate low tunnel technology as a means to improve profitability of fresh
market vegetables in Michigan and the North Central Region. Low tunnels allow growers to
start planting earlier, so they can harvest earlier, and receive a higher price for their produce
before vegetable prices begin to decline in mid-season. This study tested various plastic
materials used as low tunnels (clear and white perforated plastic) as well as their combination
with a spun-bond material (for heat trapping) for benefits including: frost protection, earliness in
planting and harvesting, and season extension. Our results showed by combining plastic mulch
and our new low tunnel design (perforated plastic plus spun-bond plastic) air temperature during
frost events was increased by 1-4 oC inside the tunnels. An analysis was also conducted to
determine the economic benefit of each system tested. The outcome will be greater awareness
among growers of the potential to use low tunnel technologies to reduce frost risks, and enhance
earliness and profitability.

iii
Dedicated to my grandparents, parents, siblings, husband, and son.

iv
ACKNOWLEGEMENTS
Thank you to Dr. Mathieu Ngouajio, my major professor, for his guidance, motivation,
and patience over the past four years. I also thank my committee members Dr. Ron Goldy and
Dr. Jeff Andresen, for all their help and advice.
I would not have been able to do this without my laboratory group: Drey Clark, Zachary
Hayden, and Aaron Yoder and our undergraduate assistants: Alex, Djoko, and Damen. I greatly
appreciate Dave Francis, his crew at the Southwest Michigan Research and Extension Center,
and Bill Chase for their help with my field work. Thanks to George McManus for shaping beds,
laying plastic and low tunnel material, and providing technical knowledge about low tunnels. My
thanks to all the ladies from the Department of Horticulture office for their help with all my
paperwork-related things; Sherry, Lorri, Joyce, and Rita.
I also thank my fellow graduate students: Carolyn Lowry, Erin Haramoto, Dana Ellison,
and Tiffany Lillirose for great friendship and advice. Thank you to my lovely husband for
believing in me and watching Leo so I could finish my Thesis.

v
TABLE OF CONTENTS
LIST OF TABLES ........................................................................................................................ vii
LIST OF FIGURES ....................................................................................................................... ix
Introduction ....................................................................................................... 1 CHAPTER 1:
Literature Review .............................................................................................. 9 CHAPTER 2:
Vegetable Production in Michigan ............................................................................................ 10
Impact of climatic conditions of vegetable production in Michigan ........................................ 11 Crop Origin and Temperature ................................................................................................... 12 Crop Market Prices in the US ................................................................................................... 12 Climate Modification in Agriculture ......................................................................................... 13
Low Tunnels and Climate ......................................................................................................... 13 Response of Tomato and Cucumber to Row Covers ................................................................ 14
Potential Role of Low Tunnels in Michigan Vegetable Production ......................................... 14 Hypothesis and Objectives of the Study ................................................................................... 15
CHAPTER 3: Impact of Low Tunnels on Microclimate and Crop Yield .............................. 16
Abstract ..................................................................................................................................... 17 Introduction ............................................................................................................................... 18 Materials and Methods .............................................................................................................. 20
Experimental Site and Procedures ........................................................................................ 20 Data Collection ..................................................................................................................... 21
Statistical Analysis ................................................................................................................ 32 Results and Discussion .............................................................................................................. 34
Frost Protection ..................................................................................................................... 34
Growing Degree Days........................................................................................................... 39 Light Transmission ............................................................................................................... 39
Tomato Leaf Area ................................................................................................................. 39
Marketable Yields Cucumber ............................................................................................... 42 Marketable Yields Tomato ................................................................................................... 46
Summary and Conclusion ......................................................................................................... 50
Economic Analysis of the Low Tunnels.......................................................... 51 CHAPTER 4:
Abstract ..................................................................................................................................... 52 Introduction ............................................................................................................................... 53 Materials and Methods .............................................................................................................. 54
Marketable Yields ................................................................................................................. 54 Prices ..................................................................................................................................... 54 Costs of Production ............................................................................................................... 55
Revenue and Profitability ..................................................................................................... 55 Results and Discussion .............................................................................................................. 57
Marketable Yield .................................................................................................................. 57
vi
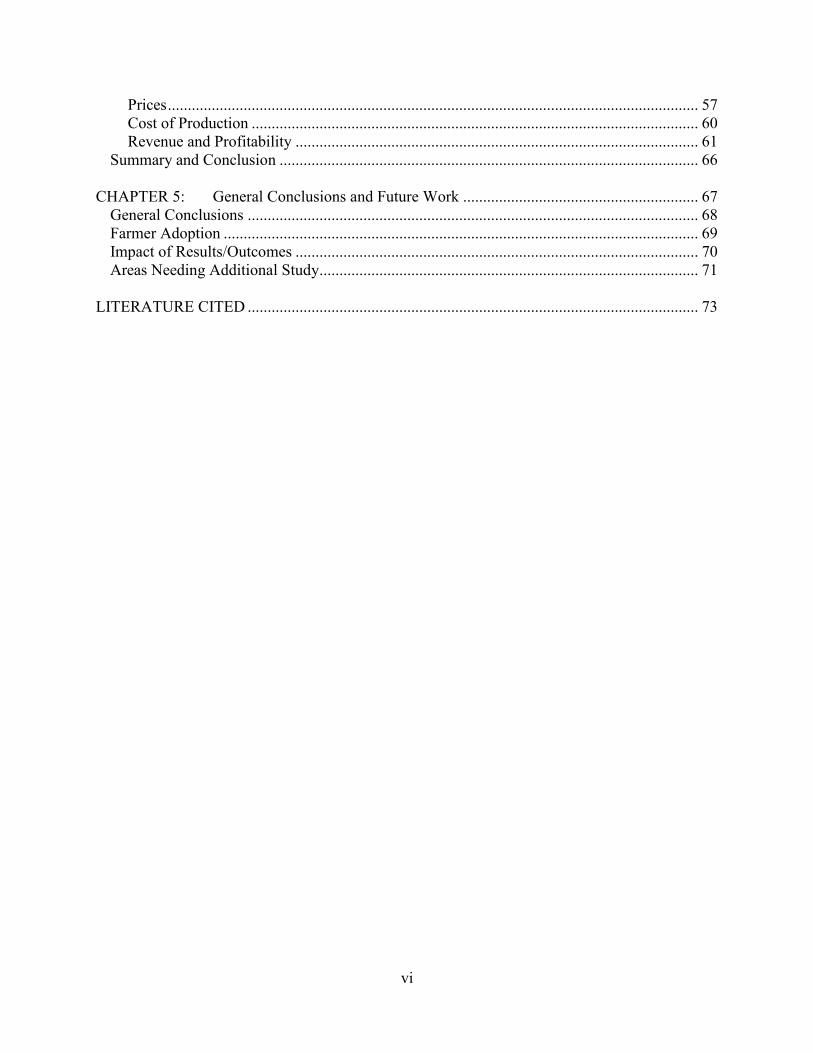
Prices ..................................................................................................................................... 57 Cost of Production ................................................................................................................ 60 Revenue and Profitability ..................................................................................................... 61
Summary and Conclusion ......................................................................................................... 66
CHAPTER 5: General Conclusions and Future Work ........................................................... 67 General Conclusions ................................................................................................................. 68 Farmer Adoption ....................................................................................................................... 69 Impact of Results/Outcomes ..................................................................................................... 70
Areas Needing Additional Study ............................................................................................... 71
LITERATURE CITED ................................................................................................................. 73

vii
LIST OF TABLES
Table 3.1. Field activities schedule for 2010-2012. ...................................................................... 23
Table 3.2. Pesticide application schedule for tomato and cucumber plots in 2010-2012. ............ 24
Table 3.3. Cucumber harvest schedule for 2010-2012. ................................................................ 31
Table 3.4. Tomato harvest schedule for 2010-2012. .................................................................... 33
Table 3.5. Effects of low tunnel configurations on minimum air temperature during frost events.
....................................................................................................................................................... 35
Table 3.6. Effects of low tunnel configurations on cumulative growing degree days (base 10). . 40
Table 3.7.Effects of low tunnel configurations on light (light sensors were only installed in
replication 2. ................................................................................................................................. 41
Table 3.8. Effects of low tunnel configurations on the tomato leaf area. ..................................... 43
Table 3.9. Effects of low tunnel configurations on the total marketable yield of cucumber fruits
on first normal no cover treatment harvest. Number of plants were adjusted to reflect 60 plants
per treatment(15.2 m).................................................................................................................... 44
Table 3.10. Effects of low tunnel configurations on the total marketable yield of cucumber fruits.
Number of plants were adjusted to reflect 60 plants per treatment(15.2 m)................................. 45
Table 3.11. Effects of low tunnel configurations on the total marketable yield of tomato fruits on
first normal no cover treatment harvest. Number of plants were adjusted to reflect 28 plants per
treatment(15.2 m). ......................................................................................................................... 47
Table 3.12. Effects of low tunnel configurations on the total marketable yield of tomato fruits.
Number of plants were adjusted to reflect 28 plants per treatment (15.2 m)................................ 48
Table 4.1. Cucumber weekly marketable yield (unit per 1 1/9 bushel carton), weekly price ($)
and weekly gross revenue ($) for tomatoes grown using various low tunnel systems for 2010-
2012(see table 4.3 for acronyms). ................................................................................................. 58
Table 4.2. Tomato weekly marketable yield (unit per 25 lb carton), weekly price ($) and weekly
gross revenue ($) for tomatoes grown using various low tunnel systems for 2010-2012(see table
4.3 for acronyms). ......................................................................................................................... 59
Table 4.3. Treatment specific costs for equipment, labor, and materials per hectare for all
treatments. ..................................................................................................................................... 62

viii
Table 4.4. Impact of low tunnels on gross revenue for 15.2 m long treatment in production of
slicing cucumbers and fresh market tomatoes in Southwest Michigan in 2010- 2012. ................ 63

ix
LIST OF FIGURES
Figure 1.1. Display of low tunnel installation using tractor implement in April. ........................... 3
Figure 1.2. Display of plastic mulch layer installing plastic mulch and drip tape
(Marketfarm.com, 2014). ................................................................................................................ 5
Figure 1.3. Display of wheel transplanter punching holes and workers planting tomatoes. .......... 6
Figure 3.1. Display of low tunnel installation using implement that lays two materials
simultaneously. ............................................................................................................................. 22
Figure 3.2. Cross sectional diagram of treatments (dual layer, single layer, and no cover
conventional system) and sensor locations. .................................................................................. 30
Figure 3.3. Photo taken on 26 May 2011 to show frost damage in treatment 101. ...................... 36
Figure 3.4. Photo taken on 24 May 2012 to show frost damage in treatment 102, which had the
clear single cover. ......................................................................................................................... 37
Figure 3.5. Air temperatures during April 27, 2012 frost event during a 12 hour period. ........... 38

1
IntroductionCHAPTER 1:

2
For many centuries horticulturists have been challenged by the limitations imposed by
climate on crop production (Well and Loy, 1985). Horticulturists today face the same challenges,
especially in areas with a temperate climate like Michigan. Since the 16th
century, many have
attempted to modify the environment to enhance frost protection and crop growth (Janick, 1979).
Hoophouses and greenhouses are both ways to modify climate, but involve changing
production methods and building infrastructure. Low tunnels can provide many of the same
benefits and still allow for open field planting without large production changes or infrastructure
costs. Low tunnels are plastic covers with a height of up to 46 cm (18 in) that go over the crop
row in the field. They can either be implement or hand installed. Wire hoops are placed over the
crop row by sticking each end into the ground, making a half moon shape. The low tunnel plastic
or row cover materials are then stretched tightly over the wire hoops and soil is placed on the
edges to keep the material in place. Some growers install the wires manually. However, the
plastic is installed using a special tractor attachment (Figure 1.1).
Low tunnels modify microclimate by raising soil and air temperatures. In general, low
tunnels allow shortwave solar radiation to pass through during the day and the plastic material
slows longwave reradiation from the surface at night (Snyder & Melo-Abreu, 2005). The heat
that is absorbed could not easily be passed down into the soil because of the insulation of the air
between the low tunnel, black plastic mulch, and the soils surface. The interior microclimate is
further modified as the tunnel material slows convective mixing over the covered surface,
reducing both sensible and latent energy losses from the surface (any condensation that does
occur on the plastic will release latent heat and warm the plastic) and increasing the ground heat
flux. Additional control over the interior microclimate is possible by changing the color of the
tunnel material (e.g. clear low tunnel plastic has a lower albedo than white plastic, and is more

3
Figure 1.1. Display of low tunnel installation using tractor implement in April.

4
transparent to incoming solar radiation resulting in a potentially warmer environment)) or by
perforating the top or sides of the tunnel to increase convective heat exchange with the surface
(Hanada, 1991 & Oke, 1978).
Row covers or low tunnels can modify crop microclimate by raising temperature and
promoting earlier plant growth (Hochmuth, et al. 2009). By using beds covered with black
plastic mulch together with low tunnels, soil temperatures can be increased, weeds can be
controlled, water can be conserved, and fertilizer application is optimized (Schrader, 2000).
Plastic materials used for row covers are available in different colors, which impact the light
quality and temperatures inside the tunnels. However, it is unknown which low tunnel color,
type, or configuration will provide the most protection and growth enhancement in temperate
climates.
Michigan’s commercial production of fresh marketable vegetables is worth over $175.9
million in annual sales and covers about 19,911 ha (49,200 acres) (USDA, 2013). The Michigan
slicing cucumber (Cucumis sativus L.) industry is valued at $14.4 million annually and the crop
is produced on 1,457 ha (3,600 acres), and the fresh market tomato (Lycopersicon lycopersicum
L.) industry is valued at $16 million annually with 809 ha (2,000 acres). Both crops contribute
significantly to the state economy and are part of the vegetable-crop rotation in Southwest
Michigan, which is the largest production area in the state. When they have enough land some
growers also include a cover crop or agronomic crop in their rotation. Standard production
practice in this region is to use raised beds covered with black plastic mulch. These raised beds
are formed by using a bed shaper-mulch layer, which lays drip tape for irrigation and fertilizing
at the same time as it lays plastic mulch (Figure 1.2). Planting holes are then punched in through
the plastic by hand or using a tractor-mounted wheel transplanter (Figure 1.3). Cucumbers are

5
Figure 1.2. Display of plastic mulch layer installing plastic mulch and drip tape
(Marketfarm.com, 2014).

6
Figure 1.3. Display of wheel transplanter punching holes and workers planting tomatoes.

7
direct seeded with a spacing of 51 cm (20 in) between holes and 2 seeds per hole. Six to
eight week old tomato plants are transplanted with a spacing of 51 cm (20 in). Tomato plants are
staked, tied and pruned when the plants are between 30 cm (12 in) and 51 cm (20 in) (at first
flower). While land preparation for both crops can begin in late March, planting is done from
early May through late June. The earliest plantings have a significant risk of frost damage and
growers often have to replant causing them to miss an earlier harvest and potentially higher
prices.
Michigan’s temperate climate limits vegetable production to May through September.
For warm season crops like tomato and cucumber, this represents a narrow window, since
plants cannot be transplanted or seeded outdoors until after the last frost.
Cucumber and tomato growers are unable to take advantage of the full potential of their
crops for several reasons including : (1) short growing season; (2) most of the crop is planted
and harvested within a short window of time, resulting in peaks in harvest that routinely lead to
low prices; (3) the potential of frost damage is a significant risk for growers who plant earlier to
avoid harvesting in the peak period; and (4) limited alternative methods for season extension . If
growers can successfully modify microclimate they should be able to plant and harvest earlier
and receive higher prices for their crops at the beginning of the season due to the lower supply.
Low tunnels are a strategy growers can use in open field production to limit the risk of frost
damage, thereby allowing them to plant and harvest earlier.
By creating new cropping systems that overcome climate limitations, Michigan’s
commercial fresh market vegetable production acreage can increase and bring more revenue to
the state. Therefore, this study was designed to estimate the potential of various low tunnel
configurations for fresh market cucumber and tomato production under Michigan conditions.

8
Microclimate changes and crop performance were measured and analyzed. Profitability of the
different low tunnel configurations were compared to those of standard field practices using a
plasticulture system in Michigan.

9
Literature ReviewCHAPTER 2:

10
Vegetable Production in Michigan
Michigan growers produce a diverse number of fresh market vegetables, which include
asparagus (Asparagus officinalis L.), snap beans (Phaeolus vulgaris L.), carrots (Daucus carota
var. sativus L.), cantaloupe (Cucumis melo L.), celery (Apium graveolens var. dulce L.) sweet
corn (Zea mays var. saccharata L.), cucumbers (Cucumis sativus L.), onions (Allium cepa L.),
pepper (Capsicum annuum var. annuum L.), tomatoes (Lycopersicon lycopersicum L.),
watermelon (Citrullus lanatus L.), and zucchini (Cucurbita pepo L.),which cover about 19,919
ha (49,200 acres). Michigan is nationally ranked No. 1 for pickling cucumbers and No. 2 for
asparagus, carrot, and fresh market celery (USDA, 2014). Michigan’s slicing cucumbers account
for 6 percent of the U.S. total, and is valued at $14.4 million annually, and planted on 1,457 ha
(3,600 acres), (USDA, 2013). Fresh market tomatoes are valued at $16 million annually with 809
ha (2,000 acres) (USDA, 2013). The value of all Michigan vegetables is approximately $176
million (USDA, 2013).
Since growers in Michigan produce such a great diversity of vegetables, 2-4 year
vegetable-crop rotations are often used, which may include a cover crop when there is enough
land available. Specifically, tomato and cucumber are used in vegetable-crop rotations since they
are stored at the same postharvest temperature. This rotation is used in Southwest Michigan, one
of the largest production areas in the state. Cucumber is a warm season, quickly maturing crop
(maturity days ranging from 50-65 days), while tomatoes are a warm season long maturing crop
(days to maturity ranging from 60-85 from transplants). Land preparation begins as soon as it can
be worked in the spring, which can be as soon as the end of March (MVP, 2014). After fields are
prepared, the standard practice is to use raised beds covered with black plastic mulch. The raised
beds are mechanically formed by a mulch layer attached to a tractor. The bed shaper-mulch layer
11
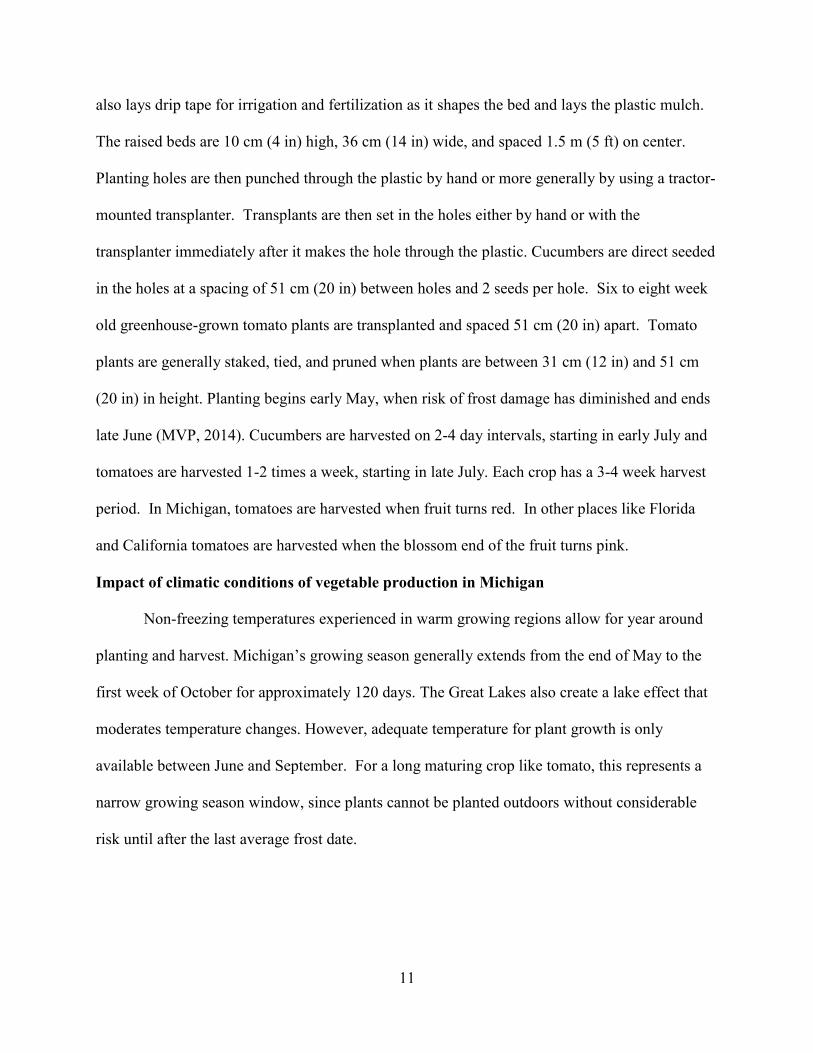
also lays drip tape for irrigation and fertilization as it shapes the bed and lays the plastic mulch.
The raised beds are 10 cm (4 in) high, 36 cm (14 in) wide, and spaced 1.5 m (5 ft) on center.
Planting holes are then punched through the plastic by hand or more generally by using a tractor-
mounted transplanter. Transplants are then set in the holes either by hand or with the
transplanter immediately after it makes the hole through the plastic. Cucumbers are direct seeded
in the holes at a spacing of 51 cm (20 in) between holes and 2 seeds per hole. Six to eight week
old greenhouse-grown tomato plants are transplanted and spaced 51 cm (20 in) apart. Tomato
plants are generally staked, tied, and pruned when plants are between 31 cm (12 in) and 51 cm
(20 in) in height. Planting begins early May, when risk of frost damage has diminished and ends
late June (MVP, 2014). Cucumbers are harvested on 2-4 day intervals, starting in early July and
tomatoes are harvested 1-2 times a week, starting in late July. Each crop has a 3-4 week harvest
period. In Michigan, tomatoes are harvested when fruit turns red. In other places like Florida
and California tomatoes are harvested when the blossom end of the fruit turns pink.
Impact of climatic conditions of vegetable production in Michigan
Non-freezing temperatures experienced in warm growing regions allow for year around
planting and harvest. Michigan’s growing season generally extends from the end of May to the
first week of October for approximately 120 days. The Great Lakes also create a lake effect that
moderates temperature changes. However, adequate temperature for plant growth is only
available between June and September. For a long maturing crop like tomato, this represents a
narrow growing season window, since plants cannot be planted outdoors without considerable
risk until after the last average frost date.

12
Crop Origin and Temperature
Tomatoes are native to western coast of South America, from Ecuador south to Northern
Chile and the Galapagos Islands (Mattoo & Razdan, 2006). The climate in this region of South
America is arid and cool. Cucumbers are of tropical origin and are native to Africa and Asia
(Musmade & Desai, 1998). Hot and humid climates are expected in these regions. The ideal
growing temperature for cucumber is 28 oC, while night temperatures are more critical for flower
production and fruit set with the optimum range of 15 to 20 oC (Swiader & Ware, 2002).
Crop Market Prices in the US
Fresh market tomatoes are grown year-round in the US (Swiader & Ware, 2002). In the
winter, matured green tomatoes are produced in Florida and Mexico, while some greenhouse
tomatoes are grown in Canada. During the spring, tomatoes are imported from the southeast
states, Texas, and Arkansas. Summer into fall is when tomatoes are most readily available and
of the highest quality, produced in Michigan, California, and surrounding states. After the first
fall hard frosts, tomatoes are shipped from California, Mexico, and Florida (USDA-AMS, 2010-
2012).
Slicing cucumbers follow a similar regional trend as the fresh market tomatoes. In the
late fall, winter, and spring cucumbers are imported from Mexico, Honduras, and the Dominican
Republic (USDA-AMS, 2010-2012). During the spring and summer month’s cucumbers are
available from southeast states, such as Georgia and Florida. In the summer, early produced
cucumbers are considered high value in the US and can be harvested in New York, Michigan,
and surrounding states (Swiader & Ware, 2002).

13
Climate Modification in Agriculture
For years, horticulturalists have been challenged by climate limitations and have
experimented with ways to modify climate (Wells and Loy, 1985, Janick, 1979). One way
growers modify climate is by using black plastic mulch on the soil, which has become a standard
growing practice to enhance plant growth and development, along with increasing early and total
yields (Dı´az-Pe´rez, 2010). Other methods of modifying climate are greenhouses, high tunnels,
row covers, and low tunnels, which involved different growing systems and structures (Wells
and Loy, 1993). The first row covers created for field grown crops were made out of parchment
paper and used for protecting early celery plants from wind, cold rain, and frost in the Grand
Rapids and Kalamazoo areas of Michigan (Wittwer and Lucas, 1956). There are many benefits
of modifying microclimate with plastic materials and structures: earlier crop production, higher
yields per unit area, cleaner and higher quality produce, reduced fertilizer leaching , more
efficient fertilizer use , reduced soil and wind erosion, potential decrease in disease, better insect
management , fewer weed problems, reduced soil compaction, and an opportunity to increase
crop maximum efficiency (Lamont, 1993).
Low Tunnels and Climate
Low tunnels are a special type of row cover, supported by wire hoops, with a maximum
height up to 46 cm (18 in) (Penn State, 2014). They are placed over the crop row in the field and
can be either implement or hand installed. Wire hoops are placed over the crop row by sticking
each end into the ground, making a half moon shape. The low tunnel plastic or row cover
materials are then tightly stretched over the wire hoops and soil placed on the edges of the plastic
to keep it in place. However, plastic is installed using a special tractor attachment. Row covers or
low tunnels can modify crop microclimate by increasing air and soil temperatures thus

14
preventing frost damage and promoting earlier plant growth (Hochmuth, et al., 2009). Plastic
mulch combined with low tunnels has increased early and total yields of many horticultural crops
(Wells and Loy, 1985). This combination also increases soil moisture uniformity, along with air
and soil temperatures, providing an improved microclimate for crop growth (Soltani et al., 1995).
Response of Tomato and Cucumber to Row Covers
Some studies have shown inconsistences in growth and yield results for Solanaceous crop
species under row covers (Reiners et al. 1997, Peterson and Taber, 1991, Sotani et al. 1995).
Seasonal variations in yield may be caused by later planting dates correspond to high
temperature fluctuations that negatively affect growth and development (Reiners et al. 1997).
High temperatures above 40 oC for 3 consecutive hours or more increased flower abortion, which
decreased tomato early and total yields under row covers (Peterson and Taber, 1991). Cucurbits
species have responded more favorably to row covers than Solanaceous species (Sotani et al.
1995). Row covers plus black plastic mulch increased cucumber dry weight of plants, yield
earliness, and total yields in cucumbers (Ibarra-Jimenez et al. 2004). However, row covers must
be taken off when plants flower so bees can successfully pollinate the flowers.
Potential Role of Low Tunnels in Michigan Vegetable Production
For centuries horticulturist have been attempting to modify climate (Well and Loy, 1985).
Michigan’s short growing season of less than 120 frost free days makes many growers plant and
harvest at the same time. Since growers are harvesting at the same time, vegetable prices drop
due to is a supply and demand inequity. This price drop can be so low that growers may leave
mature crops in the field, since it costs more for them to harvest and pack then what they would
make. Low tunnels together with plastic mulch are a possible strategy to modify climate
without the high input costs associated with hoophouses and greenhouses. Many others have

15
shown that row covers or low tunnels can modify crop microclimate by increasing air
temperatures and promoting earlier plant growth (Hochmuth, et al., 2009; Ibarra-Jimenez et al.
2004 ).
Hypothesis and Objectives of the Study
We hypothesize that:
- Low tunnels will reduce the risk of frost damage by increasing air temperature under the
tunnel.
- The crop can be planted earlier because of the lowered risk of frost damage.
- The crop will mature earlier compare to standard field production.
- Growers will get increased prices early in the season.
- Total revenue will be better even though total yield may be the same or lower because
market prices are higher.
Specific Objectives of this research are:
- Investigate and validate new low tunnel technologies.
- Conduct an economic analysis of the production systems.
- Deliver information to growers and the scientific community.

16
CHAPTER 3: Impact of Low Tunnels on Microclimate and Crop Yield

17
Abstract
Benefits of single layer clear polyethylene row covers are well documented. However,
few studies have tested other materials especially the possibility to improve frost protection with
multiple layers of row covers. A three year field study was conducted in Benton Harbor,
Michigan to examine the effects of white and clear low tunnel plastics used alone (single layer)
or in combination with a spun-bond material (dual layer) on temperature, growing degree days,
and yield earliness of fresh market tomato and cucumber. The low tunnel treatments were
planted one month earlier than the normal planting date in the region and raised temperatures
between 0.16-4.24oC during frost events. The clear plastic combined with a spun-bond row cover
in a dual-layer system provided the most frost protection and doubled growing degree days
compared to the no cover control treatment. First harvest in the low tunnel treatments was 11 to
17 days earlier than the no cover treatments in all three years.

18
Introduction
Michigan grows many diverse fresh marketable vegetables valued at $175.9 million,
(USDA, 2013). These include asparagus (Asparagus officinalis L.), snap beans (Phaeolus
vulgaris L.), carrots (Daucus carota var. sativus L.), cantaloupe (Cucumis melo L.), celery
(Apium graveolens var. dulce L.) sweet corn (Zea mays var. saccharata L.), cucumbers (Cucumis
sativus L.), onions (Allium cepa L.), pepper (Capsicum annuum var. annuum L.), tomatoes
(Lycopersicon lycopersicum L.), watermelon (Citrullus lanatus L.), and zucchini (Cucurbita
pepo L.). At the national level, Michigan ranks No.1 for pickling cucumber production and No.
2 for asparagus, carrot, and celery production all of which show Michigan’s commitment to
vegetable production (USDA, 2014). Fresh market tomatoes and cucumbers are also important
vegetable in Michigan contributing $16 million and $14.4 million respectively to the state’s
economy (USDA, 2013).
Most of Michigan’s fresh market tomato and cucumber production is concentrated in the
Benton Harbor area. This region is strategically positioned in the southwest corner of the state
and is well connect to major markets in the eastern US. It also has the advantage of being close
to Lake Michigan, a situation that helps moderate the climate. Vegetables in the Benton Harbor
area are planted in a plasticulture system starting in May for first harvest around early and late
July for cucumbers and tomatoes, respectively. Many growers in the region use tomato and
cucumber in a short-term crop rotation. Growers with enough land have a third year with a cover
crop or an agronomic crop such as corn or soybeans.
Michigan’s temperate climate only allows for a short growing season during the year,
with frost-free months in June, July, and September. This three-month period provides a narrow
planting window for growers. This window is especially short for long season crops like

19
tomatoes, which may require between 60 to 85 days from transplanting to maturity. As early as
the 1950s, growers in Michigan and other regions with similar climate have tried modifying
climate with paper row covers to provide protection from wind, cold rain, and frost (Wittwer and
Lucas, 1956). Greenhouses, high tunnels, and row covers have all been used to modify climate
and provide many benefits (Wells and Loy, 1993 Lamont, 1993). Low tunnels are a type of row
cover made from plastic or spun-bound material that growers can use in the field crop row with
wire hoop support (Penn State Extension, 2014). Low tunnels are either manually or
mechanically installed. Wires are installed over the crop row by putting each end into the
ground. The plastic or spun-bond material is snuggly placed over the top of the wires and each
side secured under the soils. Low tunnels are relatively low cost structures compared to fixed
structures like greenhouses or high tunnels. Therefore, they can be used in open field situation
with minimal impact on other practices like crop rotation, fertilization, and pest management.
The goal of this study was to investigate new cropping systems using low tunnels. By
using low tunnels overcome Michigan’s climate limitations by modifying crop climate and
improve profitability of cucumber and tomato. The main objectives were to investigate and
validate new low tunnel technologies that benefited both tomato and cucumber, conduct an
economic analysis of the production system, and deliver information to growers and the
scientific community. We hypothesize that: low tunnels will reduce frost risk, crops can be
planted earlier, crops will mature earlier, growers would get higher prices, and total revenue
would be greater even if total yield remains unchanged.

20
Materials and Methods
Experimental Site and Procedures
Research was conducted at the Southwest Michigan Research and Extension Center
(SWMREC) at Benton Harbor, Michigan, in cooperation with a local grower, who participated in
low tunnel installation and monitoring. The soil type was Spinks loamy sand. The 1-mil
embossed black plastic mulch and drip tape were laid by a plastic mulch layer attached to a
tractor. The raised beds were 10 cm (4 in) high, 36 cm (14 in) wide, and spaced 1.5 m (5 ft) on
center. Slicing cucumber and fresh market tomato were used as model crops in the experiment.
‘Mountain Spring’ tomato transplants were set in place 51 cm (20 in) apart with 28 experimental
plants per treatment. ‘Mariana’ tomatoes were used as guard plants at the start and end of each
tomato plot and in the two outermost guard rows. ‘Speedway’ cucumber was direct-seeded, two
seeds per hole, with the same spacing as the tomato, totaling 60 experimental plants.
Experimental plots were arranged in a randomized complete block design with three replications
and oriented so tomatoes were in the northern half of each treatment and cucumber was in the
southern half of each treatment.
The experiment consisted of six treatments: 1. No row covers-standard system with
normal planting date in May (NCN); 2. No row covers-standard system with early planting date
in April (NCE); 3. Single layer: clear polyethylene plastic row covers (CS); 4. Single layer:
white polyethylene plastic row covers (WS); 5. Dual layer: clear polyethylene plastic and spun-
bond polypropylene row covers (CD); and 6. Dual layer: white polyethylene plastic and spun-
bond polypropylene row covers (WD). The NCE treatment was included for scientific reasons
only since no grower in the region would risk planting unprotected tomato or cucumber in April.
Dual layer treatments included a small band of 76 cm (30 in) wide spun-bond material placed
inside the tunnels, sandwiched between the hoops and the specified plastic. A special implement

21
designed and built by the cooperating grower was used to simultaneously lay the two materials
(Figure 3.1). The clear and white polyethylene plastics were perforated for appropriate
ventilation especially on hot, sunny days. In the early planting date treatments tomato transplants
and cucumber seeds were planted on, 22 April 2010, 26 April 2011, and 24 April 2012. The no
row cover standard system normal planting date plots were planted on 24 May 2010, 27 May
2011, and 24 May 2012 for cucumber and tomato.
Planting holes were punched through the black plastic mulch on the raised beds using a
tractor mounted hole-punching wheel. In order to improve seed germination early in the season,
cucumber seeds were pre-germinated for 2 days in the laboratory. Immediately after planting
tomato or seeding cucumber, 1.6 m (62 in) spring steel wires were manually installed. Then the
1-mil, (weight 65#) 1.8 m (6 ft) wide perforated tunnel plastic and the spun-bond plastic were
laid over the wires and their edges mechanically covered with soil around the periphery of each
plot. The low tunnels were vented prior to tunnel removal to let the plants acclimate. Low
tunnels were removed manually at the end of May, when the tomato plants were touching the top
of the plastic and the threat of frost was past. Tomato plants were pruned by hand, leaving the
first sucker below the first flower cluster and removing all suckers below that point. Field
activities and pesticide applications followed standard grower practices. There was an exception
to this in 2012 when bacterial symptoms appeared on 22 June, and then Agrimycin
(Streptomycin sulfate) was applied as a research application (Tables 3.1 & 3.2).
Data Collection
Air temperature was recorded with a WatchDog B1-2 Temp/RH Logger (Spectrum
Technologies, Inc.) at a height of 15 cm (6 in) above the bed in each treatment with the logger

22
Figure 3.1. Display of low tunnel installation using implement that lays two materials simultaneously.

23
Table 3.1. Field activities schedule for 2010-2012.
Activity 2010 2011 2012
Pre-germinated cucumber seeds in lab. - 24-Apr 22-Apr
Tomato Transplants and cucumber seeds were planted on
black mulch raised bed. 22-Apr 26-Apr 24-Apr
Installed temperature, relative humidity, and light
sensors. 22-Apr 26-Apr 24-Apr
Installed low tunnels. 22-Apr 26-Apr 24-Apr
Sampled tomato transplants. 22-Apr 26-Apr 24-Apr
Vented low tunnels. - 20-May 22-May
Removed low tunnels. 24-May 3-Jun 24-May
Replanted missing cucumber plants within all treatments. 24-May - -
Planted cucumber seeds and tomato transplants within
normal planting date control treatments. 24-May 27-May 24-May
Tomato transplants planted in April are starting to
flower. 24-May 27-May 24-May
Removed 2 plants per treatment for sample. 24-May 27-May 24-May
Replanted tomato transplants in the normal planting date
control treatments. 28-May - -
Took tomato plant heights. 28-May 27-May 24-May
Reduced tomato plants to two shoots, leaving the 1st
sucker below the 1st flower. 28-May 3-Jun -
Thinned cucumbers planted in April to two plants per
hole. - 27-May 24-May
Tomato plants were staked. 2-Jun 23-May -
Sensors removed. 4-Jun 3-Jun 24-May
Took tomato plant heights. 10-Jun 3-Jun 31-May
Thinned cucumbers planted in May to two plants per
hole. 10-Jun 3-Jun 31-May
Cucumber plants planted in April are starting to flower. 10-Jun 13-Jun -

24
Table 3.2. Pesticide application schedule for tomato and cucumber plots in 2010-2012.
Application Date Pesticide(s) Rate (per acre)
4-June-2010 Champ 2 pt
Dithane 3 lb
Thiodan 1.5 lb
11-June-2010 Asana 6 oz
Champ 1.5 pt
Penncozeb 1.5 lb
18-June-2010 Champ 1 1/3 pt
Penncozeb 2 lb
Warrior 2 oz
29-June-2010 Champ 1 1/3 pt
Penncozeb 2 lb
Warrior 2.75 oz
12-July-2010 Champ 1 1/3 pt
Penncozeb 2 lb
Thiodan 1 lb
21-July-2010 Chlorolin 2 pt
Nu-Cop 2 pt
21-July-2010 Chlorolin 3 pt
Nu-Cop 2 pt
4-August-2010 Chlorolin 1.5 pt
Nu-Cop 1.5 pt
Thiodan 1 1/3 lb
20-August-2010 Chlorolin 1.5 pt
Kelthane 1 pt
Nu-Cop 1.5 pt
Thiodan 1 1/3 lb

25
Table 3.2 (cont’d)
Application Date Pesticide(s) Rate (per acre)
10-June-2011 Asana XL 6 oz
Champ 1.5 pt
Dithane 2 lb
6/21-June-2011 Asana XL 6 oz
Manzate 2 lb
Nu-Cop 50 2.5 lb
30-June-2011 Ambush 8 oz
Manzate 2 lb
Tenn-Cop 3 pt
12-July-2011 Asana XL 6 oz
Manzate 1.5 lb
Tenn-Cop 3 pt
20-July-2011 Bravo 720 2.5 pt
Lannate 1.5 pt
Tenn-Cop 3 pt
29-July-2011 Bravo 720 2.5 pt
Lannate 1.5 pt
Nu-Cop 3L 2 pt
12-August-2011 Brigade 5.5 oz
Chloranil 720 2 pt
Nu-Cop 3L 3.5 pt
R-56 4 oz/100 gal of water
19-August-2011 Chloranil 720 3 pts
Nu-Cop 3L 3 pts
R-56 8 oz/100 gal of water
26-August-2011 Chloranil 720 3 pt
Nu-Cop 3L 3 pt

26
Table 3.2 (cont’d)
Application Date Pesticide(s) Rate (per acre)
23-May-2012 NuCop 50 3 lb
Dithane 2 lb
31-May-2012 NuCop 50 3 lb
Penncozeb 75 DF 2 lb
7-June-2012 NuCop 50 3 lb
Penncozeb 75 DF 2 lb
15-June-2012 NuCop 3L 2 pt
Penncozeb 75 DF 2 lb
22-June-2012 NuCop 3L 2 pts
Penncozeb 75 DF 2 lbs
22-June-2012 Agrimycin 17 8 oz/50 gal of water (200
ppm)
27-June-2012 Agrimycin 17 8 oz/50 gal of water (200
ppm)
Mycoshield 8 oz/50 gal of water (200
ppm)
3-July-2012 Agrimycin 17 8 oz/50 gal of water (200
ppm)
Mycoshield 8 oz/50 gal of water (200
ppm)
3-July-2012 NuCop 3L 2 pt
Chloronil 720 2 pt
Asana 6 oz
10-July-2012 Agrimycin 17 8 oz/50 gal of water (200
ppm)
Mycoshield 8 oz/50 gal of water (200
ppm)
11-July-2012 NuCop 3L 2 pt
Chloronil 720 2 pt
Lannate 1.5 pt
13-July-2012 Agrimycin 17 8 oz/50 gal of water (200
ppm)
Mycoshield 8 oz/50 gal of water (200
ppm)
17-July-2012 Agrimycin 17 8 oz/50 gal of water (200
ppm) Mycoshield 8 oz/50 gal of water (200
ppm)

27
Table 3.2 (cont’d)
Application Date Pesticide(s) Rate (per acre)
19-July-2012 Agrimycin 17 8 oz/50 gal of water (200 ppm)
Mycoshield 8 oz/50 gal of water (200 ppm)
20-July-2012 NuCop 3L 2 pt
Chloronil 720 2 pt
Asana 6 oz
24-July-2012 Agrimycin 17 8 oz/50 gal of water (200 ppm)
Mycoshield 8 oz/50 gal of water (200 ppm)
Agrimek 10 oz
27-July-2012 Agrimycin 17 8 oz/50 gal of water (200 ppm)
Mycoshield 8 oz/50 gal of water (200 ppm)
27-July-2012 NuCop 3L 2 pt
Chloronil 720 2 pt
Presidio 4 oz
Provado 5 oz
1-August-2012 Agrimycin 17 8 oz/50 gal of water (200 ppm)
Mycoshield 8 oz/50 gal of water (200 ppm)
3-August-2012 Agrimycin 17 8 oz/50 gal of water (200 ppm)
Mycoshield 8 oz/50 gal of water (200 ppm))
3-August-2012 NuCop 2 pt
Quadris 12 oz
Previcure Flex 1.2 pt
7-August-2012 Agrimycin 17 8 oz/50 gal of water (200 ppm)
Mycoshield 8 oz/50 gal of water (200 ppm)
14-August-2012 Agrimycin 17 8 oz/50 gal of water (200 ppm)
Mycoshield 8 oz/50 gal of water (200 ppm)
Agrimek 12 oz
14-August-2012 NuCop 3L 2 pt
Chloronil 720 2 pt
Presidio 4 oz
Asana 8 oz

28
Table 3.2 (cont’d)
Application Date Pesticide(s) Rate (per acre)
14-August-2012 Agrimycin 17 8 oz/50 gal of water (200 ppm)
Mycoshield 8 oz/50 gal of water (200 ppm)
Agrimek 12 oz
14-August-2012 NuCop 3L 2 pt
Chloronil 720 2 pt
Presidio 4 oz
Asana 8 oz
16-August-2012 Agrimycin 17 8 oz/50 gal of water (200 ppm)
Mycoshield 8 oz/50 gal of water (200 ppm)
24-August-2012 Agrimycin 17 8 oz/50 gal of water (200 ppm)
Mycoshield 8 oz/50 gal of water (200 ppm)
28-August-2012 Agrimycin 17 8 oz/50 gal of water (200 ppm)
Mycoshield 8 oz/50 gal of water (200 ppm)

29
facing north. Growing degree days (GDD) were calculated by taking the average day
temperature minus 10oC. Temperatures below 10
oC were given the value of zero for the day.
Cumulative GDD were summed from the day after planting until low tunnels were vented or
removed. Photosynthetically active radiation (PAR) was recorded with a WatchDog 1000 Series
Logger connected to a LightScout Quantum Light Sensor (Spectrum Technologies, Inc.) at a
height of 25 cm (10 in) in replication two. The data loggers and sensors were placed on a stake
(Figure 3.2) at the center of each tomato treatment. Sensor data were collected every 30 min
starting at 6 pm on the day the low tunnels were installed until the low tunnels were completely
removed.
Frost damage was assessed by taking a stand count after the low tunnels had been
removed. The 24th
and 28th
tomato plant were sampled for growth analysis (branch count, fresh
and dry weight, and leaf area measurements). All branches with more than one fully expanded
leaf were counted. The area of all the leaves was measured by a LI-3100 Area Meter (LI-COR
Environmental, 4647 Superior Street, P.O. Box 4425, Lincoln, NE). Measurements were also
obtained from the normal planting date treatments.
Cucumbers were harvested 12 times from the early planted treatments and 9 times from
the late planted treatments in 2010, 16 times for the early planted treatments and 11 times from
the late planted treatments in 2011, and 13 times for the early planted treatments and 9 from the
late planted treatments in 2012 (Table 3.3). Harvest took place twice per week. Cucumbers were
separated in to Grade 1(US No. 1), Grade 2 (US No. 2), and cull (Unclassified) (USDA-AMS
1958). Fruit within each grade from each treatment were counted and weighed.
Tomatoes were harvested eight times for the early planted treatments in 2010 and 2011 and nine
times in 2012, while the late planted treatments were harvested five times in 2010, and seven

30
B: Air Temp at 15 cm (6 in) above the bed (All Replications)
C: Light sensor at 25 cm (10 in) above the bed (2nd
replication only)
Dual Layer
(Row cover + plastic)
Perforated plastic row cover Spun-woven row cover
Single Layer
(Plastic)
No cover
B
C
B
C
B
C
Figure 3.2. Cross sectional diagram of treatments (dual layer, single layer, and no cover
conventional system) and sensor locations.
31
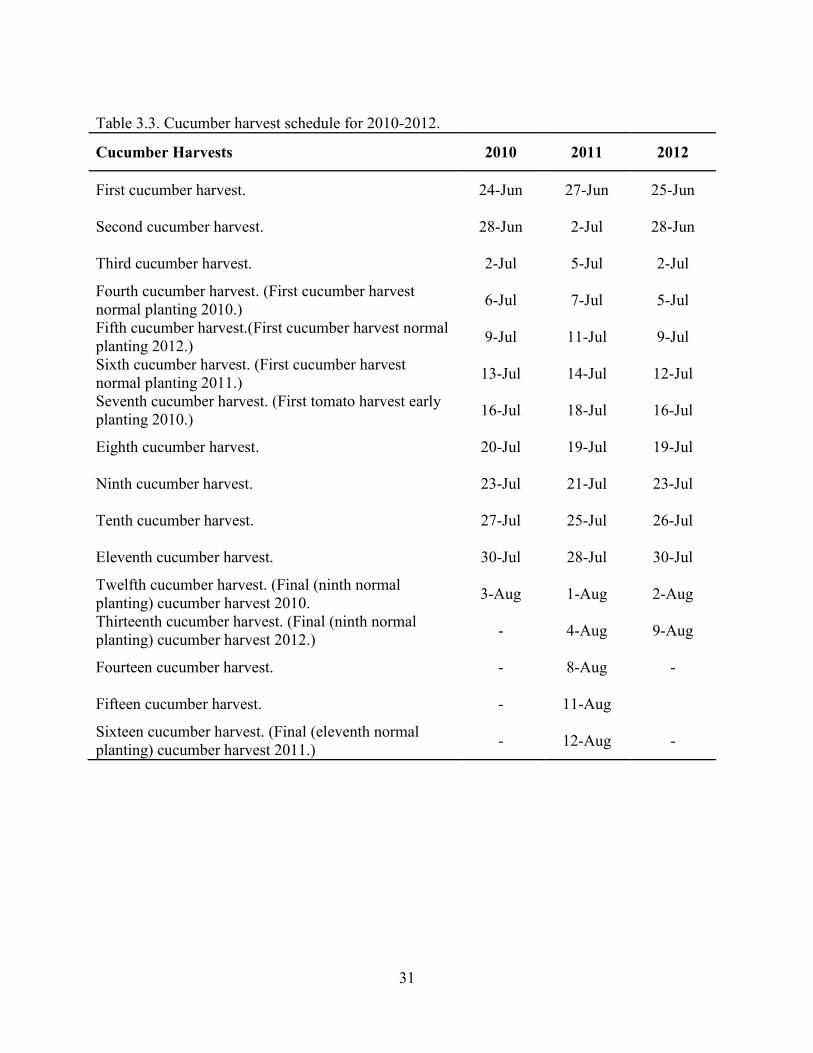
Table 3.3. Cucumber harvest schedule for 2010-2012.
Cucumber Harvests 2010 2011 2012
First cucumber harvest. 24-Jun 27-Jun 25-Jun
Second cucumber harvest. 28-Jun 2-Jul 28-Jun
Third cucumber harvest. 2-Jul 5-Jul 2-Jul
Fourth cucumber harvest. (First cucumber harvest
normal planting 2010.) 6-Jul 7-Jul 5-Jul
Fifth cucumber harvest.(First cucumber harvest normal
planting 2012.) 9-Jul 11-Jul 9-Jul
Sixth cucumber harvest. (First cucumber harvest
normal planting 2011.) 13-Jul 14-Jul 12-Jul
Seventh cucumber harvest. (First tomato harvest early
planting 2010.) 16-Jul 18-Jul 16-Jul
Eighth cucumber harvest. 20-Jul 19-Jul 19-Jul
Ninth cucumber harvest. 23-Jul 21-Jul 23-Jul
Tenth cucumber harvest. 27-Jul 25-Jul 26-Jul
Eleventh cucumber harvest. 30-Jul 28-Jul 30-Jul
Twelfth cucumber harvest. (Final (ninth normal
planting) cucumber harvest 2010. 3-Aug 1-Aug 2-Aug
Thirteenth cucumber harvest. (Final (ninth normal
planting) cucumber harvest 2012.) - 4-Aug 9-Aug
Fourteen cucumber harvest. - 8-Aug -
Fifteen cucumber harvest. - 11-Aug
Sixteen cucumber harvest. (Final (eleventh normal
planting) cucumber harvest 2011.) - 12-Aug -

32
times in 2011 and 2012 (Table 3.4). Harvest took place once or twice per week. Tomatoes were
separated into Grade 1 Large (US No.1), Grade 1 Small (US No.1), Grade 2 (US No. 2), and cull
(Unclassified) (USDA-AMS 1991). The fruit within each grade and from each treatment were
counted and weighed. On the last harvest date all fruit were separated into mature fruit (red or
pink color at the blossom end) and green fruit. Plants were destructively harvested and fresh
above-ground biomass was weighed.
Statistical Analysis
The data were analyzed using the GLM (general linear model) procedure in SAS (version
9.2) to generate ANOVA (analysis of variance) tables and Fisher’s LSD (least significant
difference) was used to determine the significance of differences between means. Differences
were considered significant at P ≤ 0.05.

33
Table 3.4. Tomato harvest schedule for 2010-2012.
Tomato Harvests 2010 2011 2012
First tomato harvest. 16-Jul 19-Jul 12-Jul
Second tomato harvest. 20-Jul 25-Jul 19-Jul
Third tomato harvest. (First tomato harvest normal
planting 2011 and 2012.) 23-Jul 1-Aug 23-Jul
Fourth tomato harvest. 27-Jul 4-Aug 26-Jul
Fifth tomato harvest. (First tomato harvest normal
planting 2010.) 30-Jul 8-Aug 2-Aug
Sixth tomato harvest. 3-Aug 15-Aug 9-Aug
Seventh tomato harvest. 6-Aug 22-Aug 14-Aug
Eighth tomato harvest. (Final early planting tomato
harvest 2010 and 2011.) 13-Aug 30-Aug 22-Aug
Final tomato harvest normal planting 2010 (fifth) and
2011 (seventh). 23-Aug 7-Sep -
Final tomato harvest normal (seventh) and early (ninth)
planting 2012. - - 29-Aug

34
Results and Discussion
Frost Protection
In 2010, there were two frost events on 28 April and 10 May. Minimum temperatures
were -2.89 oC and -1.22
oC, respectively. During both events, the low tunnel treatment covered
with the clear dual layer system (CD) was 2oC warmer compared to the control treatment (NCE).
The other low tunnel treatments were less effective, but were 0.16-1.13 oC warmer (Table 3.5).
Similar results and frost events took place 5 and 16 May 2011 2011. During these events all low
tunnel treatments were significantly warmer by 1.83-4.24 oC compared to the control. Frost
damage in the NCE treatment was evident in the field, since frost damaged plants were less
developed compared to covered plants (Figure 3.3).
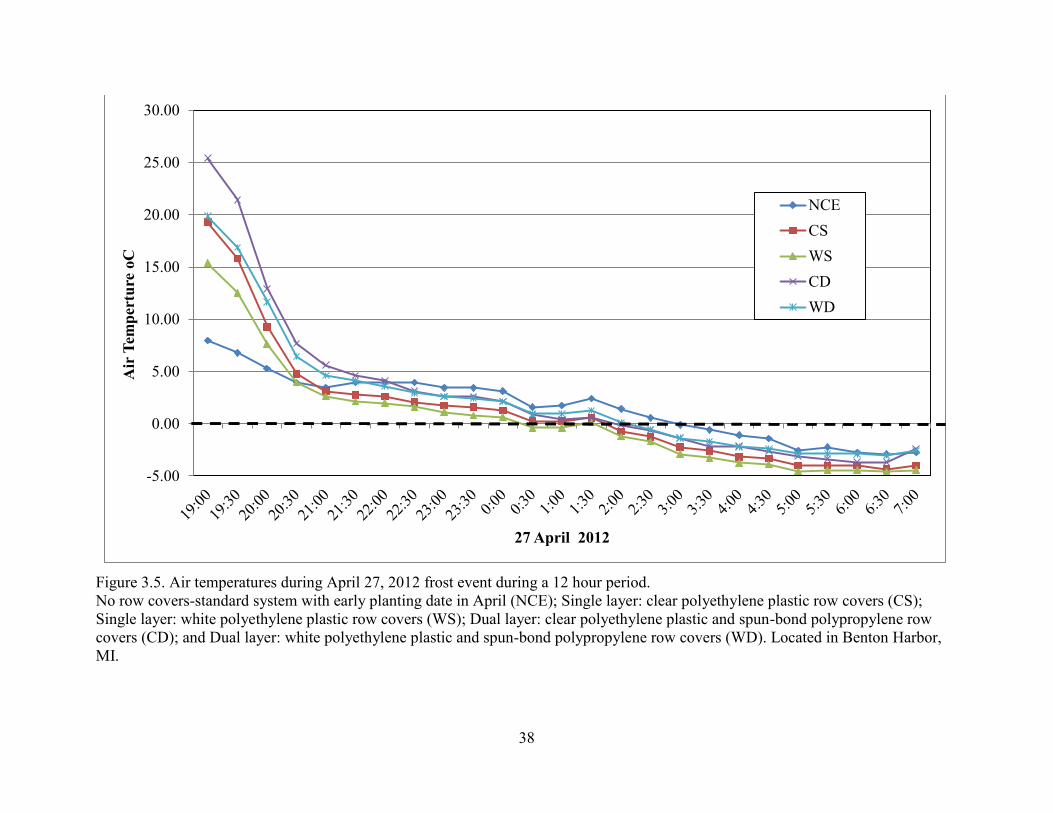
Under certain conditions air temperatures in low tunnels could be lower than the ambient
air temperature. One example of such an occurrence took place 27 April 2012 the only frost
event during the 2012 growing season (Figure 3.4). During this event the ambient air
temperature was higher in the NCE (open air) treatment compared to all the low tunnel
treatments (Figure 3.5). Conditions and explanations for this unique frost are not readily
apparent. However, a similar observation was reported by Wien (2009) on studies using high
tunnels. During daylight infrared (IR) energy produced by the sun increases the temperature
within the low tunnels, which exceeds the transmittance of the energy leaving the low tunnel.
Different types of plastics can transmit more or less IR energy depending on its transparency
(Wien, 2009). The temperature decrease in the low tunnels below the outside ambient air
temperature was likely caused by the property of plastic which transmits infrared radiation with
long wavelength (Baytown, 1994). Therefore, the more IR energy that is lost the lower the
temperature with in the low tunnel. Wells and Loy (1985) explain that almost 70% of the thermal

35
Table 3.5. Effects of low tunnel configurations on minimum air temperature during frost events.
Treatment1
Minimum Air Temperature (oC)
2010 2011 2012
28-Apr-10
5:30
10-May-10
5:30
5-May-2011
6:00
16-May-11
3:30
27-Apr-2012
6:30
NCE -2.89d -1.22d -2.76d -0.09c -2.93a
CS -2.39cd -1.06cd -0.93c 1.57b -4.33b
WS -1.93bc -0.39bc -0.72c 1.28b -4.59b
CD -0.89a 0.67a 1.48a 2.48a -3.43ab
WD -1.76b -0.09 b 0.78b 2.28a -3.06a 2PR>F= 0.0008 0.0012 <0.0001 0.6823 0.0427
LSD 0.6244 0.678 0.6616 0.0002 1.2165 1
No row covers-standard system with early planting date in April (NCE); Single layer: clear
polyethylene plastic row covers (CS); Single layer: white polyethylene plastic row covers (WS);
Dual layer: clear polyethylene plastic and spun-bond polypropylene row covers (CD); and Dual
layer: white polyethylene plastic and spun-bond polypropylene row covers (WD).Located in
Benton Harbor, MI. 2
Means within each column followed by the same letter are not significantly different at
P ≤ 0.05.

36
Figure 3.3. Photo taken on 26 May 2011 to show frost damage in treatment 101.

37
Figure 3.4. Photo taken on 24 May 2012 to show frost damage in treatment 102, which had the
clear single cover.
38
Figure 3.5. Air temperatures during April 27, 2012 frost event during a 12 hour period.
No row covers-standard system with early planting date in April (NCE); Single layer: clear polyethylene plastic row covers (CS);
Single layer: white polyethylene plastic row covers (WS); Dual layer: clear polyethylene plastic and spun-bond polypropylene row
covers (CD); and Dual layer: white polyethylene plastic and spun-bond polypropylene row covers (WD). Located in Benton Harbor,
MI.
-5.00
0.00
5.00
10.00
15.00
20.00
25.00
30.00A
ir T
emp
ertu
re o
C
27 April 2012
NCE
CS
WS
CD
WD

39
radiation is transmitted by polyethylene covers the single low tunnel covers (CS and WS) are not
maintaining the night temperature around the plant.
Growing Degree Days
In 2010, the control treatment (NCE) accumulated 159.23 growing degree days, while the
CD low tunnel treatment accumulated 317.10. All low tunnel treatments were significantly
higher compared to the control treatment (NCE) with accumulations of 260.68, 244.11, and
257.93 for the CS, WS, and WD treatments. Similarly in 2011, the CD treatment accumulated
the most growing degree days, which was twice as many as the NCE treatment. The low tunnel
treatments accumulated significantly more growing degree days compared to the NCE treatment
in all three years and were all significantly different compared to the NCE treatment (Table 3.6).
Light Transmission
While PAR light levels are dependent on the number of cloudy days versus sunny days,
the control treatments had the most light transmission of 715.55 uM/m^2s and 710.69 uM/m^2s
in 2010 and 2011, respectively. This was to be expected since all low tunnel materials transmit
less than 100% of the light, as a no cover treatment. All three years have similar results with the
control early treatment having the most PAR light transmission followed by the CS, CD, WS,
and WD treatments (Table 3.7).
Tomato Leaf Area
Leaf area can be affected by solar radiation, but also by day and night air temperatures,
which play an essential role in determining potential crop growth under limiting climatic
conditions (Sandri, et al. 2003). In 2010, the CD and WD treatments had the highest leaf area
values at 1292.8 cm2
and 964.2 cm2
per plant, while the NCE treatment had the lowest leaf area
of 86.9cm2 per plant. This was true for both 2011 and 2012, even with the unique frost event that

40
Table 3.6. Effects of low tunnel configurations on cumulative growing degree days (base 10).
Cumulative Growing Degree Days (oC)
Treatment1 2010 2011 2012
NCE 159.23c 154.59d 163.93d
CS 260.68b 276.73b 330.53b
WS 244.11b 226.56c 270.98
CD 317.10a 324.03a 367.64a
WD 257.93 b 269.43b 287.636c 2PR>F= <0.0001 <0.0001 <0.0001
LSD 22.06 12.313 22.658 1
No row covers-standard system with early planting date in April (NCE); Single layer: clear
polyethylene plastic row covers (CS); Single layer: white polyethylene plastic row covers (WS);
Dual layer: clear polyethylene plastic and spun-bond polypropylene row covers (CD); and Dual
layer: white polyethylene plastic and spun-bond polypropylene row covers (WD). Located in
Benton Harbor, MI. 2
Means within each column followed by the same letter are not significantly different at
P ≤ 0.05.

41
Table 3.7.Effects of low tunnel configurations on light (light sensors were only installed in
replication 2.
Average PAR Light (uM/m^2s)
Treatment1 2010 2011 2012
NCE 715.55 710.69 N/A*
CS 642.99 675.78 N/A*
WS 413.65 455.14 438.97
CD 571.14 561.96 604.11
WD 361.19 439.99 377.47 2PR>F= N/A N/A N/A
LSD N/A N/A N/A
* Data unavailable due to sensor malfunction 1
No row covers-standard system with early planting date in April (NCE); Single layer: clear
polyethylene plastic row covers (CS); Single layer: white polyethylene plastic row covers (WS);
Dual layer: clear polyethylene plastic and spun-bond polypropylene row covers (CD); and Dual
layer: white polyethylene plastic and spun-bond polypropylene row covers (WD). Located in
Benton Harbor, MI. 2
Means within each column followed by the same letter are not significantly different at
P ≤ 0.05.

42
took place in 2012 (Table 3.8). Larger leaves are produced to capture more light by the
plant, indicating that light levels or quality under these low tunnel treatments were lower than
those in other treatments. The light saturation point is when increased light levels no longer lead
to an increase rate of photosynthesis. Similar yields amongst all low tunnel treatments show light
levels were sufficient.
Marketable Yields Cucumber
In 2010, the low tunnel treatments for cucumber were first harvested 24 June, while the
NCN planting date treatment was first harvested 6 July. The cucumber CS treatment had the
greatest yield for the season; while the CD treatment was second highest (Tables 3.9 and 3.10).
At the end of the season; however, there was no difference in total cumulative yield amongst
treatments. The similarities in cucumber yield could be because missing plants in the majority of
the treatments had to be replanted during the normal planting time. This is a routine practices
used by many growers.
The low tunnel treatments for cucumber were first harvested on 27 June 2011, while the
NCN planting date crop was first harvested on 14 July 2011, representing more than two weeks
of earliness. The cucumber CD treatment had the greatest yield for the majority of the season;
while the CS treatment was second highest (Tables 3.9 and 3.10). Again, total marketable yields
at the end of the season were similar. This result confirmed that the main impact of the row
covers was on earliness, which may result in significant economic benefit to the grower, when
early harvest prices are higher. Growers who harvest their cucumbers early in the season may
also limit losses due to downy mildew-a devastating disease of cucumbers in the region.
The low tunnel treatments for cucumber were first harvested on 25 June 2012, while the
NCN planting date treatment was not harvested until 9 July 2012. During the 2012 season, yields

43
Table 3.8. Effects of low tunnel configurations on the tomato leaf area.
Average Leaf Area(cm
2/plant)
Treatment1 2010 2011 2012
NCE 86.9 c 118.2 c 470.0 bc
CS 942.2 a 734.5 ab 25.2 c
WS 511.4 b 593.7 b 171.6 c
CD 1292.8 a 925.5 a 870.3 ab
WD 964.2 a 856.6 ab 1264.7 a
2PR>F= 0.0006 0.0090 0.0061
LSD 370.37 269.45 577.68 1
No row covers-standard system with early planting date in April (NCE); Single layer: clear
polyethylene plastic row covers (CS); Single layer: white polyethylene plastic row covers (WS);
Dual layer: clear polyethylene plastic and spun-bond polypropylene row covers (CD); and Dual
layer: white polyethylene plastic and spun-bond polypropylene row covers (WD). 2
Means within each column followed by the same letter are not significantly different at
P ≤ 0.05.

44
Table 3.9. Effects of low tunnel configurations on the total marketable yield of cucumber fruits
on first normal no cover treatment harvest. Number of plants were adjusted to reflect 60 plants
per treatment(15.2 m).
1 No row covers-standard system with normal planting date in May (NCN); Single layer: clear
polyethylene plastic row covers (CS); Single layer: white polyethylene plastic row covers (WS);
Dual layer: clear polyethylene plastic and spun-bond polypropylene row covers (CD); and Dual
layer: white polyethylene plastic and spun-bond polypropylene row covers (WD). Located in
Benton Harbor, MI. 2
Means within each column followed by the same letter are not significantly different at
P ≤ 0.05.
Marketable Yield per treatment (kg)
Treatment1 6-July-10 14-July-11 9-July-12
NCN 0.28 c 9.52 c 4.46 b
NCE 9.49 bc 67.33 b 39.14 a
CS 50.25 a 114.35 a 31.34 a
WS 20.78 bc 74.14 ab 34.99 a
CD 32.63 ab 115.38 a 26.99 a
WD 15.91 bc 86.72 ab 27.85 a
2PR>F= 0.0119 0.0048 0.0164
LSD 24.188 46.678 17.375

45
Table 3.10. Effects of low tunnel configurations on the total marketable yield of cucumber fruits.
Number of plants were adjusted to reflect 60 plants per treatment(15.2 m).
Marketable Yield per treatment (kg)
Treatment1 2010 2011 2012
NCN 112.89 a 247.03 a 179.47 a
NCE 122.49 a 234.96 a 162.42 abc
CS 130.35 a 295.90 a 131.73 bc
WS 127.15 a 267.72 a 167.03 ab
CD 129.77 a 317.31 a 117.08 c
WD 126.23 a 248.44 a 151.50 abc
2PR>F= 0.75 0.3548 0.0917
LSD 23.651 90.084 45.42 1
No row covers-standard system with normal planting date in May (NCN); Single layer: clear
polyethylene plastic row covers (CS); Single layer: white polyethylene plastic row covers (WS);
Dual layer: clear polyethylene plastic and spun-bond polypropylene row covers (CD); and Dual
layer: white polyethylene plastic and spun-bond polypropylene row covers (WD). Located in
Benton Harbor, MI. 2
Means within each column followed by the same letter are not significantly different at
P ≤ 0.05.
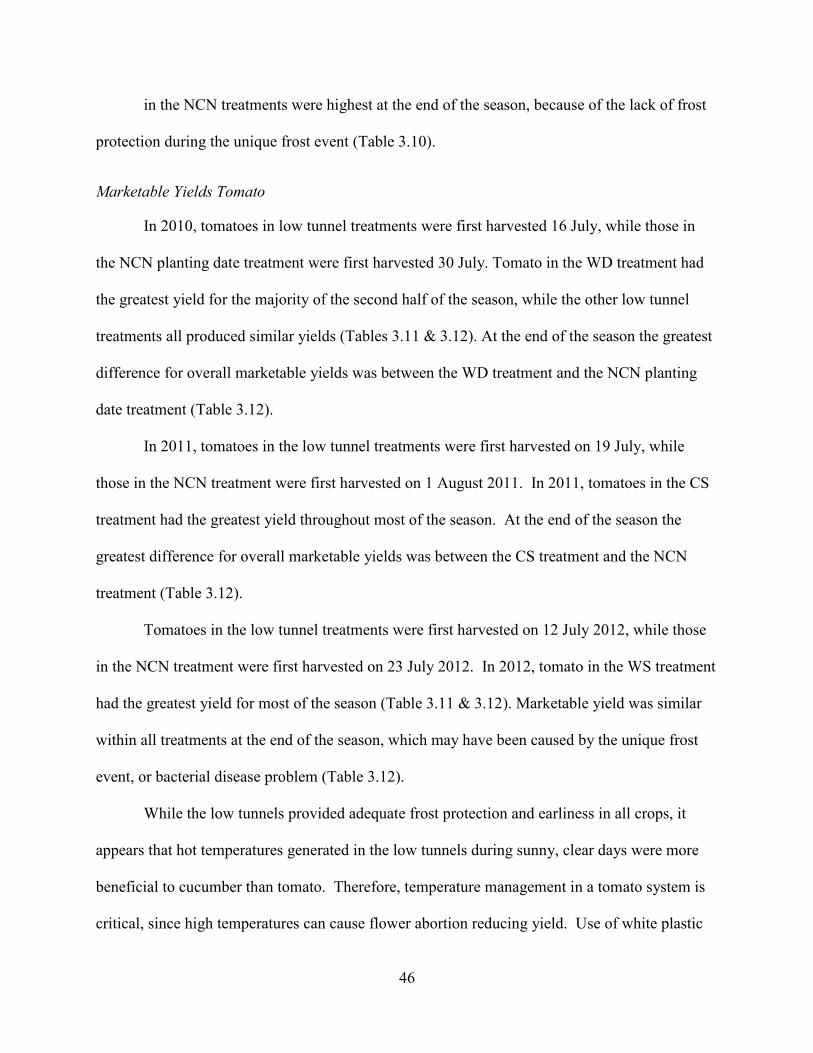
46
in the NCN treatments were highest at the end of the season, because of the lack of frost
protection during the unique frost event (Table 3.10).
Marketable Yields Tomato
In 2010, tomatoes in low tunnel treatments were first harvested 16 July, while those in
the NCN planting date treatment were first harvested 30 July. Tomato in the WD treatment had
the greatest yield for the majority of the second half of the season, while the other low tunnel
treatments all produced similar yields (Tables 3.11 & 3.12). At the end of the season the greatest
difference for overall marketable yields was between the WD treatment and the NCN planting
date treatment (Table 3.12).
In 2011, tomatoes in the low tunnel treatments were first harvested on 19 July, while
those in the NCN treatment were first harvested on 1 August 2011. In 2011, tomatoes in the CS
treatment had the greatest yield throughout most of the season. At the end of the season the
greatest difference for overall marketable yields was between the CS treatment and the NCN
treatment (Table 3.12).
Tomatoes in the low tunnel treatments were first harvested on 12 July 2012, while those
in the NCN treatment were first harvested on 23 July 2012. In 2012, tomato in the WS treatment
had the greatest yield for most of the season (Table 3.11 & 3.12). Marketable yield was similar
within all treatments at the end of the season, which may have been caused by the unique frost
event, or bacterial disease problem (Table 3.12).
While the low tunnels provided adequate frost protection and earliness in all crops, it
appears that hot temperatures generated in the low tunnels during sunny, clear days were more
beneficial to cucumber than tomato. Therefore, temperature management in a tomato system is
critical, since high temperatures can cause flower abortion reducing yield. Use of white plastic
47
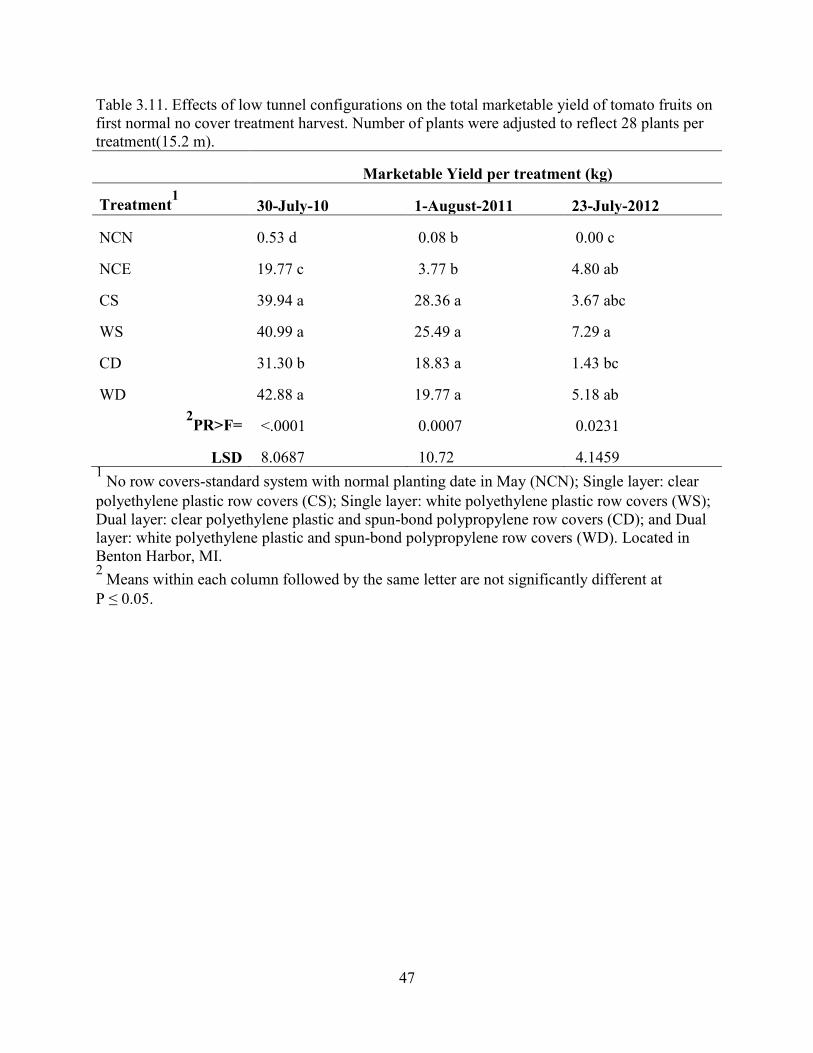
Table 3.11. Effects of low tunnel configurations on the total marketable yield of tomato fruits on
first normal no cover treatment harvest. Number of plants were adjusted to reflect 28 plants per
treatment(15.2 m).
Marketable Yield per treatment (kg)
Treatment1 30-July-10 1-August-2011 23-July-2012
NCN 0.53 d 0.08 b 0.00 c
NCE 19.77 c 3.77 b 4.80 ab
CS 39.94 a 28.36 a 3.67 abc
WS 40.99 a 25.49 a 7.29 a
CD 31.30 b 18.83 a 1.43 bc
WD 42.88 a 19.77 a 5.18 ab
2PR>F= <.0001 0.0007 0.0231
LSD 8.0687 10.72 4.1459 1
No row covers-standard system with normal planting date in May (NCN); Single layer: clear
polyethylene plastic row covers (CS); Single layer: white polyethylene plastic row covers (WS);
Dual layer: clear polyethylene plastic and spun-bond polypropylene row covers (CD); and Dual
layer: white polyethylene plastic and spun-bond polypropylene row covers (WD). Located in
Benton Harbor, MI. 2
Means within each column followed by the same letter are not significantly different at
P ≤ 0.05.

48
Table 3.12. Effects of low tunnel configurations on the total marketable yield of tomato fruits.
Number of plants were adjusted to reflect 28 plants per treatment (15.2 m).
Marketable Yield per treatment (kg)
Treatment1 2010 2011 2012
NCN 43.76 b 21.65 c 17.16 a
NCE 62.81 a 38.19 bc 14.71 a
CS 58.81 a 68.91 a 17.62 a
WS 63.47 a 60.82 ab 19.12 a
CD 55.36 ab 59.45 ab 9.90 a
WD 67.66 a 45.73 abc 14.65 a 2PR>F= 0.0577 0.0299 0.5009
LSD 14.945 27.52 10.654 1
No row covers-standard system with normal planting date in May (NCN); Single layer: clear
polyethylene plastic row covers (CS); Single layer: white polyethylene plastic row covers (WS);
Dual layer: clear polyethylene plastic and spun-bond polypropylene row covers (CD); and Dual
layer: white polyethylene plastic and spun-bond polypropylene row covers (WD). Located in
Benton Harbor, MI. 2
Means within each column followed by the same letter are not significantly different at
P ≤ 0.05.

49
seemed to show potentials as a mean to modulate temperature in the tomato system. Also tomato
plants seemed affected when the leaves or the apical meristem was touching the plastic on top of
the tunnel. This type of injury was not observed with cucumber due its growing habit (vining).
This is also shown when looking at overall marketable yields of tomatoes and cucumbers.
Tomato yields were highest under the white dual layer system for two out of the three years of
the study, while cucumber yields were highest under the either the clear single or dual layer
systems.

50
Summary and Conclusion
The objective of this study was to determine the best low tunnel technology for
microclimate modification and to allow growers to plant and harvest vegetables earlier, when
prices may be higher. The CD treatments provided the most frost protection and significantly
higher number of growing degree days compared to other treatments. This agrees with Soltani et
al. (1995) that row covers plus plastic mulch have been shown to have higher air and soil
temperatures, compared to just plastic mulch alone. However, in the absence of a severe frost,
the WD system would be more appropriate for tomato production. The low tunnel treatments
were harvested 11-17 days earlier than the NCN treatments planted at the normal planting date
one month later. This result confirmed that the main impact of row covers was on earliness,
which may result in significant economic benefit to the grower, when early prices are higher.
Growers should note that under certain frost conditions, temperatures under low tunnels may
become lower than the ambient air temperature outside the low tunnel, as observed during the 27
April 2012 frost event. In general, tomatoes are susceptible to chilling injury when exposed to 10
oC or below (Kinet and Peet, 1997). In this case, temperatures were much lower than 10
oC, but
tomatoes can also be cold-acclimated by exposure to short periods of low temperature conditions
as low as -3oC (Hunter, et al. 2012). This explains why some tomatoes were only damaged rather
than completely killed (Figure 3.4). Bacterial disease pressure may be increased in high
humidity environments. This seemed to be the case for tomatoes, since in all three years
tomatoes had bacterial symptoms apparent at the middle of the season.

51
Economic Analysis of the Low TunnelsCHAPTER 4:

52
Abstract
Low tunnels along with plastic mulch provide frost protection, increase growing degree
days, reduce weeds, and conserve water and fertilizer. However, earliness and costs of different
low tunnel plastics and row cover material configurations have not been investigated. A three-
year field study was conducted in Benton Harbor, Michigan to examine effects of low tunnel
plastics and row cover material on yield earliness of tomato (Lycopersicon lycopersicum L.) and
cucumber (Cucumis sativus L.). All low tunnel treatments planted with cucumber had 12 to 17
days earlier harvest than the no cover treatments. Tomatoes planted in the low tunnel treatments
had 11 to 14 days earlier harvest than the no cover treatments. Clear plastic combined with a
spun-bond row cover in a dual-layer system, but provide the most frost protection was the second
most costly system. The low tunnels had limited effect on total marketable yields. However,
since market prices were high at the beginning of the seasons the low tunnel treatments had the
highest net revenue.

53
Introduction
Michigan’s slicing cucumber and fresh market tomato industries contribute over $30
million annually to the state economy (USDA, 2013). Michigan’s short growing season limits
vegetable production throughout the year, without finding a successful way to modify climate
and extend the growing season. Currently, Michigan imports cucumbers and tomatoes from other
states and countries such as, California, Canada, Florida, Georgia, Mexico, Mississippi, New
Jersey, North Carolina, and South Carolina, if more Michigan grown vegetables are readily
available sooner more in-state revenue can be created. Additionally, when vegetable growers can
receive higher market prices for their produce, they can increase their profits.
Hoophouse and greenhouse production are common ways to modify climate, but input
costs maybe too high for a grower. Also, the grower may not want to learn a new production
system. Low tunnel production has lower input costs, and the grower can decide to buy
equipment or install low tunnels by hand using their current field production system. However,
growers can only adopt this production technique, if it is profitable. Therefore, the goal of this
study was to test the economic potential of using low tunnels for open field production of fresh
market cucumber and tomato in Michigan. Specific objectives were to conduct an economic
analysis of the low tunnel systems.

54
Materials and Methods
Data on inputs costs, crop yield, and market prices were used to determine the most
profitable low tunnel configuration that promoted the best economic return using a partial budget
analysis. The low tunnel treatments tested were: 1. No row covers-standard system with normal
planting date in May (NCN); 2. No row covers-standard system with early planting date in April
(NCE); 3. Single layer: clear polyethylene plastic row covers (CS); 4. Single layer: white
polyethylene plastic row covers (WS); 5. Dual layer: clear polyethylene plastic and spun-bond
polypropylene row covers (CD); and 6. Dual layer: white polyethylene plastic and spun-bond
polypropylene row covers (WD). The NCE treatment was included for scientific reasons only
since no grower in the region would risk planting unprotected tomato or cucumber in April. Dual
layer treatments included a 76 cm (30 in) wide band of spun-bond material placed inside the
tunnels, sandwiched between the hoops, and low tunnel plastic. The clear and white polyethylene
plastics were perforated for appropriate ventilation on hot, sunny days.
Marketable Yields
Yields for each treatment were based on data from the field experiments performed from
2010 to 2012 at the Southwest Michigan Research and Extension Center (SWMREC) in Benton
Harbor, Michigan. All marketable fruit yields were from a 15.24 m (50 ft) row on 1.52 m (5 ft)
centers. The selling units for tomatoes and cucumbers at the Detroit terminal are 11.34 kg (25 lb)
carton and 24.19 kg (1 1/9 bushels), respectively. Therefore, yields in individual plots were
converted to those units to facilitate the economic analysis.
Prices
For each week of harvest we tracked the market price of cucumber and tomato at the
Detroit terminal market during the 2010-2012 growing seasons using the USDA Market News

55
website (USDA-AMS, 2010-2012). These data are provided by the USDA and are based on
prices received by wholesalers who sell less than a car or truck load of produce. Tomatoes and
cucumbers are offered at the Detroit terminal year-round, but Michigan field-grown cucumbers
and tomatoes are available only from mid-June to mid-September. When Michigan produce
prices were unavailable, prices were estimated based on data published from other states. An
average was taken of the ‘high’ and ‘low’ prices for the week to calculate the weekly price of
tomatoes (vine-ripened 5x6 sized fruit in 11.34 kg (25 lb) carton loose packaging) and
cucumbers (medium-sized fruit in 24.19 kg (1 1/9 bushels)). These prices did not include
transport or labor costs.
Costs of Production
The additional costs beyond those of a standard tomato or cucumber field planting were
calculated based on pricing and the experience of the grower cooperator, who is a local grower
who tested the low tunnel production system investigated in this study. The low tunnel layer was
built by this grower, George McManus, and was modified to lay two layers simultaneously,
while wires to support the tunnel layers were manually installed.
Equipment, labor, and material costs specific to each treatment were added to the
standard production cost. All other regular inputs (land preparation, planting, crop maintenance,
harvest and handling) were similar across treatments and; therefore not included in the partial
budget analysis.
Revenue and Profitability
Kilograms of tomatoes and cucumbers obtained from each treatment were totaled for
each week of harvest and assigned a wholesale price for that week. To obtain a gross revenue

56
estimate, weekly revenues were added for each season and the costs of equipment, labor, and
materials were subtracted from seasonal revenues.

57
Results and Discussion
Marketable Yield
As highlighted in Chapter 3, along with Tables 4.1 and 4.2, the row covers had a
significant impact on yield of both tomato and cucumber. As hypothesized in this research, the
treatments had a more profound impact on earliness rather than on total yield. This was
particularly important because most growers, who consider the use of low tunnels, are more
interested in an earlier harvest, because of the higher market prices. There was a difference of
11-14 days of earliness for tomatoes and 12-17 days of earliness for cucumbers, when low
tunnels were used. In addition to earliness, there were differences in yield depending on the
growing season. During 2010 and 2011, the low tunnel treatments had the highest yields
throughout the beginning and middle of each tomato and cucumber season. In 2012, the unique
frost event negatively affected low tunnel treatments making all treatment yields similar in the
cucumbers. Tomatoes yields from 2012 were drastically lower compared to previous years,
which could be a combination of the frost event and a bacterial disease in all treatments. There
was no specific low tunnel treatment configuration that offered increased yield potential within
either tomatoes or cucumbers. Ultimately, the grower is more interested in profitability rather
than simply yield.
Prices
Weekly prices are highlighted in Tables 4.1 and 4.2 during the harvest weeks in this
study. Prices drop in mid-season (July and August), which is peak harvest time for cucumbers
and tomatoes (and other vegetables). In 2010, tomato prices had the largest price drop in the
middle of the season, when prices went from $18.25 to $13.00 over a 4-week period. Vine-
ripened tomatoes were being imported from Georgia prior to 22 July 2010, when Michigan

58
Table 4.1. Cucumber weekly marketable yield (unit per 1 1/9 bushel carton), weekly price ($) and weekly gross revenue ($) for
tomatoes grown using various low tunnel systems for 2010-2012(see table 4.3 for acronyms).
Year/
Week
Cucumber Treatment
NCE NCN CS CD WS WD
2010 Price Yield Rev. Yield Rev. Yield Rev. Yield Rev. Yield Rev. Yield Rev.
1 25.50 0.06 1.46 0.00 0.00 0.91 23.25 0.61 15.59 0.26 6.59 0.18 4.70
2 23.50 0.15 3.47 0.00 0.00 0.85 19.90 0.49 11.58 0.40 9.48 0.29 6.80
3 25.50 0.63 16.09 0.63 16.05 0.61 15.65 0.66 16.82 0.64 16.29 0.67 17.09
4 19.75 1.04 20.56 0.73 14.46 0.80 15.77 0.90 17.70 0.91 17.94 0.85 16.85
5 14.50 1.04 15.07 1.14 16.49 0.75 10.90 1.02 14.78 0.99 14.36 1.06 15.31
6 13.75 1.26 17.30 1.25 17.25 0.82 11.30 0.91 12.53 1.17 16.02 1.18 16.26
7 16.00 0.91 14.51 0.93 14.86 0.66 10.60 0.79 12.67 0.91 14.56 1.00 16.00
Total 5.08 88.45 4.68 79.12 5.41 107.37 5.38 101.67 5.27 95.23 5.24 93.02
2011
1 24.50 0.06 1.52 0.00 0.00 0.37 9.17 0.42 10.22 0.04 0.91 0.17 4.23
2 24.00 1.21 29.06 0.00 0.00 2.07 49.63 2.17 52.14 1.18 28.36 1.75 41.93
3 19.25 1.52 29.25 0.40 7.61 2.30 44.29 2.20 42.28 1.86 35.73 1.68 32.29
4 18.75 2.75 51.55 2.96 55.51 3.47 65.11 3.86 72.39 3.32 62.21 2.90 54.38
5 18.62 1.86 34.57 2.89 53.85 1.77 32.93 1.94 36.11 1.83 34.01 1.56 28.97
6 18.50 1.44 26.55 2.54 47.05 1.28 23.68 1.53 28.39 1.88 34.70 1.33 24.64
7 18.50 0.91 16.88 1.46 26.92 1.01 18.69 1.04 19.26 1.01 18.68 0.92 17.02
Total 9.75 189.38 10.25 190.95 12.27 243.49 13.16 260.79 11.10 214.60 10.31 203.46
2012
1 17.00 0.22 3.69 0.00 0.00 0.42 7.12 0.42 7.18 0.25 4.23 0.26 4.37
2 17.00 1.05 17.77 0.00 0.00 0.60 10.24 0.39 6.64 0.78 13.22 0.48 8.12
3 17.13 0.71 12.16 0.61 10.43 0.49 8.47 0.52 8.92 0.72 12.40 0.75 12.78
4 17.25 1.69 29.10 1.93 33.36 1.18 20.42 1.24 21.45 2.15 37.16 1.86 32.08
5 16.50 0.82 13.49 1.27 20.92 0.76 12.61 0.61 10.11 0.93 15.29 0.69 11.45
6 13.38 0.98 13.07 1.68 22.49 0.89 11.86 0.75 10.06 0.88 11.80 1.03 13.84
7 11.75 1.28 15.07 1.95 22.93 1.11 13.07 0.91 10.73 1.21 14.26 1.21 14.27
Total 6.74 104.35 7.44 110.14 5.46 83.80 4.86 75.11 6.93 108.37 6.28 96.91

59
Table 4.2. Tomato weekly marketable yield (unit per 25 lb carton), weekly price ($) and weekly gross revenue ($) for tomatoes grown
using various low tunnel systems for 2010-2012(see table 4.3 for acronyms).
Year/
Week
Tomato Treatment
NCE NCN CS CD WS WD
2010 Price Yield Rev. Yield Rev. Yield Rev. Yield Rev. Yield Rev. Yield Rev.
1 18.25 0.01 0.21 0.00 0.00 0.29 5.20 0.02 0.43 0.20 3.73 0.02 0.35
2 17.38 0.17 2.96 0.00 0.00 1.30 22.67 0.86 14.86 1.02 17.65 0.79 13.74
3 14.00 1.70 23.81 0.05 0.71 2.21 30.98 2.10 29.42 2.68 37.55 3.27 45.81
4 14.00 2.10 29.45 0.59 8.27 1.00 13.99 0.97 13.56 1.28 17.98 1.37 19.19
5 13.00 1.99 25.92 0.51 6.58 0.80 10.36 1.32 17.18 0.86 11.13 0.99 12.84
6 13.00 0.00 0.00 3.02 39.24 0.00 0.00 0.00 0.00 0.00 0.00 0.00 0.00
Total 5.98 82.34 4.17 54.80 5.60 83.20 5.27 75.45 6.04 88.04 6.44 91.94
2011
1 15.50 0.00 0.07 0.00 0.00 0.25 3.81 0.17 2.61 0.29 4.53 0.23 3.55
2 16.75 0.03 0.54 0.00 0.00 0.87 14.64 0.57 9.52 0.89 14.85 0.81 13.49
3 14.25 0.90 12.77 0.00 0.00 2.95 41.97 2.17 30.98 2.21 31.50 1.58 22.53
4 14.50 0.48 6.92 0.08 1.10 0.71 10.36 0.99 14.39 0.56 8.18 0.56 8.08
5 13.25 0.88 11.62 0.19 2.49 0.72 9.60 0.94 12.40 0.91 12.02 0.50 6.67
6 13.25 0.63 8.38 0.58 7.64 0.39 5.15 0.29 3.87 0.35 4.57 0.22 2.96
7 13.25 0.46 6.05 0.76 10.04 0.20 2.63 0.12 1.64 0.17 2.27 0.14 1.90
8 15.75 0.00 0.00 0.29 4.59 0.00 0.00 0.00 0.00 0.00 0.00 0.00 0.00
Total 3.38 46.35 1.89 25.85 6.09 88.16 5.25 75.41 5.38 77.91 4.04 59.18
2012
1 14.50 0.05 0.79 0.00 0.00 0.06 0.92 0.01 0.21 0.15 2.16 0.20 2.94
2 14.50 0.32 4.57 0.00 0.00 0.17 2.44 0.00 0.00 0.24 3.44 0.14 1.99
3 14.50 0.12 1.78 0.02 0.29 0.21 3.11 0.18 2.54 0.45 6.51 0.21 3.03
4 14.50 0.29 4.20 0.11 1.60 0.55 7.93 0.21 3.09 0.39 5.69 0.44 6.34
5 12.50 0.37 4.57 0.15 1.83 0.37 4.61 0.23 2.90 0.29 3.57 0.16 1.96
6 15.50 0.02 0.36 0.38 5.91 0.06 0.99 0.04 0.60 0.09 1.38 0.02 0.26
7 15.25 0.00 0.00 0.59 8.95 0.07 1.04 0.04 0.54 0.02 0.28 0.01 0.16
8 14.75 0.13 1.91 0.27 3.96 0.06 0.94 0.17 2.45 0.07 1.03 0.12 1.83
Total 1.30 18.18 1.51 22.54 1.56 21.98 0.87 12.33 1.69 24.06 1.29 18.52

60
grown tomatoes were readily available. On September 20, 2010 tomatoes prices went up to
$16.75.
In 2011, tomato prices took a similar trend to 2010 prices, but prices started at $15.50 and
dropped to $13.25. Californian tomatoes were being imported until 5 August 2011. Prices
returned to a new high of $17.75 at the end of the season on 12 September 2011. During 2012,
tomato prices remained essentially steady throughout the season. Prices started at $14.50,
dropped to $12.50, and returned to $14.50 later in the season. Tomatoes were being imported
from Mexico and South Carolina until 23 July 2012.
Cucumber prices in 2010, also had the largest price drop compared to the other two years.
Prices started at $25.50 and went as low as $13.75. Cucumbers were already being produced in
Michigan, prior to the first harvest dates of this study within all three seasons. Prices continued
to remain lower throughout the rest of the season. In 2011, cucumber prices had the smallest
price drop, starting at $24.50 and going as low as $18.50 during the middle of the season. Prices
returned to $24.75 on 23 September 2011. During 2012, cucumber prices started at $17.00, went
up to $17.25, and dropped to $11.75 by the middle of the season. On 31 August 2012, prices had
a new season high of $21.00.
Cost of Production
The cost of production included equipment, labor, and materials beyond those in a
standard cucumber or tomato field planting. The largest input was the estimated cost of the low
tunnel layer at $3,500. Assuming that this implement lasts 10 years and covers 41 ha (100 acres)
per year the cost is $8.65/ha ($3.50/acre) to use the implement. Growers may consider renting
implements rather than purchasing it new, since the cost of maintenance or purchasing can be
high. Labor costs for the low tunnel treatments were estimated at: $185.25/ha ($75/acre) for wire

61
installation, $155.61/ha ($63/acre) for low tunnel installation, $185.25/ha ($75/acre) for low
tunnel removal, and $61.75/ha ($25/acre) for wire removal, which totals $587.86/ha ($238/acre).
Equipment and labor costs were the same for all low tunnel treatments, totaling $596.51/ha
($241.50/acre).
The NCN and NCE treatments required no inputs beyond the standard production
practices. Wires cost $0.04 per piece and 2,008 wires/ha (813/acre) would be needed. The wire’s
assumed lifespan is 5 years, making the total cost $16.06 /ha($6.50/acre). The CS treatment
material costs were $736.06/ha ($298/acre) for the low tunnel clear plastic and $16.06/ha
($6.50/acre) for the wire. The CD treatment material costs were $752.12/ha ($304.50/acre), plus
$340.86/ha ($138/acre) for the spun-bond material. The WS treatment material costs were
$753.35/ha ($305/acre) for the low tunnel white plastic and $16.06/ha ($6.50/acre) for the wire.
The WD treatment material costs were $769.41/ha ($311.50/acre), plus $340.86/ha ($138/acre)
for the spun-bond material. All additional cost associated with the low tunnels are indicated in
Table 4.3 and include, plastic mulch, spun-bond material, wire hoops, tractor use, labor for low
tunnel installation, ventilation, and removal. The WD treatment cost the most, because the
materials were the most expensive to purchase. Even though costs varied depending on what
materials were used, growers are more interested in net revenue, instead of overall input costs.
Revenue and Profitability
A partial budget analysis was done that did not take into account other regular
inputs. The net revenue is not what a grower will get but instead gives an idea on the benefits
resulting from the use of low tunnels. Low tunnel impacts on gross revenue of both tomato and
cucumbers during 2010-2012 are presented in Table 4.4.
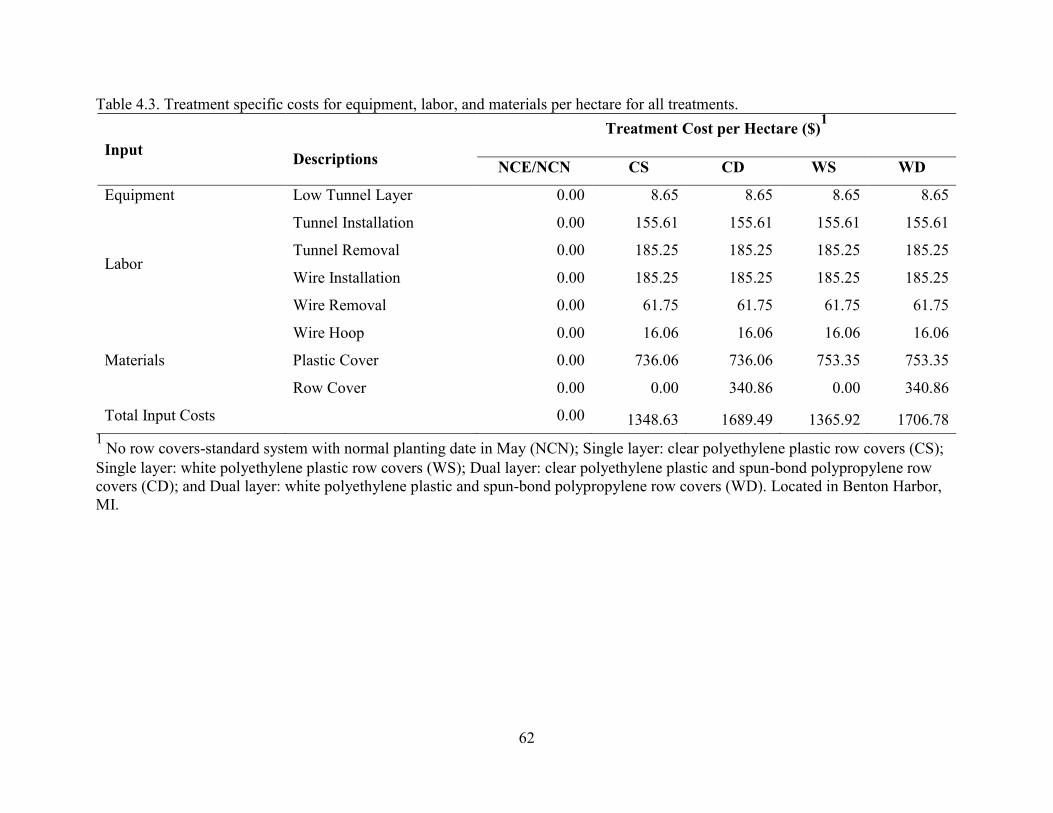
62
Table 4.3. Treatment specific costs for equipment, labor, and materials per hectare for all treatments.
Input
Descriptions
Treatment Cost per Hectare ($)1
NCE/NCN CS CD WS WD
Equipment Low Tunnel Layer 0.00 8.65 8.65 8.65 8.65
Labor
Tunnel Installation 0.00 155.61 155.61 155.61 155.61
Tunnel Removal 0.00 185.25 185.25 185.25 185.25
Wire Installation 0.00 185.25 185.25 185.25 185.25
Wire Removal 0.00 61.75 61.75 61.75 61.75
Materials
Wire Hoop 0.00 16.06 16.06 16.06 16.06
Plastic Cover 0.00 736.06 736.06 753.35 753.35
Row Cover 0.00 0.00 340.86 0.00 340.86
Total Input Costs 0.00 1348.63 1689.49 1365.92 1706.78
1 No row covers-standard system with normal planting date in May (NCN); Single layer: clear polyethylene plastic row covers (CS);
Single layer: white polyethylene plastic row covers (WS); Dual layer: clear polyethylene plastic and spun-bond polypropylene row
covers (CD); and Dual layer: white polyethylene plastic and spun-bond polypropylene row covers (WD). Located in Benton Harbor,
MI.

63
Table 4.4. Impact of low tunnels on gross revenue for 15.2 m long treatment in production of
slicing cucumbers and fresh market tomatoes in Southwest Michigan in 2010- 2012.
Treatment1
Cucumbers Tomatoes
Revenue2 Cost
3 Difference
4 Revenue
2 Cost
3 Difference
4
2010
NCE 88.45 0.00 88.45 82.34 0.00 82.34
NCN 79.12 0.00 79.12 54.80 0.00 54.80
CS 107.37 3.12 104.25 83.20 3.12 80.08
CD 101.67 3.91 97.76 75.45 3.91 71.54
WS 95.23 3.16 92.07 88.04 3.16 84.88
WD 93.02 3.95 89.07 91.94 3.95 87.99
2011
NCE 189.38 0.00 189.38 46.35 0.00 46.35
NCN 190.95 0.00 190.95 25.85 0.00 25.85
CS 243.49 3.12 240.37 88.16 3.12 85.04
CD 260.79 3.91 256.88 75.41 3.91 71.50
WS 214.60 3.16 211.44 77.91 3.16 74.75
WD 203.46 3.95 199.51 59.18 3.95 55.23
2012
NCE 104.35 0.00 104.35 18.18 0.00 18.18
NCN 110.14 0.00 110.14 22.54 0.00 22.54
CS 83.80 3.12 80.68 21.98 3.12 18.86
CD 75.11 3.91 71.20 12.33 3.91 8.42
WS 108.37 3.16 105.21 24.06 3.16 20.90
WD 96.91 3.95 92.96 18.52 3.95 14.57 1
No row covers-standard system with normal planting date in May (NCN); Single layer: clear
polyethylene plastic row covers (CS); Single layer: white polyethylene plastic row covers (WS);
Dual layer: clear polyethylene plastic and spun-bond polypropylene row covers (CD); and Dual
layer: white polyethylene plastic and spun-bond polypropylene row covers (WD). 2 Gross revenue calculated as the sum of weekly revenues. Weekly revenue was obtained by
multiplying the weekly yield by the weekly average price. 3 Total variable cost associated with the low tunnels as shown in Table 4.1 divided by 432.25.
4 Difference between gross revenue and total variable cost.

64
In 2010, tomato production using standard practices of no low tunnels and normal
planting date (NCN) provided net revenue of about $54.80 per treatment. The use of the white
dual layer low tunnel (WD) increased net revenue to $87.99 per plot. All other low tunnel
treatments also increased net revenue with values of $80.08, $71.54, and $84.88 for the CS, CD,
and WS treatments. In 2011, similar trends were observed. Tomato in the NCN treatment had net
revenue of $25.85 per plot, which was half the revenue of the previous year. The use of the WD
low tunnel increased net revenue to $55.23 per plot, which was less compared to the previous
year. All other low tunnel treatments increased net revenue with varying values of $85.04,
$71.50, and $74.75 for the CS, CD, and WS treatments. In 2012, there was a unique frost event
and bacterial diseases within the tomato plots that caused lower revenues in all low tunnel
treatments. The NCN treatment net revenue was the highest value of $22.54 per plot. The low
tunnel treatments had lower net revenues of $18.86, $8.42, $20.90, and $14.57 for the CS, CD,
WS, and WD treatments.
The NCN treatments planted with cucumber in 2010 provided net revenue value of
$79.12 per plot, while the clear single layer (CS) low tunnel treatment increased net revenue to a
value of $104.25 per plot. The other low tunnel treatments had increased net revenue valued at
$97.76, $92.07, and $89.07 for the CD, WS, and WD treatments. Net Revenues in 2011 were
more than doubled compared to the previous year. The NCN cucumber treatments provided net
value of $190.95. The CS treatment increased net revenue to a value of $240.37, but was the
second highest compared to the all the treatments. The other low tunnel treatments had increased
net revenues valued at $256.88, $211.44, and $199.51 for the CD, WS, and WD treatments. In
2012, there was a unique frost event that caused lower revenues in all cucumber low tunnel
treatments. The NCN treatment net revenue was the highest value of $110.14 per plot. The low

65
tunnel treatments had lower net revenues of $80.68, $71.20, $105.21, and $92.96 for the CS, CD,
WS, and WD treatments.

66
Summary and Conclusion
These results show that the use of low tunnels for tomato and cucumber production in our
region could be profitable despite additional production costs associated with this production
practice. When prices are high at the beginning of the season and adequate frost protection is
provided by the low tunnels then net revenue values increase.
Potential impacts could result in increases of net revenue during the first two weeks
before prices drop in the season of cucumber by $11,102 per hectare ($27,423/acre) and tomato
by $6,207 per hectare ($15,331/acre). If this low tunnel technology is adopted on 100 acres, a
net gain of $2.7 million in cucumber and $1.5 million in tomato would be added to Michigan
current values of 16 million and $14.4 million, respectively.
Growers should be aware of the risks associated with this production system.
Commercial growers may not find an adequate market outlet if they push their crops too early.
Low tunnels management for proper ventilation is required to avoid crop damage, caused by
high temperatures.

67
CHAPTER 5: General Conclusions and Future Work

68
General Conclusions
Overall this study provided evidence that low tunnels can modify plant climate by raising
air temperatures and increasing accumulated growing degree days. Low tunnels were also found
to be profitable when higher market prices were available during the earlier harvests. The clear
dual layer was most appropriate for cucumbers, since they favor higher temperatures. In the
absence of severe frost, the white dual layer was better for tomato production. Tomatoes and
cucumbers planted under low tunnels can be planted one month prior to the last frost date in
Michigan. Under low tunnels, both can be harvested 11-17 days earlier than a typical harvest in
Michigan. Low tunnel tomatoes in this study were produced before Michigan tomatoes were
available at the Detroit Terminal.
There are potential risks of frost under certain low tunnel configurations with high IR
transmission. Tomato bacterial disease seemed to be increased under low tunnel production due
to high humidity. Growers need to make sure to remove low tunnels once crops have reached the
top of the low tunnels. Ventilation is required to prevent heat damage. Growers should also make
sure they have a market for early produced vegetables. Certain outlets may not have buyers for
early produced cucumbers or tomatoes.

69
Farmer Adoption
This project showed vegetable growers the potential benefits, risks, and costs of using
different materials for laying low tunnels. In particular, farmers exposed to this research should
have a better understanding of how different color plastics with or without a row cover can
benefit different crops. This project can easily be adopted by farmers with or without low tunnel
laying equipment depending on the scale of their production. Farmers with larger scale farms can
purchase the Model 95 Low Tunnel Layer made by Mechanical Transplanter, which is similar to
the low tunnel layer used in this project. There are a few differences between these implements.
The Model 95 sets the wires mechanically, which could reduce labor costs. This implement
would need to be modified to lay two different low tunnel materials simultaneously. Farmers
looking to just try this short term could lay low tunnels by hand or rent equipment.
70
Impact of Results/Outcomes
On average low tunnels increased net revenue by $11,102 per hectare ($27,423/acre)
during the first two weeks before prices drop during the cucumber season. If 100 acres are
planted under low tunnels, the increased value to the state's economy would be $2.7 million.
Similarly, low tunnels increased net revenue in tomato by $6,207 per hectare ($15,331/acre).
When 100 acres are planted under low tunnels, the increased value would be $1.5 million.

71
Areas Needing Additional Study
In order to get the most out of low tunnel vegetable production, there is still much to
learn about low tunnel timing, plastic color, fabric weight, size, and practicality, along with how
different vegetable varieties respond to these factors. This research has raised some of the
following questions:
What time frames could low tunnels be used?
Low tunnels were installed the last week of April for this project. Depending on the crop being
planted low tunnels could be installed earlier depending on how cold tolerant the crop variety.
What other crops besides cucumbers and tomatoes benefit from the use of low tunnels?
Preliminary studies show that watermelon, cantaloupe, buttercup squash, summer squash,
eggplant, habanero peppers, and jalapenos peppers can produce up to two weeks earlier when
planted under low tunnels. Crops such as habanero peppers and pumpkins that need over 100
days of maturity will have 14 more days to complete their growth period when grown under low
tunnels. Heat accumulation could be too intense for cool weather crops, such as lettuces and
brassicas, but there could be a possibility of using other low tunnel materials or row covers that
are unable to capture so much heat.
How do different colors (other than white and clear) of low tunnel plastic affect light quality and
heat accumulation?
There are many options for different colors of plastic mulch, which can benefit yields in various
vegetable crops.
Would removable low tunnels be more beneficial than stationary one time use low tunnels?

72
While the wires in this project were reusable, the plastic and fabric in this project were one time
use. If materials were able to be applied and retrieved economically for multiple years, the cost
of materials would be reduced.
Does tunnel length or width matter?
In this project, 1.6 m (62 in) long wires and 1.8 m (6 ft) wide plastic was used to make the
tunnels. The Model 95 Tunnel Layer comes in three different sizes, narrow, standard, and wide.
Tunnel lengths were approximately 15.2 m (50 ft long). If tunnels were longer or higher would
heat accumulation be different.

73
LITERATURE CITED

74
LITERATURE CITED
Baytown, N., K. Abak, H. Tokgoz, and O. Altunas.1994. Effect of different greenhouse covering
materials on inside climate and on the development of tomato plants. Acta Hort.
366:125–132.
Dı´az-Pe´rez, J.C. 2010. Bell Pepper (Capsicum annum L.) Grown on Plastic Film Mulches:
Effects on Crop Microenvironment, Physiological Attributes, and Fruit Yield.
Hortscience. 45(8):1196–1204.
Hanada, T. 1991. The Effect of Mulching and Row Covers on Vegetable Production.
http://www.agnet.org/library.php?func=view&style=type&id=20110801145616.
Hochmuth, G.J., Hochmuth, R.C., Kostewicz, S., and W. Stall. 2009. Row Covers for
Commercial Vegetable Culture in Florida. Circular 728, Department of Horticultural
Sciences, Florida Cooperative Extension Service, Institute of Food and Agricultural
Sciences, University of Florida.
Hunter, B., Drost, D., Black B.L., Frisby, J. and R. Ward. 2012. Improving growth and
productivity of early season high tunnel tomatoes with targeted temperature additions.
HortScience. 47(6): 733-740.
Ibarra-Jiménez, M.R. Quezada-Martin, M., and M.de la Rosa-Ibarra. 2004. The effects of plastic
mulch and row covers on the growth and physiology of cucumber. Austral. J. of
Expt. Agr. 44:91-94.
Janick, J. 1979. Horticulture’s ancient roots. HortScience. 14:299-313.
Kinet, J.M. and M.M. Peet. 1997. Tomato. In: Wien, H.C. (ed.). The physiology of vegetable
crops. CAB International, New York, NY.
Lamont, W.J. 1993. Plastic mulch for the production of vegetable crops. HortTechnology. 3:35-
39.
Marketfarm.com. 2014. Rain-Flo Raised Bed Mulch Layer. http://www.marketfarm.com
/cfms/rain_flow_raised_bed_mulch_lay.cfm
Mattoo, A.K. and M. Razdan. 2006. Genetic improvement of solanaceous crops, volume ii:
tomato. Genetic Improvement of Solanaceous Crops, Vol 2: Tomato. Enfield,
NH:Science Publishers, Inc. p. 1-637.
Midwest Vegetable Production Guide for Commercial Growers (MVP). 2014. Illinois, Indiana,
Iowas, Kansas, Minnesota, Missouri, and Ohio University Extensions.
http://www.btny.purdue.edu/pubs/id/id-56/ID-56.pdf
75
Oke, T.R. 1978. Boundary Layer Climates. Methuen & CO, London.
Penn State Extension. 2014. Low tunnels. Center for Plasticulture.
http://extension.psu.edu/plants/plasticulture/technologies/low-tunnels.
Peterson, R.H., and H.G. Taber. 1991. Tomato flowering and early yield response to
heat buildup under rowcovers. J. Amer. Soc. Hort. Sci. 116(2):206-209.
Reiners ,S., Nitzche, Pj., and W.H. Titjen. 1997. Rowcover-removal timing affects yield of
tomatoes planted on fall-prepared beds. HortTechnology. 7: 426-429.
Sandri, M.A., Andriolo, J.L., Witter, M., and Dal Ross. 2003. Effect of shading on tomato
plants grow under greenhouse. Horticultura Brasileira,Brasília. 21( 4) 642-645.
Salunkhe, D. K. and S. S. Kadam. 1998. Handbook of Vegetable Science and Technology:
Production, Compostion, Storage, and Processing. Marcel Dekker, Inc., New York, New
York.
Schrader, W.L. 2000. Plasticulture in California Vegetable Production. Publication 8016,
Division of Agriculture and Natural Resources, University of California.
Snyder, R. L. and J. P. Melo-Abreu. 2005. Frost protection: fundamentals, practice, and
economics –Volume 1. FAO, Rome.
ftp://ftp.fao.org/docrep/fao/008/y7223e/y7223e00.pdf.
Soltani, N., Lamar, A.J., and A.R. Hamson. 1995. Growth analysis of watermelon plants grown
with mulches and row covers. J. Amer. Soc. Hort. Sci. 120: 1001-1009.
Swiader, J.M. and G. W. Ware. 2002. Producing Vegetable Crops. Fifth ed. Interstate Publishers,
Inc., Danville, Illinois.
USDA (United States Department of Agriculture). 2013. Michigan Agricultural Statistics 2012-
2013.http://www.nass.usda.gov/Statistics_by_State/Michigan/Publications/Annual_Statis
tical_Bulletin/stats12/vegetables.pdf.
USDA (United States Department of Agriculture). 2014. Vegetables 2013 Summary.
http://www.nass.usda.gov/Publications/Todays_Reports/reports/vgan0314.pdf.
USDA-AMS (United States Dep. Of Agriculture- Agricultural Marketing Service). 1991. Reprint
1997. United States Standards for Grades of Fresh Tomatoes.
http://www.ams.usda.gov/AMSv1.0/getfile?dDocName=STELPRDC5050331
USDA-AMS (United States Dep. Of Agriculture- Agricultural Marketing Service). 1958. Reprint
1997. United States Standards for Grades of Cucumbers.
http://www.ams.usda.gov/AMSv1.0/getfile?dDocName=STELPRDC5050262

76
USDA-AMS (United States Dep. Of Agriculture- Agricultural Marketing Service). 2010-2012.
Run a Custom Report. http://marketnews.usda.gov/portal/fv?&paf_gear_id=1200002&
repType=wiz&paf_dm=full&startIndex=1&dr=1
Wells, O.S. and J.B. Loy. 1985. Intensive vegetable Production with row covers. HortScience.
20: 822-826.
Wells, O.S. and J.B. Loy. 1993. Rowcovers and high tunnels enhance crop production in the
northeastern United States. HortTechnology. 3:92–95
Wien, H.C. 2009. Microenvironmental variations within the high tunnel. HortScience. 44:235–
238.
Wittwer, S.H. and R.E. Lucas. 1956. Celery production in Michigan. Michigan Agr. Ext.
Bul. 339.