Embed Size (px)
Citation preview
Low Tech, Low Cost, Low Time, High Payoff Activities
André Michelle LubeckeLANDER UNIVERSITY
Greenwood, SC
2
My Self-Assigned Task
To offer you
a ‘sampler plate’
of bite-size ideas
that you might use to
create your own
MEMORABLE CLASSROOM EXPERIENCES
3
Be BRAVE!
Act on good ideas.
Developing ‘formal’ activities is a process
(and not always necessary).
4
Have FUN!
If you like something –
find a way to use it.
Enthusiasm is Contagious!
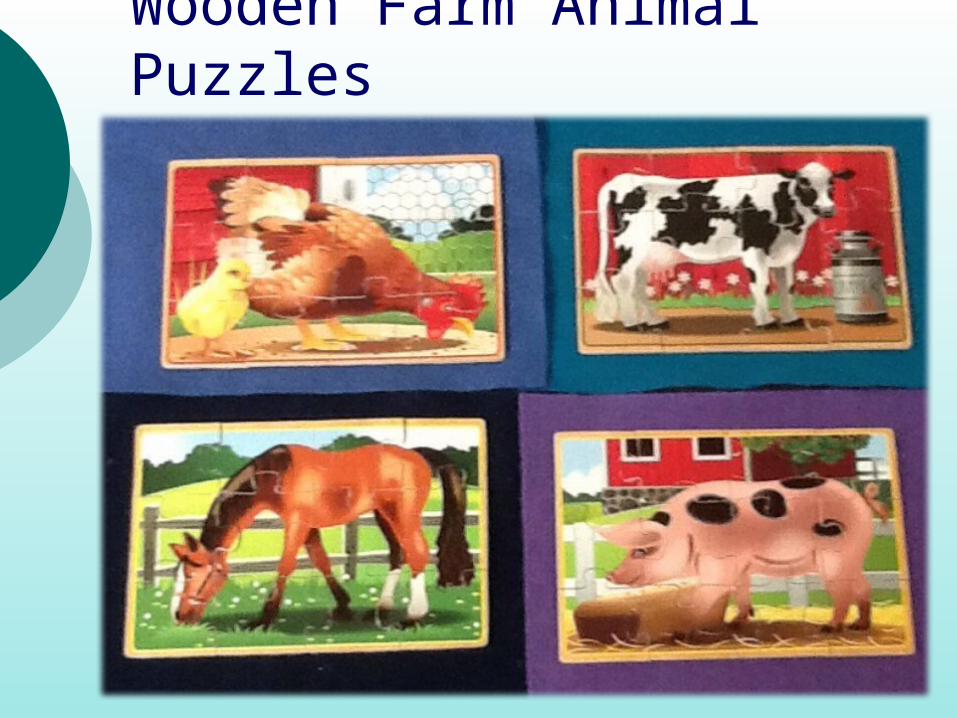
Wooden Farm Animal Puzzles
5
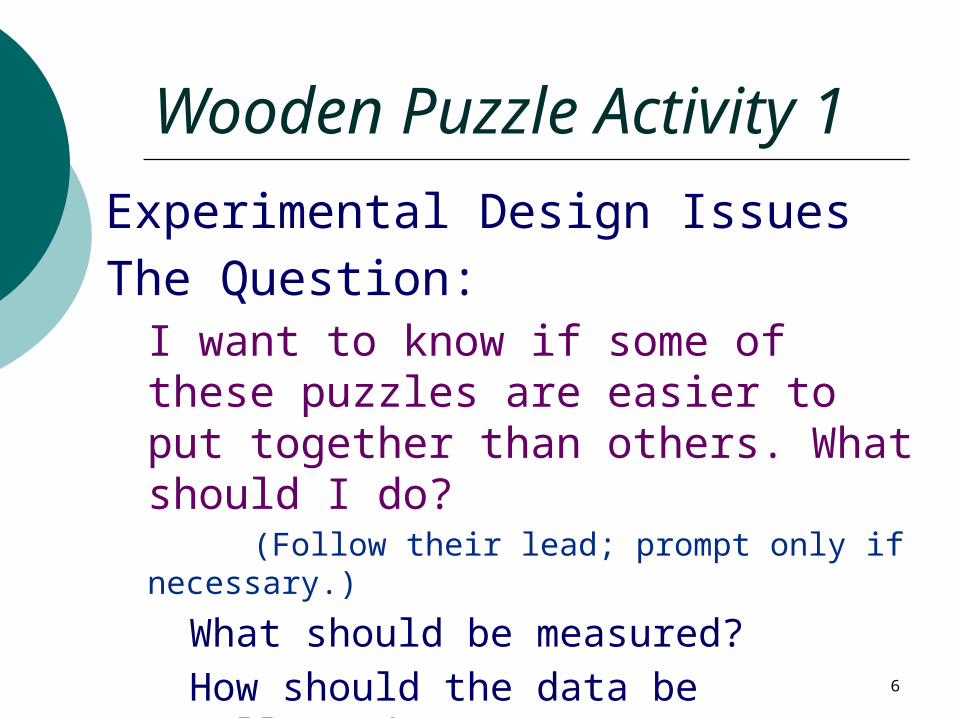
Wooden Puzzle Activity 1
Experimental Design Issues
The Question: I want to know if some of these puzzles are easier to put together than others. What should I do?
(Follow their lead; prompt only if necessary.)
What should be measured?
How should the data be collected?
What should be randomized?6
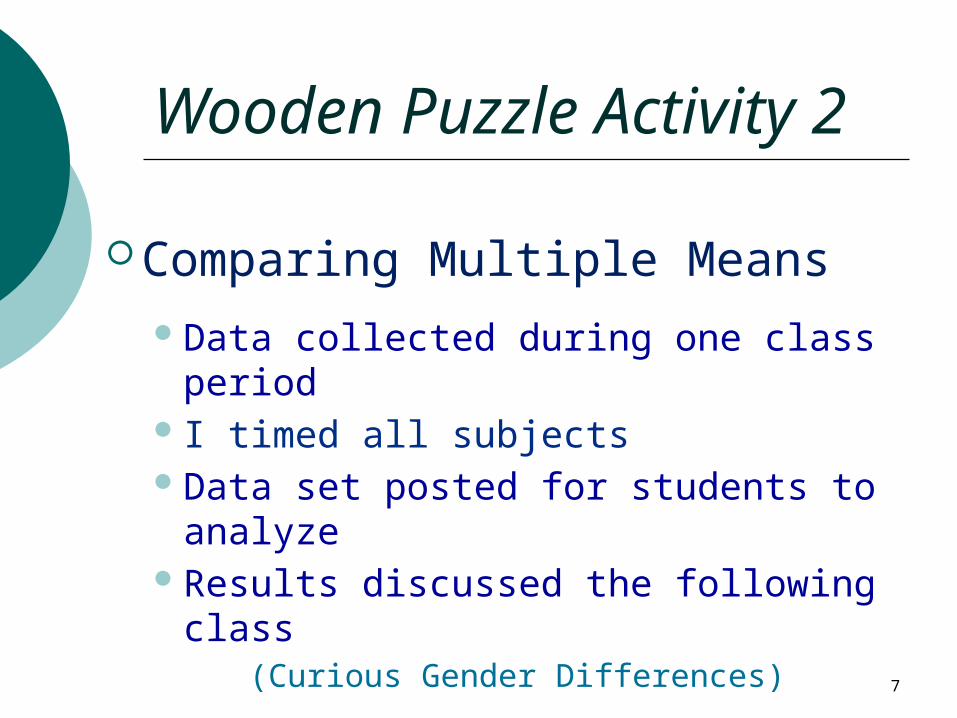
Wooden Puzzle Activity 2
Comparing Multiple MeansData collected during one class period I timed all subjectsData set posted for students to analyzeResults discussed the following class
(Curious Gender Differences)
7
8
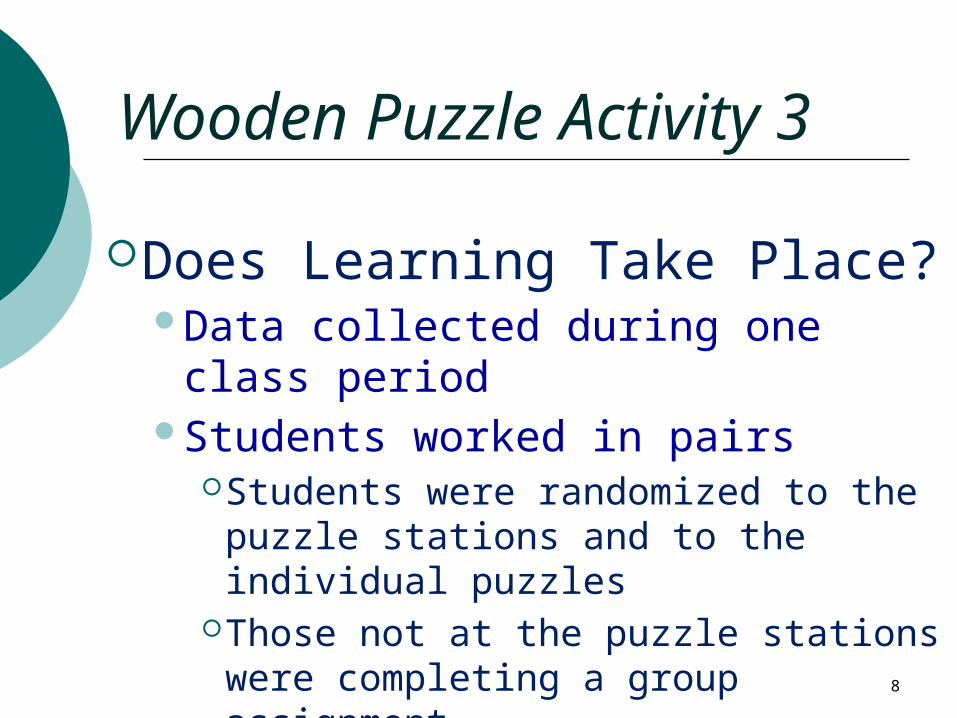
Wooden Puzzle Activity 3
Does Learning Take Place?Data collected during one class periodStudents worked in pairs
Students were randomized to the puzzle stations and to the individual puzzles
Those not at the puzzle stations were completing a group assignment
Data set posted for students to analyze
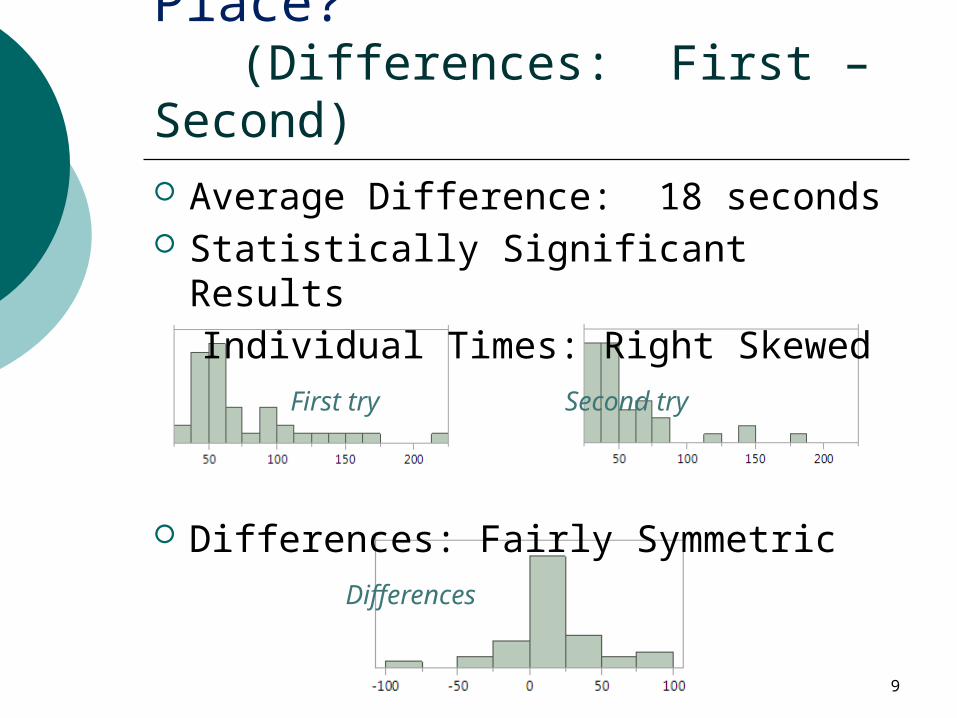
Does Learning Take Place? (Differences: First – Second)
9
Average Difference: 18 seconds Statistically Significant Results
Individual Times: Right Skewed
First try Second try
Differences: Fairly Symmetric
Differences
10
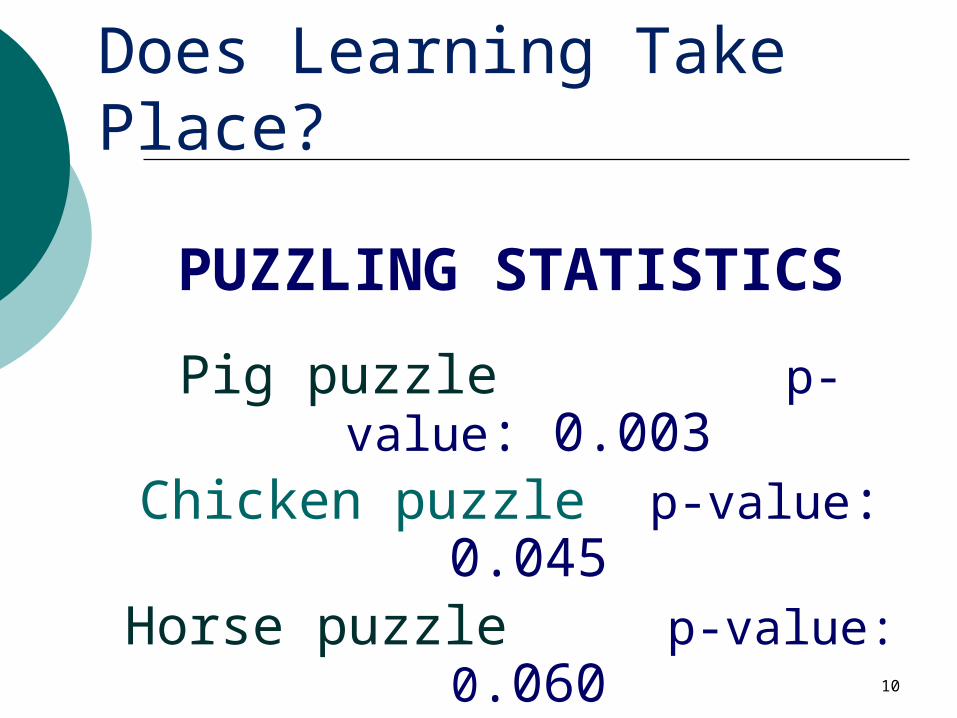
Does Learning Take Place?
PUZZLING STATISTICS
Pig puzzle p-value: 0.003Chicken puzzle p-value: 0.045Horse puzzle p-value: 0.060Cow puzzle p-value: 0.317
11
Use what you have CREATIVELY!
Your StudentsTheir playfulnessTheir zest for competition
Handy ItemsCards, Dice, Tacks, etc. Stopwatch: online or on cell phone
Create some Experiments!
12
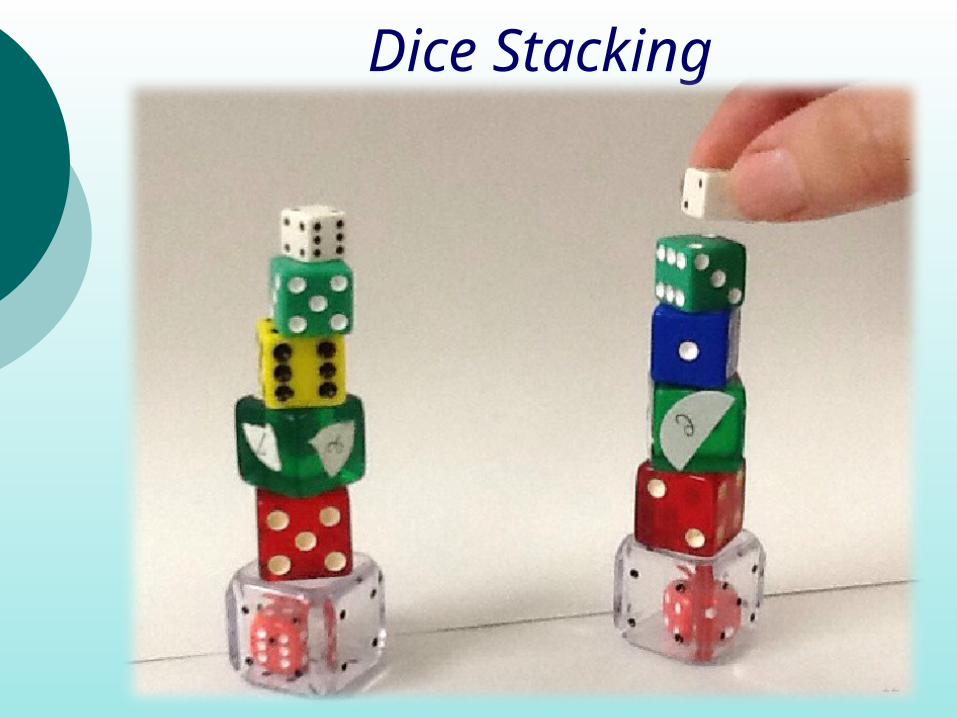
Dice Stacking
13
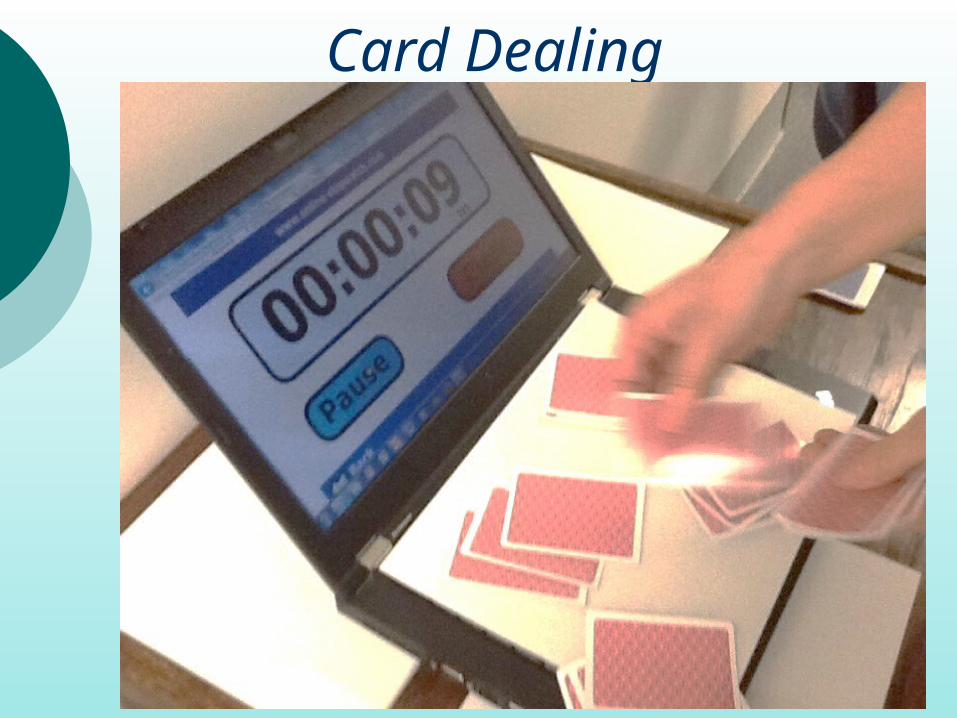
Card Dealing
14
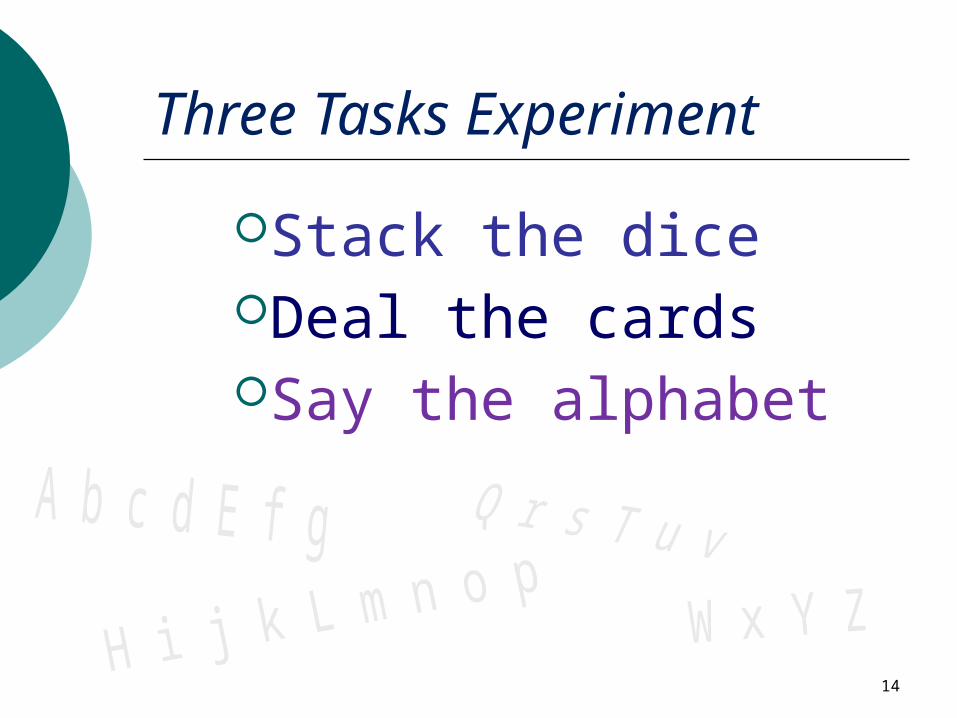
Three Tasks Experiment
Stack the diceDeal the cardsSay the alphabet
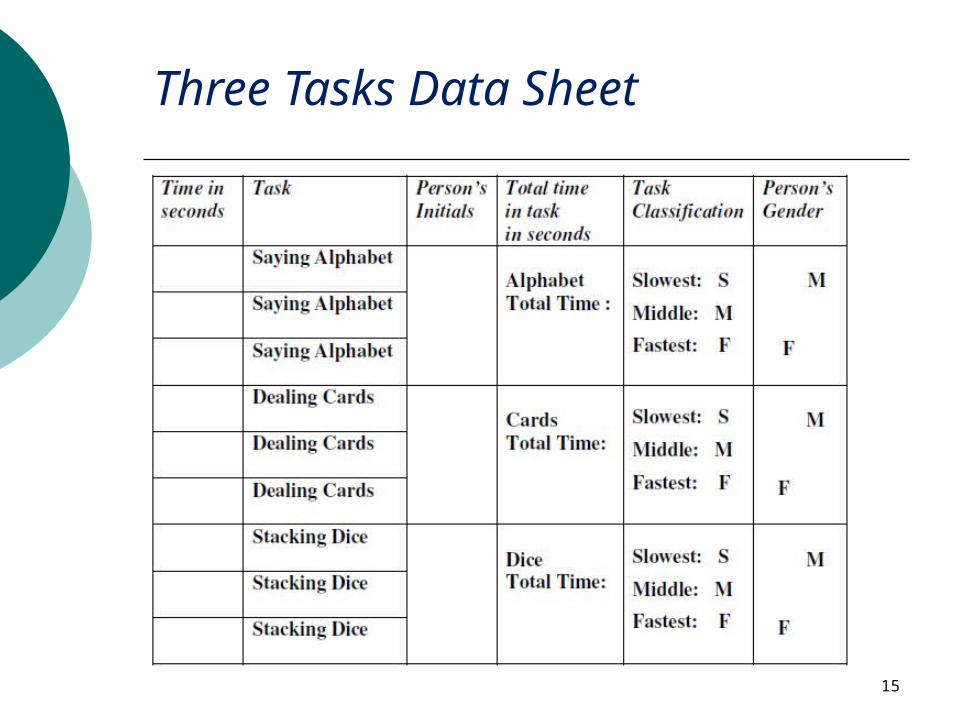
Three Tasks Data Sheet
15
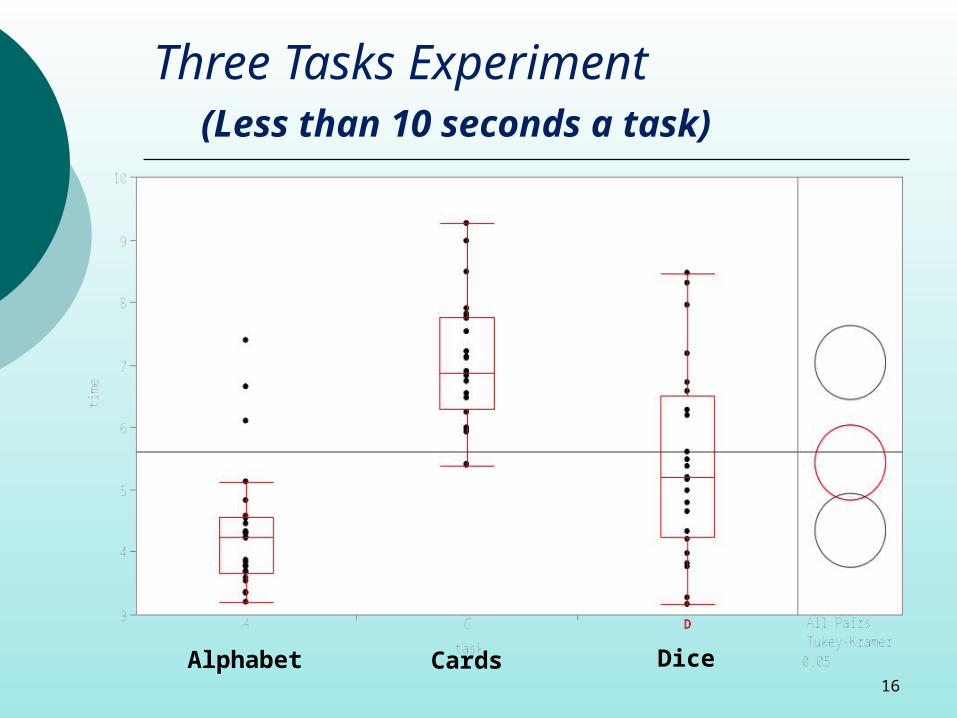
Three Tasks Experiment(Less than 10 seconds a task)
16
Alphabet Cards Dice
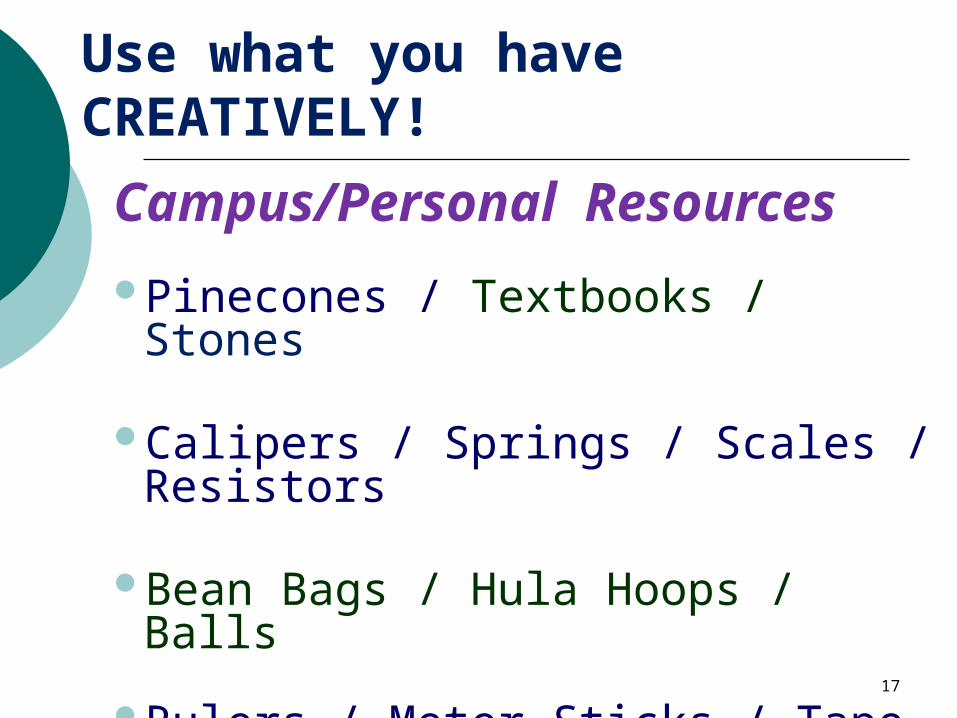
Use what you have CREATIVELY!
Campus/Personal Resources
Pinecones / Textbooks / Stones
Calipers / Springs / Scales / Resistors
Bean Bags / Hula Hoops / Balls
Rulers / Meter Sticks / Tape measures
Student bodies17
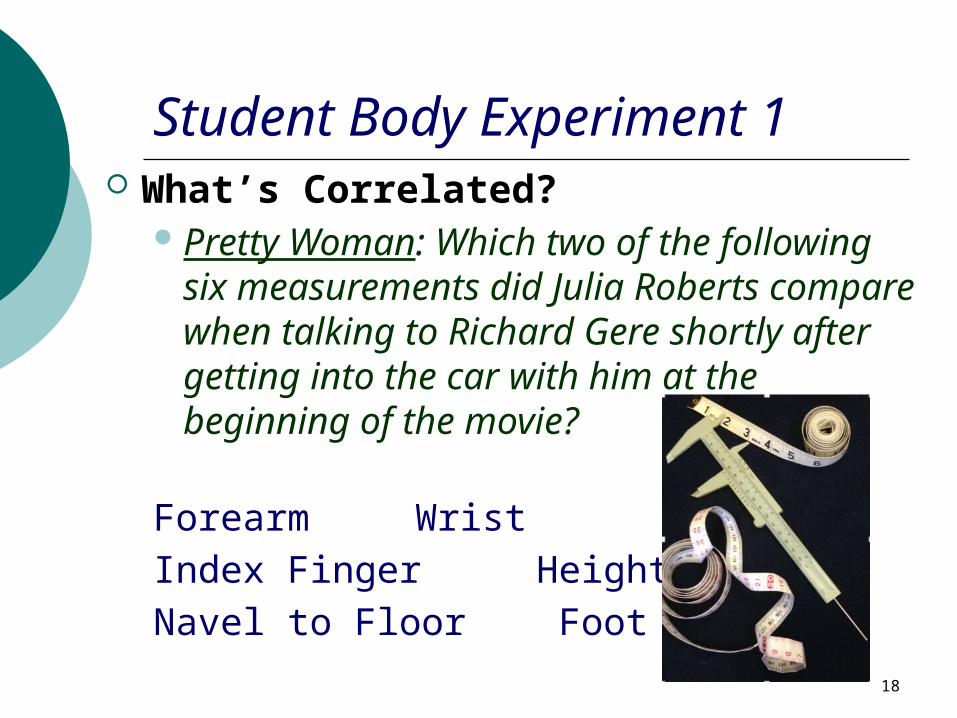
Student Body Experiment 1 What’s Correlated?
Pretty Woman: Which two of the following six measurements did Julia Roberts compare when talking to Richard Gere shortly after getting into the car with him at the beginning of the movie?
Forearm WristIndex Finger HeightNavel to Floor Foot
18
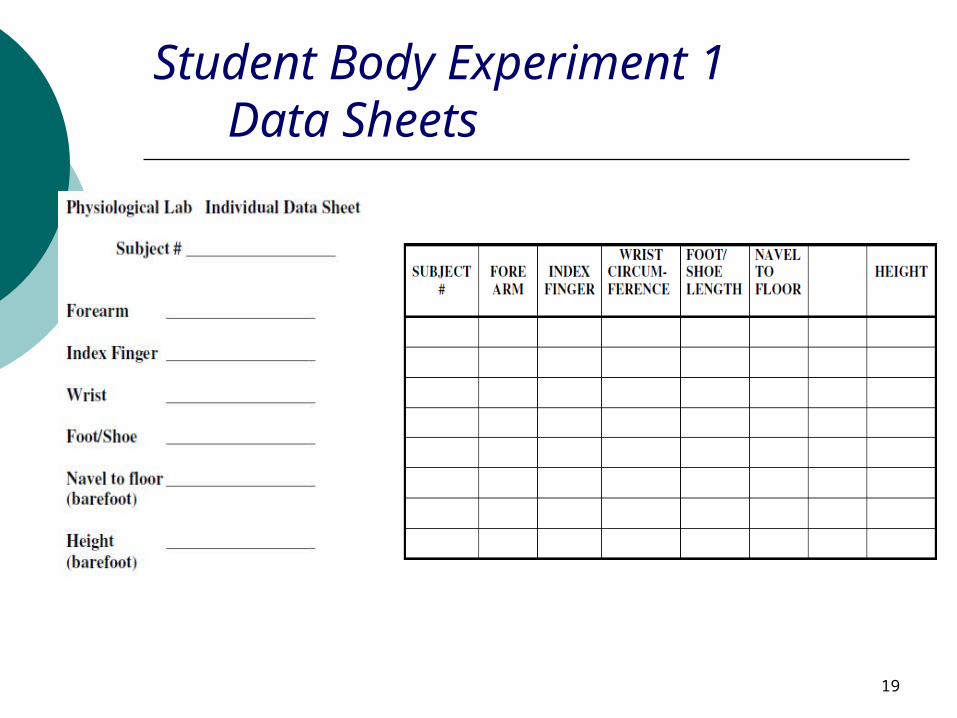
Student Body Experiment 1 Data Sheets
19
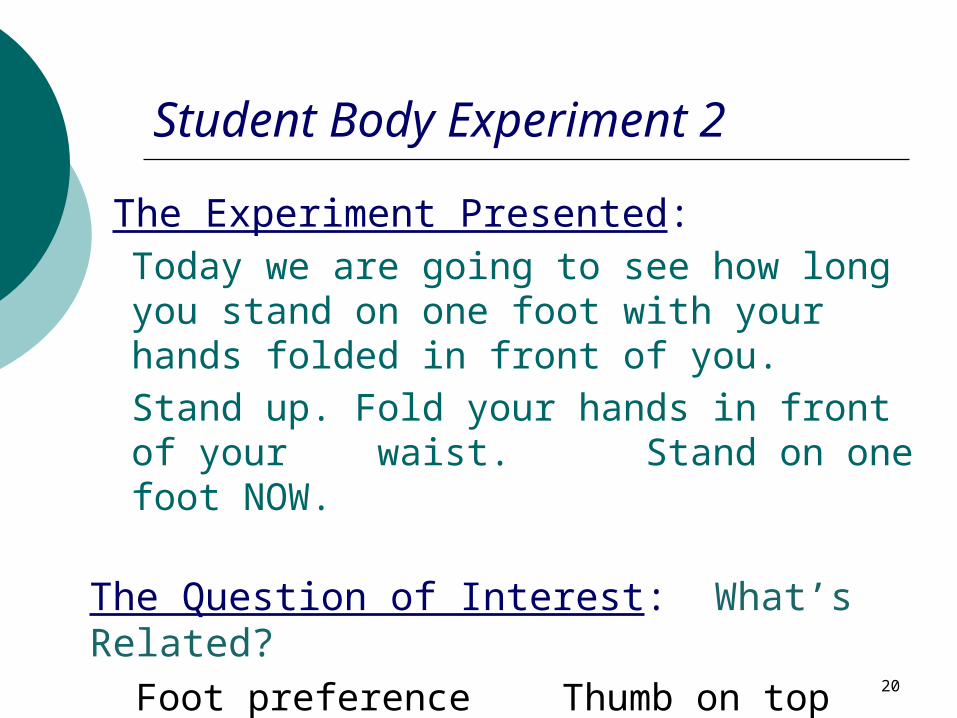
Student Body Experiment 2
The Experiment Presented: Today we are going to see how long you stand on one foot with your hands folded in front of you. Stand up. Fold your hands in front of your waist. Stand on one foot NOW.
The Question of Interest: What’s Related? Foot preference Thumb on top Hand dominance Eye dominance
20
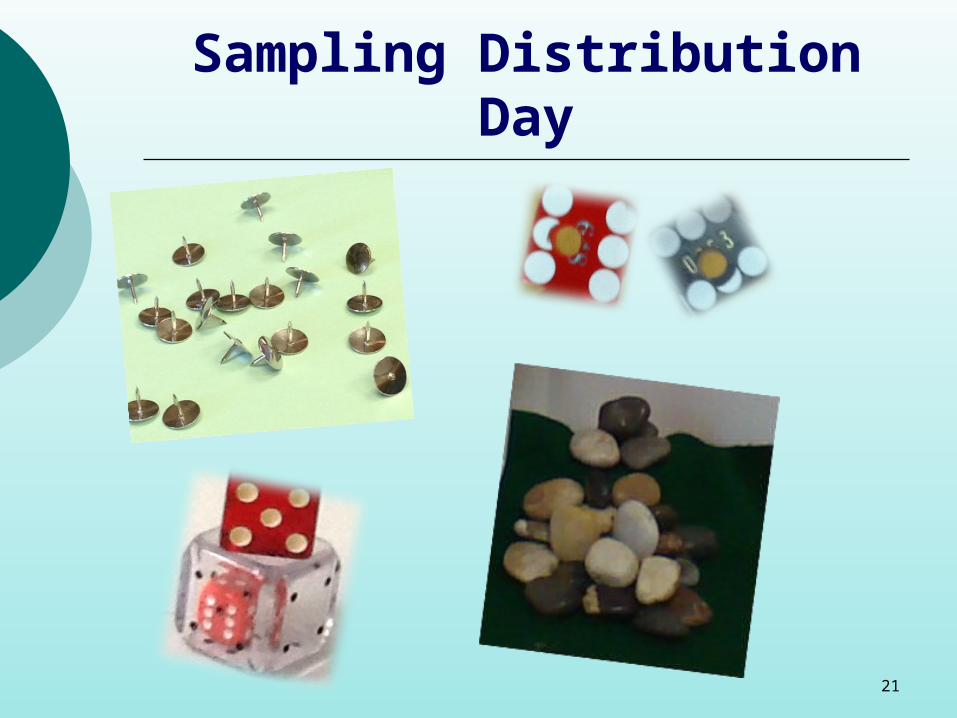
Sampling Distribution Day
21
22
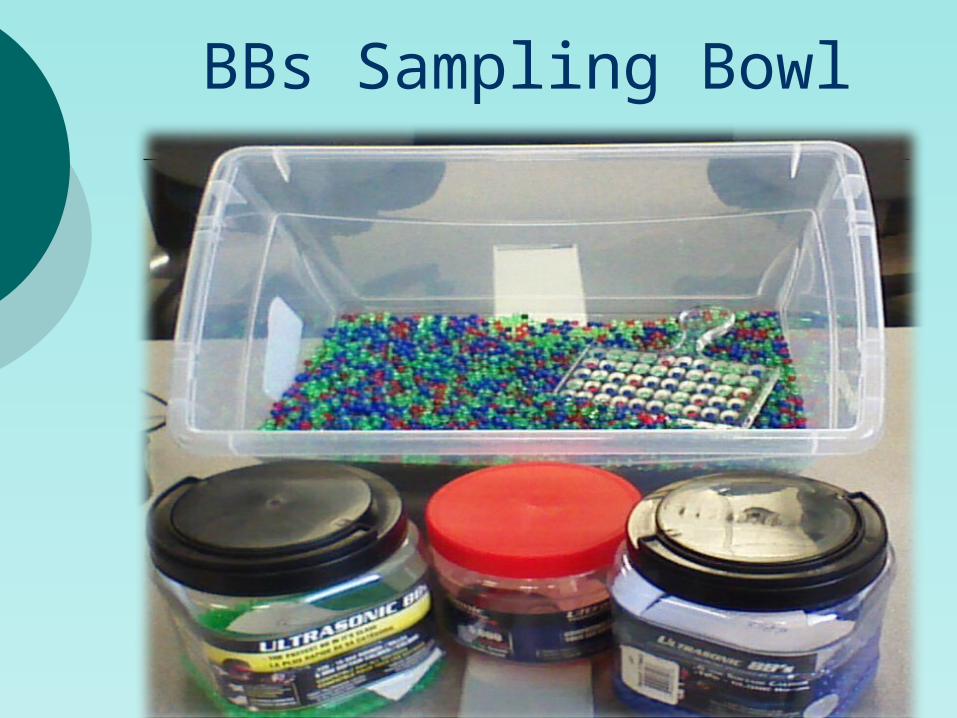
BBs Sampling Bowl
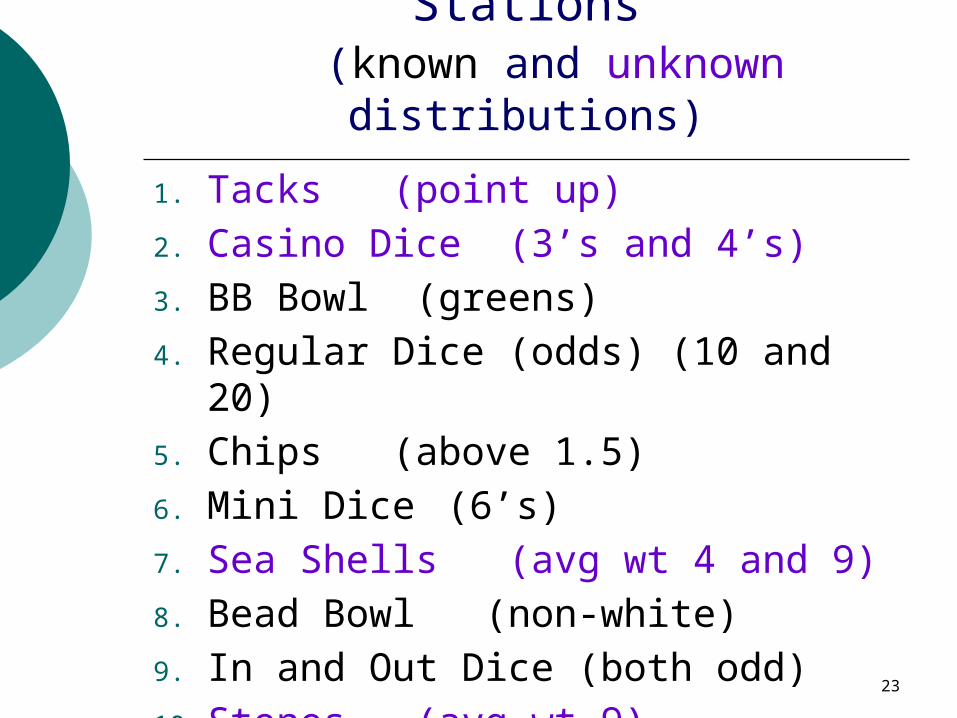
Sampling Distribution Stations (known and unknown distributions)
1. Tacks (point up)2. Casino Dice (3’s and 4’s)3. BB Bowl (greens)4. Regular Dice (odds) (10 and 20)5. Chips (above 1.5)6. Mini Dice (6’s) 7. Sea Shells (avg wt 4 and 9)8. Bead Bowl (non-white)9. In and Out Dice (both odd)10. Stones (avg wt 9) 23
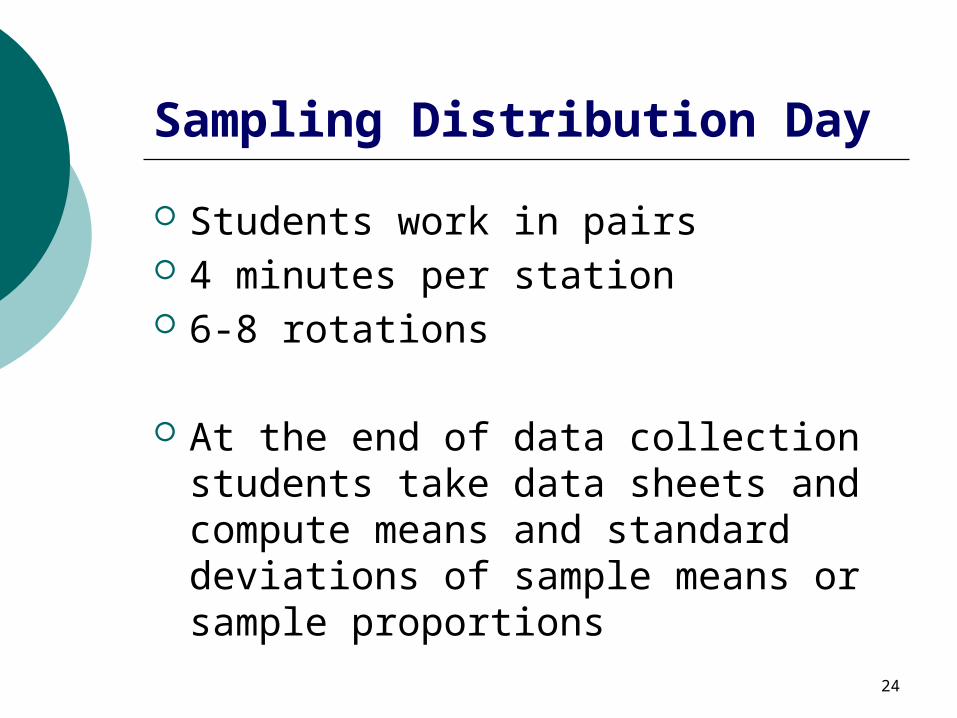
Sampling Distribution Day
Students work in pairs 4 minutes per station 6-8 rotations
At the end of data collection students take data sheets and compute means and standard deviations of sample means or sample proportions
24
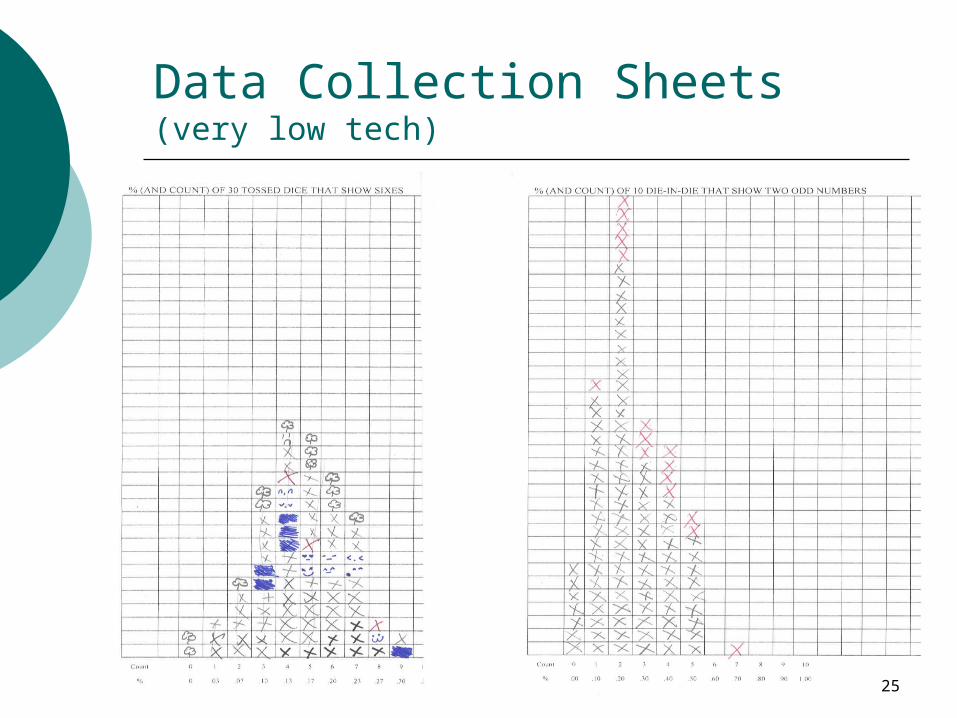
Data Collection Sheets (very low tech)
25
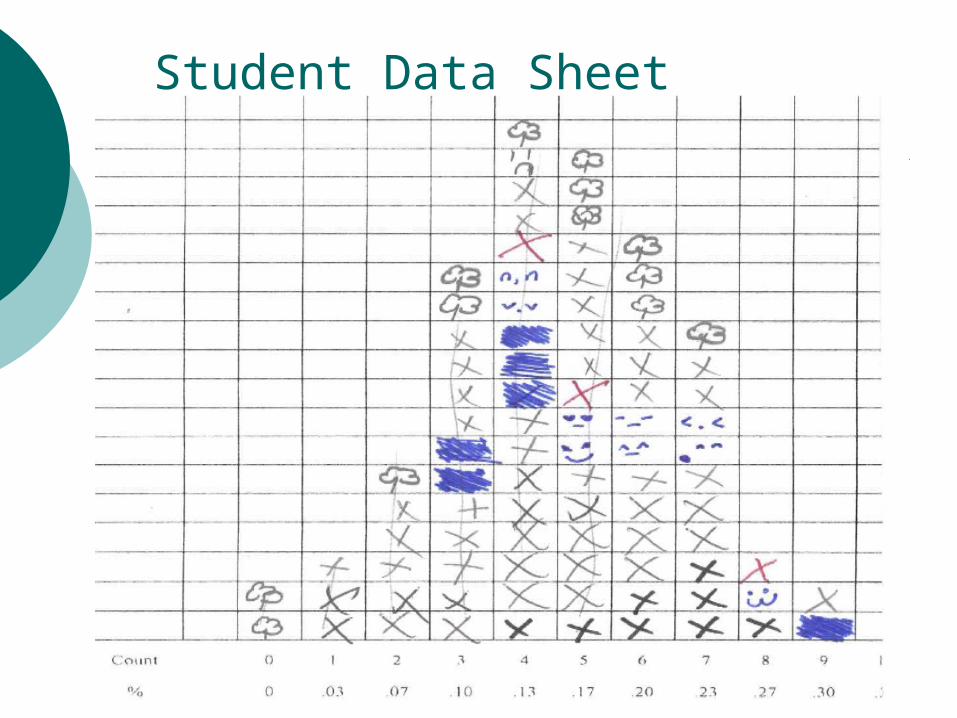
Student Data Sheet
26
Sampling Distribution Day
END OF HOUR DISCUSSION INCLUDES: Comparing average values of observed
proportions to theoretical value of the known distributions
Comparing standard deviations of observed proportions from the same experiment but with different sample sizes
Average value for percentage of tacks landing point up is discussed
27
Sea Shells
29
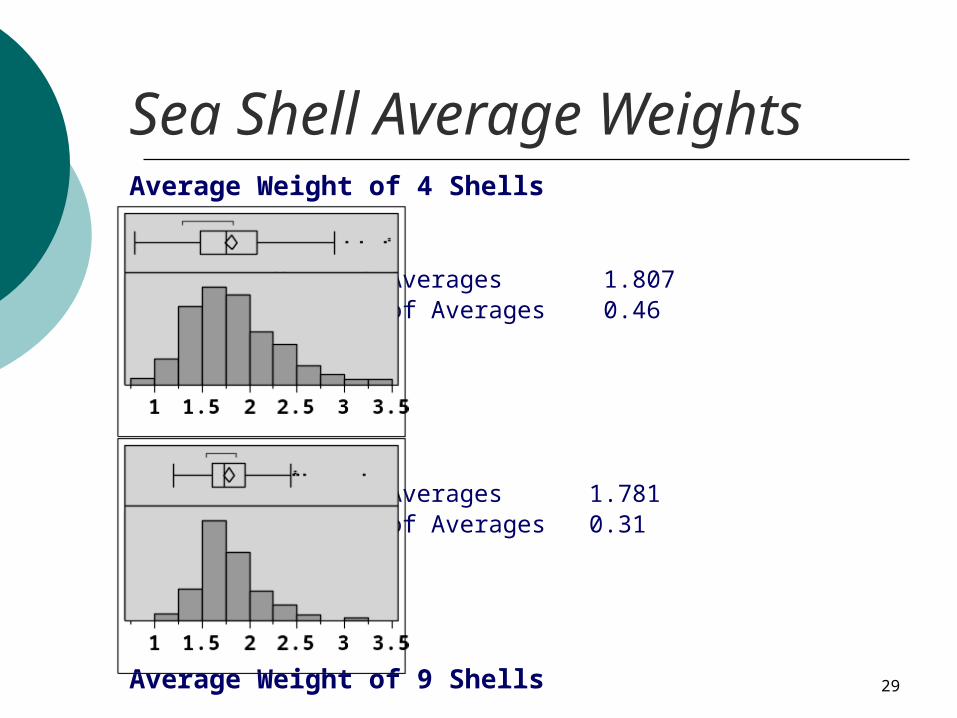
Sea Shell Average WeightsAverage Weight of 4 Shells
Mean of Averages 1.807Std Dev of Averages 0.46
Mean of Averages 1.781Std Dev of Averages 0.31
Average Weight of 9 Shells
30
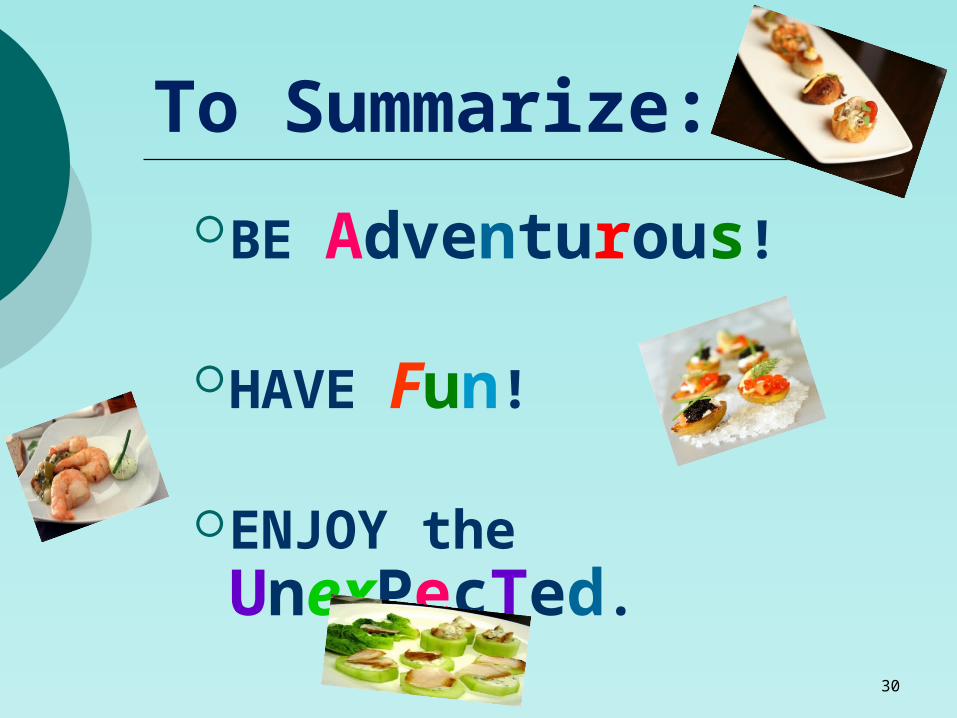
To Summarize:
BE Adventurous! HAVE Fun!
ENJOY the UnexPecTed.
31