Embed Size (px)
Citation preview
Low-Mass Star Forming Cores in the GF 9 Filament
Ray S. Furuya
Subaru Telescope, National Astronomical Observatory of Japan,650 North A’ohoku Place, Hilo, HI 96720, U.S.A.
[email protected] Kitamura
Institute of Space and Astronautical Science, Japan Aerospace Exploration Agency,3-1-1 Yoshinodai, Sagamihara, Kanagawa 229-8510
Hiroko Shinnaga
Caltech Submillimeter Observatory, California Institute of Technology,111 Nowelo Street, Hilo, HI 96720, U.S.A.
(Received 2007 November 20; accepted 2008 April 7)
Abstract
We carried out an unbiased mapping survey of dense molecular cloud cores traced
by the NH3 (1,1) and (2,2) inversion lines in the GF 9 filament which contains an
extremely young low-mass protostar GF 9-2 (Furuya et al. 2006, ApJ, 653, 1369). The
survey was conducted using the Nobeyama 45 m telescope over a region of ! 1.5!"1!
with an angular resolution of 73"". The large-scale map revealed that the filament
contains at least 7 dense cores, as well as 3 possible ones, located at regular intervals
of ! 0.9 pc. Our analysis shows that these cores have kinetic temperatures of <!10 K and LTE-masses of 1.8 – 8.2 M#, making them typical sites of low-mass star
formation. All the identified cores are likely to be gravitationally unstable because
their LTE-masses are larger than their virial masses. Since the LTE-masses and
separations of the cores are consistent with the Jeans masses and lengths, respectively,
for the low-density ambient gas, we argue that the identified cores have formed via
the gravitational fragmentation of the natal filamentary cloud.
Key words: ISM: clouds — ISM: evolution — individual (GF 9, L 1082) —
molecules — stars: formation — pre-main sequence
1
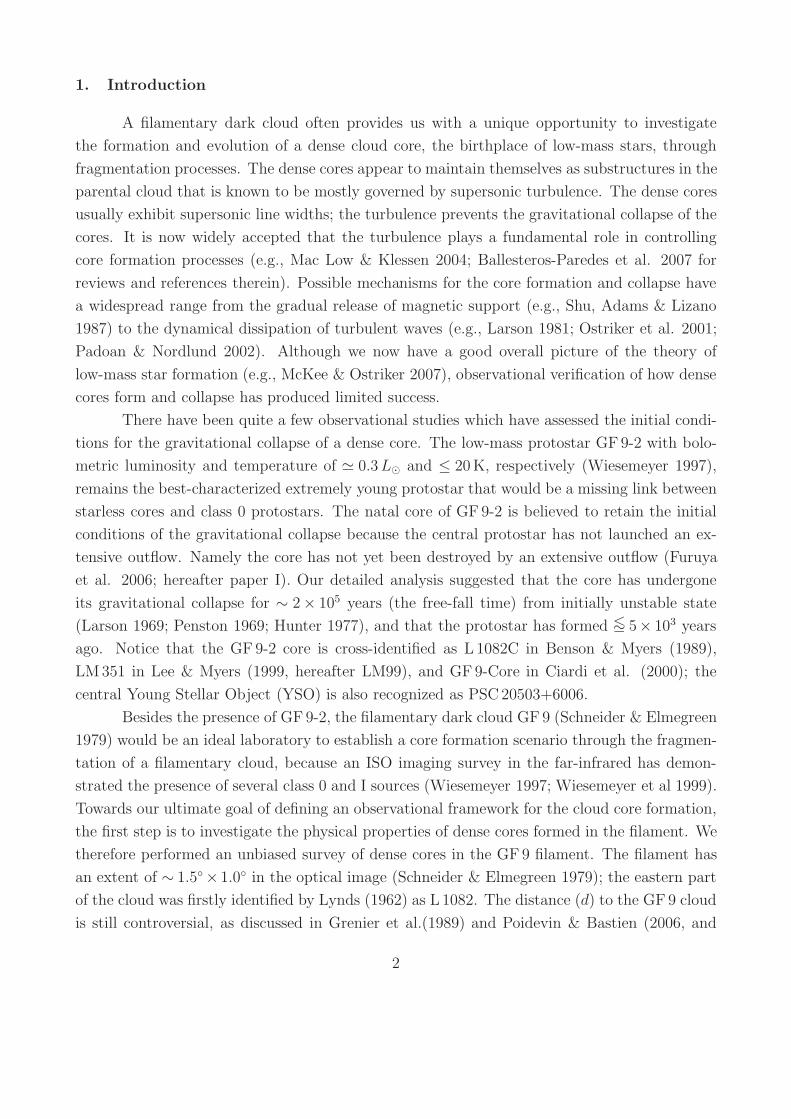
1. Introduction
A filamentary dark cloud often provides us with a unique opportunity to investigate
the formation and evolution of a dense cloud core, the birthplace of low-mass stars, through
fragmentation processes. The dense cores appear to maintain themselves as substructures in the
parental cloud that is known to be mostly governed by supersonic turbulence. The dense cores
usually exhibit supersonic line widths; the turbulence prevents the gravitational collapse of the
cores. It is now widely accepted that the turbulence plays a fundamental role in controlling
core formation processes (e.g., Mac Low & Klessen 2004; Ballesteros-Paredes et al. 2007 for
reviews and references therein). Possible mechanisms for the core formation and collapse have
a widespread range from the gradual release of magnetic support (e.g., Shu, Adams & Lizano
1987) to the dynamical dissipation of turbulent waves (e.g., Larson 1981; Ostriker et al. 2001;
Padoan & Nordlund 2002). Although we now have a good overall picture of the theory of
low-mass star formation (e.g., McKee & Ostriker 2007), observational verification of how dense
cores form and collapse has produced limited success.
There have been quite a few observational studies which have assessed the initial condi-
tions for the gravitational collapse of a dense core. The low-mass protostar GF 9-2 with bolo-
metric luminosity and temperature of # 0.3L# and $ 20 K, respectively (Wiesemeyer 1997),
remains the best-characterized extremely young protostar that would be a missing link between
starless cores and class 0 protostars. The natal core of GF 9-2 is believed to retain the initial
conditions of the gravitational collapse because the central protostar has not launched an ex-
tensive outflow. Namely the core has not yet been destroyed by an extensive outflow (Furuya
et al. 2006; hereafter paper I). Our detailed analysis suggested that the core has undergone
its gravitational collapse for ! 2" 105 years (the free-fall time) from initially unstable state
(Larson 1969; Penston 1969; Hunter 1977), and that the protostar has formed <!% 5" 103 years
ago. Notice that the GF 9-2 core is cross-identified as L 1082C in Benson & Myers (1989),
LM351 in Lee & Myers (1999, hereafter LM99), and GF 9-Core in Ciardi et al. (2000); the
central Young Stellar Object (YSO) is also recognized as PSC20503+6006.
Besides the presence of GF 9-2, the filamentary dark cloud GF 9 (Schneider & Elmegreen
1979) would be an ideal laboratory to establish a core formation scenario through the fragmen-
tation of a filamentary cloud, because an ISO imaging survey in the far-infrared has demon-
strated the presence of several class 0 and I sources (Wiesemeyer 1997; Wiesemeyer et al 1999).
Towards our ultimate goal of defining an observational framework for the cloud core formation,
the first step is to investigate the physical properties of dense cores formed in the filament. We
therefore performed an unbiased survey of dense cores in the GF 9 filament. The filament has
an extent of ! 1.5!"1.0! in the optical image (Schneider & Elmegreen 1979); the eastern part
of the cloud was firstly identified by Lynds (1962) as L 1082. The distance (d) to the GF 9 cloud
is still controversial, as discussed in Grenier et al.(1989) and Poidevin & Bastien (2006, and
2
references therein). In order to keep consistency with paper I, we adopt d = 200 pc, as reported
by Wiesemeyer (1997), who derived the distance towards GF 9-2 based on star counts, instead
of 440 pc (Viotti 1969).
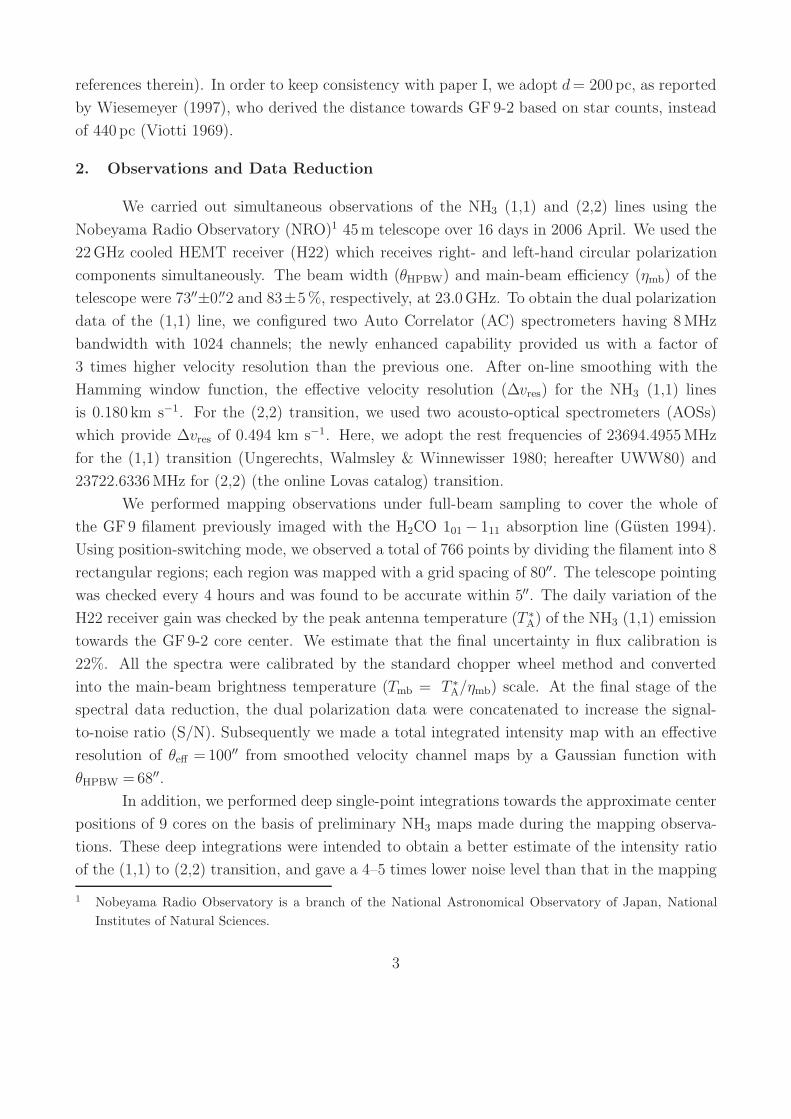
2. Observations and Data Reduction
We carried out simultaneous observations of the NH3 (1,1) and (2,2) lines using the
Nobeyama Radio Observatory (NRO)1 45 m telescope over 16 days in 2006 April. We used the
22 GHz cooled HEMT receiver (H22) which receives right- and left-hand circular polarization
components simultaneously. The beam width (!HPBW) and main-beam e!ciency ("mb) of the
telescope were 73""±0.""2 and 83±5 %, respectively, at 23.0 GHz. To obtain the dual polarization
data of the (1,1) line, we configured two Auto Correlator (AC) spectrometers having 8 MHz
bandwidth with 1024 channels; the newly enhanced capability provided us with a factor of
3 times higher velocity resolution than the previous one. After on-line smoothing with the
Hamming window function, the e"ective velocity resolution (#vres) for the NH3 (1,1) lines
is 0.180 km s$1. For the (2,2) transition, we used two acousto-optical spectrometers (AOSs)
which provide #vres of 0.494 km s$1. Here, we adopt the rest frequencies of 23694.4955 MHz
for the (1,1) transition (Ungerechts, Walmsley & Winnewisser 1980; hereafter UWW80) and
23722.6336 MHz for (2,2) (the online Lovas catalog) transition.
We performed mapping observations under full-beam sampling to cover the whole of
the GF 9 filament previously imaged with the H2CO 101 % 111 absorption line (Gusten 1994).
Using position-switching mode, we observed a total of 766 points by dividing the filament into 8
rectangular regions; each region was mapped with a grid spacing of 80"". The telescope pointing
was checked every 4 hours and was found to be accurate within 5"". The daily variation of the
H22 receiver gain was checked by the peak antenna temperature (T %A) of the NH3 (1,1) emission
towards the GF 9-2 core center. We estimate that the final uncertainty in flux calibration is
22%. All the spectra were calibrated by the standard chopper wheel method and converted
into the main-beam brightness temperature (Tmb = T %A/"mb) scale. At the final stage of the
spectral data reduction, the dual polarization data were concatenated to increase the signal-
to-noise ratio (S/N). Subsequently we made a total integrated intensity map with an e"ective
resolution of !e! =100"" from smoothed velocity channel maps by a Gaussian function with
!HPBW =68"".
In addition, we performed deep single-point integrations towards the approximate center
positions of 9 cores on the basis of preliminary NH3 maps made during the mapping observa-
tions. These deep integrations were intended to obtain a better estimate of the intensity ratio
of the (1,1) to (2,2) transition, and gave a 4–5 times lower noise level than that in the mapping
1 Nobeyama Radio Observatory is a branch of the National Astronomical Observatory of Japan, NationalInstitutes of Natural Sciences.
3
observations.
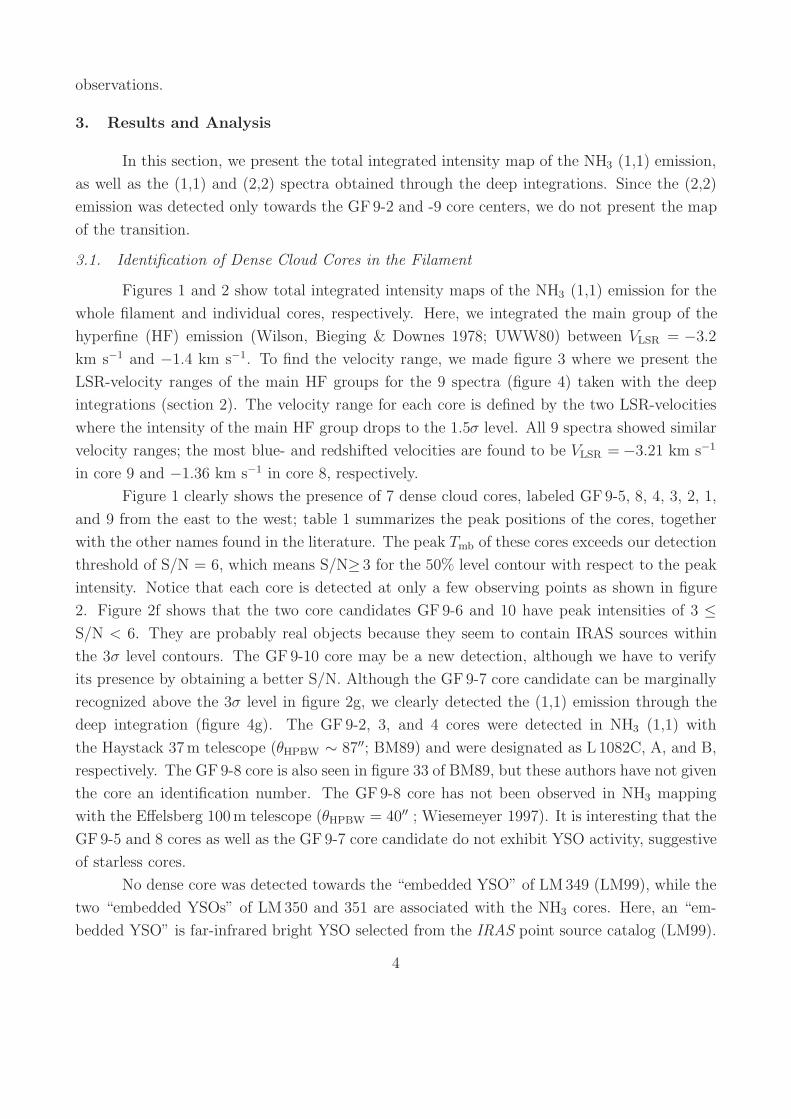
3. Results and Analysis
In this section, we present the total integrated intensity map of the NH3 (1,1) emission,
as well as the (1,1) and (2,2) spectra obtained through the deep integrations. Since the (2,2)
emission was detected only towards the GF 9-2 and -9 core centers, we do not present the map
of the transition.
3.1. Identification of Dense Cloud Cores in the Filament
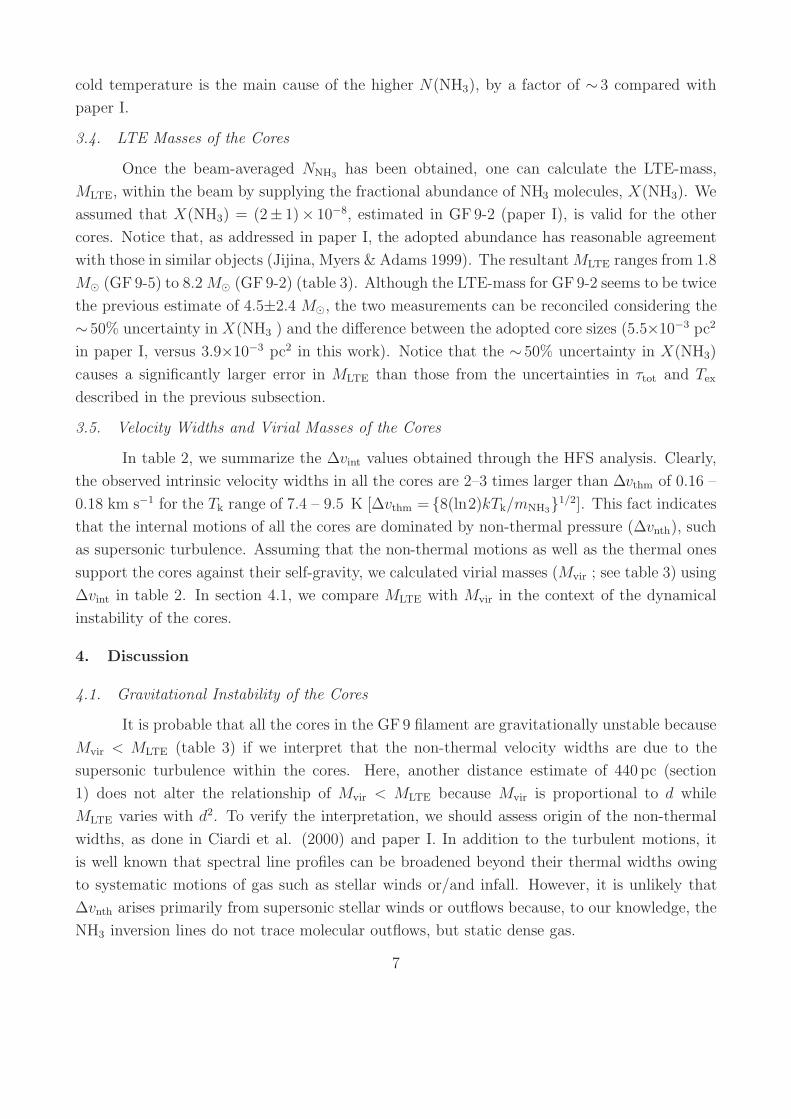
Figures 1 and 2 show total integrated intensity maps of the NH3 (1,1) emission for the
whole filament and individual cores, respectively. Here, we integrated the main group of the
hyperfine (HF) emission (Wilson, Bieging & Downes 1978; UWW80) between VLSR = %3.2
km s$1 and %1.4 km s$1. To find the velocity range, we made figure 3 where we present the
LSR-velocity ranges of the main HF groups for the 9 spectra (figure 4) taken with the deep
integrations (section 2). The velocity range for each core is defined by the two LSR-velocities
where the intensity of the main HF group drops to the 1.5# level. All 9 spectra showed similar
velocity ranges; the most blue- and redshifted velocities are found to be VLSR = %3.21 km s$1
in core 9 and %1.36 km s$1 in core 8, respectively.
Figure 1 clearly shows the presence of 7 dense cloud cores, labeled GF 9-5, 8, 4, 3, 2, 1,
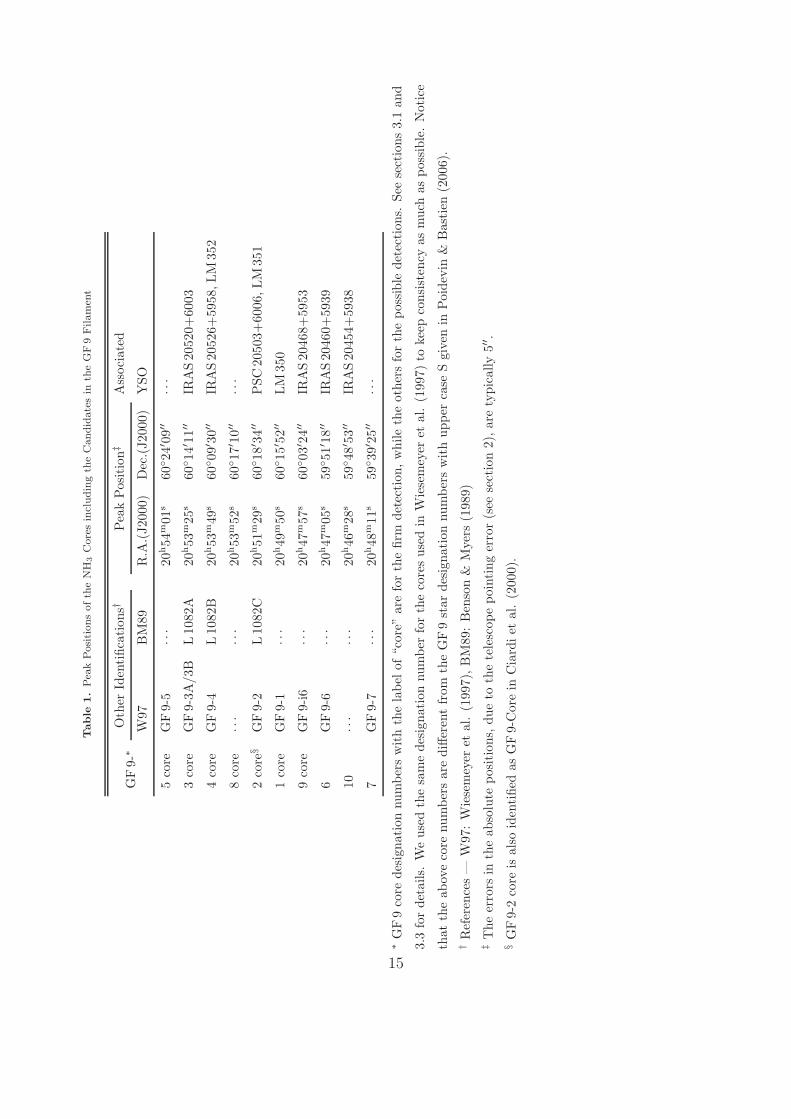
and 9 from the east to the west; table 1 summarizes the peak positions of the cores, together
with the other names found in the literature. The peak Tmb of these cores exceeds our detection
threshold of S/N = 6, which means S/N& 3 for the 50% level contour with respect to the peak
intensity. Notice that each core is detected at only a few observing points as shown in figure
2. Figure 2f shows that the two core candidates GF 9-6 and 10 have peak intensities of 3 $S/N < 6. They are probably real objects because they seem to contain IRAS sources within
the 3# level contours. The GF 9-10 core may be a new detection, although we have to verify
its presence by obtaining a better S/N. Although the GF 9-7 core candidate can be marginally
recognized above the 3# level in figure 2g, we clearly detected the (1,1) emission through the
deep integration (figure 4g). The GF 9-2, 3, and 4 cores were detected in NH3 (1,1) with
the Haystack 37 m telescope (!HPBW ! 87""; BM89) and were designated as L 1082C, A, and B,
respectively. The GF 9-8 core is also seen in figure 33 of BM89, but these authors have not given
the core an identification number. The GF 9-8 core has not been observed in NH3 mapping
with the E"elsberg 100 m telescope (!HPBW = 40"" ; Wiesemeyer 1997). It is interesting that the
GF 9-5 and 8 cores as well as the GF 9-7 core candidate do not exhibit YSO activity, suggestive
of starless cores.
No dense core was detected towards the “embedded YSO” of LM349 (LM99), while the
two “embedded YSOs” of LM350 and 351 are associated with the NH3 cores. Here, an “em-
bedded YSO” is far-infrared bright YSO selected from the IRAS point source catalog (LM99).
4

The relationship between the remaining “embedded YSO” of LM352 and the GF 9-4 core is
not clear (see figure 2d). The absence of an NH3 core around LM349 implies that the “embed-
ded YSO” may be a very low-mass object whose core mass is too small to be detected by our
mapping survey. We also point out that LM349 is close to one local peak in the 13CO (1–0)
column density map of Ciardi et al. (2000; see also figure 1 of Poidevin & Bastien 2006).
It is worth noting that the IRAS sources located in the GF 9-3 and -4 cores are driv-
ing weak molecular outflows with momentum rates of FCO, ! 10$5 % 10$6 M# km s$1 yr$1
(Bontemps et al. 1996), approximately along the north-south direction.
Last, it is likely that the number density of the cores tends to become high towards the
east, while low to the west. In fact, the four cores in the eastern part of the filament, GF 9-3,
4, 5, and 8 seem to be confined to a rather small region of !0.8 pc. Since the mean separation
between the two neighboring cores is 0.36 pc, they can be treated as a group of cores. Similarly,
we consider the GF 9-6 and -10 core candidates as another group. Here, the separations are
calculated using the peak positions in table 1. Consequently, the two core groups, the isolated
GF 9-2, 1, and 9 cores, and the candidate core GF 9-7 are located at regular intervals of ! 0.9 pc.
3.2. NH3 Spectra towards the Cores
Figure 4 presents the 9 spectra of the NH3 (J,K)=(1,1) and (2,2) rotation inversion lines
obtained by the deep integrations (section 2). All the observed positions showed the intense
(1,1) emission with the distinct five groups of the HF components, except for GF 9-7, where the
inner satellite HF groups at VLSR ! +6 km s$1 and %10 km s$1 are barely recognized. Notice
that the NH3 spectra for the core candidates GF 9-6 and 7 were not taken towards the exact
peak positions of the cores (see figure 2f and g).
In contrast to the (1,1) lines, sole the main HF group of the (2,2) transition was detected
towards only GF 9-2 and -9 with S/N & 3. Given the attained S/N in our observations, non-
detection of the satellite (2,2) HF groups does not give a stringent limit in the optical depth,
namely, $22 $ 7 since the intrinsic ratio of the main to satellite groups is about 15.9 for the (2,2)
transition (Wilson et al. 1978). Nevertheless, we believe that the (2,2) lines are optically thin
because the observed Tmb is considerably lower than the excitation temperature of the (1,1)
transition, Tex (1,1) (7.4 – 9.5 K; described in section 3.3).
3.3. Hyperfine Structure Analysis and Column Density Calculations
It is di!cult to accurately know how each core is extended because our survey obser-
vations have been conducted with full-beam sampling. We therefore limit our analysis to the
peak spectra which have su!cient S/N, instead of making source-averaged spectra. To calculate
beam-averaged NH3 column densities (NNH3), we employed hyperfine structure (HFS) analysis,
which gives the total optical depth ($tot), the velocity width (#vFWHM), and the LSR-velocity
of one of the HF components (v0). Here, #vFWHM is the FWHM of a single HF component
and is assumed to be identical for all the HF components, and $tot is defined by the sum of the
5
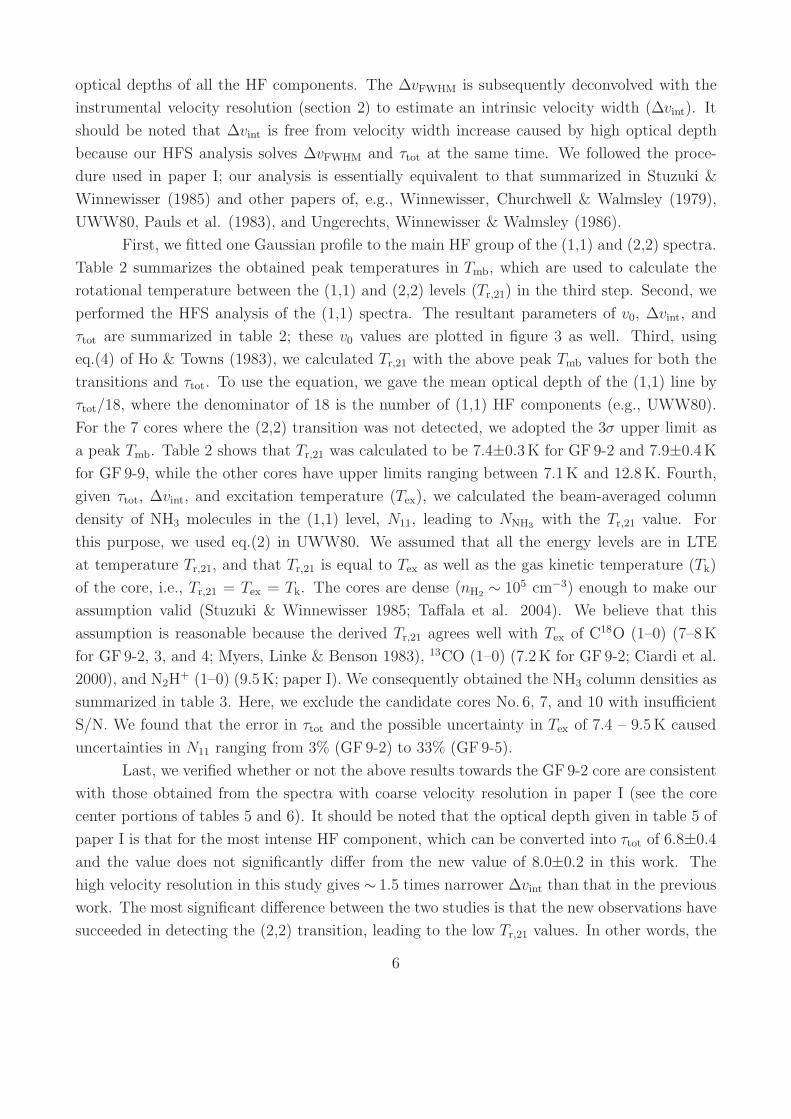
optical depths of all the HF components. The #vFWHM is subsequently deconvolved with the
instrumental velocity resolution (section 2) to estimate an intrinsic velocity width (#vint). It
should be noted that #vint is free from velocity width increase caused by high optical depth
because our HFS analysis solves #vFWHM and $tot at the same time. We followed the proce-
dure used in paper I; our analysis is essentially equivalent to that summarized in Stuzuki &
Winnewisser (1985) and other papers of, e.g., Winnewisser, Churchwell & Walmsley (1979),
UWW80, Pauls et al. (1983), and Ungerechts, Winnewisser & Walmsley (1986).
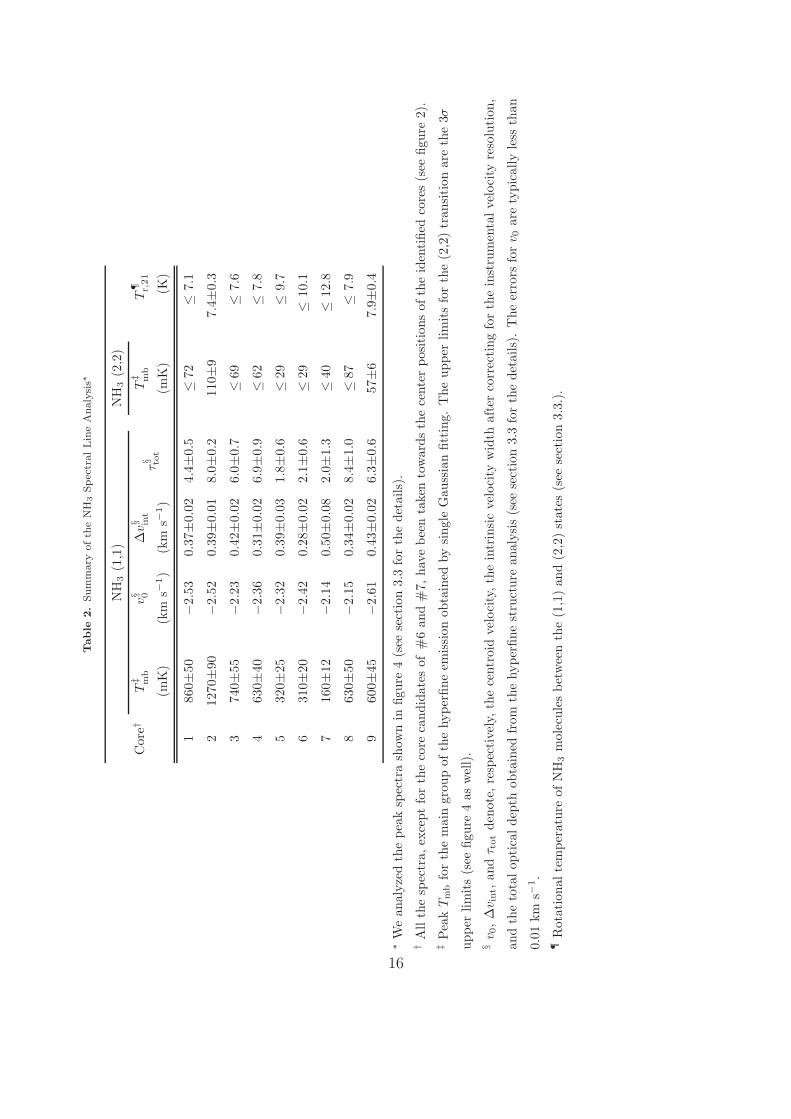
First, we fitted one Gaussian profile to the main HF group of the (1,1) and (2,2) spectra.
Table 2 summarizes the obtained peak temperatures in Tmb, which are used to calculate the
rotational temperature between the (1,1) and (2,2) levels (Tr,21) in the third step. Second, we
performed the HFS analysis of the (1,1) spectra. The resultant parameters of v0, #vint, and
$tot are summarized in table 2; these v0 values are plotted in figure 3 as well. Third, using
eq.(4) of Ho & Towns (1983), we calculated Tr,21 with the above peak Tmb values for both the
transitions and $tot. To use the equation, we gave the mean optical depth of the (1,1) line by
$tot/18, where the denominator of 18 is the number of (1,1) HF components (e.g., UWW80).
For the 7 cores where the (2,2) transition was not detected, we adopted the 3# upper limit as
a peak Tmb. Table 2 shows that Tr,21 was calculated to be 7.4±0.3 K for GF 9-2 and 7.9±0.4 K
for GF 9-9, while the other cores have upper limits ranging between 7.1 K and 12.8 K. Fourth,
given $tot, #vint, and excitation temperature (Tex), we calculated the beam-averaged column
density of NH3 molecules in the (1,1) level, N11, leading to NNH3 with the Tr,21 value. For
this purpose, we used eq.(2) in UWW80. We assumed that all the energy levels are in LTE
at temperature Tr,21, and that Tr,21 is equal to Tex as well as the gas kinetic temperature (Tk)
of the core, i.e., Tr,21 = Tex = Tk. The cores are dense (nH2 ! 105 cm$3) enough to make our
assumption valid (Stuzuki & Winnewisser 1985; Ta"ala et al. 2004). We believe that this
assumption is reasonable because the derived Tr,21 agrees well with Tex of C18O (1–0) (7–8 K
for GF 9-2, 3, and 4; Myers, Linke & Benson 1983), 13CO (1–0) (7.2 K for GF 9-2; Ciardi et al.
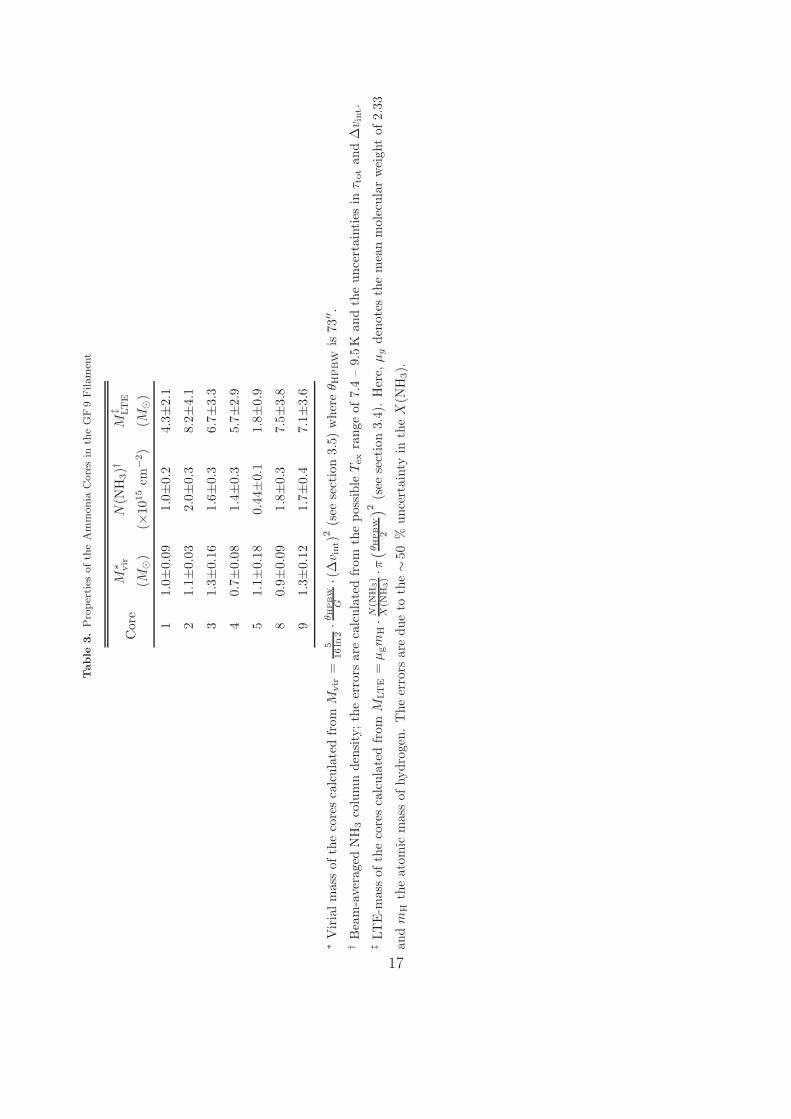
2000), and N2H+ (1–0) (9.5 K; paper I). We consequently obtained the NH3 column densities as
summarized in table 3. Here, we exclude the candidate cores No. 6, 7, and 10 with insu!cient
S/N. We found that the error in $tot and the possible uncertainty in Tex of 7.4 – 9.5 K caused
uncertainties in N11 ranging from 3% (GF 9-2) to 33% (GF 9-5).
Last, we verified whether or not the above results towards the GF 9-2 core are consistent
with those obtained from the spectra with coarse velocity resolution in paper I (see the core
center portions of tables 5 and 6). It should be noted that the optical depth given in table 5 of
paper I is that for the most intense HF component, which can be converted into $tot of 6.8±0.4
and the value does not significantly di"er from the new value of 8.0±0.2 in this work. The
high velocity resolution in this study gives ! 1.5 times narrower #vint than that in the previous
work. The most significant di"erence between the two studies is that the new observations have
succeeded in detecting the (2,2) transition, leading to the low Tr,21 values. In other words, the
6
cold temperature is the main cause of the higher N(NH3), by a factor of ! 3 compared with
paper I.
3.4. LTE Masses of the Cores
Once the beam-averaged NNH3 has been obtained, one can calculate the LTE-mass,
MLTE, within the beam by supplying the fractional abundance of NH3 molecules, X(NH3). We
assumed that X(NH3) = (2± 1)" 10$8, estimated in GF 9-2 (paper I), is valid for the other
cores. Notice that, as addressed in paper I, the adopted abundance has reasonable agreement
with those in similar objects (Jijina, Myers & Adams 1999). The resultant MLTE ranges from 1.8
M# (GF 9-5) to 8.2 M# (GF 9-2) (table 3). Although the LTE-mass for GF 9-2 seems to be twice
the previous estimate of 4.5±2.4 M#, the two measurements can be reconciled considering the
! 50% uncertainty in X(NH3 ) and the di"erence between the adopted core sizes (5.5"10$3 pc2
in paper I, versus 3.9"10$3 pc2 in this work). Notice that the ! 50% uncertainty in X(NH3)
causes a significantly larger error in MLTE than those from the uncertainties in $tot and Tex
described in the previous subsection.
3.5. Velocity Widths and Virial Masses of the Cores
In table 2, we summarize the #vint values obtained through the HFS analysis. Clearly,
the observed intrinsic velocity widths in all the cores are 2–3 times larger than #vthm of 0.16 –
0.18 km s$1 for the Tk range of 7.4 – 9.5 K [#vthm = {8(ln2)kTk/mNH3}1/2]. This fact indicates
that the internal motions of all the cores are dominated by non-thermal pressure (#vnth), such
as supersonic turbulence. Assuming that the non-thermal motions as well as the thermal ones
support the cores against their self-gravity, we calculated virial masses (Mvir ; see table 3) using
#vint in table 2. In section 4.1, we compare MLTE with Mvir in the context of the dynamical
instability of the cores.
4. Discussion
4.1. Gravitational Instability of the Cores
It is probable that all the cores in the GF 9 filament are gravitationally unstable because
Mvir < MLTE (table 3) if we interpret that the non-thermal velocity widths are due to the
supersonic turbulence within the cores. Here, another distance estimate of 440 pc (section
1) does not alter the relationship of Mvir < MLTE because Mvir is proportional to d while
MLTE varies with d2. To verify the interpretation, we should assess origin of the non-thermal
widths, as done in Ciardi et al. (2000) and paper I. In addition to the turbulent motions, it
is well known that spectral line profiles can be broadened beyond their thermal widths owing
to systematic motions of gas such as stellar winds or/and infall. However, it is unlikely that
#vnth arises primarily from supersonic stellar winds or outflows because, to our knowledge, the
NH3 inversion lines do not trace molecular outflows, but static dense gas.
7
We suggest that the non-thermal velocity widths of the cores are produced by the large-
scale infall motions rather than the turbulent ones. In fact, we discussed the presence of
the supersonic infalling motions all over the GF 9-2 core in paper I. Our recent follow-up
observations have clearly detected blue-skewed profiles in the optically thick HCO+ (3–2) and
(1–0) lines over the GF 9-2 core (R. S. Furuya et al., in prep.). Moreover, we have detected
such blue-skewed profiles towards the peak positions of the GF 9-4, 8, and 9 cores with the
(3–2) transition. These facts reinforce the idea that the internal motions of the cores in the
GF 9 filament are dominated by the large-scale supersonic infalling motions, although we have
to assess the presence of the infall in all the cores through mapping observations. If this
interpretation is valid for all the cores, Mvir should be calculated solely with the thermal width,
i.e., Mvir,thm = 532ln2 ·
!HPBWG · kTk
µmH, yielding 0.19 – 0.25 M# for the Tex range of 7.4 – 9.5 K. This
estimate suggests that most of the cores should be gravitationally unstable because Mvir,thm <
MLTE in spite of the ! 50% uncertainty in MLTE.
4.2. Formation of the Cores in the Filament
A gravitational fragmentation process can explain why the dense cores in the GF 9
filament are located at regular intervals of !0.9 pc (see figure 1). Recall that we consider the
GF 9-5, 8, 4, and 3 cores, as well as the GF 9-6 and 10 core candidates, as groups (§3.1). For
simplicity, we compare the core separation with an expected Jeans length (%J) for the filament.
Ciardi et al. (2000) estimated a density of nH2 = 1700±200 cm$3 for the GF 9 filament from
their 13CO (1–0) observations. Assuming that the ambient gas has a typical density of ! 103
cm$3, %J is computed to be ! 0.6 pc at Tk = 10 K. This estimate is not significantly di"erent
from the core separation of ! 0.9 pc. Here, the temperature of 10 K is taken from the typical
peak Tmb (6–7 K) of the optically thick 12CO (3–2) and (1–0) emission derived in the ambient
gas around the GF 9-2 core (paper I). In addition, the Jeans mass for Tk = 10 K and nH2 ! 103
cm$3 is calculated to be !3 M# which is comparable to the core LTE-masses (table 3). Such an
estimate based on the ”classical” Jeans analysis implies that the fragmentation of the filament
has been caused by the gravitational instability.
Alternatively, the spatial distribution of the identified cores might be understood in
terms of the magnetohydrodynamical instability of the GF 9 filamentary cloud, as Hanawa
et al. (1993) proposed for interpreting the ongoing fragmentation process in the Orion A
filamentary cloud. They discussed that the e"ective sound velocity increases when the e"ect of
magnetic field and/or rotation is considered [see their eq.(11)], and that the Jeans length of the
filament becomes as short as the core separation unless the filament is almost perpendicular to
the plane-of-sky. The apparent configuration of the GF 9 filament would be somewhat similar
to that of the Orion cloud. However, to make such a comparison, we need to know not only
basic parameters characterizing the filament such as length, width, inclination angle, and total
mass, but also magnetic field strength and/or velocity field.
8
5. Summary
Using the Nobeyama 45 m telescope, we carried out an unbiased survey of dense molecu-
lar cores in the GF 9 filament. The obtained large-scale map of the NH3 (1,1) emission revealed
that the filament contains 7 dense (nH2 ! 104 cm$3) and cold (Tk<! 10 K) cores having the
LTE-masses of 1.8 – 8.2 M# and the three candidates located at the regular intervals of !0.9 pc.
We argued that these cores appear to be gravitationally unstable and have formed through the
gravitational fragmentation of the natal filamentary cloud. Further high-resolution imaging of
the identified cores, as well as a search for blue-skewed infall profiles over the cores will allow
us to discuss the physical properties of the cores on a more solid ground. We lastly point out
that good knowledge of the velocity field of the low-density inter-core gas traced by, e.g., the13CO (1–0) line will provide us with an essential clue towards understanding the formation
mechanism of star forming cores in a filamentary cloud.
The authors sincerely thank Thomas A. Bell for critical reading of the paper. R. S. F.
thanks Isabel de Maurissens for providing a copy of the Viotti (1969) paper which is published
in Memorie della Societa Astronomia Italiana. It is a great pleasure to thank the sta" of NRO
for their generous help during the observations. This work is partially supported by a Grant-
in-Aid for Scientific Research (A) from the Ministry of Education, Culture, Sports, Science and
Technology of Japan (No. 19204020).
References
Ballesteros-Paredes, J., Klessen, R. S., Mac Low, M.-M., & Vazquez-Semadeni, E. 2007, Protostarsand Planets V, 63
Benson, P. J., & Myers, P. C. 1989, ApJS, 71, 89Bontemps, S., Andre, P., Terebey, S., & Cabrit, S. 1996, A&A, 311, 858Ciardi, D. R., Woodward, C. E., Clemens, D. P., Harker, D. E., & Rudy, R. J. 1998, AJ, 116, 349Ciardi, D. R., Woodward, C. E., Clemens, D. P., Harker, D. E., & Rudy, R. J. 2000, AJ, 120, 393Furuya, R. S., Kitamura, Y., & Shinnaga, H. 2006, ApJ, 653, 1369 (paper I)Grenier, I. A., Lebrun, F., Arnaud, M., Dame, T. M., & Thaddeus, P. 1989, ApJ, 347, 231Gusten, R. 1994, The Cold Universe, 169Hanawa, T., et al. 1993, ApJL, 404, L83Ho, P. T. P. & Townes, C. H. 1983, ARA&A, 21, 239Hunter, C. 1977, ApJ, 218, 834Jijina, J., Myers, P. C., & Adams, F. C. 1999, ApJS, 125, 161Jones, T. J. 2003, AJ, 125, 3208Larson, R. B. 1969, MNRAS, 145, 271Larson, R. B. 1981, MNRAS, 194, 809Lee, C. W., & Myers, P. C. 1999, ApJS, 123, 233 (LM99)
9

Lynds, B. T. 1962, ApJS, 7, 1Mac Low, M.-M., & Klessen, R. S. 2004, Reviews of Modern Physics, 76, 125McKee, C. F., & Ostriker, E. C. 2007, ARA&A, 45, 565Myers, P. C., Linke, R. A., & Benson, P. J. 1983, ApJ, 264, 517Ostriker, E. C., Stone, J. M., & Gammie, C. F. 2001, ApJ, 546, 980Padoan, P., & Nordlund, A. 2002, ApJ, 576, 870Pauls, A., Wilson, T. L., Bieging, J. H., & Martin, R. N. 1983, A&A, 124, 23Penston, M. V. 1969, MNRAS, 144, 425Poidevin, F., & Bastien, P. 2006, ApJ, 650, 945Schneider, S., & Elmegreen, B. G. 1979, ApJS, 41, 87Shu, F. H., Adams, F. C., & Lizano, S. 1987, ARA&A, 25, 23Stutzki, J., & Winnewisser, G. 1985, A&A, 144, 13Stutzki, J., Ungerechts, H., & Winnewisser, G. 1982, A&A, 111, 201Tafalla, M., Myers, P. C., Caselli, P., & Walmsley, C. M. 2004, A&A, 416, 191Ungerechts, H., Walmsley, C. M., & Winnewisser, G. 1980, A&A, 88, 259 (UWW80)Ungerechts, H., Winnewisser, G., & Walmsley, C. M. 1986, A&A, 157, 207Viotti, N. R., 1969, Mem. Soc. Astron. Italiana, 40, 75Wiesemeyer, H. 1997, The spectral signature of accretion in low-mass protostars, Ph.D. Dissertation,
University of BonnWiesemeyer, H., Cox, P., Gusten, R., & Zylka, R. 1999, ESA SP-427: The Universe as Seen by ISO,
533Wilson, T. L., Bieging, J., & Downes, D. 1978, A&A, 63, 1Winnewisser, G., Churchwell, E., & Walmsley, C. M. 1979, A&A, 72, 215
10
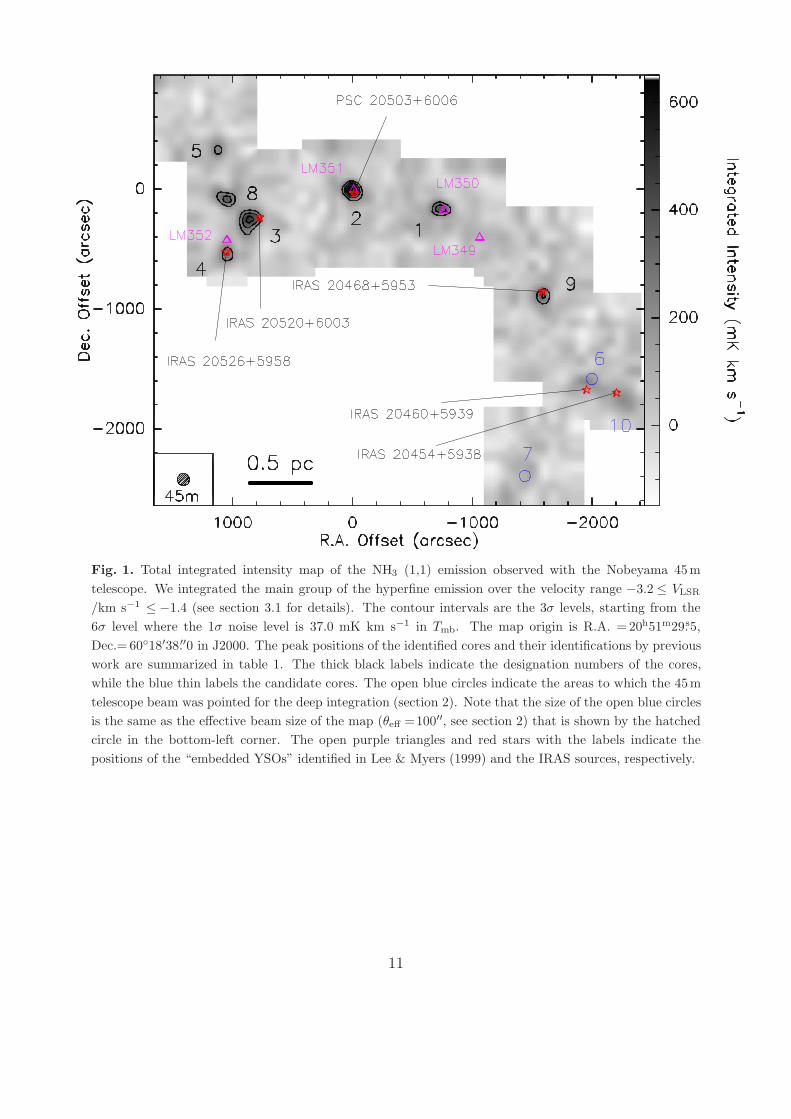
Fig. 1. Total integrated intensity map of the NH3 (1,1) emission observed with the Nobeyama 45mtelescope. We integrated the main group of the hyperfine emission over the velocity range %3.2 $ VLSR
/km s!1 $ %1.4 (see section 3.1 for details). The contour intervals are the 3! levels, starting from the6! level where the 1! noise level is 37.0 mK km s!1 in Tmb. The map origin is R.A. =20h51m29.s5,Dec.= 60"18#38.##0 in J2000. The peak positions of the identified cores and their identifications by previouswork are summarized in table 1. The thick black labels indicate the designation numbers of the cores,while the blue thin labels the candidate cores. The open blue circles indicate the areas to which the 45mtelescope beam was pointed for the deep integration (section 2). Note that the size of the open blue circlesis the same as the e!ective beam size of the map ("e! =100##, see section 2) that is shown by the hatchedcircle in the bottom-left corner. The open purple triangles and red stars with the labels indicate thepositions of the “embedded YSOs” identified in Lee & Myers (1999) and the IRAS sources, respectively.
11
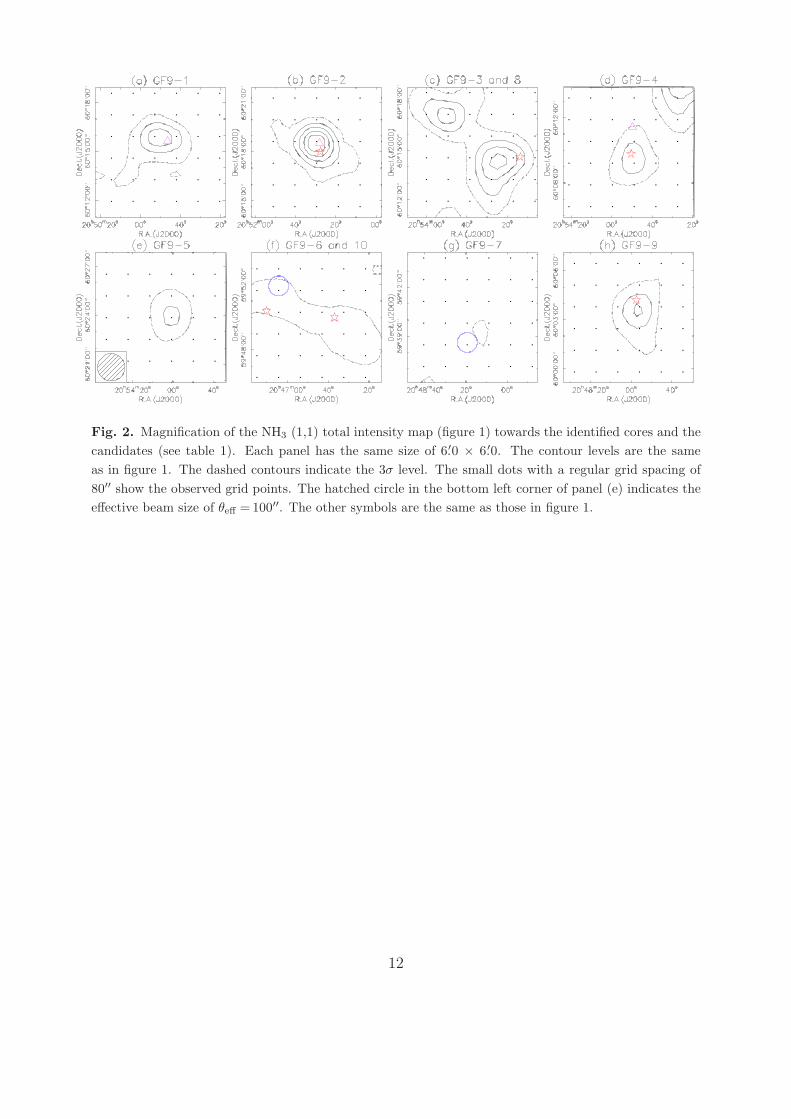
Fig. 2. Magnification of the NH3 (1,1) total intensity map (figure 1) towards the identified cores and thecandidates (see table 1). Each panel has the same size of 6.#0 " 6.#0. The contour levels are the sameas in figure 1. The dashed contours indicate the 3! level. The small dots with a regular grid spacing of80## show the observed grid points. The hatched circle in the bottom left corner of panel (e) indicates thee!ective beam size of "e! = 100##. The other symbols are the same as those in figure 1.
12
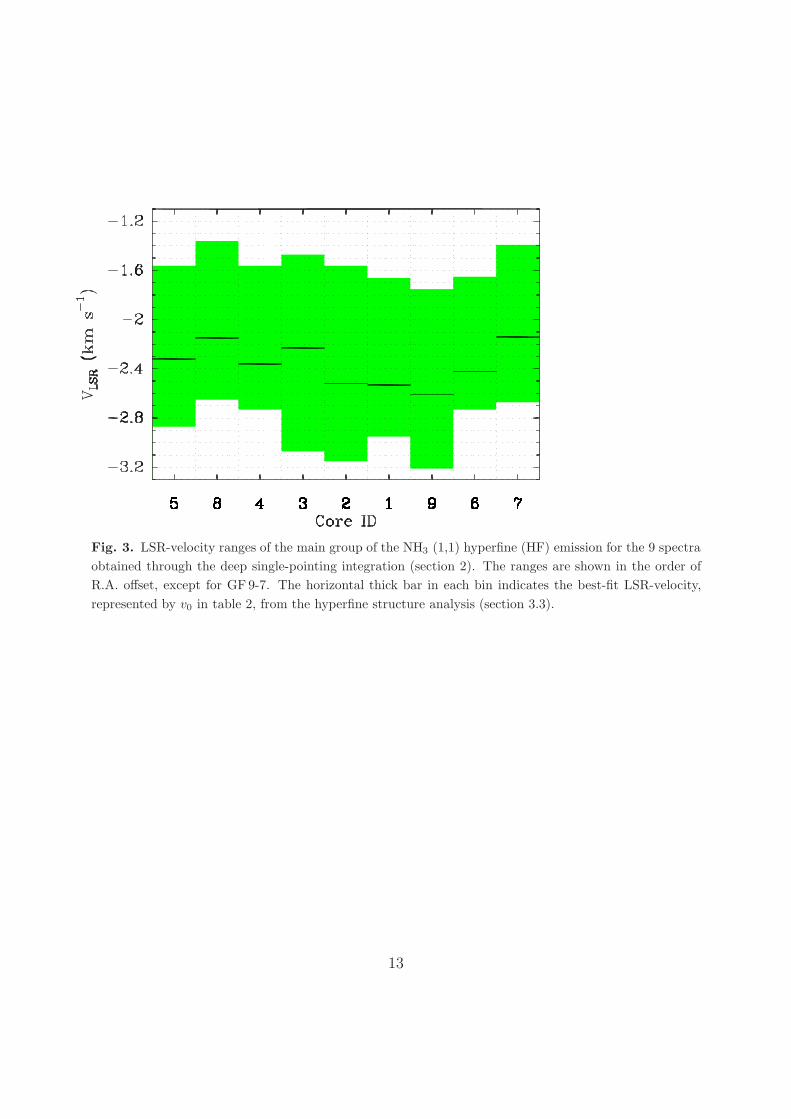
Fig. 3. LSR-velocity ranges of the main group of the NH3 (1,1) hyperfine (HF) emission for the 9 spectraobtained through the deep single-pointing integration (section 2). The ranges are shown in the order ofR.A. o!set, except for GF9-7. The horizontal thick bar in each bin indicates the best-fit LSR-velocity,represented by v0 in table 2, from the hyperfine structure analysis (section 3.3).
13
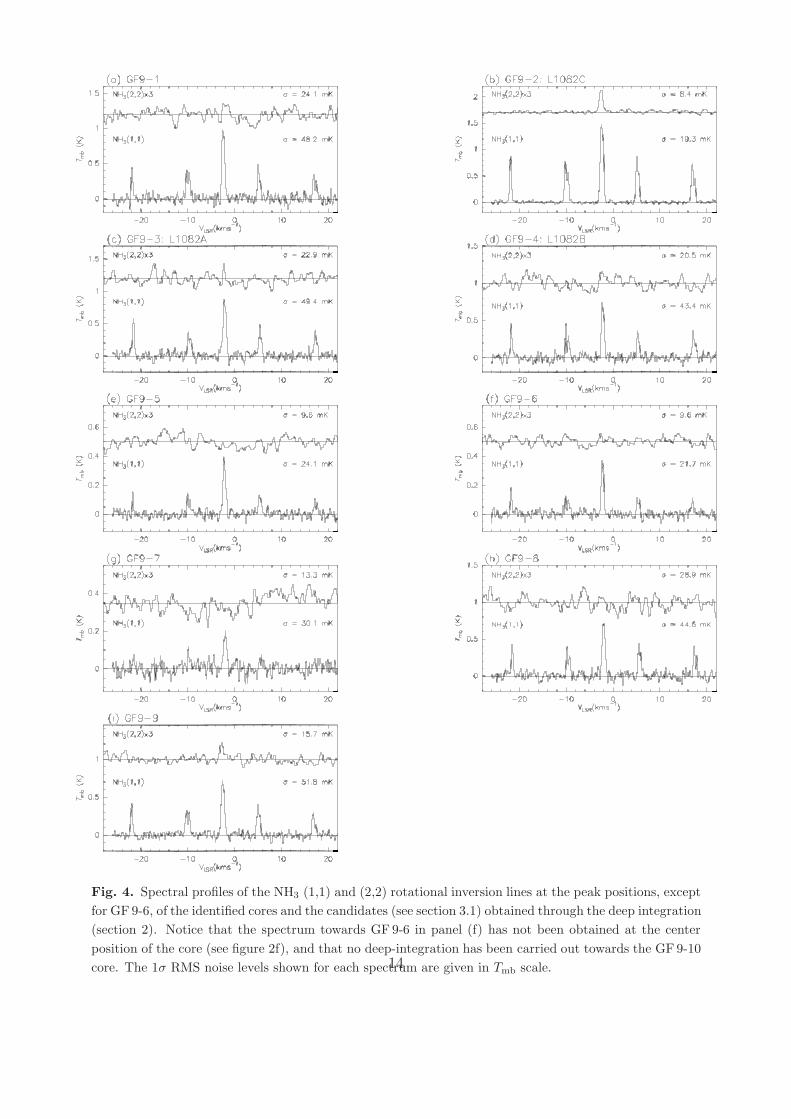
Fig. 4. Spectral profiles of the NH3 (1,1) and (2,2) rotational inversion lines at the peak positions, exceptfor GF9-6, of the identified cores and the candidates (see section 3.1) obtained through the deep integration(section 2). Notice that the spectrum towards GF9-6 in panel (f) has not been obtained at the centerposition of the core (see figure 2f), and that no deep-integration has been carried out towards the GF9-10core. The 1! RMS noise levels shown for each spectrum are given in Tmb scale.14
Table
1.
Pea
kPos
itio
ns
ofth
eN
H3
Cor
esin
cludin
gth
eC
andid
ates
inth
eG
F9
Filam
ent
GF
9-$
Oth
erId
enti
ficat
ions
†P
eak
Pos
itio
n‡A
ssoc
iate
d
W97
BM
89R
.A.(
J200
0)D
ec.(
J200
0)Y
SO
5co
reG
F9-
5···
20h54
m01
s60
" 24#
09##
···
3co
reG
F9-
3A/3
BL
1082
A20
h53
m25
s60
" 14#
11##
IRA
S20
520+
6003
4co
reG
F9-
4L
1082
B20
h53
m49
s60
" 09#
30##
IRA
S20
526+
5958
,LM
352
8co
re···
···
20h53
m52
s60
" 17#
10##
···
2co
re§
GF
9-2
L10
82C
20h51
m29
s60
" 18#
34##
PSC
2050
3+60
06,L
M35
1
1co
reG
F9-
1···
20h49
m50
s60
" 15#
52##
LM35
0
9co
reG
F9-
i6···
20h47
m57
s60
" 03#
24##
IRA
S20
468+
5953
6G
F9-
6···
20h47
m05
s59
" 51#
18##
IRA
S20
460+
5939
10···
···
20h46
m28
s59
" 48#
53##
IRA
S20
454+
5938
7G
F9-
7···
20h48
m11
s59
" 39#
25##
···
$G
F9
core
desi
gnat
ion
num
bers
wit
hth
ela
belo
f“co
re”
are
for
the
firm
dete
ctio
n,w
hile
the
othe
rsfo
rth
epo
ssib
lede
tect
ions
.Se
ese
ctio
ns3.
1an
d
3.3
for
deta
ils.
We
used
the
sam
ede
sign
atio
nnu
mbe
rfo
rth
eco
res
used
inW
iese
mey
eret
al.
(199
7)to
keep
cons
iste
ncy
asm
uch
aspo
ssib
le.
Not
ice
that
the
abov
eco
renu
mbe
rsar
edi!e
rent
from
the
GF
9st
arde
sign
atio
nnu
mbe
rsw
ith
uppe
rca
seS
give
nin
Poi
devi
n&
Bas
tien
(200
6).
†R
efer
ence
s—
W97
:W
iese
mey
eret
al.
(199
7),B
M89
:B
enso
n&
Mye
rs(1
989)
‡T
heer
rors
inth
eab
solu
tepo
siti
ons,
due
toth
ete
lesc
ope
poin
ting
erro
r(s
eese
ctio
n2)
,are
typi
cally
5## .
§G
F9-
2co
reis
also
iden
tifie
das
GF
9-C
ore
inC
iard
iet
al.
(200
0).
15
Table
2.
Sum
mar
yof
the
NH
3Spec
tral
Lin
eA
nal
ysi
s!
NH
3(1
,1)
NH
3(2
,2)
Cor
e†T
‡ mb
v§ 0"
v§ int
#§ to
t
T‡ mb
T¶ r,21
(mK
)(k
ms!
1)
(km
s!1)
(mK
)(K
)
186
0±50
%2.
530.
37±
0.02
4.4±
0.5
$72
$7.
1
212
70±
90%
2.52
0.39
±0.
018.
0±0.
211
0±9
7.4±
0.3
374
0±55
%2.
230.
42±
0.02
6.0±
0.7
$69
$7.
6
463
0±40
%2.
360.
31±
0.02
6.9±
0.9
$62
$7.
8
532
0±25
%2.
320.
39±
0.03
1.8±
0.6
$29
$9.
7
631
0±20
%2.
420.
28±
0.02
2.1±
0.6
$29
$10
.1
716
0±12
%2.
140.
50±
0.08
2.0±
1.3
$40
$12
.8
863
0±50
%2.
150.
34±
0.02
8.4±
1.0
$87
$7.
9
960
0±45
%2.
610.
43±
0.02
6.3±
0.6
57±
67.
9±0.
4
$W
ean
alyz
edth
epe
aksp
ectr
ash
own
infig
ure
4(s
eese
ctio
n3.
3fo
rth
ede
tails
).†
All
the
spec
tra,
exce
ptfo
rth
eco
reca
ndid
ates
of#
6an
d#
7,ha
vebe
enta
ken
tow
ards
the
cent
erpo
siti
ons
ofth
eid
enti
fied
core
s(s
eefig
ure
2).
‡P
eak
Tm
bfo
rth
em
ain
grou
pof
the
hype
rfine
emis
sion
obta
ined
bysi
ngle
Gau
ssia
nfit
ting
.T
heup
per
limit
sfo
rth
e(2
,2)
tran
siti
onar
eth
e3!
uppe
rlim
its
(see
figur
e4
asw
ell)
.§
v 0,"
v int,
and
# tot
deno
te,r
espe
ctiv
ely,
the
cent
roid
velo
city
,the
intr
insi
cve
loci
tyw
idth
afte
rco
rrec
ting
for
the
inst
rum
enta
lvel
ocity
reso
luti
on,
and
the
tota
lopt
ical
dept
hob
tain
edfr
omth
ehy
perfi
nest
ruct
ure
anal
ysis
(see
sect
ion
3.3
for
the
deta
ils).
The
erro
rsfo
rv 0
are
typi
cally
less
than
0.01
kms!
1.
¶R
otat
iona
ltem
pera
ture
ofN
H3
mol
ecul
esbe
twee
nth
e(1
,1)
and
(2,2
)st
ates
(see
sect
ion
3.3.
).
16
Table
3.
Pro
per
ties
ofth
eA
mm
onia
Cor
esin
the
GF
9Filam
ent
Cor
eM
$ vir
N(N
H3)†
M‡ LT
E
(M%
)("
1015
cm!
2)
(M%)
11.
0±0.
091.
0±0.
24.
3±2.
1
21.
1±0.
032.
0±0.
38.
2±4.
1
31.
3±0.
161.
6±0.
36.
7±3.
3
40.
7±0.
081.
4±0.
35.
7±2.
9
51.
1±0.
180.
44±
0.1
1.8±
0.9
80.
9±0.
091.
8±0.
37.
5±3.
8
91.
3±0.
121.
7±0.
47.
1±3.
6
$V
iria
lmas
sof
the
core
sca
lcul
ated
from
Mvir
=5
16ln
2·!
HPBW
G·("
v int)
2(s
eese
ctio
n3.
5)w
here
" HP
BW
is73
##.
†B
eam
-ave
rage
dN
H3
colu
mn
dens
ity;t
heer
rors
are
calc
ulat
edfr
omth
epo
ssib
leT
exra
nge
of7.
4–
9.5K
and
the
unce
rtai
ntie
sin
# tot
and"
v int.
‡LT
E-m
ass
ofth
eco
res
calc
ulat
edfr
omM
LT
E=
µgm
H·N
(NH
3)
X(N
H3)·$
! !H
PBW
2
" 2(s
eese
ctio
n3.
4).
Her
e,µ
gde
note
sth
em
ean
mol
ecul
arw
eigh
tof
2.33
and
mH
the
atom
icm
ass
ofhy
drog
en.
The
erro
rsar
edu
eto
the!
50%
unce
rtai
nty
inth
eX
(NH
3).
17