Embed Size (px)
Citation preview

Low Level Offenses in Minneapolis: An Analysis of Arrests and their Outcomes
November 2004
Prepared by the Council on Crime and Justice

Council on Crime and Justice November, 2004
1
TABLE OF CONTENTS
ACKNOWLEDGEMENTS....................................................................2
EXECUTIVE SUMMARY.....................................................................3
BACKGROUND......................................................................................5
LOW LEVEL OFFENSE STUDY SPECIFIC INFORMATION.......9
Definitions..........................................................10
Methodology................................. ......................12
Data Collection and Challenges Faced...............13
Analysis...............................................................15
Overall Sample-Citation and Arrests..................15
Citations..............................................................17
Arrests.................................................................19
Citations versus Arrest........................................21
Charged versus Not Charged After an Arrest....23
Case Outcomes...................................................24
Sentencing...........................................................28
Criminal Histories..............................................29
DISCUSSION.........................................................................................32
Developments Since Data Collection.................32
HIGHLIGHTS of FINDINGS...............................................................34
RECOMENDATIONS...........................................................................35
APPENDIXES........................................................................................38
APPENDIX A: Statutory Description of Offenses Studied.....38

Council on Crime and Justice November, 2004
2
ACKNOWLEDGEMENTS
This report would not have been possible without the assistance and expertise of many individuals. The Council on Crime and Justice would like to thank the following persons: John Morgan and the Department of Justice for funding the Study. The Advisory Board: Murphy Laurfele, Minneapolis City Attorney’s Office; Marie Przynski, Minneapolis Police Department; Richard Bell, Minneapolis Urban League; Becky Ericson and Mary Knudsen consultants; Suzanne Fischer, Minnesota Bureau of Criminal Apprehension; Michelle Gross, Bryce Williams, community members. Doug Hicks, from the Minneapolis Police Department, who programmed CAPERS and provided the names of those arrested in 2001 for the 7 offense categories. Deborah Eckberg Ph.D, Principal Research Analyst for Hennepin County District Court, who programmed the court data and answered our numerous questions. Tom Kovarik with Hennepin County District Court who programmed the criminal history data. Marcy Podkopacz, Ph.D. and Director of Research, Hennepin County District Court, was also helpful answering questions and sending us information to help with programming and court process. Lynda Kochevar with Hennepin County Adult Detention Center who provided the jail files. ********************************************************************************* Authors: Julie Atella, Becky Ericson, Laura Schauben, Ebony Ruhland, Tom Johnson

Council on Crime and Justice November, 2004
3
EXECUTIVE SUMMARY
This Study examines citations and arrests for seven community-identified low level
misdemeanor offenses in Minneapolis. It originated from concerns expressed at a 2001 community
meeting facilitated by the Council on Crime and Justice. Community members held opposing views
regarding police action toward individuals suspected of committing these offenses. Some took the
position that police action was a form of harassment, or simply a fishing expedition which might lead to
charges for more serious crimes. Alternatively, others took the position that low level offenders were
not taken seriously by the criminal justice system beyond the point of police contact and thus repeat
offending was not deterred.
The Study addresses these contrasting views by analyzing a 2001 sample of individuals cited or
arrested for Driving After Revocation, Driving After Cancellation, No Valid Drivers License, Disorderly
Conduct, Loitering with Intent to Commit Prostitution, Loitering with Intent to Sell Narcotics, and
Lurking with Intent to Commit a Crime. Arrested individuals were tracked from point of initial contact
through charging decision and subsequent case outcome. Criminal histories of those arrested were also
examined.
The results showed that significant racial differences occurred at the point of contact between
police and citizens. For example, Blacks were 15 times more likely to be arrested than Whites. By
The point of conviction, blacks were only 7 times more likely than Whites to be convicted1.
Further, the prior conviction history of those arrested was not extensive. Over 70% of those
charged had no prior convictions or only misdemeanor convictions. Put another way, less than one third
1 This study did not examine “why” these disparities existed at point of contact or changed as cases moved through the justice system. The authors expect a higher conviction rate for Blacks due to the fact that there is such a sizeable disparity at the point of contact.

Council on Crime and Justice November, 2004
4
of those charged had prior felony or gross misdemeanor convictions. Finally, the criminal history
analysis showed that Black individuals with few or no prior convictions were arrested more often that
Whites with the same conviction history.
Highlights of Findings
For the select low level offenses in Minneapolis, the rates for receiving a citation or being arrested in 2001 were:
o Whites: 1 in 60 o Blacks: 1 in 4
Blacks were 15 times more likely than Whites to be either arrested or cited. Significant racial disparity occurs at point of contact between police and citizen. Disparity is not as evident as cases move forward from point of contact between police and
citizen, but is still found at some points of time in the process and is also extremely skewed given the race of those who enter the process.
Conviction rates for arrests are very small. 21.9% of all people arrested were convicted (Black 19.3%, White 25.9%). Less than a third of the people charged have felony and/or gross misdemeanor convictions. Over 70% of the people charged have no prior convictions or only misdemeanor convictions. Multiple arrests of people who have no or few convictions occur much more frequently for
Blacks than Whites.
These and other Study findings were discussed at a Community Forum held at the Minneapolis
Urban League on July 27th. At that time police and community representatives indicated a willingness
to begin a constructive dialogue regarding arrest strategies and desired neighborhood outcomes. It is
hoped this dialogue, along with the other recommendations contained in this Report, will lead to the
most effective and fair practices.

Council on Crime and Justice November, 2004
5
BACKGROUND
The Low Level Offense Study examines potential disparities in police behavior and subsequent
court outcomes for seven low level offenses. These seven offenses, chosen by a group of community
members in Minneapolis, Minnesota after a preliminary review of police and jail data, include: Driving
after Revocation, Driving after Cancellation, No Valid Driver’s License, Disorderly Conduct, Loitering
with Intent to Commit Prostitution, Loitering with Intent to Sell Narcotics, and Lurking with the Intent
to Commit a Crime. These crimes were chosen by community members based on reported disparities in
bookings and average length of stay in jail following booking.
The Study was initiated by the community’s concern around this topic and originates from two
compelling but opposing views. These contrasting views were expressed at a 2001 meeting facilitated
by the Council on Crime and Justice in a North Minneapolis neighborhood. Some community members
expressed the view that low level offense charges were fishing expeditions, giving police the
opportunity to search individuals of color, look for warrants, and find more serious crimes for which to
charge them. In contrast, other members of the community felt that low level offenses occur far too
often and are not taken seriously by the criminal justice system. Those holding this latter view
expressed the belief that these offenses are rarely charged by the court. While offenses technically are
not charged by the “court”, this concern stemmed from the belief that the system (namely, prosecutors
and judges) do not take misdemeanor offenses seriously and believe repeat offending is rarely deterred
because of the system’s laxness, and therefore their neighborhoods become less and less safe.
This discussion led to a study that consisted of reviewing secondary data from the Minneapolis
Police Department, Hennepin County District Court, and the Hennepin County Adult Detention Center.

Council on Crime and Justice November, 2004
6
Funded by John Morgan and the Department of Justice, the following report is a discussion of the
findings of the study.
Past Literature
Differential treatment between Whites and African Americans was found in a New York study of
misdemeanor offenses (1996). This study, conducted by the American Civil Liberties Union, reports
that the Pataki administration found that “African American and Latino people sentenced for minor
felonies or misdemeanors in New York were treated more harshly than Whites in similar
circumstances”. The study also reports that “from 1990-1992, one out of every three minority
defendants given time in local jails – where sentences of less than a year are served – would have
received a more lenient sentences if they had been White”2.
In contrast, a statistical analysis conducted by the Monroe County NAACP branch on sentence
length for misdemeanor crimes found that African Americans had shorter sentences than Whites when it
came to misdemeanors; “African Americans got an average of 9 days and Whites an average of 23
days.” They also found a “significantly greater number of zero day sentences for African Americans
than Whites who were charged with misdemeanors”3. Lastly, they found that African Americans and
Whites were charged at about the same rate when it came to misdemeanors.
Since most of the literature on low level offenses concerns minor drug offenses, more research
needs to be conducted on other low level crimes. Research needs to examine the ways in which low
level offenders are stopped, charged (prosecuted in court or not), the outcome of the prosecution, the
sentence, and the prior criminal history of those involved.
Previous Research in Minnesota
2 Whitanek 1996, p.1 3 Monroe County 2000, p. 3

Council on Crime and Justice November, 2004
7
One of the few studies in Minnesota examining possible racial disparities in low level
offenses was the Statewide Racial Profiling Study4. This study looked at racial differences in stops,
searches, and the outcome of both throughout sixty-five law enforcement jurisdictions in Minnesota. A
discussion of the results for all jurisdictions combined and then for Minneapolis alone is summarized
below.
For all jurisdictions combined, law enforcement officers stopped Black, Latino, and American
Indian drivers at greater rates than White drivers5. Further, they searched Blacks, Latinos, and
American Indians at greater rates than White drivers, and found contraband as a result of searches of
Blacks, Latinos, and American Indians at lower rates than in searches of White drivers. Conversely, law
enforcement officers stopped and searched White drivers at lower rates than drivers of color and found
contraband in searches of White drivers at a greater rate than in searches of drivers of color. These
patterns existed not only for all jurisdictions combined, but in nearly every individual jurisdiction that
participated.
These disparities are particularly large for Blacks and Latinos. If officers in the participating
jurisdictions had stopped drivers of all racial/ethnic groups at the same rate, approximately 18,800 fewer
Blacks, 5,800 fewer Latinos and approximately 22,500 more Whites would have been stopped in the
sixty-five jurisdictions in 2002. If officers in the participating jurisdictions had subjected stopped
drivers of all racial/ethnic groups to discretionary searches at the same rate, 2,114 fewer Blacks, 428
fewer Latinos and 2,645 more Whites would have been searched.
4 2003. Council on Crime and Justice and the Institute on Race and Poverty, authors. 5 Because arresting officers self-categorize a person’s race, most of the research mentioned throughout the rest of the report denotes a “Black” category rather than “African American” or “Somalian”, since the officer cannot always know how a person would categorize himself/herself.

Council on Crime and Justice November, 2004
8
In Minneapolis, Blacks were stopped 152% more often than expected and once stopped,
subjected to discretionary searches 52% more often than expected. Notably only 11% of searches of
Blacks produced contraband compared to 13% of searches of Whites. If Minneapolis officers had
stopped Blacks at the same rate as other drivers approximately 12,804 fewer Blacks would have been
stopped in Minneapolis in 2002. If Blacks stopped in Minneapolis had been subjected to discretionary
searches at the same rate as all stopped drivers, 1,053 fewer Blacks would have been searched.
Minneapolis officers stopped Latinos 63% more often than expected and once stopped, subjected
Latinos to discretionary searches 15% more often than expected. Only 5% of searches of Latinos
produced contraband. If Minneapolis officers had stopped Latinos at the same rate as all drivers
approximately 2,200 fewer Latinos would have been stopped in Minneapolis in 2002. If Latinos
stopped in Minneapolis had been subjected to discretionary searches at the same rate as other drivers, 82
fewer Latinos would have been searched.
As is more fully discussed in the Statewide Racial Profiling Study, there are limitations to our
estimates of the driving population, used to calculate the number of “expected” stops for each
racial/ethnic group, which should be considered when interpreting these results.
With respect to convictions, a study conducted by, the Council on Crime in Justice for the
African American Men Project found:
the conviction rate for the more serious crimes (homicide, rape, robbery, burglary) is generally comparable between African American and White males. However, the conviction rate for African American males is much lower for some of the less serious crimes such as vandalism, disorderly conduct and drug offenses. While numerous explanations may account for the lower conviction rates, e.g. better legal representation, one possible explanation that deserves further examination is whether police are making
arrests of poor quality for these lesser crimes6.
6 African American Men Task Force Study, 2001.

Council on Crime and Justice November, 2004
9
Another study conducted by Hennepin County District Court, researched adult crime trends
and problems with livability crimes. The Livability Study7 looked at 2001 low level offense crimes.
The study concluded that compared to people who were given citations for these livability offenses,
people who were tab charged8 were more likely to fail to appear in court (20% citation, 33% tab
charged), cost the courts more money, and were more often than not dismissed or continued for
dismissal by the courts (60% of tab charged cases).
Developments since Data Collection
Some policy changes and other developments have occurred since the initiation of the Low Level
Offense Study. While a more complete discussion of these items appears on page 32 it is important to
note the existence of their developments, with respect to driving offenses. While data has not been
gathered and analyzed to measure the impact of these changes on racial disparities, a list of the changes
or events that have occurred since the data collection includes:
Police-Community Mediation Agreement entered. Minneapolis Police Department changed its policy regarding arrests for driving offenses. Community prosecution program initiated by City Attorney’s Office. Hennepin County’s African American Men Project began Right Turn Initiative to assist
individuals obtain valid driver’s license, dismissal of warrants, etc. Cameras have been installed in many squad cars.
LOW LEVEL OFFENSE STUDY SPECIFIC INFORMATION
The Council on Crime and Justice (CCJ) is a private, non-profit organization with nearly fifty
years of proven leadership in the field of criminal justice. CCJ’s mission is to build community
7 Hennepin County, 2003. 8 Tab Charge is defined in the Minnesota Rules of Criminal Procedure as “a brief statement of the offense charged including a reference to the statute, rule, regulation, ordinance, or other provision of law such the defendant is alleged to have violated which the clerk shall enter upon the records. A tab charge is not synonymous with ‘citation’ as defined by Rule 6.01”.

Council on Crime and Justice November, 2004
10
capacity to address the causes and consequences of crime and violence through research, advocacy
and demonstration.
In April 2000, the Council began the Racial Disparity Initiative (RDI), an action-oriented, multi-
year, multi-study examination of racial disparities within Minnesota’s criminal justice system with the
intent of effecting systemic change. RDI’s ultimate goal is to bring about change in policy and practice
to eliminate racial disparities in Minnesota’s criminal justice system.
One of RDI’s recent accomplishments is the completion of the Low Level Offense (LLO) Study,
the subject of this report. The Study examines the arrests and citations for seven low level misdemeanor
offenses in Minneapolis, Minnesota. The purpose of this Study was four-fold.
To determine if there were racial disparities in citations and in arrests. To determine if there were differences between the races of people receiving a citation rather
than being arrested and booked in Hennepin County Adult Detention Center (HCADC). To determine if there were differences between the races in whether or not someone was
charged, and if so, the case outcomes. To examine the criminal histories of those arrested.
This study tracked arrests in Minneapolis from January to December 2001 for seven low level
offense categories. The selected offenses include9:
1. Driving After Revocation (DAR) 2. Driving after Cancellation (DAC) 3. No Valid Drivers License (NODL) 4. Disorderly Conduct (DISC) 5. Loitering with Intent: Prostitution (PROST) 6. Loitering with Intent to Sell Narcotics (LOITER) 7. Lurking with the Intent to Commit a Crime (LURK)
Definitions
The most important term to define immediately is “point of contact”. For the purpose of this study,
point of contact refers to the initial documented encounter between police and citizen by the
9 See Appendix A for full description of each offense categories.

Council on Crime and Justice November, 2004
11
Minneapolis Police Department. Below is a list of commonly used terms for this study and their
corresponding definition:
Citation: commonly referred to as a ticket and appearing in the Minneapolis Police CAPERS data system under “Arrest Disposition” as “Cited”;
Arrest: individual booked at the Hennepin County Adult Detention Center (the “Jail’) and appearing in CAPERS under “Arrest Disposition” as “Booked”;
Charge: the offense assigned by the Police and originating from the CAPERS “Charged Offense” category; one of the seven low level offenses of interest10. Charge also can refer to the status of the case (whether the case is brought forward to court, namely “charged” or “not charged”);
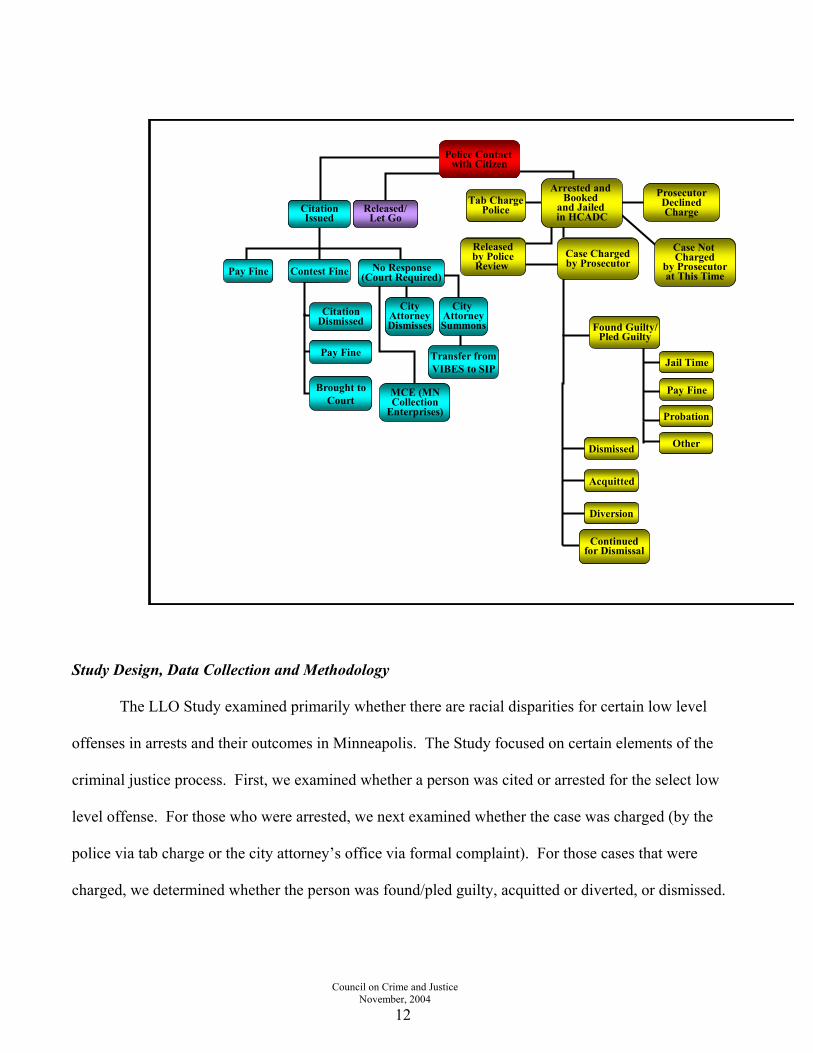
Case Outcome: the disposition of the case (dismissed, acquitted, diverted, continued for dismissal, or plead/found guilty) originating from District Court.
The flow chart below visually outlines the process from police contact to case disposition for both
citation and arrest.
10 Offenses assigned by the police and entered into CAPERS may be different than offenses assigned by the prosecutor and entered into SIP.
Council on Crime and Justice November, 2004
12
Police Contact with Citizen
CitationIssued
Released/Let Go
Contest Fine
CitationDismissed
Acquitted
Dismissed
Diversion
CityAttorneyDismisses
Pay Fine
Arrested and Booked
and Jailed in HCADC
Tab ChargePolice
ProsecutorDeclinedCharge
Releasedby PoliceReview
Case Not Charged
by Prosecutorat This Time
Found Guilty/Pled Guilty
Continuedfor Dismissal
Case Chargedby ProsecutorNo Response
(Court Required)
City AttorneySummons
Transfer fromVIBES to SIP
Brought toCourt
Pay FineJail Time
Pay Fine
Probation
Other
MCE (MNCollection
Enterprises)
Study Design, Data Collection and Methodology
The LLO Study examined primarily whether there are racial disparities for certain low level
offenses in arrests and their outcomes in Minneapolis. The Study focused on certain elements of the
criminal justice process. First, we examined whether a person was cited or arrested for the select low
level offense. For those who were arrested, we next examined whether the case was charged (by the
police via tab charge or the city attorney’s office via formal complaint). For those cases that were
charged, we determined whether the person was found/pled guilty, acquitted or diverted, or dismissed.

Council on Crime and Justice November, 2004
13
Finally, for those people who were found or plead guilty, their corresponding sentence was
identified (probation, workhouse, incarceration, or stayed).
Data was collected from four different electronic sources in order to determine the outcome of a
person’s initial contact with the police. The Minneapolis Police Department’s CAPERS data base was
searched for individuals cited or arrested and booked in Minneapolis during 2001 for one of the seven
selected offense categories11.
Case outcomes originated from Hennepin County’s District Courts Subject in Process (SIP) system.
Hennepin County’s Adult Detention Center (HCADC) provided the third source of electronic data. Data
on all persons booked in HCADC in 2001 were used to verify if cases were charged. Finally, data
from District Court’s Traffic Violation Bureau was used to verify that the citations obtained from
CAPERS included everyone who was cited in 2001. New police procedures regarding citation entry
into CAPERS began in 2001 but may have not been routinely used by all officers. Comparing counts of
citations from CAPERS to citations from the Traffic Violations Bureau allowed us to be confident that
we were analyzing all the relevant citations for the selected offenses and not just a subset.
Data Collection and Challenges Faced in Linking Arrests to Outcomes
We faced three key challenges in linking arrests to outcomes. First, while we were fortunate to
have access to electronic data systems from the Police, Court, and HCADC, these systems do not
currently connect or “talk” to each other for the purpose of tracking offense outcomes. In order to link
low level arrests to court information we had to enter each name, birth date, and offense date from
11 The original community meetings held to define the scope and purpose of the study occurred in August of 2002. We requested 2001 citation and arrest data because we wanted to allow sufficient time for the citation and arrest process to run its full course. As the flow chart indicates (cite proper page number of chart), an arrest and booking can lead to a charged case. A charged case may require multiple court appearances before the outcome of the case is determined (dismissed, guilty, diverted, etc). Time lags can also occur once a citation is issued. Unrelated to these natural time lags, problems with obtaining and merging the separate electronic data bases caused the study to proceed at a much slower pace than was originally planned (see Data Collection and Challenges Faced in Linking Arrests to Outcomes section that follows).
Council on Crime and Justice November, 2004
14
CAPERS into the Court’s computer terminal to find a match12. If a “hit” or match was found, the
associated SIP case number was recorded. All 2,610 names were laboriously entered into the terminal
one by one to check for possible SIP case numbers. The list of SIP case numbers was then given to
District Court for generation of actual case outcomes (dismissed, guilty, etc). Sentence and other
information such as previous arrests and convictions were fairly easy to obtain once we had the SIP case
number. Linking systems on the basis of names was fraught with difficulty since name spellings can
differ, name order can be reversed, and aliases can be used. Mistakes occurred in copying down the SIP
case numbers and had to be looked up again13. Further, during the course of the study we learned that
some arrestees who initially appeared not to have been charged (i.e. did not match on name, birth date,
and offense date) were actually charged before 2001 but their cases were still unresolved. That is, the
arrest date in CAPERS reflected a 2001 arrest, but not necessarily the first arrest associated with an
incident. Resolving these matters were extremely labor-intensive since the only common linkage
between systems was names and dates. We faced similar barriers in linking citations to their outcomes
and decided the effort was too costly and time-consuming to pursue.
Second, the study’s data requests were in competition with other priorities. In mid 2003, District
Court became state funded; programming resources were devoted to the migration of their electronic
systems to the state network rather than processing outside requests. Programming resources within the
Traffic Violations Bureau were simply not available because the Bureau was implementing a completely
12 We attempted to match electronically based on Bureau of Criminal Apprehension control number (an identifier related to the Bureau of Criminal Apprehension which exits across the two systems) but since our offenses were misdemeanors, this variable was often not entered by District Court clerks. 13 This process became so time consuming we separated our Court data requests into two parts. Arrestees in 6 of the 7 offense categories we looked up first; while the Court was generating case outcomes for these 6 offenses we looked up arrestees in the 7th category. These multiple steps were inefficient from a programming point of view.
Council on Crime and Justice November, 2004
15
new software system. District Court researchers were eventually able to access 2001 citations but
the process was time consuming.
Third, even if an arrestee’s case was never charged, we were still interested in the arrestee’s
criminal history. Obtaining this data necessitated another round of individual SIP look-ups. This round
of look-ups involved attempting to determine if the arrestee had another case in Hennepin County at any
point in time. If so, we then recorded the SIP person number and obtained prior arrest and conviction
information from District Court. Going back and forth between systems with multiple requests was
inefficient from a process point of view.
Analysis
Bivariate correlations or cross-tabulations between and across the seven offense categories using
the main variables of interest (i.e., citations, arrests, charges, and case outcomes) were conducted to
determine any significant relationships.14
Overall Sample-Citations and Arrests
Race of the offender was designated by the arresting officer. A sample of arrests and citations by
two race categories was constructed: Black and White. Only Blacks and Whites were analyzed because
the sample sizes based on total number of arrests and citations of the other race/ethnic groups was too
small to accurately predict associations15. Because our sampling methodology mandated over
14 The Pearson correlation coefficient was used to measure the linear association between two scale variables. Chi-Square tests were also conducted compare the target and expected frequencies in each the race, gender, charge, and case outcome category to test whether each of the categories contain the same proportion of values. In order to determine the adequacy of the sample size, statistical criteria, the level of statistical power and data analysis procedures have been considered. In considering Type I error, accepting the null erroneously and Type II error, erroneously rejecting the null; the significance level of .10 and power of .70 will be used. With a sample size of this nature and when comparing 5 independent variables, the conventional .05 significance level were used and it is noted that medium to large changes were detected. 15 The other race and ethnicity categories include the sum of all American Indian, Asian, Hispanic, Other and Unknown, as designated by the police. The sample size of all other race and ethnic groups for citation was 323. For arrests, the total sample of all other race and ethnic groups was 1106 (500 of these were for NODL charges).

Council on Crime and Justice November, 2004
16
representing Whites to obtain a minimal sample size, some of the sample offense categories have an
under representation of Blacks in this sample. Chart 1 shows the population versus sample sizes for
each offense category. The differences between these numbers are not statistically significant for the
arrests, so comparisons across case disposition categories are valid (i.e., the percentage of Whites and
Blacks arrested, prosecuted, convicted, etc. can be compared).
Chart 1
Overall Population vs. Overall Sample
Black Population Citations
% used in study
White Population Citations
% used in study
Black Population
Arrests% used in
study
White Population
Arrests% used in
study
Black Sample
Citations
White Sample
Citations
Black Sample Arrests
White Sample Arrests
DAR 1837 19.98% 598 20.07% 464 65.73% 149 67.79% 367 120 305 101DAC 516 75.97% 142 71.13% 259 81.85% 206 88.35% 392 101 212 182NO DL 1596 21.62% 370 21.62% 437 81.69% 67 88.06% 345 80 357 59DISC 745 30.07% 650 30.00% 1247 17.80% 821 13.15% 224 195 222 108PROST 50 68.00% 30 63.33% 17 94.12% 18 88.89% 34 19 16 16LOIT 1317 39.94% 354 39.83% 751 20.51% 101 22.77% 526 141 154 23LURK 116 100.00% 30 100.00% 107 89.72% 33 96.97% 116 30 96 32
Charts 2 through 3 show frequencies and percentages for cited and arrested individuals by race
and gender. These charts highlight that our sample, which is true of the total arrested and cited
population, were mostly Black and mostly male. In respect to race, 73.6% of our sample who were
either cited or arrested for one of our selected offenses was Black; conversely, 26.4% of the sample was
White.
While this study does not examine gender differences, Chart 3 also shows the break down of the
sample by gender, the majority of those who are either cited or arrested for the selected categories were
male. This finding is consistent with arrest records and other reports on criminal activity. More than 9
out of every 10 citations or arrests involved male individuals.

Council on Crime and Justice November, 2004
17
73.6%
26.4%
Black White
Black (n=3367)White (n=1208)
Chart 2: Sample by Race for Citations and Arrests
(n=4575) people
There is a significant difference between Black and White. (α<.001)
90.5%
9.5%
Male Female
Male (n=4140)
Female (n=435)
Chart 3: Sample by Gender for Citations and Arrests
(n=4575) people
There is a significant difference between Male and Female. (α<.001)
One question the Study addressed is whether there are racial disparities in people who receive
citations and arrests. From the Statewide Racial Profiling Study, we had reason to believe that we might
also find racial disparities in low offense arrests. We also suspected there might be racial disparities
between who is cited versus arrested16.
16 Driving and Non-Driving Offenses: Policy changes since 2002 have changed the way some driving offenses are handled, which is mentioned later in the report. Therefore, analyses were conducted of the seven offense categories collapsed into two

Council on Crime and Justice November, 2004
18
The following findings are discussed in the order of the criminal justice process, namely
from the point of police contact, to whether or not the person is charged, to the outcome of the case.
***********************************************************************************
Citations
When an officer responds to a 911 call or initiates a traffic stop, they often have several options,
including releasing the person without any formal action. For the purpose of this Study, we looked at
two options: people who were cited (i.e., ticketed) and people who were arrested (i.e. taken to
HCADC). We did not have data on people who were stopped but not cited or arrested.
Charts 4 through 5 show frequencies and percents for individuals cited by race and offense
category. Of the sample who was cited, 74.5% of them were Black, conversely, 25.5% were White.
Among all selected offense categories (Chart 5), the majority of citations were given to Blacks. For
DAR, DAC, NODL, LOIT and LURK the differences were significantly significant. For instance,
18.8% of the NODL citations were given to Whites and 81.2% of citations in this category were given to
Blacks.
groups: Driving and Non-Driving offenses. The purpose of collapsing the offense categories into two groups is to determine whether or not the type of offense had an effect on significant findings. When tests were performed on these data, there was not a significant difference between groups. Simply stated, driving offenses and non-driving offenses were not different from one another.

Council on Crime and Justice November, 2004
19
74.5%
25.5%
Black White
Black (n=2004)White (n=686)
Chart 4: Citation by Race
(n=2690) people
There is a significant difference between Black and White. (α<.001)
20.5%21.1%
35.8%46.5%
18.8%24.6% 20.5%
79.5%79.9%
64.2%53.5%
81.2%75.4%
80.5%
0%
20%
40%
60%
80%
100%
DAR* DAC* NO DL* DISC PROST LOIT* LURK*
White Black
(n=120)(n=367)
Chart 5: Citation by Offense Category
(n=101)(n=392)
(n=80)(n=345)
(n=195)(n=224)
(n=19)(n=34)
(n=141)(n=526)
(n=30)(n=116)
*Significant Differences. (α<.001)
Clearly, Blacks are cited for these offenses significantly more often than Whites. To put this into
further perspective, while almost 75% of these citations were given to Blacks, Black makes up only
15.8% of the population of the city of Minneapolis in 2000. In contrast, 69.8% of Minneapolis’
population is White.17
***********************************************************************************

Council on Crime and Justice November, 2004
20
Arrests
As mentioned above, this Study examines two specific options (citing or arresting) that the
police may take once contact is made with an individual due to a traffic stop or a 911 call. The
remainder of our analysis addresses what happens to those arrested. We did not examine the outcome
of citations such as whether a person paid or contested their fine. Some of this was due to limitations of
the data. More importantly, our main focus was to address the concerns voiced by the community
around arrests and their subsequent outcomes. Some general demographics of arrestees were:
The median age for people who were arrested was 28 years old. Nine out of ten arrests were of males.
Charts 6 through 7 show frequencies and percents for individuals arrested by race and offense category.
Once again, the vast majority of people in our sample who were arrested were Black (72.3%). In
respect to the selected offense categories, with the exception of prostitution (where there was an equal
distribution of Black and White arrests), more Blacks than Whites were arrested for each of the other
categories (arrests for DAR, NODL, DISC, LOIT, LURK were all determined to be significantly
different).

Council on Crime and Justice November, 2004
21
14.2%
32.7%
50.0%
13.0%25.0%
24.9%
46.2%
85.8%
67.3%
50.0%
87.0%75.0%
75.1%
53.8%
0%
20%
40%
60%
80%
100%
DAR* DAC NO DL* DISC* PROST LOIT* LURK*
White Black
(n=101)(n=305)
Chart 7: Arrest by Offense Category
(n=182)(n=212)
(n=59)(n=357)
(n=108)(n=222)
(n=16)(n=16)
(n=23)(n=154)
(n=32)(n=96)
*Significant Differences. (α<.001)
Again, Blacks are disproportionately arrested compared to Whites. Chart 6 shows 72% of arrests
were of Black people compared to 28% of Whites. Chart 7 shows that in four of seven offense
72.3%
27.7%
Black White
Black (n=1362)White (n=521)
Chart 6: Arrest by Race
( n =1883) People There is a significant difference between Black and White. (a < .001)

Council on Crime and Justice November, 2004
22
categories, Black arrest percents are 75% or higher. These disparities once again become more
alarming when one considers the aforementioned population percentages for the city of Minneapolis.18
***********************************************************************************
Citations versus Arrests
The above analysis demonstrates that when the total sample is considered, as well as reviewing
separately the citation sample and the arrest sample, Blacks represent nearly three quarters of the group.
But, one of the research questions we wanted to examine was: Is there is a difference between citing or
arresting given a person’s race? We wondered if Whites would be more likely to receive a citation and
Blacks were more likely to be arrested and booked in the jail. Charts 8 through 10 show frequencies
and percents for individuals cited versus arrested by race and offense category. Notably, there were no
significant differences found between races as to the outcome of the police stop or response to a 911
call.
25.5% 27.7%
74.5% 72.3%
0%
20%
40%
60%
80%
100%
White Black
CitationsArrests
Citation (n=686)Arrests (n=521)
Chart 8: Citation vs. Arrest by Race
Citation (n=2004)Arrests (n=1362)
18 For the overall population, the arrest rate for Whites is 1 in 60 compared to a 1 in 4 arrest rate for Blacks. Notably, most of these arrests (Whites 87%, Blacks 89%) were men. Also note that these rates do not account for multiple arrests of one individual. They are based on 2000 census data compared to the 2001 arrest data.

Council on Crime and Justice November, 2004
23
48.4%
86.0%
54.3%64.4%57.5%54.3%
35.7%
51.6%
14.0%
45.7%35.6%42.5%45.7%
64.3%
0%
20%40%
60%80%
100%
DAR DAC NO DL DISC PROST LOIT LURK
Citation Arrest
(n=120)(n=101)
Chart 9: Citation vs. Arrest by Offense
for Whites
(n=101)(n=182)
(n=80)(n=59)
(n=195)(n=108)
(n=19)(n=16)
(n=141)(n=23)
(n=30)(n=32)
54.7%
77.3%
68.0%
50.2%49.9%54.6%
64.9%
45.3%22.7%
32.0%
49.8%
50.1%45.4% 35.1%
0%
20%
40%
60%
80%
100%
DAR DAC NO DL DISC PROST LOIT LURK
Citation Arrest
(n=367)(n=305)
Chart 10: Citation vs. Arrest by Offense
for Blacks
(n=392)(n=212)
(n=345)(n=357)
(n=224)(n=222)
(n=34)(n=16)
(n=526)(n=154)
(n=116)(n=96)
A careful examination of charts 8, 9, and 10 reveals no significant differences between the
percent of Whites who were cited versus arrested compared to the percent of Blacks who were cited
versus arrested. Again, although Blacks are arrested and cited at a rate disproportionate to their
percentage within the city’s population, once the decision to cite or arrest is made, there are no
significant differences by race between which outcomes is selected.

Council on Crime and Justice November, 2004
24
********************************************************************************
***
Charged versus Not Charged after an Arrest
As we progress past the first police contact, we wanted to determine what becomes of an arrest.
Since some community members held the view that arrests were not followed by any consequences, we
wanted to determine the extent to which this was true. Each of the selected offenses was examined to
determine the outcome for each arrest. For each offense category the number of cases charged was
determined. The city attorney may decide for a variety of reasons not to send the case on to court.
Chart 11 shows the charging decision by race. This chart shows that 10.9% of White arrests are never
charged versus 7.3% of Black arrests. This difference is statistically significant, meaning that charges
against Whites are brought less often than charges against Blacks.
Chart 11: Charged or Not Charged
By Race
89.1%
10.9%
92.7%
7.3%0%
20%
40%
60%
80%
100%
White Black
ChargedNot Charged
(n=464) (n=56) (n=1266) (n=97)
There is a significant difference between race and whether or not someone is charged. (α<.007)
Because Blacks have a disproportionately high arrest rate, they are disproportionately represented
among the population subject (or eligible) to becoming charged, prosecuted and convicted. Even if
Blacks are charged at the same rate as Whites, they will still be disproportionately prosecuted. When

Council on Crime and Justice November, 2004
25
disparities exist in both arrest and charging rates, as they do for blacks, then the disparities are
compounded.
***********************************************************************************
Case Outcome
Continuing through the process, we wanted to determine the outcome of the charged cases. For
the purposes of analysis, we collapsed the disposition categories to assure there were enough people in
each group. The Study’s possible case outcomes included:
Found or Pled Guilty – The Defendant either pled guilty to the charges or was found guilty by a judge or jury after a trial was completed.
Dismissed or Acquitted – The Defendant either had the charge dismissed or was found not guilty by a judge or jury after a trial was completed19.
Continued for Dismissal or Given Diversion – In the situation of continued for dismissal or continued without a pleas, the Defendant’s case is put on hold for a year and the judge dismisses the criminal case at the conclusions of the year if the defendant has not committed any additional crimes and has complied with any additional conditions imposed. If the Defendant is given Diversion, they may do some type of community service or other alternative sanction with the expectation that if they do not commit any future crimes or disobey conditions, the charges will eventually be lessened or taken off their record completely.
Warrant Pending – Defendant’s case still unresolved due to failure to appear in Court; warrant outstanding for arrest.20
Charts 12 through 16 display the possible case outcomes by race. Chart 12 shows the case
outcome across all seven offense categories; Chart 12 illustrates that Whites plead or are found guilty
more often than Blacks (29.2% for Whites versus 20.9% for Blacks). Conversely, Blacks are acquitted
19 In order to determine whether or not someone pled guilty to another charge, we examined whether or not there were other pleas that same day. Reviewing “concurrent” convictions were important to see if there were significant differences between races on whether or not a person who was dismissed on the offense of interest may in fact have pled guilty to another charge. This inquiry did not produce significant findings, meaning that there was no difference between races on whether or not the pled guilty to another charge which may have resulted in a “dismissed” outcome. Each group had about 12% of the sample fit this condition. 20 The case was unresolved as of August 2003 when we received the Court data. The case may have been resolved since that time.

Council on Crime and Justice November, 2004
26
or dismissed more often (52.9% for Blacks versus 42.3% for Whites). These differences are
statistically significant.
Chart 12: Disposition of Case
by Race
29.2%20.9%
13.6% 13.0%
42.3%
52.9%
14.9%13.2%
0%
20%
40%
60%
80%
100%
Pled/FoundGuilty*
Con't. Dism orDiversion
Acquitted orDismissed
Warrant Pending
White Black
(n=135)(n=263)
There is a significant difference between race for these categories. (α<.001)
(n=63)(n=163)
(n=196)(n=664)
(n=69)(n=166)
Chart 13 shows that Whites pled or were found guilty more often than Blacks in three offense
categories: Driving after Cancellation (DAC), Disorderly Conduct (DISC) and Loitering (LOIT).
These differences were not statistically significant, though.
Chart 13: Pled/Found Guilty
0.0% 3.2%8.7%
39.8%
14.8%19.4%
46.3%
4.5%8.3%0.0%
31.5%16.5%
21.3%
35.6%
0%
20%
40%
60%
80%
100%
DAR DAC NO DL DISC PROST LOIT LURK
White Black
(n=19)(n=59)
(n=62)(n=64)
(n=8)(n=54)
(n=43)(n=70)
(n=0)(n=0)
(n=2)(n=12)
(n=1)(n=4)

Council on Crime and Justice November, 2004
27
Chart 14 shows that Whites received continued for dismissal or diversion more often relative
to Blacks in five of the seven offense categories (DAR, NODL, DISC, LOIT, and LURK). These
differences were not statistically significant.
Chart 14: Continued for Dismissal or Diversion
0.0%
16.1%13.0%
18.5%24.1%
14.3%
6.0% 5.6%7.6%6.7%13.1%22.6%
10.8%7.2%
0%
20%
40%
60%
80%
100%
DAR DAC NO DL DISC PROST LOIT LURK
White Black
(n=14)(n=30)
(n=8)(n=13)
(n=13)(n=74)
(n=20)(n=29)
(n=0)(n=1)
(n=3)(n=11)
(n=5)(n=5)
Chart 15 shows small differences by race in terms of case dismissals and acquittals. Blacks have
higher dismissal/acquittal rates in five of the seven offense categories (DAR, DAC, DISC, LOIT, and
LURK). Once again, these differences were not statistically significant.
Chart 15: Dismissed/Acquitted
93.3%
71.0%73.9%
30.6%
48.1%48.0%
27.6%
78.7%82.8%86.7%
45.5%43.9%53.4%
37.8%
0%
20%
40%
60%
80%
100%
DAR DAC NO DL DISC PROST LOIT LURK
White Black
(n=47)(n=148)
(n=37)(n=68)
(n=26)(n=144)
(n=33)(n=101)
(n=14)(n=13)
(n=17) (n=120)
(n=22) (n=70)

Council on Crime and Justice November, 2004
28
Chart 16 shows the number and percent of cases unresolved as of August 2003. Our original
sample was drawn from 2001 arrests; thus, some 18 months later (for December 2001 arrests) some
cases still had no outcomes, largely due to arrestees failing to appear in court. No statistically
significant differences were found.
Chart 16: Outstanding Warrants
6.7% 9.7%4.3%11.1%13.0%
18.4% 20.1%11.2%
1.4%6.7%9.9%
17.1%
14.4%19.4%
0%
20%
40%
60%
80%
100%
DAR DAC NO DL DISC PROST LOIT LURK
White Black
(n=18)(n=40)
(n=27)(n=35)
(n=7)(n=56)
(n=12)(n=22)
(n=1)(n=1)
(n=1)(n=2)
(n=3)(n=10)
***********************************************************************************
Sentencing
Lastly, Chart 17 shows the case sentence by race. As the chart shows, there are very few people
who are sentenced to serve time in jail or the workhouse. We would not expect that these misdemeanor
crimes would have a large number of people that were given extensive jail time. Misdemeanor driving
offenses rarely lead to extensive jail time, for example. In fact, most misdemeanor offenses are
“punished” by other means besides incarceration, such as community service and fines. There were no
significant differences found between Whites and Blacks and the sentence imposed upon conviction.

Council on Crime and Justice November, 2004
29
0.5%0.2%4.2%
77.0%
18.5%2.9%
85.2%
11.4%0%
20%
40%
60%
80%
100%
Probation Workhouse Stayed/Workhouse Incarcerated/Stayed
White Black
(n=349)(n=1064)
Chart 17: Sentence by Race
(n=84)(n=143)
(n=19)(n=36)
(n= .2%)(n= .5%)
****************************************************************************
Criminal Histories
The criminal histories of those arrested for low level offenses are of great interest. Some
community members may believe that many of the people in the Study who were arrested and charged
had extensive criminal histories. Others may speculate that the same people were arrested over and
over, but rarely convicted. Below are some highlighted findings about the criminal histories of those in
our sample.
Nearly 1 out of 5 people (19.5%) had never been arrested before in Hennepin County.21 Over 2 out of 5 people (41.4%) had never had a conviction in Hennepin County. Over 7 out of 10 (70.3%) people had either no or only misdemeanor only convictions in
Hennepin County. In sum, the majority of the sample of those arrested did not have a prior felony conviction. For the most
part, those in the sample do not have an extensive criminal history with over 40% having no convictions
at any level.
21 Criminal Histories were collected only from Hennepin County. If someone had arrests in any other jurisdiction, this would not be reported in our findings.

Council on Crime and Justice November, 2004
30
To better illustrate the criminal histories of those in our sample, the following graphs display the
number of people who have been arrested a certain number of times and either have never been
convicted (Chart 18), convicted only once (Chart 19), or convicted only twice (Chart 20).
Chart 18: Prior Arrests with No Convictions

Council on Crime and Justice November, 2004
31
Chart 19 Prior Arrests and Only One Conviction
Chart 20 Prior Arrests and Two Convictions
Council on Crime and Justice November, 2004
32
While the outliers in the preceding charts are disturbing, it is also troubling that there are
many more Black individuals who have been arrested multiple times without a conviction than White
individuals. Being booked and held in the county jail is an expense, not only for the arrestee, but for the
municipality. If we were to assume that many of the people with multiple arrests and no convictions
were guilty, then the police, prosecutors, and court need to work together to get convictions. If we were
to assume that most of the people that were arrested multiple times without a conviction were innocent,
then police arresting practices need to be changed. Most likely, it is a combination of both of these
assumptions and many other factors that this Study cannot fully address.
DISCUSSION
Developments since Data Collection
As mentioned in the beginning of this report, some changes have occurred during the course of
this study which impact how low level offenses are currently addressed by the community, police, city
attorneys, and the county. These changes are summarized below and include:
Federal Mediation Agreement entered. Minneapolis Police Department changed policy regarding arrests for driving offenses Community prosecution program initiated by City Attorney’s Office. African American Men Study began Right Turn Initiative to assist individuals obtain valid
driver’s license, dismissal of warrants, etc. Federal Mediation Agreement
The Federal Mediation Agreement evolved out of concerns raised by communities of color that
the Minneapolis Police Department was unfairly “targeting” or “focusing” on their communities. Many
in those communities questioned law enforcement actions that focused on livability or low level offense
crimes as perhaps being motivated by biased policing. During Federal Mediation, members of the
Minneapolis Police Department’s Administration were able to engage in healthy and constructive

Council on Crime and Justice November, 2004
33
dialogue with various diverse community representatives. The Federal Mediation Agreement
provides a forum for on-going communication between the Minneapolis Police Department and the
community regarding matters of public safety and the public’s faith and confidence in the Minneapolis
Police Department.
Minneapolis Police Department Changed Policy Regarding Arrests for Driving Offenses
A change in the Minnesota Rule of Criminal Procedure (6.01) in 1994 mandated that officers cite
for misdemeanors if the defendant can be effectively identified. There are a few allowed exceptions,
such as continued criminal conduct, potential for harm to the defendant or others, or a documented
likelihood that the defendant will not respond to a citation. As a result of this statute change, it is now
the policy of the Minneapolis Police Department to cite DAR and DAS, as well as other driving
violations, if the defendant can be identified.
However, prior to 2002, it was difficult to establish the identity of anyone who did not have a
good picture ID with them. Since 2002, the new squad Mobile Date Computer (MDC) has been phased
in, department wide. These devices allow officers to check the State’s Department of Vehicle Services
website and look up driver’s license photos from the squad. Many suspects, who have no identification,
can be identified on the street. A side benefit has been that officers who suspect a person of giving a
false name can now often verify their identity at the scene.
The Community Attorney Program
The Community Attorney Program was first initiated in the 4th Precinct of the Minneapolis Police
Department in June of 2002. Since then it has expanded to the 1st, 2nd and 3rd Precincts and will also
include the 5th Precinct by the third quarter of 2005. An Assistant City Attorney is assigned to each
precinct to better address the concerns of those who live, work, and visit the communities served by

Council on Crime and Justice November, 2004
34
those precincts, especially as this relates to livability crimes being committed in these
neighborhoods. Livability crimes include prostitution, boom cars, loitering, urination in public,
consuming alcohol in public, substandard buildings, rubbish-strewn properties, graffiti, drugs and
gangs. The City Attorney’s Office is aware that these crimes disrupt a neighborhood’s peace,
demoralizes residents, hurts businesses, and may lead to the community’s decay. The community
attorney’s role includes:
Assisting police in reviewing gross misdemeanor, misdemeanor, and petty misdemeanor cases, to ensure that the appropriate charges are filed;
Working directly with the community, including attending community meetings; Gathering community impact statements to be made part of a prosecution file, to ensure that
prosecutors and other members of the criminal justice system are aware of the community’s standards and how these crimes impact their community;
Facilitating the flow of information among the Police Department, the community, the Minneapolis City Attorney’s Office, and ultimately, the courts; and
Providing training to the Police Department and to community members on topics of interest to the police and the community22.
Right Turn Program
Right Turn is a program initiated by the African American Men Study. This program is a
community-based model of mutual accountability designed to empower African American men, ages 18
to 35, through comprehensive preventive, interventive, and restorative services. Right Turn is the entry
point for young men to strategic partnerships that provide legal, health, job training, education and
housing support, along with support and guidance from the community.
HIGHLIGHTS OF FINDINGS
For the select low level offenses in MPLS, the rates for receiving a citation or being arrested in 2001 were:
o Whites: 1 in 60 o Blacks: 1 in 4
Blacks were 15 times more likely than Whites to be either arrested or cited.
22 Information provided by the City Attorney’s Office of Minneapolis, MN.

Council on Crime and Justice November, 2004
35
Significant racial disparity occurs at point of contact between police and citizen. Disparity is not as evident as cases move forward from point of contact between police and
citizen, but is still found at some points of time in the process and is also extremely skewed given the race of those who enter the process.
Conviction rates for arrests are very small. 21.9% of all people arrested were convicted (Black 19.3%, White 25.9%). Less than a third of the people charged have felony and/or gross misdemeanor convictions. Over 70% of the people charged have no prior convictions or only misdemeanor convictions. Multiple arrests of people who have no or few convictions occur much more frequently for
Blacks than Whites.
RECOMMENDATIONS
The offenses observed in this Project fall into two categories: livability offenses and driving offenses. The recommendations that follow are organized under General Recommendations (applicable to both offense categories) and Specific Recommendations (applicable to a specific offense category). General Recommendations
1. Carefully consider the arrest data. Community and system stakeholders need to be careful not to jump to conclusions about criminal activity based on the low conviction rates for the observed offenses. On one hand, not everyone whose case is dismissed is innocent. At times, it is not a person’s innocence that leads to a dismissal or finding of not-guilty. Rather, it is the lack of time and resources to develop evidence, locate witnesses, etc. On the other hand, given that conviction rates for the observed offenses are so low, it is safe to say that some of the arrested individuals are either innocent or did not pose a sufficient threat to public safety to justify the arrest. This Project did not make any determination regarding the actual guilt or innocence of those arrested for the observed offenses.
2. Disseminate the findings. The findings in this report should be presented to a multitude of
system and community stakeholders. The presentations should be undertaken jointly by the Minneapolis Police Department, preferably by someone at the Deputy Chief level, and the Council on Crime and Justice. The purpose of such presentations should be to educate the stakeholders and solicit additional recommendations for action steps.
3. Develop the capacity for real-time analysis of arrest-to-disposition data. Electronic systems
used by criminal justice agencies need to communicate with each other. Understanding crime trends, recidivism, chronic offending, and public safety needs are all dependent on databases and systems that can communicate with each other to better inform policy and the public. Currently, they cannot. The City of Minneapolis/Hennepin County data bases should be integrated to allow real-time analysis of the arrest-to-disposition data. Such analyses should occur at regularly scheduled intervals.

Council on Crime and Justice November, 2004
36
4. Analyze the efficacy of the Tab Charge. A large percentage of the offenders observed in this Project were brought into court via a Tab Charge (60%). This is done at the initiation of the arresting officer, without review by the Minneapolis City Attorney’s office. It is unclear, however, the extent to which the absence of any prosecutorial review contributes to the high dismissal rates. Accordingly, the Minneapolis City Attorney should convene a Work Group to analyze the use of tab charges and determine whether their continued use is in the best interests of justice.
5. Police should be more judicious about making arrests for low level offenses. Public trust and
confidence in the criminal justice system is of paramount importance. Without it, crimes go unreported, witnesses do not cooperate, the police (and the criminal justice system generally) are seen as a part of the problem, not as a protector, and societal bonds are eroded. The low conviction rates observed in this study can, over time, contribute to an erosion of public trust and confidence. High arrest rates, when coupled with low conviction rates, do not serve the community well, and do a disservice to the offender. (For example, arrest records are often part of the background check to determine whether a person obtains employment or housing.) Thus, the police should use the citation process for low level offenses, such as those observed in this study, unless an arrest is justifiable because the offender presents an articulable threat to public safety.
Specific Recommendations: Livability Crimes
1. Find the lens that both sides can look through. Enhancing public safety and eradicating racial disparities in the criminal justice system should not be seen as opposing views. There needs to be a new paradigm. Its foundation must be a common understanding and agreement on the goal(s) sought to be achieved by addressing livability offenses.
2. Appoint a Mayoral Work Group. The Mayor, in conjunction with the Chief of Police, should
appoint a Work Group comprised of system and community stakeholders to develop a common understanding around a set of goals to be achieved in addressing livability offenses. Once this is accomplished, the Mayoral Work Group should identify a multi-faced set of strategies consistent with the Goals.
3. Implement the Goal/Strategies utilizing existing resources whenever possible. The Chief of
Police, in conjunction with community leaders, should promote the adoption of the Goals/Strategies for addressing livability offenses. Acceptance must occur among community and neighborhood organizations and by criminal justice system stakeholders. Whenever possible, existing resources should be utilized, such as the Right Turn Project and the Urban League Curfew/Truancy Center.
Specific Recommendations: Driving Offenses
1. Examine the impact of the New Arrest Policy. The Minneapolis Police Department has revised its arrest policy/procedures since the data was collected for this Project. The Police Department should examine the impact of these revisions. Questions that should be explored include: Has the number of arrests decreased? If a decrease has occurred, is it proportional for drivers of all

Council on Crime and Justice November, 2004
37
population groups? Or are drivers of color arrested more often? What is the new conviction rate for drivers who are arrested?
2. Reduce the racial disparity in traffic stops. The racial disproportionality in arrests is largely a
function of the disproportionality in traffic stops by race of the driver. To address this issue, the Minneapolis Police Department should pay close attention to the findings of the Traffic Stop Audit currently underway within the Department. Without addressing the wide racial disparity at the initial point of police/citizen contact, improvements at subsequent stages of the criminal justice system, including changes to the arrest policy, will only have limited impact.

Council on Crime and Justice November, 2004
38
Appendix A: Definitions of Selected Offenses 1. Driving After Revocation (DAR) Minnesota Statutes Section 171.24 Subd. 2. Driving after
revocation; misdemeanor. A person is guilty of a misdemeanor if: 1) the person’s driver’s license or
driving privilege has been revoked; 2) the person has been given notice of or reasonably should know of
the revocation; 3) the person disobeys the order by operating in this state any motor vehicle, the
operation of which requires a driver’s license, while the person’s license or privilege is revoked.
2. Driving after Cancellation (DAC) Minnesota Statutes Section: 171.24 Subd. 3. Driving after
cancellation; misdemeanor. A person is guilty of a misdemeanor if: 1) the person’s driver’s license or
driving privilege has been canceled; 2) the person has been given notice of or reasonably should know
of the cancellation; and 3) the person disobeys the order by operating in this state any motor vehicle, the
operation of which requires a driver’s license, while the person’s license or privilege is canceled.
3. No Valid Drivers License (NODL) Minnesota Statutes Section 171.24 Violations; driving with
valid license. Subd. 1. Driving after suspension; misdemeanor. Except as otherwise provided in
subdivision 5, a person is guilty of a misdemeanor if: 1) the person’s driver’s license or driving privilege
has been suspended; 2) the person has been given notice of or reasonably should know of the
suspension; and 3) the person disobeys the order by operating in this state any motor vehicle, the
operation of which requires a driver’s license, while the person’s license or privilege is suspended.
4. Disorderly Conduct (DISC) Minneapolis Ordinance 385.90. Disorderly Conduct, no person, in any
public or private place, shall engage in, or prepare, attempt, offer, or threaten to engage in or assist, or
conspire with another to engage in, or congregate because of, any riot, fight, brawl, tumultuous conduct,
act of violence, or any other conduct which disturbs the peace and quiet of another save for participating

Council on Crime and Justice November, 2004
39
in recognized athletic contest (Code 1960, As Amed., S 870.060). State law references: Disorderly
Conduct, M.S. 609.72
5. Loitering with Intent: Prostitution (PROST) Minneapolis Ordinance 385.50. (a) No person shall
loiter on the streets or in a public place or in a place open to the public with intent to solicit for the
purposes of prostitution, illegal narcotic sale, distribution, purchase or possession, or any other act
prohibited by law.
6. Loitering with Intent to Sell Narcotics (LOITER) Minneapolis Ordinance 385.50. (a) No person
shall loiter on the streets or in a public place or in a place open to the public with intent to solicit for the
purposes of prostitution, illegal narcotic sale, distribution, purchase or possession, or any other act
prohibited by law.
7. Lurking with the Intent to Commit a Crime (LURK) Minneapolis Ordinance 385.80. Lurking, no
person, in any public or private place, shall lurk, lie in wait or be concealed with intent to do any
mischief or to commit any crime or unlawful act. (Code 1960, As Amend. 870.050).