Embed Size (px)
Citation preview
Low Latency Performance Tuning
for Red Hat Enterprise Linux 7
Jeremy Eder, Principal Software Engineer
Version 1.0
January 2015

100 East Davie StreetRaleigh NC 27601 USAPhone: +1 919 754 3700Phone: 888 733 4281Fax: +1 919 754 3701PO Box 13588Research Triangle Park NC 27709 USA
Linux is a registered trademark of Linus Torvalds. Red Hat, Red Hat Enterprise Linux and the Red Hat "Shadowman" logo are registered trademarks of Red Hat, Inc. in the United States and other countries.
UNIX is a registered trademark of The Open Group.
Intel, the Intel logo and Xeon are registered trademarks of Intel Corporation or its subsidiaries in the United States and other countries.
All other trademarks referenced herein are the property of their respective owners.
© 2014 by Red Hat, Inc. This material may be distributed only subject to the terms and conditions set forth in the Open Publication License, V1.0 or later (the latest version is presently available at http://www.opencontent.org/openpub/).
The information contained herein is subject to change without notice. Red Hat, Inc. shall not be liable for technical or editorial errors or omissions contained herein.
Distribution of modified versions of this document is prohibited without the explicit permission of Red Hat Inc.
Distribution of this work or derivative of this work in any standard (paper) book form for commercial purposes is prohibited unless prior permission is obtained from Red Hat Inc.
The GPG fingerprint of the [email protected] key is:CA 20 86 86 2B D6 9D FC 65 F6 EC C4 21 91 80 CD DB 42 A6 0E
www.redhat.com ii [email protected]
Table of Contents1 Executive Summary ......................................................................................... 1
2 Checklist for Low Latency Standard Operating Environment ........................... 1
3 BIOS Configuration .......................................................................................... 1
4 NUMA Topology ................................................................................................ 3
4.1 NUMA Discovery ............................................................................................................... 3
4.2 Automatic NUMA Balancing and Task Affinity ................................................................... 4
4.3 Updated numastat ............................................................................................................. 5
5 Provisioning the Operating System .................................................................. 6
5.1 Network Time Protocol (NTP) ............................................................................................ 7
5.2 Precision Time Protocol (PTP) .......................................................................................... 7
5.3 What about cpuspeed? ..................................................................................................... 7
6 Tuned Profiles: Optimizing for Latency ............................................................. 8
7 Kernel command line parameters ................................................................... 10
8 Baseline network latency testing .................................................................... 11
9 Process Scheduling ........................................................................................ 12
9.1 Staying on the CPU ......................................................................................................... 12
9.2 Tuned scheduler plugin ................................................................................................... 12
10 Avoiding Interference (de-jittering) ................................................................ 13
10.1 Workqueue Affinity ......................................................................................................... 14
10.2 Cgroups ......................................................................................................................... 15
10.3 Scheduler Tunables ....................................................................................................... 16
10.4 Perf ................................................................................................................................ 16
10.5 SystemTap ..................................................................................................................... 18
11 Hugepages ................................................................................................... 20
11.1 Transparent Hugepages ................................................................................................ 20
[email protected] iii www.redhat.com

12 Network ........................................................................................................ 21
12.1 IRQ processing .............................................................................................................. 21
12.2 Drivers ........................................................................................................................... 21
12.3 ethtool ............................................................................................................................ 22
12.4 busy_poll ....................................................................................................................... 22
12.5 Network Tunables .......................................................................................................... 23
13 Kernel Timer Tick (nohz_full) ........................................................................ 23
13.1 History of the kernel timer tick ....................................................................................... 23
13.2 Using nohz_full .............................................................................................................. 24
13.3 nohz_full and SCHED_FIFO ......................................................................................... 25
14 RDMA Over Converged Ethernet (RoCE) .................................................... 25
15 Linux Containers .......................................................................................... 25
16 Red Hat Software Collections (SCL) and Red Hat Developer Toolset (DTS) ... 26
17 References ................................................................................................... 27
Appendix A: Revision History ............................................................................ 27
www.redhat.com iv [email protected]

1 Executive SummaryThis paper provides a tactical tuning overview on Red Hat Enterprise Linux 7 for latency-sensitive workloads on x86-based servers. In a sense, this document is a cheat sheet for getting started, and is intended as a complement to existing Red Hat documentation.
Make sure to gain a deep understanding of these tuning suggestions before putting any of them into practice. Your mileage may vary, and probably will.
Note that certain features mentioned in this paper may require the latest minor version of RedHat Enterprise Linux 7.
2 Checklist for Low Latency Standard Operating EnvironmentThis section covers prerequisite configuration steps to establish an environment optimized for low latency workloads. Subsequent sections provide context and supporting details on each step. Verify each of these checklist items to ensure a well-tuned environment.
□ Follow hardware manufacturers' guidelines for low latency BIOS tuning.□ Research system hardware topology.□ Determine which CPU sockets and PCIe slots are directly connected.□ Ensure that adapter cards are installed in the most performant PCIe slots (i.e. 8x vs 16x etc).□ Ensure that memory is installed and operating at maximum supported frequency.□ Make sure the OS is fully updated.□ Enable network-latency tuned profile, or perform equivalent tuning.□ Verify that power management settings are correct.□ Stop all unnecessary services/processes.□ Unload unnecessary kernel modules (for instance, iptables/netfilter).□ Reboot with low-latency kernel command line.□ Perform baseline latency tests.□ Iterate, making isolated tuning changes, testing in between each change.
3 BIOS ConfigurationMany server vendors have published BIOS configuration settings geared for low-latency environments. Carefully follow these recommendations, which may include disabling logical processors, frequency boost or hardware monitoring.
After implementing low latency tuning guidelines from the server vendor, verify CPU frequencies (p-states) and idle states (c-states) using the turbostat utility (see example below). Turbostat is included in the cpupowerutils package in Red Hat Enterprise Linux 6, or the kernel-tools package in Red Hat Enterprise Linux 7.
[email protected] 1 www.redhat.com

The Tuned package is a tuning profile delivery mechanism shipped in Red Hat Enterprise Linux 6 and 7. It is the primary vehicle in which research conducted by Red Hat's Performance Engineering Group is provided to customers. Tuned provides one possible standard framework for implementing system tuning, and is covered in depth in subsequent sections.
The network-latency tuned profile (new in Red Hat Enterprise Linux 7) attempts to address the most common causes of latency introduced by power management by disabling deeper c-states and requesting the maximum performance from the Intel CPU P -state driver. However, depending on the BIOS configuration, settings applied by tuned may be overridden or not applied.
This is an example of the turbostat output from a system where the BIOS is tuned for low latency and has the network-latency tuned profile is applied. Note that the Bzy_MH column indicates that the core frequencies match the TSC_MHz, and that the CPU%c1 is roughly 100% for each core:
# turbostat sleep 5 Package Core CPU Avg_MHz %Busy Bzy_MHz TSC_MHz SMI CPU%c1 - - - 0 0.01 2908 2900 0 99.99 0 0 0 1 0.02 2891 2900 0 99.98 0 1 2 0 0.01 2889 2900 0 99.99 0 2 4 0 0.00 2942 2900 0 100.00 0 3 6 0 0.00 3010 2900 0 100.00 0 4 8 0 0.01 2906 2900 0 99.99 0 5 10 0 0.00 2933 2900 0 100.00 0 6 12 0 0.01 2917 2900 0 99.99 0 7 14 0 0.00 2983 2900 0 100.00 1 0 1 0 0.01 2882 2900 0 99.99 1 1 3 1 0.03 2910 2900 0 99.97 1 2 5 0 0.00 2951 2900 0 100.00 1 3 7 0 0.01 2884 2900 0 99.99 1 4 9 0 0.01 2919 2900 0 99.99 1 5 11 0 0.01 2912 2900 0 99.99 1 6 13 1 0.02 2906 2900 0 99.98 1 7 15 0 0.01 2904 2900 0 99.99
Look for three things:
1. Make sure that the System Management Interrupt counter (SMI column in turbostat output) is not increasing after bootup is complete, and system is idle. It is normal for the SMI counter to be non-zero, but after proper BIOS configuration, it should not increase. Consult with the server vendor for more information.
2. Frequencies do not remain fixed; these should fluctuate over time, and do not sit at theCPU's lowest operational frequency when idle.
3. By default, the kernel settles all idle cores in the deepest supported c-state to improve power efficiency. Ensure that turbostat output indicates all cores are in CPU%C1 as in
www.redhat.com 2 [email protected]

the example (which used the network-latency tuned profile covered in an upcoming section).
4 NUMA TopologyRecent server platforms are physically wired up in a NUMA configuration. From a performance perspective, this means that CPU memory banks and/or PCIe slots are “local” tocertain CPU sockets, and thus some pinning combinations are faster than others.
Red Hat Enterprise Linux 7 ships with several utilities that can help expose NUMA and PCIe bus topologies. These utilities rely on the accuracy of the System Locality Information Table (SLIT) that is exported by the server's BIOS and interpreted by the Linux kernel. Certain BIOScan disable the SLIT table. The SLIT table is generally enabled by default, and for low latencytuning purposes it should remain enabled.
4.1 NUMA Discovery
The 'lstopo' utility can be used to determine PCIe locality. lstopo is included in the hwloc and hwloc-gui packages. To install these packages, run:
# yum install hwloc hwloc-gui
lstopo supports multiple output formats: text-based (useful for machine parsing and scripting),and a graphical output format useful for administrators. Here is an example:
# lstopo --logical --output-format png > `hostname`.png
The following lstopo output displaysprocessor cores, PCI locality and memory information.
[email protected] 3 www.redhat.com
Output of lstopo command

Note that cores 8-15 and network adapters named p1p1 and p1p2 are connected to NUMA node 1. Applications using these adapters perform best if they are configured to execute on NUMA node 1 (i.e. using numactl). Node 1 also has 64GB of RAM installed.
lscpu (part of the util-linux package) is another way to get a high level overview of processor information:
# lscpuArchitecture: x86_64CPU op-mode(s): 32-bit, 64-bitByte Order: Little EndianCPU(s): 16On-line CPU(s) list: 0-15Thread(s) per core: 1Core(s) per socket: 8Socket(s): 2NUMA node(s): 2Vendor ID: GenuineIntelCPU family: 6Model: 45Model name: Intel(R) Xeon(R) CPU E5-2690 0 @ 2.90GHzStepping: 7CPU MHz: 2900.000BogoMIPS: 5804.15Virtualization: VT-xL1d cache: 32KL1i cache: 32KL2 cache: 256KL3 cache: 20480K
NUMA node0 CPU(s): 0,2,4,6,8,10,12,14NUMA node1 CPU(s): 1,3,5,7,9,11,13,15
4.2 Automatic NUMA Balancing and Task AffinityRed Hat Enterprise Linux 7 provides support for automatic NUMA balancing. The kernel now automatically detects which memory pages process threads are actively using, and tries to group the threads and their memory into or across NUMA nodes. The kernel reschedules threads and migrates memory to balance the system for optimal NUMA alignment and performance.
The network-latency tuned profile disables automatic NUMA balancing to avoid unintended latency issues caused by moving processes/memory around.
The stress utility (included in EPEL or Fedora) is a simple workload generator tool to impose load on and stress test systems. stress is used below to demonstrate memory allocation.
There are several ways to ensure an application executes on a certain NUMA node:
numactl: to bind the stress program to CPU socket 0 and memory bank 0:
# numactl -N0 -m0 stress -m 1 -c 1 --vm-keep --vm-bytes 8G --timeout 5
www.redhat.com 4 [email protected]

Verify that the binding is correct:
# numastat -cs stress
Per-node process memory usage (in MBs)PID Node 0 Node 1 Total------------- ------ ------ -----6975 (stress) 8192 0 8192
Or CPU socket1/memory bank 1:
# numactl -m1 stress -m 1 -c 1 --vm-keep --vm-bytes 8G --timeout 5 & # numastat -cs stress
Per-node process memory usage (in MBs)PID Node 0 Node 1 Total------------- ------ ------ -----6981 (stress) 0 8192 8192
taskset: Bind apps to cores. Kernel best-effort for memory locality.
# taskset -c 3 ./YOURPROC
View current CPU/memory pinning done with either numactl or taskset:
# grep -i allowed /proc/PID/status
4.3 Updated numastatRed Hat Enterprise Linux 7 also includes an updated version of the numastat tool that provides /proc/meminfo type statistics on a per-NUMA-node basis. This eases the process of debugging NUMA-affinity issues. To determine which NUMA node an application's memory is allocated to:
# stress -m 1 -c 1 --vm-keep --vm-bytes 4Gstress: info: [23247] dispatching hogs: 1 cpu, 0 io, 1 vm, 0 hdd
# numastat -czs -p stress
Per-node process memory usage (in MBs) PID Node 0 Node 1 Total -------------- ------ ------ ----- 23249 (stress) 4096 0 4096 23247 (stress) 0 0 1 23248 (stress) 0 0 0 -------------- ------ ------ ----- Total 0 4097 4097
numastat can also operate system-wide, outputting per-NUMA-node /proc/meminfo.
Note that there are approximately 4GB Active(anon) pages used in node 0, where the stress application's memory was allocated:
[email protected] 5 www.redhat.com
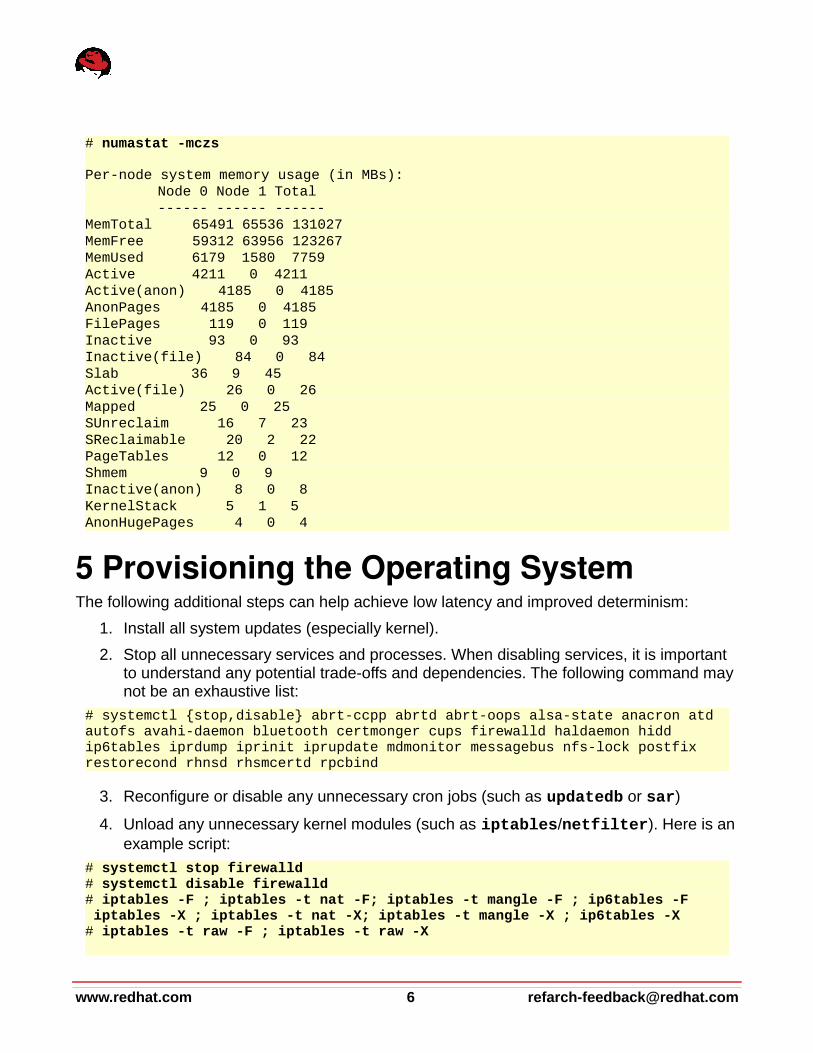
# numastat -mczs
Per-node system memory usage (in MBs): Node 0 Node 1 Total ------ ------ ------MemTotal 65491 65536 131027MemFree 59312 63956 123267MemUsed 6179 1580 7759Active 4211 0 4211Active(anon) 4185 0 4185AnonPages 4185 0 4185FilePages 119 0 119Inactive 93 0 93Inactive(file) 84 0 84Slab 36 9 45Active(file) 26 0 26Mapped 25 0 25SUnreclaim 16 7 23SReclaimable 20 2 22PageTables 12 0 12Shmem 9 0 9Inactive(anon) 8 0 8KernelStack 5 1 5AnonHugePages 4 0 4
5 Provisioning the Operating SystemThe following additional steps can help achieve low latency and improved determinism:
1. Install all system updates (especially kernel).
2. Stop all unnecessary services and processes. When disabling services, it is important to understand any potential trade-offs and dependencies. The following command may not be an exhaustive list:
# systemctl {stop,disable} abrt-ccpp abrtd abrt-oops alsa-state anacron atd autofs avahi-daemon bluetooth certmonger cups firewalld haldaemon hidd ip6tables iprdump iprinit iprupdate mdmonitor messagebus nfs-lock postfix restorecond rhnsd rhsmcertd rpcbind
3. Reconfigure or disable any unnecessary cron jobs (such as updatedb or sar)
4. Unload any unnecessary kernel modules (such as iptables/netfilter). Here is anexample script:
# systemctl stop firewalld# systemctl disable firewalld# iptables -F ; iptables -t nat -F; iptables -t mangle -F ; ip6tables -F iptables -X ; iptables -t nat -X; iptables -t mangle -X ; ip6tables -X# iptables -t raw -F ; iptables -t raw -X
www.redhat.com 6 [email protected]
# modprobe -r ebtable_nat ebtables# modprobe -r ipt_SYNPROXY nf_synproxy_core xt_CT nf_conntrack_ftp \
nf_conntrack_tftp nf_conntrack_irc nf_nat_tftp ipt_MASQUERADE \iptable_nat nf_nat_ipv4 nf_nat nf_conntrack_ipv4 nf_nat \nf_conntrack_ipv6 xt_state xt_conntrack iptable_raw \ nf_conntrack iptable_filter iptable_raw iptable_mangle \ ipt_REJECT xt_CHECKSUM ip_tables nf_defrag_ipv4 ip6table_filter \ip6_tables nf_defrag_ipv6 ip6t_REJECT xt_LOG xt_multiport \nf_conntrack
5.1 Network Time Protocol (NTP)In Red Hat Enterprise Linux 7, the default time synchronization software has changed from ntpd to Chrony. Chrony is a different implementation of the network time protocol (NTP) than the network time protocol daemon (ntpd). Chrony is able to synchronize the system clock faster and with better accuracy than ntpd. For compatibility purposes ntpd is still included in Red Hat Enterprise Linux 7. If applications require time synchronization with sub-microsecondaccuracy, investigate the Precision Time Protocol (PTP).
5.2 Precision Time Protocol (PTP)The Precision Time Protocol (PTP) is a protocol used to synchronize clocks in a network. When used in conjunction with hardware support, PTP is capable of sub-microsecond accuracy, which is far better than the accuracy normally obtainable with ntpd or Chrony.
Please see the Red Hat Enterprise Linux 7 System Administrator's Guide for information on the setup and configuration of PTP.
Some important notes:
• PTP requires network driver support, kernel support and userspace tooling.
• Red Hat ships, supports, and contributes code and engineering effort to the linuxptp PTPv2 implementation.
◦ Full support in Red Hat Enterprise Linux 6.5 or later (including 7.0)
• To achieve the highest accuracy, disable the tickless kernel by adding nohz=off to the kernel command line, and investigate the use of a dedicated NIC that supports PTP in hardware. Disabling the tickless kernel is not required for the use of PTP. It increases power consumption, and may either positively or negatively affect latency performance of certain applications. Test this configuration extensively.
5.3 What about cpuspeed?The cpuspeed service from Red Hat Enterprise Linux 5 and Red Hat Enterprise Linux 6 has been replaced in Red Hat Enterprise Linux 7 by the cpupower service. The cpupower service also conflicts with the tuned service in Red Hat Enterprise Linux 7 (because both adjust power management settings). tuned must be disabled in order to use cpuspeed, andvice-verse. tuned profiles provide the building blocks necessary to approximate cpuspeed/cpupower functionality.
[email protected] 7 www.redhat.com

6 Tuned Profiles: Optimizing for LatencyThe Tuned package is a tuning profile delivery mechanism shipped in Red Hat Enterprise Linux 6 and 7. It is the primary vehicle in which research conducted by Red Hat's Performance Engineering Group is provided to customers. Unlike in Red Hat Enterprise Linux6, tuned is enabled by default in Red Hat Enterprise Linux 7, using a profile known as throughput-performance.
The version of tuned included in Red Hat Enterprise Linux 7 has been rewritten from the ground up. Implemented in Python, it introduces the concept of both plugins and profile inheritance.
Similar in concept to the Apache “Include” directive, child profiles are created that inherit tuning from the parent. Child profiles can enable, disable, or override settings from the parent.Plugins exist that provide capabilities such as editing the kernel command line or adjusting task and scheduler priorities.
Because tuning for throughput often at odds with tuning for latency, profiles have been split along those boundaries as well providing a “balanced” profile:
In the Tuned Profile Inheritance diagram, blue boxes represent profiles included in Red Hat Enterprise Linux 7. Green boxes represent custom profiles that can be created either as
www.redhat.com 8 [email protected]
Tuned Profile Inheritance

children of existing profiles, or standalone.
For low latency workloads, let's focus on a new tuned profile in Red Hat Enterprise Linux 7: network-latency. Administrators interact with tuned via the tuned-adm command:
# tuned-adm list Available profiles: - balanced - desktop - latency-performance - myprofile - network-latency- network-throughput - powersave - sas - throughput-performance - virtual-guest - virtual-host Current active profile: network-latency
The latency-performance profile implements the following:
# egrep -v '^$|^\#|\[' /usr/lib/tuned/latency-performance/tuned.confforce_latency=1 governor=performance energy_perf_bias=performance min_perf_pct=100 kernel.sched_min_granularity_ns=10000000 vm.dirty_ratio=10 vm.dirty_background_ratio=3 vm.swappiness=10 kernel.sched_migration_cost_ns=5000000
These tunings are meant to reduce the impact of power management, increase the amount oftime tasks spend on the CPU, reduce task migrations, and reduce the amount of outstanding dirty pages kept in memory. Taken together, this set of tuning has been shown in the lab and in the field to reduce jitter and improve determinism for latency-sensitive workloads.
The network-latency profile is a child of the latency-performance profile. In addition to the tunings included in the latency-performance profile above, network-latency adds the following:
# egrep -v '^$|^\#|\[' /usr/lib/tuned/network-latency/tuned.conf include=latency-performancetransparent_hugepages=nevernet.core.busy_read=50net.core.busy_poll=50 net.ipv4.tcp_fastopen=3kernel.numa_balancing=0
These tunings enable several new features: busy_poll, tcp_fastopen, disabling transparent
[email protected] 9 www.redhat.com

hugepages and automatic NUMA balancing. Automatic NUMA balancing can potentially interfere with the most extreme latency-sensitive workloads.
Run this command to apply the network-latency tuned profile:
# tuned-adm profile network-latency
Applying a tuned profile using tuned-adm automatically persists over a reboot. Follow the instructions in this knowledgebase article to create a tuned profile on Red Hat Enterprise Linux 7.
Tuned also now supports two new plugins in RHEL7.1 or later:
• bootloader: supports setting kernel command line parameters in a tuned profile.
• scheduler: supports tuning process scheduler/priorities.
These plugins allow for centralized placement of additional, common tuning requirements.
7 Kernel command line parametersCertain operating system configuration options are only tunable via the kernel command line. Some examples of this are isolcpus, adjusting the IOMMU, limiting memory or number of CPUs. Tuned makes it possible to maintain kernel command line options in a tuned profile. For example, a low latency kernel command line could be implemented in a tuned profile as follows:
[bootloader]cmdline = isolcpus=1-15 nosoftlockup mce=ignore_ce
• mce=ignore_ce ignores corrected errors and associated scans that can cause periodic latency spikes.
• nosoftlockup disables logging of backtraces when a process executes on a CPU for longer than the softlockup threshold (default 120 seconds). Typical low-latency programming and tuning techniques might involve spinning on a core or modifying scheduler priorities/policies, which can lead to a task reaching this threshold. If a task has not relinquished the CPU for 120 seconds, the kernel prints a backtrace for diagnostic purposes. Adding nosoftlockup to the cmdline disables the printing of this backtrace (the printk itself can cause latency spikes), and does not in itself reduce latency. Tasks that spin on a CPU must occasionally yield (especially if they are SCHED_FIFO priority), or important per-cpu kernel threads may never execute, potentially leading to unexpected behavior such as very large latency spikes or interruptions in network traffic.
• audit=0 disables the kernel components of the audit subsystem which have been measured at about 1% CPU utilization when under heavy load.
• Consider measuring the impact of SELinux. It's difficult to quantify the precise overhead of SELinux because it is workload-dependent. Red Hat recommends leaving SELinux enabled unless a specific workload or application design is adversely
www.redhat.com 10 [email protected]

affected. Measure this in isolation for each specific workloads in its environment. See this guide on how to disable the kernel enforcement of the SELinux subsystem.
• isolcpus= is a way to isolate certain CPU cores from userspace threads.
• idle=poll is a way to reduce number of scheduler calls and IPIs. There is a power/cooling cost trade-off with idle=poll. This keeps processors at their maximum frequency and c-state and requires a reboot. The side-effect of this is that the CPUs donot have the thermal headroom to enter turbo frequencies.
Notably missing from this list are processor.max_cstate, and intel_idle.max_cstate. Red Hat recommends tuned profiles (which use the /dev/cpu_dma_latency interface) as they achieve measured equivalent performance without reboot requirement. Locking c-states only as necessary (i.e. during business hours) can save considerable power/cooling costs.
8 Baseline network latency testingThis section covers the well-known network testing utility netperf. netperf is a widely used tool in the kernel development community, and is actively developed and supported. It isalso open source, although it is not covered by the GPL and not included in Red Hat Enterprise Linux. netperf covers TCP and UDP in both throughput and latency test modes. It is single-threaded, although many helper scripts exist to make it multi-threaded. netperf hasextensive documentation available.
netperf is what's known as a microbenchmark. That is, it tests a small section of overall system functionality. It is useful to ensure the basic building blocks of overall system performance are properly configured. Application-level benchmarks that closely simulate the production workload are highly recommended
Here is an example of using netperf in TCP round-robin latency test mode.
Start netserver on the “server machine”:
server# netserver
Start netperf on the “client machine”:
client# netperf -H server.localdomain -T5,5 -D1,1 -t TCP_RR -l 60 -- -r 256
Explaining the netperf client command:
-H server.localdomain the hostname of the machine running netserver-T5,5 which CPU cores to bind netperf send/receive threads to-D1,1 “demo” mode which emits statistics every second-t UDP_RR test mode is UDP round-robin (see netperf documentation)-l 60 run test for 60 seconds-- test specific option delimiter-r 256 set message size of 256 bytes-O all display all output selectors (such as min/mean/99p/max latency)
Example test:
[email protected] 11 www.redhat.com

# netperf -H server.localdomain -t TCP_RR -T5,5 -l 60 -- -r 256 -O min_latency,mean_latency,p99_latency,max_latency
MIGRATED TCP REQUEST/RESPONSE TEST from 0.0.0.0 (0.0.0.0) port 0 AF_INET to server.localdomain () port 0 AF_INET : demo : first burst 0 : cpu bind
Minimum Mean 99th Maximum Latency Latency Percentile Latency Microseconds Microseconds Latency Microseconds Microseconds 6 8.30 10 25
These raw numbers are included as a simple reference. Latency-optimized code (such as other vendor-provided latency testing utilities) improves results.
9 Process SchedulingLinux provides the user with a system of priorities and scheduler policies which provide a method to influence the task scheduler. A common trait of latency-sensitive tasks is that they are designed to run continuously on the CPU with as few interruptions as possible.
Red Hat Enterprise Linux 7 provides new features such as nohz_full and busy_poll. These can reduce the number of OS-related interrupts and reduce packet transit times. This lowers latencies and improving determinism.
9.1 Staying on the CPUIf an application is being scheduled off the CPU (see Systemtap section for diagnostic howto) in favor of a less-important task, try increasing application priority using nice. Another option is to change the scheduler policy to FIFO with a priority of 1. The example command below runs YOURPROC ahead of the userspace thread and some kernel threads. Note that there are some kernel threads that run FIFO policy. This has provided mixed results, and using SCHED_OTHER via nice often performs similarly.
Run command using SCHED_FIFO with a priority of 1:
# chrt -f 1 ./YOURPROC
Run command using SCHED_OTHER with a priority of -20:
# nice -20 ./YOURPROC
When using the SCHED_FIFO policy for an application, it is possible to introduce latency spikes or other anomalies by blocking kernel threads that use SCHED_OTHER. All SCHED_OTHER tasks are of lower priority than SCHED_FIFO. For this reason it is important to test extensively when using the FIFO scheduler. Occasionally calling sched_yield from the application may be required. For many workloads, nice -20 <cmd> may provide similar performance without the programming trade-offs necessary to use SCHED_FIFO.
9.2 Tuned scheduler plugin
www.redhat.com 12 [email protected]

Tuned includes a plugin that allows for automatic scheduler tuning of processes.
For example, to bind netperf processes to core 5:
Check current affinity. Note that cores are 1-15 excluded. This is because isolcpus=1-15 was used on the kernel command line.
# grep Cpus_allowed_list: /proc/`pgrep netperf`/statusCpus_allowed_list: 0,16-47
Set up the affinity tuning in the tuned profile:
# tail /etc/tuned/myprofile/tuned.conf[scheduler]# netperf group# rule priority: 0# FIFO scheduler# Scheduler priority 1# Core affinity (hex value, so 20 == core 5)# Regex matching the target process name:group.netperf=0:f:1:20:netperf.*$
Restart tuned to trigger scanning of process list. There is work underway to avoid this restartprocedure.
# systemctl restart tuned
View the updated affinity:
# grep Cpus_allowed_list: /proc/`pgrep netperf`/statusCpus_allowed_list: 5
The lstopo command can print cpuset bitmask values using lstopo -c -v. Here is a simple table to convert from zero-based CPU ID to decimal-based:
#Zero-based CPU ID: 0 1 2 3 4 5 6 7 8 9 10 11 12 13 14 15#Decimal Value: 1 2 4 8 16 32 64 128 256 512 1024 2048 4096 8192 16384 32768
To find out the hex value for core #5:
# printf %0.2x'\n' 3220
Future versions of tuned take processor numbers and ranges as affinity values (i.e. a range of 11-15).
10 Avoiding Interference (dejittering)For the context of this document, jitter is defined as variation in latency in areas such as task scheduling, power management state transitions, packet queueing or processor cache access
[email protected] 13 www.redhat.com

and many others.
Streamline the system such that only essential tasks are scheduled. Disable all unnecessary services. Kernel threads have less flexibility than userspace threads. Here are some options for task affinity and isolation that reduce jitter and latency:
isolcpus
Isolate CPU cores from userspace tasks. This can be done with i.e. isolcpus=8-15. isolcpus requires a reboot. Kernel threads continue to run on these isolated cores.
Red Hat Enterprise Linux includes a flexible tool called Tuna that can be used to manipulate processes and IRQs.
To isolate sockets from userspace processes, eventually pushing them to socket 0:
# tuna -S1 -i ; tuna -S2 -i ; tuna -S3 -i
Users are still responsible for moving IRQs separately from tasks. For example, to move all IRQs to core 0, then move IRQs for the critical interface p1p1 to core #8:
# systemctl stop irqbalance ; systemctl disable irqbalance# tuna -q \* -c0 -m -x# tuna -q p1p1\* -c8 -m -x
Tuna also provides a GUI which can be used for interactive experiments. See the Tuna User Guide for more information.
The kernel's virtual memory management subsystem tabulates statistics every second by default. These statistics are visible in vmstat output or /proc/meminfo. Calculating these statistics occurs within a kernel timer tick and is unbounded. Reduce the frequency by which the kernel updates virtual memory statistics by setting the vm.stat_interval sysctl to a higher value. In the example below, the kernel updates virtual memory statistics only once every 10 seconds. That means that vmstat outputs the same values for 10 consecutive seconds. The trade-off is granularity of virtual memory statistics for improved determinism:
# sysctl vm.stat_interval=10
Further optimization in this area continues upstream.
10.1 Workqueue Affinity Red Hat has implemented a method of applying task affinity to kernel subsystems that utilize workqueues. At the time of this writing, the sole tunable workqueue is for dirty page writeback.
The kernel's dirty page writeback mechanism (seen in the process table as 'flush:NNN') uses a per-block device flusher thread model. These flush threads come and go on demand, as defined by vm.* sysctl settings and application behavior. The challenge in dealing with these threads has been that they are scheduled like any other thread, and have no default affinity. This means they can be scheduled on any core. Further, depending on factors such as the amount of dirty pages that need to be flushed and speed of storage, the amount of time they execute is unbounded, which might introduce jitter. The workqueue affinity tuning capability allows for a further level of CPU isolation from dirty page writeback:
www.redhat.com 14 [email protected]

# echo 1 > /sys/bus/workqueue/devices/writeback/cpumask
The value “1” is a bitmask that corresponds to core 0 (the housekeeping core). Alternatively, make this setting persistent by using the tuned [sysfs] plugin, in a custom tuned.conf file:
[sysfs] /sys/bus/workqueue/devices/writeback/cpumask = 1
The lstopo command can print cpuset bitmask values using lstopo. Abridged output:
# lstopo -c -v NUMANode L#0 (P#0 local=67062316KB total=67062316KB) cpuset=0x00005555 Socket L#0 (P#0 CPUModel="Intel(R) Xeon(R) CPU E5-2690 0 @ 2.90GHz") cpuset=0x00005555 L3Cache L#0 (size=20480KB linesize=64 ways=20) cpuset=0x00005555 L2Cache L#0 (size=256KB linesize=64 ways=8) cpuset=0x00000001 L1dCache L#0 (size=32KB linesize=64 ways=8) cpuset=0x00000001 L1iCache L#0 (size=32KB linesize=64 ways=8) cpuset=0x00000001 Core L#0 (P#0) cpuset=0x00000001 PU L#0 (P#0) cpuset=0x00000001
This information can be useful to identify cpu masks for use in configuring the writeback workqueue affinity or tuned scheduler plugin.
10.2 Cgroupscontrol groups, often abbreviated as cgroups, are a Linux kernel feature that allows users to allocate resources — such as CPU time, system memory, network bandwidth, or combinations of these resources — among hierarchically ordered groups of processes running on a system.
A common way of using cgroups for low latency environments is to construct cgroups that describe a system along NUMA boundaries. Using the libcgroup set of tools provides an alternative, often more convenient way to bind applications along NUMA boundaries. Here is an example /etc/cgconfig.conf:
group node0 { cpuset { cpuset.cpus = 0-7;
cpuset.cpu_exclusive = 1; cpuset.mems = 0; } }
group node1 { cpuset { cpuset.cpus = 8-15;
cpuset.cpu_exclusive = 1; cpuset.mems = 1; }
[email protected] 15 www.redhat.com

}
To launch a task within the node1 cgroup, use:
# cgexec -g cpuset:node1 ./YOURPROC
See the Resource Management Guide for more information, including information on using cgroups with systemd.
10.3 Scheduler TunablesThe following scheduler tunables have been found to impact latency-sensitive workloads, andcan be adjusted by the user:
/proc/sys/kernel/sched_min_granularity_ns
Set this value lower for latency-sensitive tasks (or huge thread-count), higher for compute-bound/throughput oriented workloads. Adjust by factor of 2-10x.
/proc/sys/kernel/sched_migration_cost_ns
Specifies the amount of time after the last execution that a task is considered to be “cache hot” in migration decisions. Increasing this variable reduces task migrations. Adjust by factor of 2-10x. Task migrations may be irrelevant depending on any configured task affinity settings.
Note that the tuned profiles for Red Hat Enterprise Linux 7 have been updated to incorporatethese settings and more.
10.4 PerfPerf is a utility for reading performance counters in both hardware (CPU) and kernel tracepoints. Red Hat Enterprise Linux 7 includes nearly twice as many kernel tracepoints as Red Hat Enterprise Linux 6.
When tuning for low-latency, CPU counters such as cache-misses, cpu-migrations, page-faults are useful. Software events such as scheduler, network, the virtual memory subsystem, or timers can also be tracked and reported using perf.
Red Hat's Performance Cookbook documents a method to Determine whether an application has poor cache performance.
Further documentation is available in the Developer Guide, man pages, or in the kernel source.
Perf is a debugging and analysis tool. It is not intended to run as a continuous profiling utility, especially in low latency environments. Depending on the invocation (some tracepoints have lower impact than others), running perf may impact performance. To lower the overhead, reduce the sampling interval (for example, instead of the default of 1000/sec, try reducing it to100/sec using the -F option to perf), and instead of recording system-wide, record only the PID of interest. Further, use the -e events option to measure only very specific tracepoints (examples below).
Recent Linux kernels may exhibit an issue where when the kernel's NMI watchdog fires.The
www.redhat.com 16 [email protected]

following may be logged in dmesg:
perf samples too long (2501 > 2500), lowering kernel.perf_event_max_sample_rate to 50000
This is due to the NMI watchdog using the perf infrastructure. To workaround this issue, disable the kernel nmi_watchdog via sysctl, or in a tuned profile:
[sysfs] /proc/sys/kernel/nmi_watchdog = 0
Here are introductory examples:
Find out what capabilities the CPU/kernel can provide:
# perf list
Find out what the CPU is currently spending cycles on. (for instance, hot code paths/functions). This is the most common use of perf to determine what the system is doing.
# perf top -G
To view the hardware cache-misses counter triggered by the command ls:
# perf stat -e cache-misses ./YOURPROC
To view the number of softirqs triggered:
# perf stat -e irq:softirq_entry netperfMIGRATED TCP STREAM TEST from 0.0.0.0 (0.0.0.0) port 0 AF_INET to localhost () port 0 AF_INET : demoRecv Send Send Socket Socket Message Elapsed Size Size Size Time Throughput bytes bytes bytes secs. 10^6bits/sec
87380 16384 16384 10.00 11831.62
Performance counter stats for 'netperf -l 3':
53,024 irq:softirq_entry
10.008425573 seconds time elapsed
To record what YOURPROC is doing, with call-chains, then view the output:
# perf record -g ./YOURPROC# perf report
Perf output may include unresolved symbol addresses. This is typically due to missing debuginfo packages that perf uses to resolve symbols to function names.
For example, using the stress RPM available in EPEL:
[email protected] 17 www.redhat.com

Without debuginfo installed:# perf record -g stress -c 1 -t 5 ; perf reportSamples: 19K of event 'cycles', Event count (approx.): 16379683662 - 52.25% stress libc-2.17.so [.] __random_r __random_r - 24.41% stress libc-2.17.so [.] __random __random - 15.85% stress stress [.] 0x0000000000002dc9 0x7ff74130bdc9 0x7ff74130bdb8 0x7ff74130bdbd 0x7ff74130bdc1 - 7.33% stress libc-2.17.so [.] rand rand
With debuginfo installed, the hogcpu function name has been resolved:
# perf record -g stress -c 1 -t 5 ; perf reportSamples: 20K of event 'cycles', Event count (approx.): 16380450627 - 52.31% stress libc-2.17.so [.] __random_r __random_r - 24.12% stress libc-2.17.so [.] __random __random - 12.63% stress stress [.] hogcpu hogcpu - 7.33% stress libc-2.17.so [.] rand rand - 3.43% stress stress [.] rand@plt rand@plt
perf record does not require debuginfo installed at the time of the recording. Debuginfo packages can be installed later (or on a different system entirely) where analysis can be done.
10.5 SystemTapSystemTap is a tracing and probing tool that allows users to study and monitor the activities ofthe computer system (particularly, the kernel) in fine detail. It provides information similar to the output of tools like netstat, ps, top, and iostat; however, SystemTap is designed to provide more filtering and analysis options for collected information. The systemtap-client package in Red Hat Enterprise Linux 7 includes over 130 systemtap example scripts.
One of the most useful systemtap scripts for debugging jitter issues is called cycle_thief.
The cycle_thief.stp script instruments the scheduler and IRQ handler to determine which processes and interrupts are competing with the specified task for the cpu cycles. This script uses the '-c' or '-x' options to focus on a specific task. The script outputs the number of times the task migrates between processors, with histograms showing the length of time on and off processor, lists of processes running while the task is off the processor, and the interrupts thatoccurred while the task was running.
Note: cycle_thief requires the kernel-devel package to compile and use. It does not require
www.redhat.com 18 [email protected]

kernel-debuginfo.
For example:
# ./YOURPROC &# stap ./cycle_thief.stp -x `pgrep YOURPROC`^C
Pay particular attention to the bottom of the systemtap script output:
other pids taking processor from task 14924 15182 18 0 7 125 1
These six processes ran on the same core that YOURPROC was executing on while YOURPROC was a runnable task. That is: these six processes stole cycles from YOURPROC, and may have introduced jitter.
Recent improvements have been made to the cycle_thief script which automate gathering process names. Until then, users must manually identify which processes are stealing cycles:
# ps -emo pid,comm | egrep ' 15182 | 18 | 0 | 7 | 125 | 1 '15182 kworker/5:1 1 systemd 18 rcuob/8 125 ksoftirqd/5
This gives a reasonable list of suspect processes for deeper analysis. For example, a user may affine rcuo* threads to a house-keeping CPU. An example of using perf to further trace kworker and ksoftirqd threads is included below. In the case above, both kworker and ksoftirqd have a /5 suffix. That indicates they are the per-CPU worker thread for processorcore #5 (the core netperf/netserver were bound to in the example). This reflects the fact that as netperf triggers a significant amount of network traffic, IRQs, and syscalls.
kworker threads execute kernel activity on behalf of the kernel itself or userspace processes(that is, syscalls) that use workqueues. ksoftirqd is a thread used by the kernel's network subsystem to process soft interrupts when under heavy load. Neither of these per-CPU kernelthreads can be affined. To avoid interference from these threads, avoid using syscalls in applications and bind IRQs to cores separate from the application. If the application relies on network traffic, if possible, ensure IRQs and the application are both affined to the same socket (but not the same core).
Use perf to determine what code kernel kworker or ksoftirq threads are executing:
# perf record -g -e workqueue:workqueue_queue_work -p `pgrep ksoftirq|tr '\n' ','`
Abridged perf report output:
# perf report | less 23.08% 0.00% ksoftirqd/0 [kernel.kallsyms] [k] igb_watchdog 30.77% 0.00% ksoftirqd/0 [kernel.kallsyms] [k] blk_update_request 30.77% 0.00% ksoftirqd/0 [kernel.kallsyms] [k] flush_end_io
[email protected] 19 www.redhat.com

11 HugepagesOn very large memory systems, the default 4KB page size in x86_64 Linux can introduce a performance hit due to the limited size of the CPU's transaction lookaside buffer (TLB), which is used to translate virtual memory addresses to physical memory addresses. TLB-miss overhead tends to manifest only in larger memory systems and can be detected using perf:
# perf list|grep TLB
2MB h ugepages reduce the number of pages by a factor of 512, and thus increase the likelihood of a TLB-hit by the same factor. For this reason, applications that use large amounts of memory (such as a JVM and databases) tend to perform better when using hugepages. Once memory is allocated as hugepages, it must be specifically requested by theapplication. Memory allocated as hugepages is not available for general usage. For more information, please see the Performance Tuning Guide.
There are several ways to configure hugepages. Here is a helpful article on configuring hugepages from Red Hat's knowledgebase. Use the kernel command line argument hugepages=NNN, or a custom tuned profile to allocate hugepages:
[sysctl]vm.nr_hugepages = 4096
To get information about hugepages:
# egrep -i 'thp|trans|huge' /proc/meminfo /proc/vmstat
11.1 Transparent HugepagesTransparent hugepages (THP) is an abstraction layer that automates most aspects of creating, managing, and using huge pages. THP instantiates a background kernel thread called khugepaged, which scans memory for merging candidates. THP is enabled by default. Depending on the latency targets, these scans may introduce noticeable jitter.
To determine whether page fault latency is due to Huge Pages or Transparent Huge Pages, see this knowledge base article.
The network-latency tuned profile disables transparent hugepages. Alternatively, disable it manually:
# cat /proc/cmdlineBOOT_IMAGE=/vmlinuz-3.10.0-222.el7.x86_64 root=/dev/mapper/vg0-root ro rd.md=0 rd.dm=0 rd.lvm.lv=vg0/swap crashkernel=auto console=ttyS0,115200 rd.lvm.lv=vg0/root rd.luks=0 vconsole.keymap=us vconsole.font=latarcyrheb-sun16 LANG=en_US.UTF-8 transparent_hugepage=never
or
# echo never > /sys/kernel/mm/transparent_hugepage/enabled
www.redhat.com 20 [email protected]

12 NetworkWhen tuning network performance for low latency, the goal is to have IRQs be serviced on the same core or socket that is currently executing the application that is interested in the network packet. This increases CPU cache hit-rate (see section on perf) and avoids using theinter-processor link.
12.1 IRQ processing
irqbalance is a daemon to help balance the CPU load generated by interrupts across all of a system's CPUs. irqbalance identifies the highest volume interrupt sources, and isolates them to a single unique CPU so that load is spread as much as possible over an entire processor set, while minimizing cache miss rates for IRQ handlers.
The irqbalance service continues to be enabled by default in Red Hat Enterprise Linux 7. Itremains an important service that helps spread IRQ-processing load across multiple processors dynamically.
In Red Hat Enterprise Linux 6.4 and later, irqbalance has grown important new capabilities, such as automatically applying PCI-bus affinity to IRQs. This ability covers newer systems where PCI controllers are embedded within the CPU, and CPUs are physically wired to certain PCI slots.
If the workload has extremely tight latency constraints, it may be beneficial to disable irqbalance. Disabling irqbalance reduces the system's ability to dynamically adjust to changing load conditions. Thus, Red Hat does not recommend disabling irqbalance unlessthe proper calculations have been made such that the system can function under expected maximum load levels.
When troubleshooting irqbalance, it is helpful to run the daemon in the foreground, in verbose mode:
# irqbalance -d -f
For extensive detail on IRQs, see Red Hat's Optimizing Red Hat Enterprise Linux Performance by Tuning IRQ Affinity guide.
12.2 DriversCertain NIC vendors provide low-latency tuning guidelines that can be read and tested. Whenguides offer conflicting advice, experiment with both options.
Vendors may also provide IRQ affinity scripts that line up IRQs with cores (i.e. a 1:1 relationship). Others have the ability to vary the number of RX/TX queues. Consider using tuna, vendor scripts, or:
# irqbalance --oneshot
Oneshot mode makes a single pass across the system and apply defaults. It then exits, and
[email protected] 21 www.redhat.com

IRQs do not move again until the administrator applies new tunings.
12.3 ethtoolethtool is a utility to query or control network driver and hardware settings and statistics. Many statistics (ethtool -S) are hardware/driver dependent. Some NICs track statistics in firmware, others track them in-kernel. The precise meanings of the statistics counters vary between vendors. Consult with the hardware vendor documentation.
Coalescing: (ethtool -cC)
Because of the performance cost of interrupts, NICs attempt to batch multiple packets into a single interrupt. Ethtool's -c option provides a way to adjust this batching policy. Experiment with a coalesce value of 0 or 1. Verify there are enough remaining CPU cycles to handle bursts.
Ring buffers: (ethtool -gG)Ring buffers are a set of memory buffers that provide a very small amount of space to deal with cases when the CPU is not available to deal with packets. Driver dependent, output may be in “slots” or “bytes”. There has been a move to Byte Queue Limits, which avoids a head-of-line blocking problem caused by the “slots” technique. Increase ring buffer size to deal with packet drops. Increasing buffer sizes can add latency.
Offload Capabilities: (ethtool -kK)NICs may provide some amount of “offload” capabilities. An offload can improve performance by moving network processing from software to specialized hardware. Some examples of common NIC offloads include TCP Segmentation Offload (TSO) and Generic Receive Offload(GRO). Offloads generally save CPU cycles, but can be a mixed bag in terms of latency performance as many are designed to increase throughput and decrease CPU utilization through batching techniques. For example, Generic Receive Offload (GRO) may aggregate packets up to 64KB. Note that since offloads occur between the OS and the wire, their properties are generally not observable with tcpdump on the sender/receiver; use a port-mirror or equivalent tap device to see what the wire traffic looks like. Offloads modify packet quantity/frame size and flow characteristics. These may may vary considerably from the MTU configured on the OS or the switch.
Historically, disabling all NIC offloads led to the lowest latency performance. However recent lab testing indicates this is no longer true across the board. Red Hat's recommendation is to accept the NIC driver defaults and conduct controlled experiments.
ethtool configurations can be persisted several ways; including them udev rules, application's startup scripts, ETHTOOL_OPTS variable in /etc/sysconfig/network-scripts or a tuned profile using the [script] plugin.
12.4 busy_pollBusy polling is a technique by which the ethernet driver polls hardware queues of a network device. This removes several delays caused by scheduling, interrupts and context switching.
www.redhat.com 22 [email protected]

Busy polling requires driver enablement. To determine whether the NIC driver supports busy polling, use ethtool:
# ethtool -k p3p2 | grep busy-poll busy-poll: on [fixed]
A value of “on” means that the driver supports busy poll. Administrators must still enable it either via the system-wide sysctl setting (used by the network-latency tuned profile), or manually via setting the SO_BUSY_POLL socket option. See the Red Hat Performance Tuning Guide for more information.
Note that when using use busy_poll with UDP traffic, use 'connect' when establishing the UDPsocket. busy_poll increases power consumption on active cores.
12.5 Network TunablesThe Linux kernel's networking stack is extremely flexible. Significant effort has gone in to ensure sane defaults for the most common use-cases. Red Hat adjusts certain network tunables to suite enterprise workloads via tuned profiles. If tuned is disabled or not installed, upstream kernel defaults are used. Most network tunables live in /proc/sys/net. The most common way to adjust them is by using the sysctl tool. Documentation on using sysctl isavailable in the Performance Tuning Guide.
/proc/sys/net/ipv4/tcp_low_latencyDemonstrated to lower latency very slightly (under 1 microsecond). Not recommended.
/proc/sys/net/core/busy_poll and /proc/sys/net/core/busy_readEnable busy_poll on supported NIC hardware for read, poll and select.
/proc/sys/net/ipv4/tcp_fastopenEnable TCP FastOpen support on both server and client connections. See the kernel documentation for more information.
TCP_NODELAY (otherwise known as the Nagle algorithm) is enabled by default in the Linux TCP stack. TCP_NODELAY reduces the number of packets used to transmit data by delayingoutgoing packets until the amount of data ready to send reaches the maximum transmit unit of the network interface (commonly 1500 bytes). The amount of time it takes to accumulate a single MTU's worth of packets is unbounded. For certain applications this delay interferes withtimely receipt of data.
See Red Hat's Realtime Tuning Guide for more information on TCP_NODELAY.
13 Kernel Timer Tick (nohz_full)
13.1 History of the kernel timer tickThe kernel timer tick is an interrupt triggered at a periodic interval (based on the kernel compile option CONFIG_HZ). The tick is what keeps track of kernel statistics such as CPU and memory usage and provides for scheduler fairness through it’s load balancer. It also
[email protected] 23 www.redhat.com

keeps time, which keeps gettimeofday updated.
When the tick fires (as often as every millisecond, based on value of CONFIG_NO_HZ), it gets scheduled ahead of the currently run task on a CPU core. In other words, whatever was running (with all of it’s valuable data cache-hot) is interrupted by the tick.
Certain workloads might see a 1-3% difference attributed to this behavior. This may cause some noticeable jitter, since what happens inside the tick is unbounded. The total time the tickruns is not a predictable or constant value.
It is important to differentiate this “tickless kernel” (aka nohz idle) capability introduced in kernel 2.6.21 from the nohz_full capability introduced in kernel 3.9:
OS Version Tickless Ticks/sec Idle(nohz idle)
Ticks/secActive
Ticks/sec Active(nohz_full)
RHEL5 No 1000 1000
RHEL6 Yes 0 1000
RHEL7 Yes 0 1000 1 (nr_running ≤ 1)
Table 13.1-1: Kernel timer tick behavior for recent versions of RedHat Enterprise Linux
Prior to the introduction of the “tickless kernel” in kernel 2.6.21, the timer tick ran on every core at the rate of CONFIG_HZ (i.e. 1000/sec). This provided for a balance of throughput and latency. It had the side-effect of waking up every core constantly, which wasn’t necessary when nr_running=0 (a per-core attribute…see /proc/sched_debug).
On the other hand, the tickless kernel disables the kernel timer tick on idle cores to save power by not waking the CPU up from a deeper c-state. nohz_full is an optimization on top of the tickless kernel that extends the tickless behavior beyond the idle case to “active” cases under very tight constraints (such as imposing a constraint which ensures that nohz_full engages only when one runnable task is on the CPU).
13.2 Using nohz_fullnohz_full is enabled within the kernel's configuration, but off by default.
To enable nohz_full, determine which cores to isolate from kernel timer ticks. In the below example of a 2-socket system with 8 total cores, we can enable nohz_full on cores 1-15, reserving core 0 for housekeeping by appending the following to the kernel command line:
isolcpus=1-15 nohz_full=1-15
Or a tuned profile using the bootloader plugin:
[bootloader]cmdline = isolcpus=1-15 nohz_full=1-15
www.redhat.com 24 [email protected]

This example assumes a 2-socket 8-core server, keeps core 0 as the “housekeeping” core, and isolate all other cores from kernel timer ticks (nohz_full) and userspace task scheduling (isolcpus). It is important to couple nohz_full with isolcpus because without isolcpus, the kernel task scheduler may choose to run a new task on a nohz_full core, which would cause the kernel to disable nohz_full mode and fall back to default tickless mode (1000 ticks/sec), similar to the SCHED_FIFO case detailed in the next section.
Once the system is running, move rcuo* threads to the housekeeping core. This can also be done with a tuned profile using the [script] plugin.
# for i in `pgrep rcuo` ; do taskset -pc 0 $i ; done
See the Performance Tuning Guide or the kernel documentation for more information on nohz_full.
13.3 nohz_full and SCHED_FIFOnohz_full's requirement that there can only be one runnable task on the CPU's runqueue means that benefits of nohz_full may not be fully realized when using the SCHED_FIFO scheduler priority. The reason for this is the property of SCHED_FIFO tasks do not relinquish the CPU to let per-CPU kernel threads execute. Since Linux does not support applying affinitytuning to several per-CPU kernel threads, if/when they execute on a core marked as nohz_fullthat already has a SCHED_FIFO thread running on it, the kernel disables nohz_full on that core, and falls back to ticking while active (1000/sec).
14 RDMA Over Converged Ethernet (RoCE)RDMA technologies provide extreme low-latency performance and reduced CPU overhead. This is achieved through bypassing the Linux kernel networking stack, and obviating the needfor a significant portion of context switches and memory copies.
Starting with Red Hat Enterprise Linux 6.6 and 7.0, RoCE technologies that were formerly part of the High Performance Networking Add-on are now included in the base Red Hat Enterprise Linux product.
15 Linux ContainersContainers utilize the Linux kernel network namespace feature to provide isolated networking environments for each container. Kernel namespaces in general have near-zero overhead as compared to non-namespaced networks. The type of device plumbed into the container affects the container's netowrk performance. As in virtualization, “passthrough” devices provide near-bare-metal performance in Linux containers. Work is underway to allow bypass technologies (for instance RoCE) into Linux containers.
[email protected] 25 www.redhat.com

16 Red Hat Software Collections (SCL) and Red Hat Developer Toolset (DTS)Red Hat provides access to cutting-edge versions of popular compiler, tool-chain, debugging utilities, as well as popular web frameworks and languages through RHSCL and RHDTS. These suites include gcc-4.9.1 and systemtap-2.5, php-5.5, python-3.3, and nginx-1.4. For more information, see the Red Hat Enterprise Linux Developer Program homepage.
For access to SCL and DTS, see the following Knowledgebase article:
https://access.redhat.com/solutions/472793
www.redhat.com 26 [email protected]
17 References• Red Hat Enterprise Linux Documentation
https://access.redhat.com/documentation/en-US/Red_Hat_Enterprise_Linux/
• Performance Cookbook Series
https://access.redhat.com/articles/767563
Appendix A: Revision HistoryRevision 1.0 Monday, January 19, 2015 Jeremy Eder
Initial Release
[email protected] 27 www.redhat.com