Embed Size (px)
Citation preview
Hervé Le BihanBanque de France and Curtin University
Low inflation in advanced economies:causes and challenges for central banks
1
Presentation at Curtin CornerMarch, 9, 2018
Views expressed in this presentation may not necessarily reflect those ofthe Banque de France
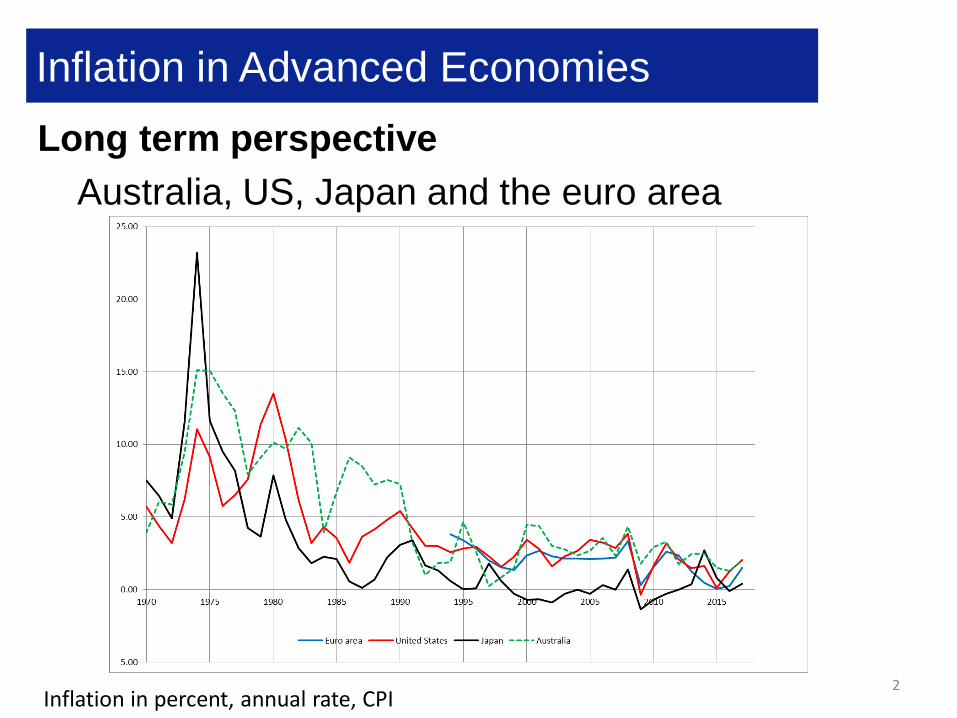
Inflation in Advanced Economies
2
Long term perspective Australia, US, Japan and the euro area
Inflation in percent, annual rate, CPI
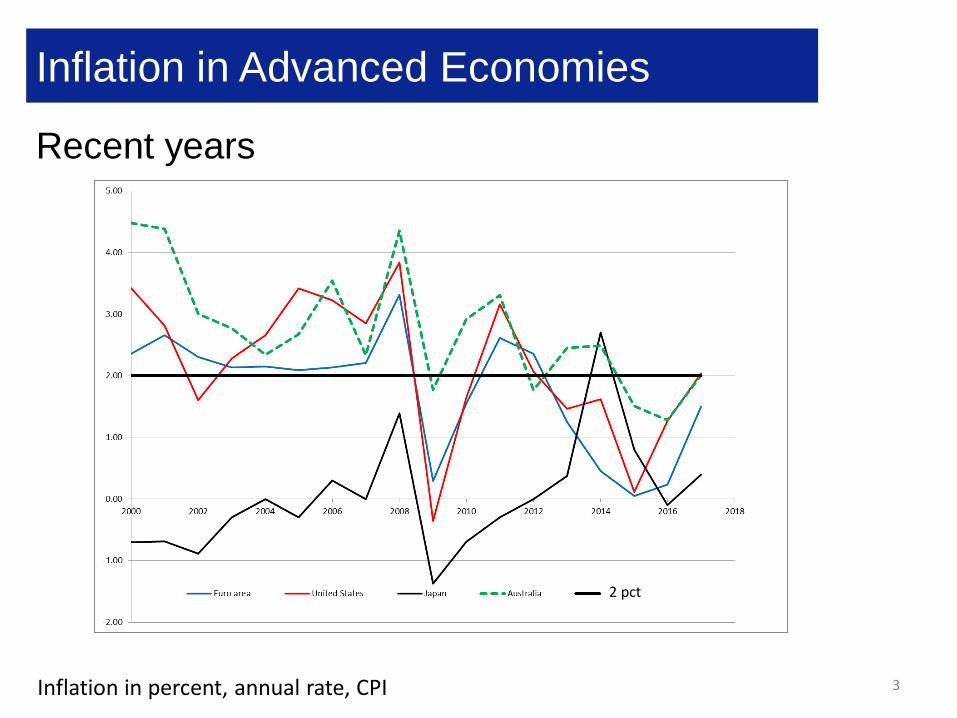
Inflation in Advanced Economies
3
Recent years
Inflation in percent, annual rate, CPI
2 pct
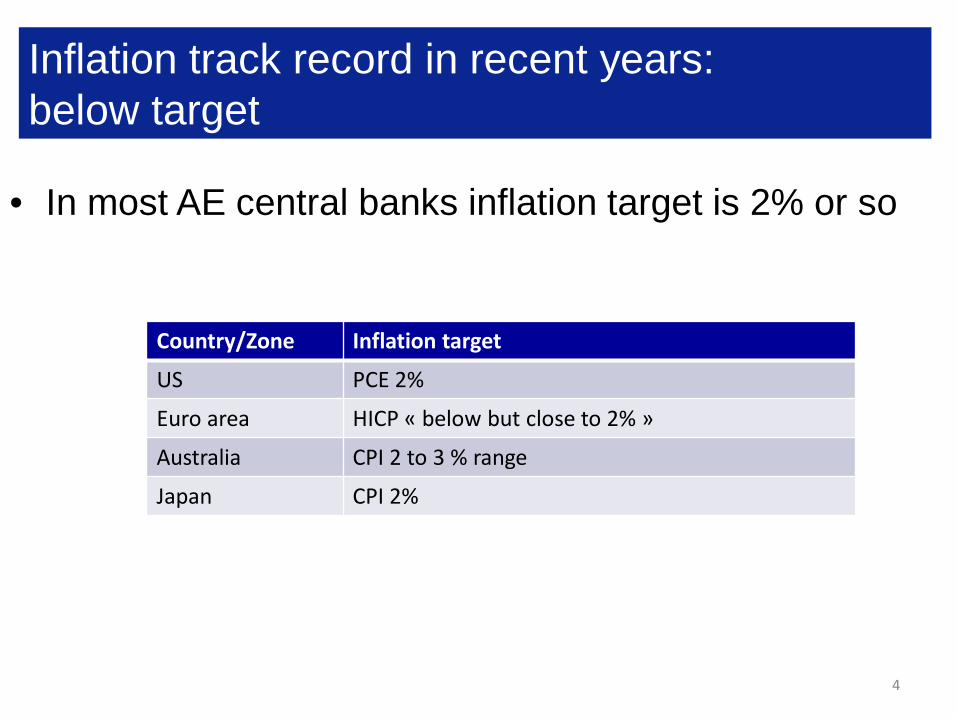
Inflation track record in recent years: below target
• In most AE central banks inflation target is 2% or so
4
Country/Zone Inflation target
US PCE 2%
Euro area HICP « below but close to 2% »
Australia CPI 2 to 3 % range
Japan CPI 2%
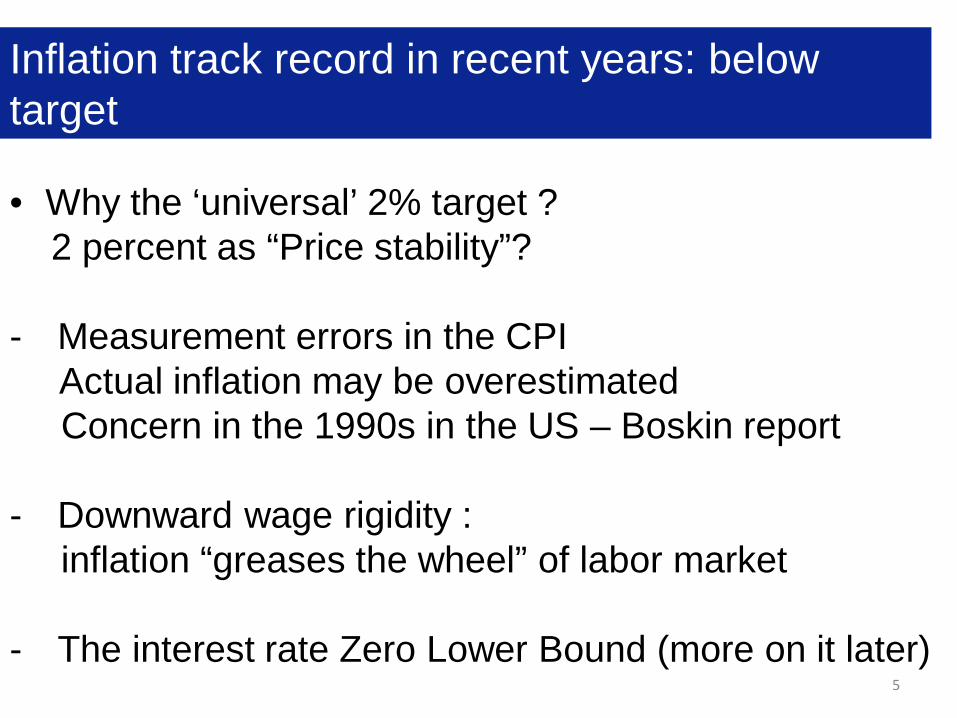
Inflation track record in recent years: below target
• Why the ‘universal’ 2% target ? 2 percent as “Price stability”?
- Measurement errors in the CPIActual inflation may be overestimated Concern in the 1990s in the US – Boskin report
- Downward wage rigidity : inflation “greases the wheel” of labor market
- The interest rate Zero Lower Bound (more on it later)5
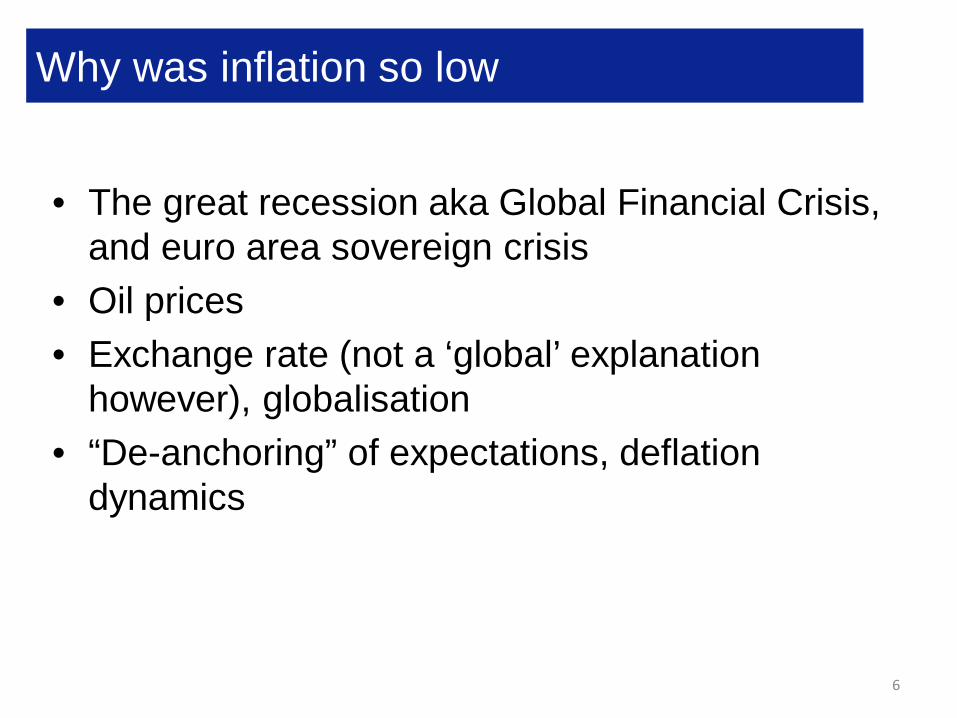
Why was inflation so low
• The great recession aka Global Financial Crisis, and euro area sovereign crisis
• Oil prices• Exchange rate (not a ‘global’ explanation
however), globalisation• “De-anchoring” of expectations, deflation
dynamics
6
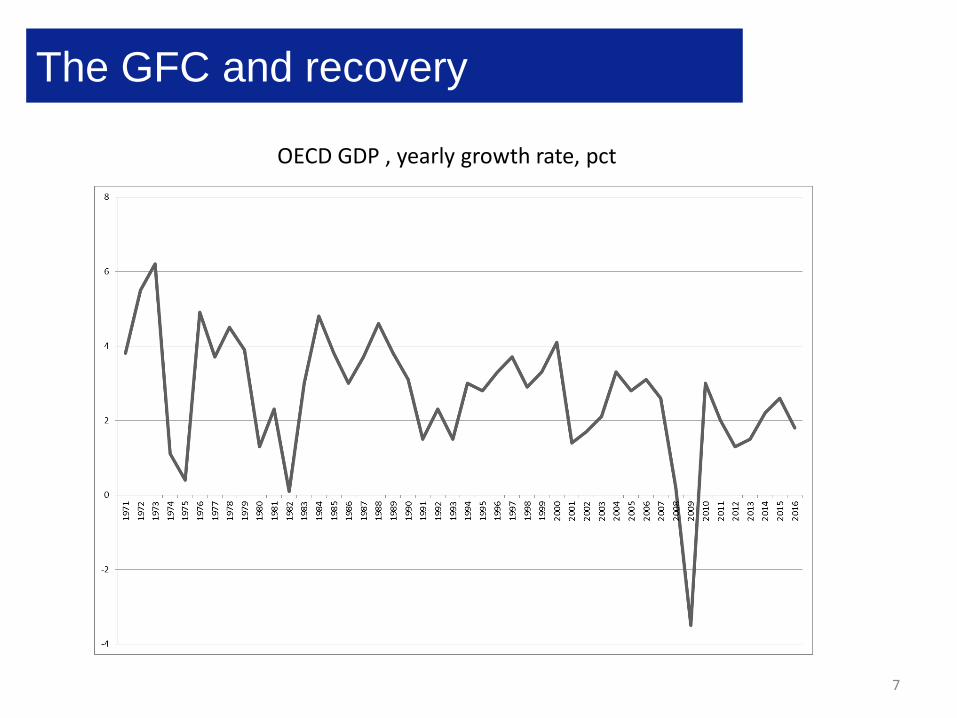
The GFC and recovery
7
OECD GDP , yearly growth rate, pct
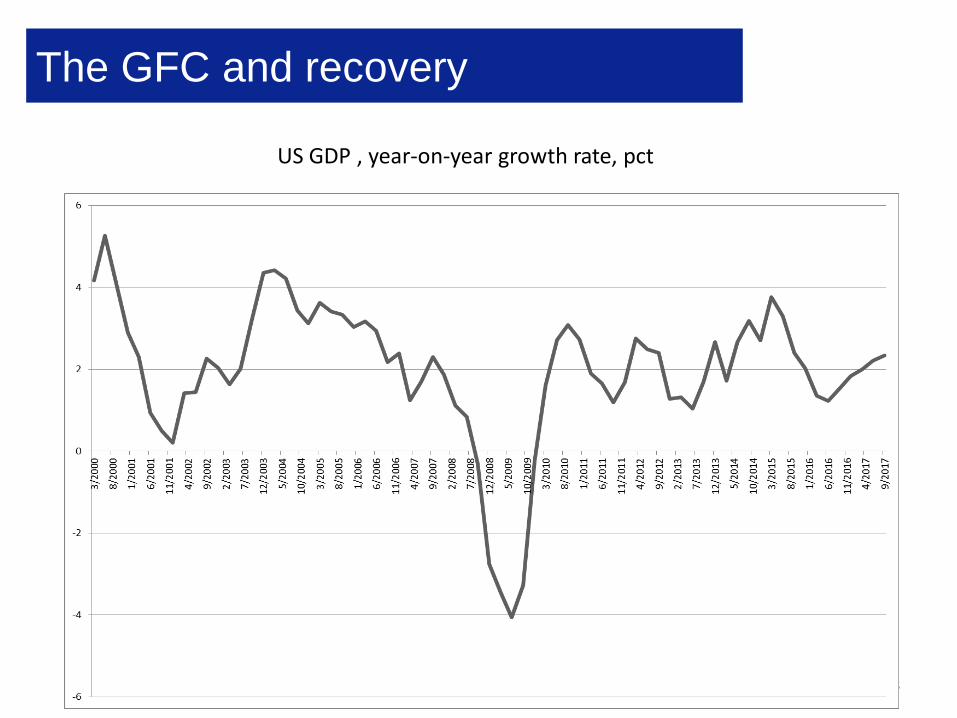
The GFC and recovery
8
US GDP , year-on-year growth rate, pct
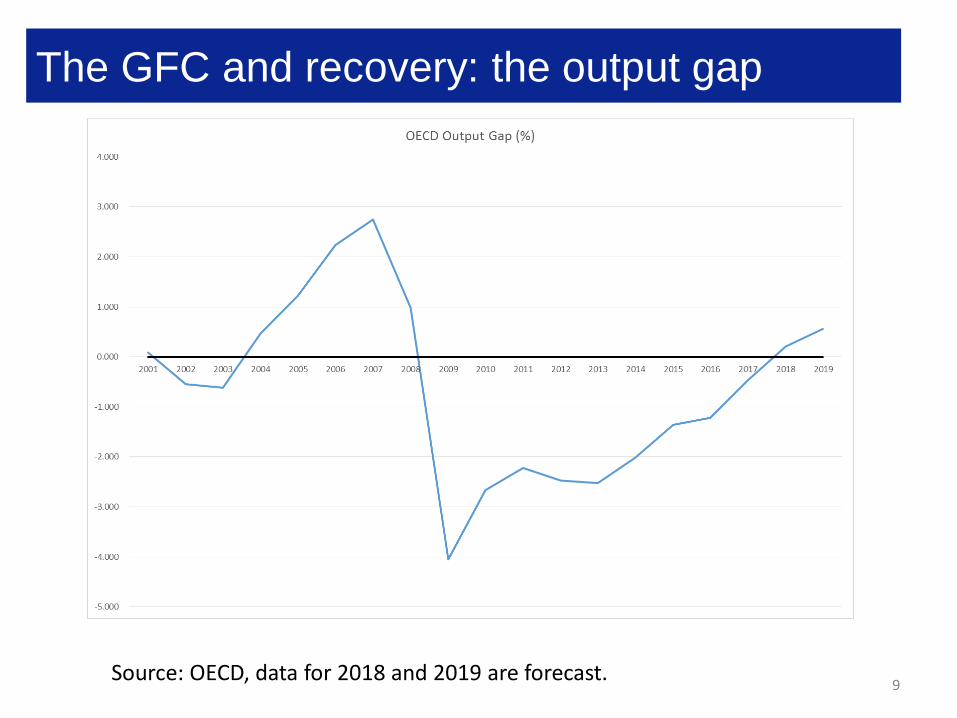
The GFC and recovery: the output gap
9Source: OECD, data for 2018 and 2019 are forecast.
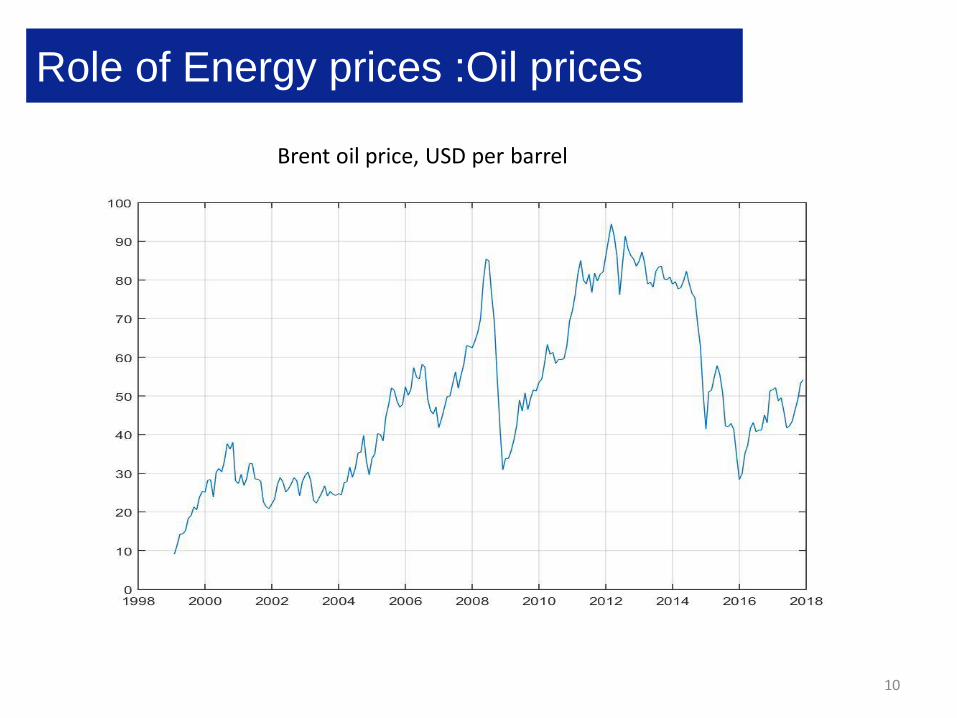
Role of Energy prices :Oil prices
10
Brent oil price, USD per barrel
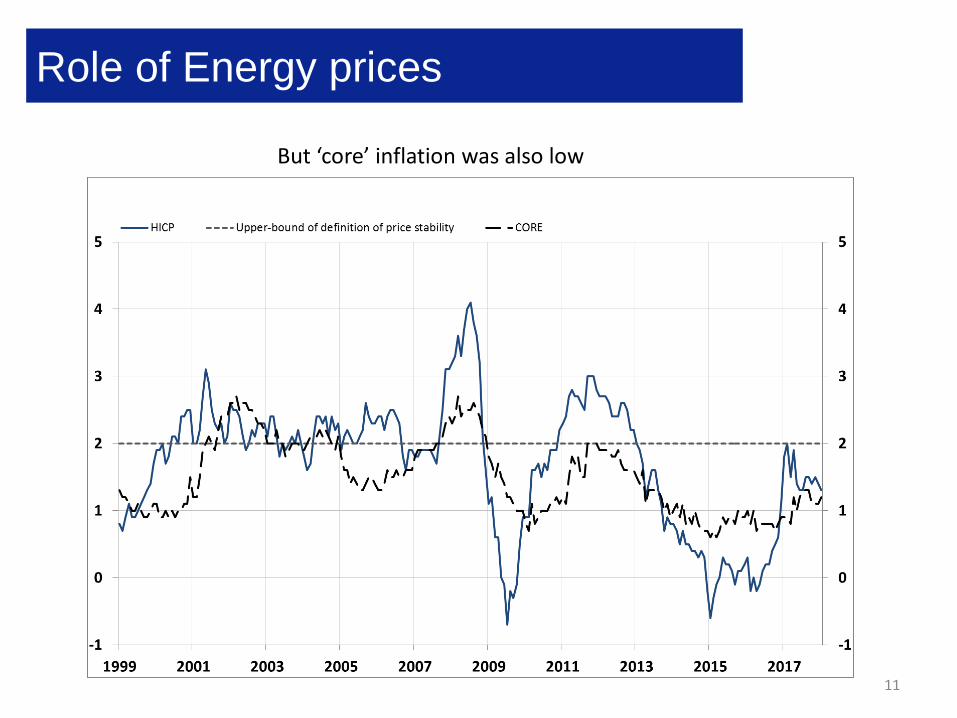
Role of Energy prices
11
But ‘core’ inflation was also low
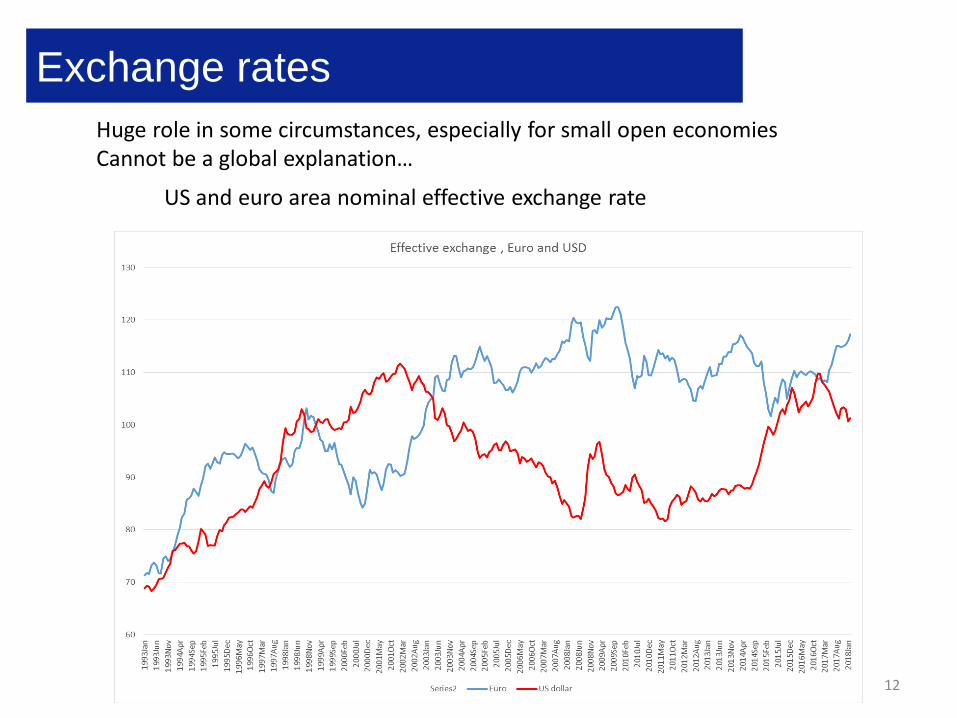
Exchange rates
12
Huge role in some circumstances, especially for small open economiesCannot be a global explanation…
US and euro area nominal effective exchange rate
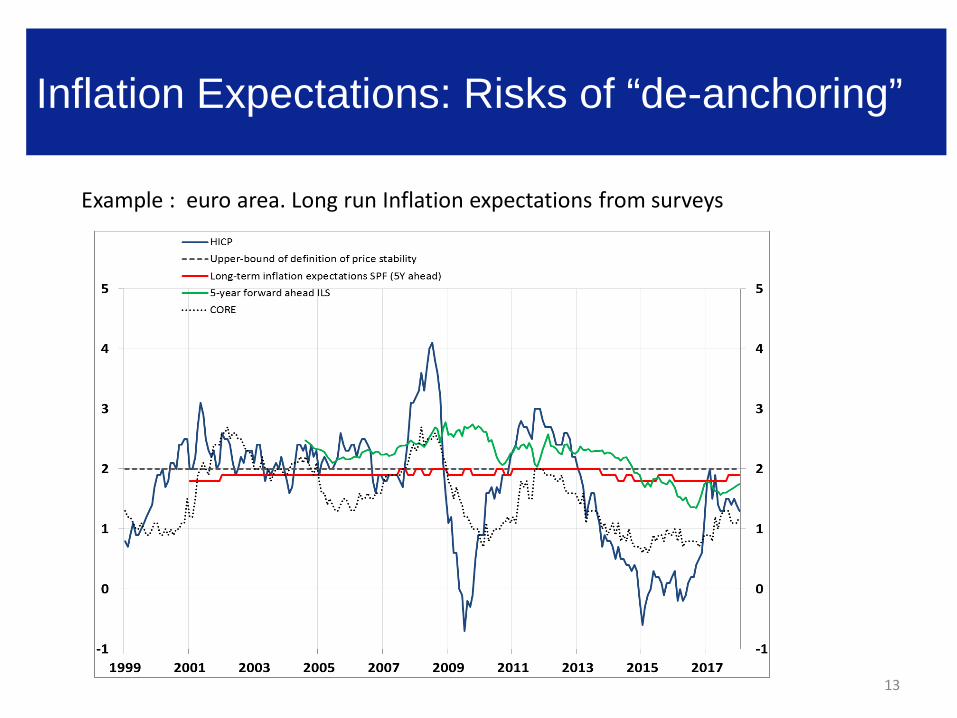
Inflation Expectations: Risks of “de-anchoring”
13
Example : euro area. Long run Inflation expectations from surveys
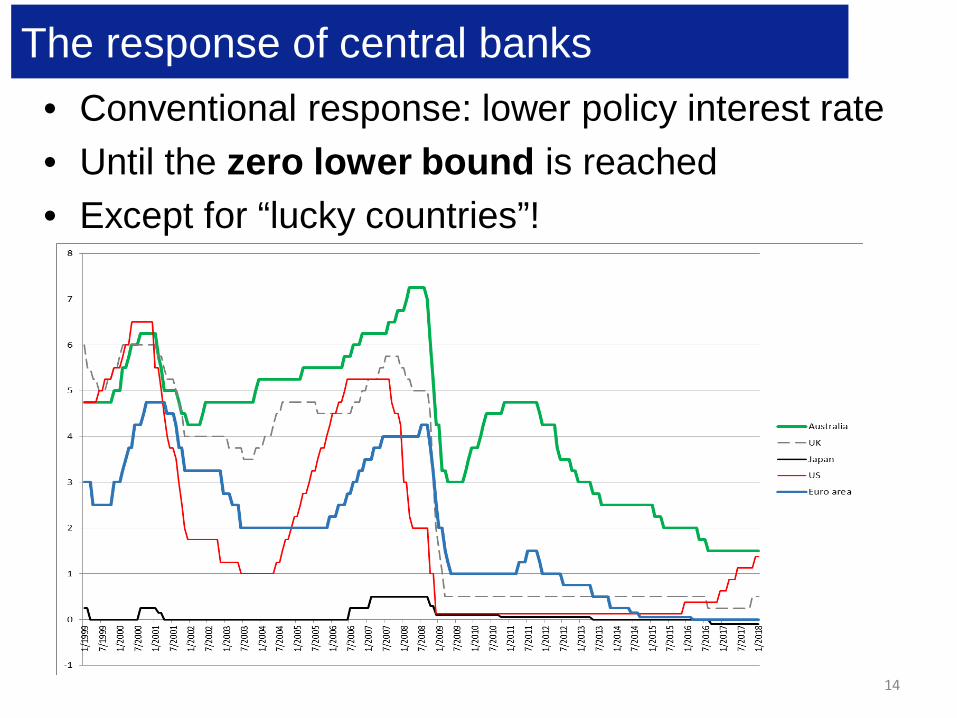
The response of central banks• Conventional response: lower policy interest rate• Until the zero lower bound is reached• Except for “lucky countries”!
14
The response of central banks
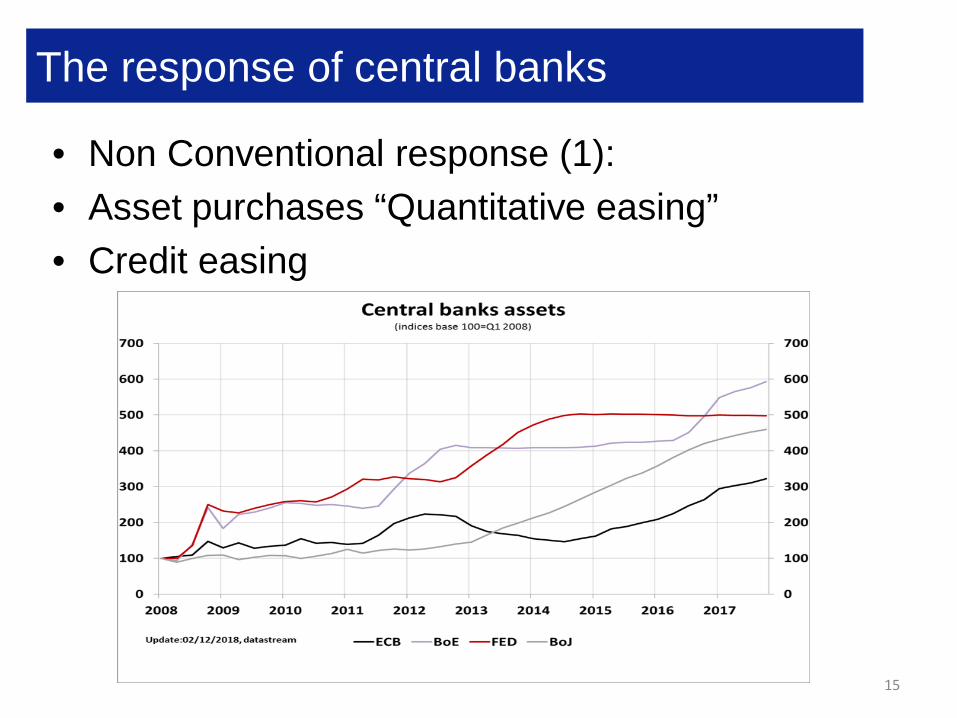
• Non Conventional response (1):• Asset purchases “Quantitative easing”• Credit easing
15
The response of central banks
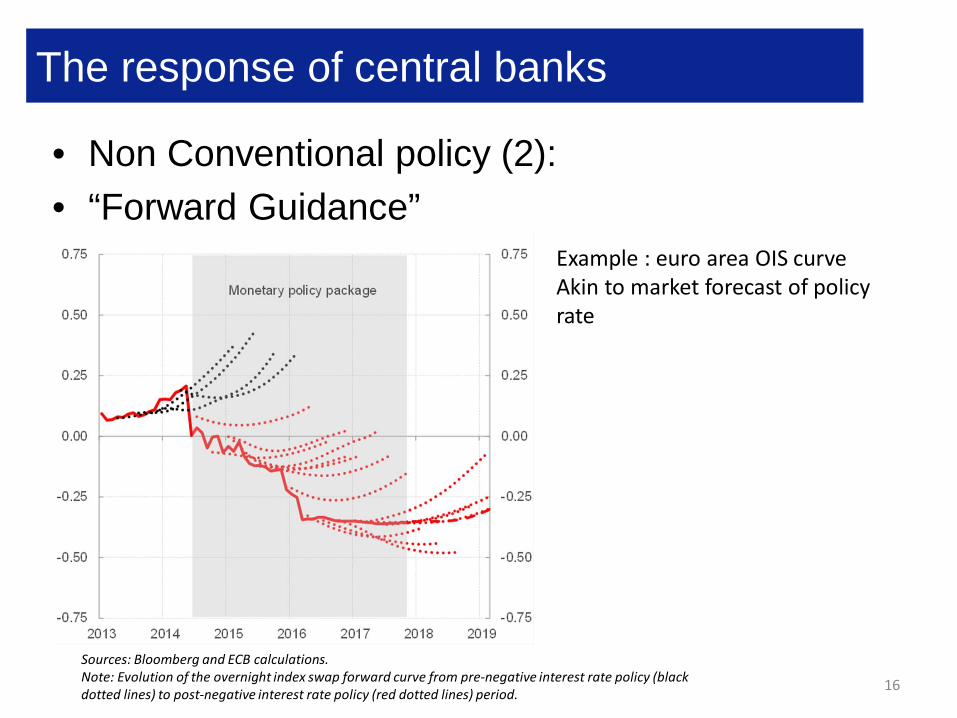
• Non Conventional policy (2):• “Forward Guidance”
16
Sources: Bloomberg and ECB calculations.Note: Evolution of the overnight index swap forward curve from pre-negative interest rate policy (black dotted lines) to post-negative interest rate policy (red dotted lines) period.
Example : euro area OIS curveAkin to market forecast of policy rate
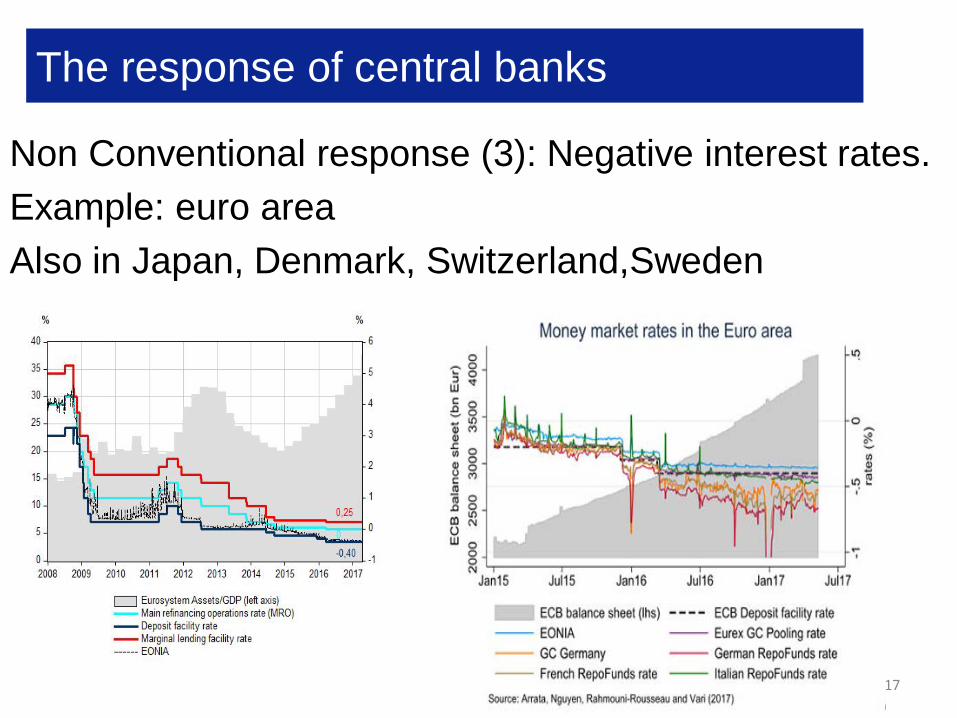
The response of central banks
Non Conventional response (3): Negative interest rates.Example: euro area Also in Japan, Denmark, Switzerland,Sweden
17
Challenge #1:Has the Phillips curve disappeared?
18
The Phillips curve: a standard tool for analyzing inflation dynamics
Many versions: wage/price, forward-looking/backward-looking, « accelerationist »…
A typical illustrqtive example:
𝜋𝜋𝑡𝑡 =c+a 𝜋𝜋𝑡𝑡−1 + 𝑏𝑏 𝑌𝑌𝑡𝑡 + 𝑑𝑑∆𝑃𝑃𝑖𝑖𝑖𝑖𝑖𝑖 + etwhere𝜋𝜋𝑡𝑡 is inflation𝑌𝑌𝑡𝑡 the output gap (or unemployment rate)∆𝑃𝑃𝑖𝑖𝑖𝑖𝑖𝑖import priceset shock
Parameter b is the slope of the Phillips curveCrucial for transmission of monetary policy
Challenge :Has the Phillips curve disappeared?
19
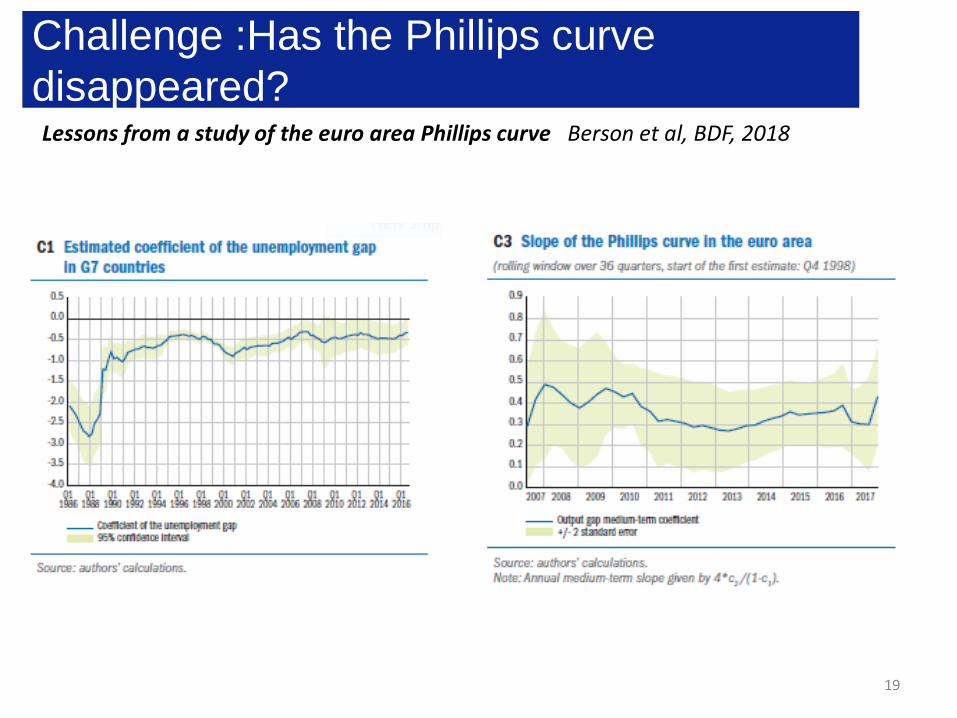
Lessons from a study of the euro area Phillips curve Berson et al, BDF, 2018
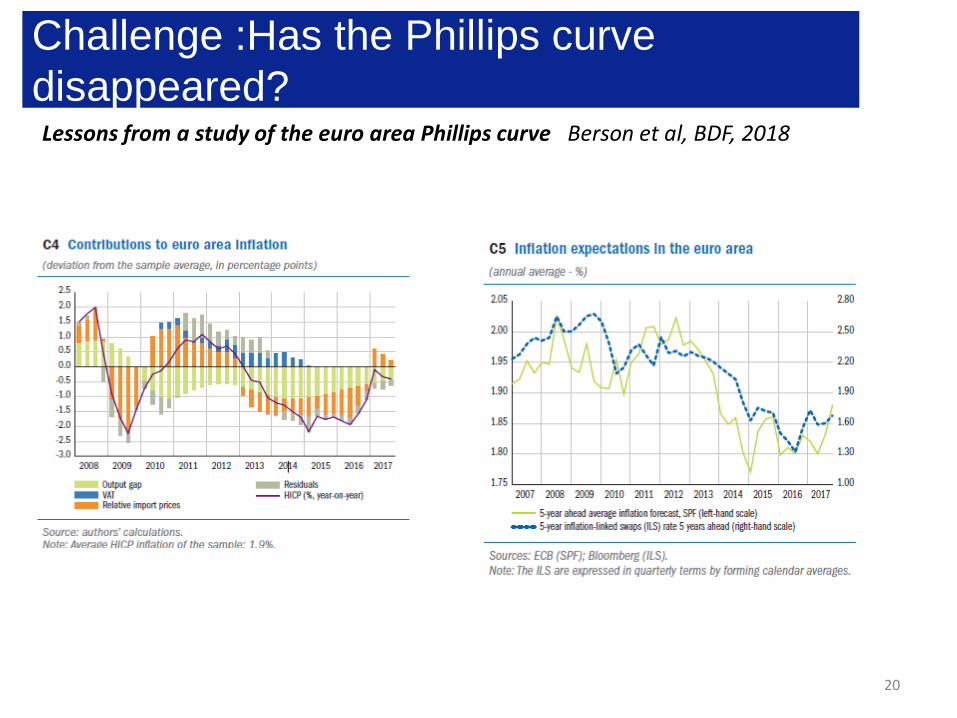
Challenge :Has the Phillips curve disappeared?
20
Lessons from a study of the euro area Phillips curve Berson et al, BDF, 2018
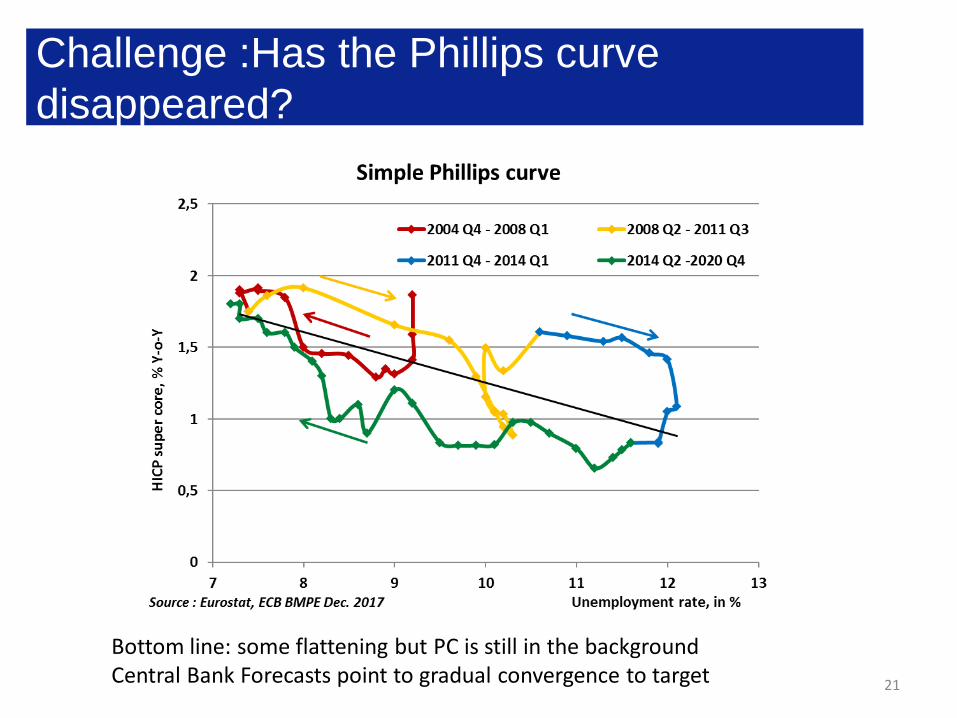
Challenge :Has the Phillips curve disappeared?
21
Bottom line: some flattening but PC is still in the backgroundCentral Bank Forecasts point to gradual convergence to target
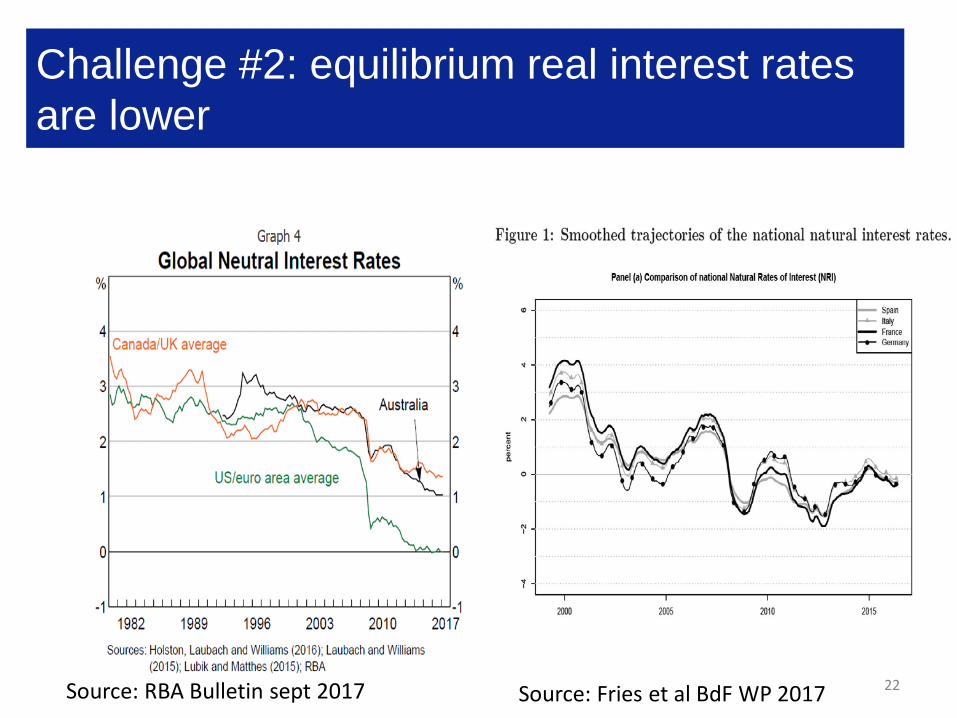
Challenge #2: equilibrium real interest rates are lower
22Source: RBA Bulletin sept 2017 Source: Fries et al BdF WP 2017
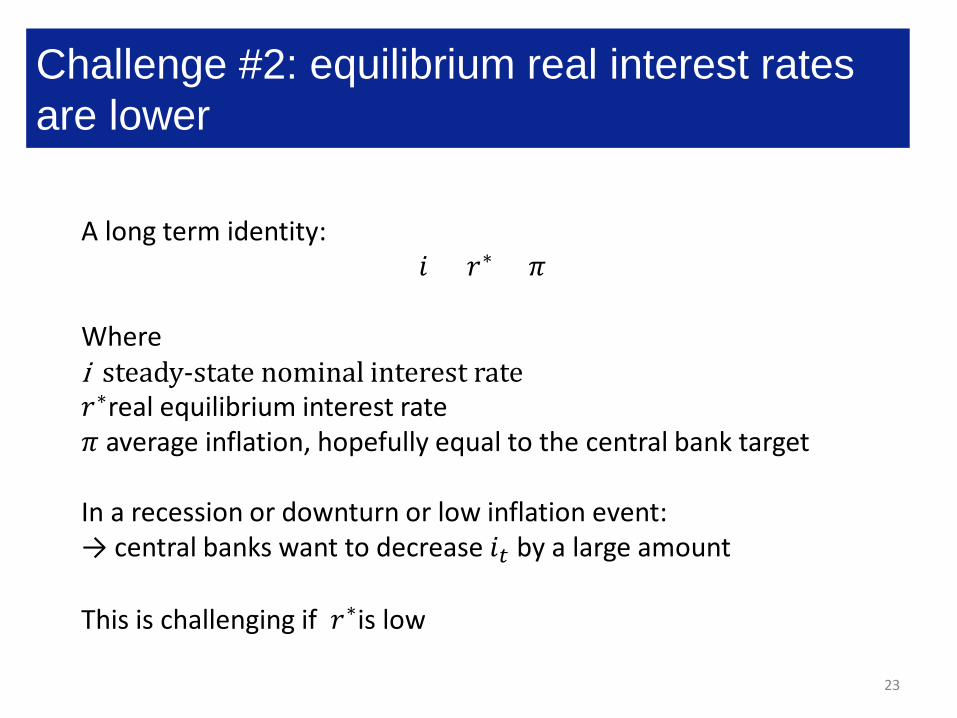
Challenge #2: equilibrium real interest rates are lower
23
A long term identity:𝑖𝑖 = 𝑟𝑟∗ + 𝜋𝜋
Where i steady-state nominal interest rate𝑟𝑟∗real equilibrium interest rate𝜋𝜋 average inflation, hopefully equal to the central bank target
In a recession or downturn or low inflation event:→ central banks want to decrease 𝑖𝑖𝑡𝑡 by a large amount
This is challenging if 𝑟𝑟∗is low
Challenge : equilibrium real interest rates are lower
• Causes of decline in 𝑟𝑟∗: ‘secular stagnation’ ; taste for safe assets
• Risk: more episodes of Zero Lower Bound in the future
• What are the options if this materializes ?- Negative rates (extreme version: banning cash)- More frequent use of asset purchases- Reconsider inflation target
24