Embed Size (px)
Citation preview

DOI: 10.18697/ajfand.91.18095 15876
Afr. J. Food Agric. Nutr. Dev. 2020; 20(3):15876-15897 DOI: 10.18697/ajfand.91.18095
LOW INCOME FARM HOUSEHOLDS’ ACCESS TO MARKETS AND HOUSEHOLD FOOD SECURITY:
The Case of Two Economically Distinct Areas in Rural Tanzania
Mtingele A1,2* O’Connor D2 and TF Mkamwa3
Achilana Mtingele
*Corresponding author email: [email protected] 1Economics Department, St. Augustine University of Tanzania, P. O. Box 307, Mwanza, Tanzania 2School of Agriculture & Food Science, Agriculture and Food Science, University College Dublin, Belfield, Dublin 4 3Sociology Department, St. Augustine University of Tanzania, P. O. Box 307, Mwanza, Tanzania
DOI: 10.18697/ajfand.91.18095 15877
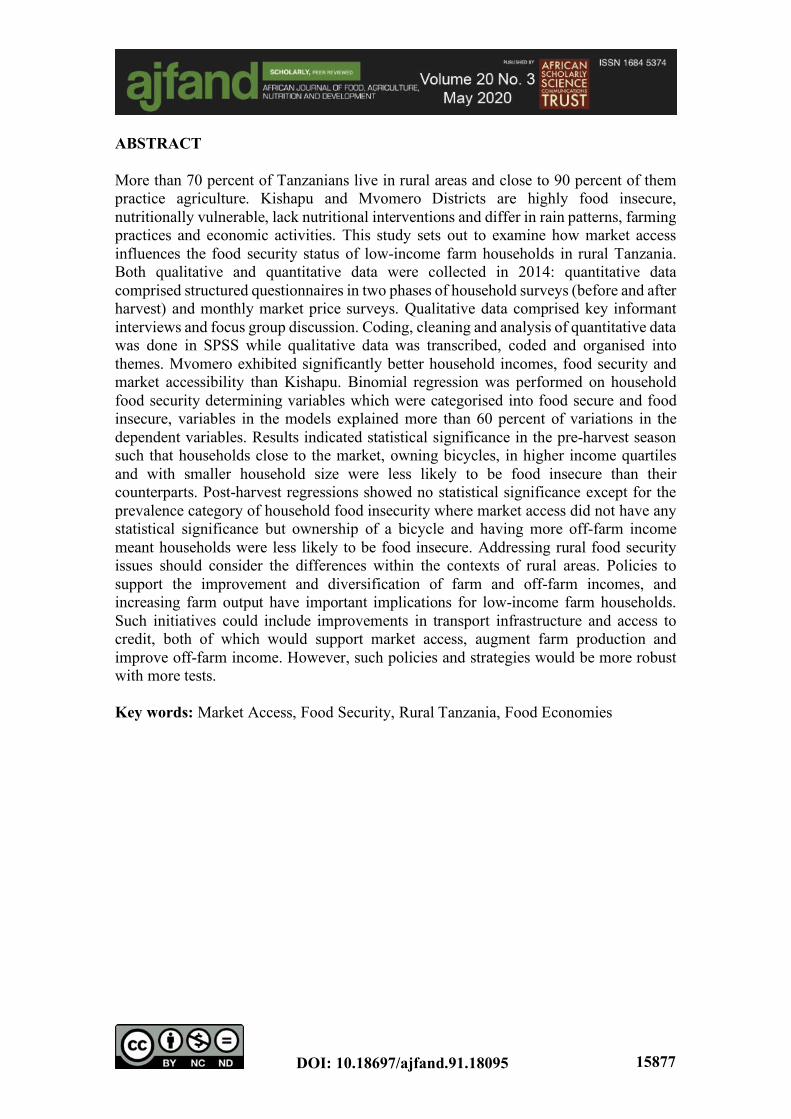
ABSTRACT More than 70 percent of Tanzanians live in rural areas and close to 90 percent of them practice agriculture. Kishapu and Mvomero Districts are highly food insecure, nutritionally vulnerable, lack nutritional interventions and differ in rain patterns, farming practices and economic activities. This study sets out to examine how market access influences the food security status of low-income farm households in rural Tanzania. Both qualitative and quantitative data were collected in 2014: quantitative data comprised structured questionnaires in two phases of household surveys (before and after harvest) and monthly market price surveys. Qualitative data comprised key informant interviews and focus group discussion. Coding, cleaning and analysis of quantitative data was done in SPSS while qualitative data was transcribed, coded and organised into themes. Mvomero exhibited significantly better household incomes, food security and market accessibility than Kishapu. Binomial regression was performed on household food security determining variables which were categorised into food secure and food insecure, variables in the models explained more than 60 percent of variations in the dependent variables. Results indicated statistical significance in the pre-harvest season such that households close to the market, owning bicycles, in higher income quartiles and with smaller household size were less likely to be food insecure than their counterparts. Post-harvest regressions showed no statistical significance except for the prevalence category of household food insecurity where market access did not have any statistical significance but ownership of a bicycle and having more off-farm income meant households were less likely to be food insecure. Addressing rural food security issues should consider the differences within the contexts of rural areas. Policies to support the improvement and diversification of farm and off-farm incomes, and increasing farm output have important implications for low-income farm households. Such initiatives could include improvements in transport infrastructure and access to credit, both of which would support market access, augment farm production and improve off-farm income. However, such policies and strategies would be more robust with more tests. Key words: Market Access, Food Security, Rural Tanzania, Food Economies
DOI: 10.18697/ajfand.91.18095 15878
INTRODUCTION Agriculture plays an important role in the Tanzanian economy, employing about 66 percent of total employed population [1]. About 90 percent of rural Tanzanians are farmers [2] that depend on subsistence agriculture [3] with limited access to both input and output markets [4,5]. The sector has the lowest mean monthly income with very high levels of underemployment [1]. In 2012 the lowest 20 percent of the population earned only 7 percent of national income share [6] and about 44 percent of Tanzanians lived below the international poverty line. More than 9.7 percent of Tanzanians lived in food poverty [7] with majority being in rural areas. The market provides farm households with access to food and inputs and a means to dispose of their farm outputs. The more remote and underdeveloped the market is, the more difficult it is for farm households to access it [8]. Rural markets of Tanzania are difficult to reach and mostly controlled by middlemen [9] who are willing to take risks and costs of travelling rural roads. Market accessibility influences food security [10–12]. Middlemen control prices, leaving farmers with no choice but to accept selling prices [13,14]; otherwise, they would be left with produce that might get destroyed with time. Even though cereals and legumes keep longer than perishable crops such as fruits and vegetables, lack of proper storage facilities leave households vulnerable. During wet planting seasons when there is no more food grain left in storage, prices of farm produce are high and farmers are most in need of money and food, however this is also the time they have little to sell, hence, even though selling price is favourable, it does not contribute much in terms of income as most of their product is depleted. During harvest seasons, prices are lower due to high supply and farmers sell raw produce at low price because they lack means to process their output and sell at better price. The key issue addressed in this paper is how market access and incomes impact on rural households’ food security in Tanzania. Entry barriers associated with location and unequal access to non-farm activities, such as small-scale entrepreneurship, small-scale mining and irrigation agriculture, lead to income inequalities between households [15]. Non-farm income reduced income inequality and improved household welfare indicators [16,17]. Moreover, there is a significant link between income, poverty and incidence of food insecurity [18–20]. Low-income earners were especially food insecure and mostly reside in rural areas [21]. Additionally, seasons play a significant role in determining food security of agriculture-dependent households and towards end of lean seasons, diets are more diverse since more vegetables are available and people have started to consume the green harvests [22]. Knowledge about these issues is important because rural households depend on agriculture for their livelihoods [2,7], have low incomes and little market access. Therefore, by analysing market access, incomes and food security it is possible to inform and assist policymakers to identify key areas within rural markets that need to be addressed to ensure better operation of rural markets and better financial and nutritional outcomes. Moreover, findings of this study will add to the body of literature on how households achieve results in their daily practices of production, distribution and consumption of food for nutritional benefits.
DOI: 10.18697/ajfand.91.18095 15879
Malnutrition in Tanzania is prominent among majority of rural populace. If this problem is not solved, rural households will continue with practices that are not beneficial to them nutritionally and financially [23]. There is more to be learned about rural food economy and linkages to food security and it is important to distinguish among different rural economies because they vary in many aspects. The main focus of this paper is to examine linkages between market access, household income and household food security in rural Tanzania with reference to two economically distinct districts. Kishapu District is more distant from roads and is more dependent on farm income; also, cotton is the main cash crop. Mvomero District on has close proximity to roads, with more off-farm activities such as small-scale entrepreneurship; cash crops are maize and rice. Specifically, the objectives are to analyse income distribution within different farming systems in the study areas; to identify main channels for buying and selling food and challenges faced; and to analyse their linkage with household food security during pre- and post-harvest seasons. MATERIALS AND METHODS Study Area and Sample The research was conducted in two economically-distinct districts in rural Tanzania: Kishapu District in Shinyanga Region with about 48,258 (99.4%) agricultural households [24] and Mvomero District in Morogoro Region, with about 56,520 (98%) agricultural households [25] selected based on high criteria below. Morogoro and Shinyanga were among regions with highest nutritional vulnerability having above national average (42%) stunting [26]. Levels of chronic under-nutrition in Morogoro and Shinyanga were 44.4% and 43.3%, respectively [27]. In 2012, Shinyanga had high food deficit; most of its districts were vulnerable and Morogoro was food self-sufficient with two vulnerable districts, Morogoro Rural and Mvomero [27]. A multi-stage clustered sample survey was done in two purposely selected districts of Tanzania, Kishapu and Movomero because of their food insecurity, nutritional vulnerability, lack of nutrition interventions, and differences in rainfall patterns, farming practices and economic activities (Stage 1). Within each district, one ward was randomly selected (stage 2) from which two villages were also randomly selected (stage 3), namely Lubaga and Mwakipoya villages from Kishapu and Makuyu and Milama villages from Mvomero. Ethical approval was sought from St Augustine University of Tanzania and University College Dublin and permission to conduct research from relevant administrative offices in the respective regions and districts. Sample size was calculated
using the formula ; where Z = the abscissa of the normal curve that cuts off an area α at the tails (1 – α equals the desired confidence level, example, 95%), p = the estimated proportion of an attribute that is present in the population (levels of chronic undernutrition for this case; 44.4% for Kishapu and 43.3% for Mvomero), q = 1-p and e = the desired level of precision (=0.06 i.e. 94% precision). The sample for Kishapu was 263 and for Mvomero was 262 making a total of 525 households. A list of all households
2
0 2
Z pqne
=
DOI: 10.18697/ajfand.91.18095 15880
and members was collected from respective village officials and after random sampling; pre-harvest data collection comprised 554 households (277 from each district). However, dropout rate of 8.8% in post-harvest survey enabled data collection from a total of 506 households, of which 255 households were in Kishapu and 251 households in Mvomero. Before beginning interviews, respondents were briefed of the study and verbal consent was sought. Aim and Research questions The aim of this study was to examine linkages that exist between market access, household income and household food security in rural Tanzania and specific objectives were: to analyse income distribution within different farming systems in study areas; to identify the main channels used by households for buying and selling food and challenges they faced; and to analyse the linkage between incomes, seasons and market access with household food security. The following research questions were answered:
i. How are incomes distributed within farming systems existing in Kishapu and Mvomero?
ii. What channels do households use to access markets to buy food or sell their produce?
iii. Do seasons influence food security status of households? iv. Do household incomes affect food security status? v. Do households’ market access affect their food security status?
Data Collection The data was collected as part of Agridiet project, which aimed at understanding links between agriculture and nutrition in Ethiopia and Tanzania. Data collection comprised both qualitative and quantitative data in the year 2014. Qualitative data comprised focus group discussions and key informant interviews while quantitative data was collected by monthly market price surveys and structured questionnaires in two phases of a household survey. Data Analysis Coding, cleaning and analysis of quantitative data was done using SPSS while qualitative data was transcribed, coded and organised into themes. Specifically, for household incomes, farming systems, food security and market access, the approaches discussed below were used. Household Income Determination Income and economic activities data from household surveys through respondents’ recollections provided information on annual household farm and non-farm income in the year prior to the interview (2013). A distribution of net annual household incomes was run in SPSS generating four equal cut-off points (Income Quartiles) of sampled households, the following income ranges were obtained: EUR 0 – 330.35 for poorest households; EUR 330.35 – 665.57 for lower-middle income earners; EUR 665.57 – 1397.46 for upper-middle income earners and the wealthiest received more than EUR 1397.46.
DOI: 10.18697/ajfand.91.18095 15881
Farming Systems Determination Farming systems were determined based on types of crops cultivated, amount of land devoted to a certain crop – cash/food, marketing of crops and number of livestock units owned by households. If a household cultivated one crop in 70 percent or more of all its land, it was considered dependent on that particular crop. A Household Commercialisation Index (HCI) calculated the ratio of output that was sold and ranged from 0 to 1. A crop with HCI greater than 0.5 was considered a cash crop and below 0.5 it was considered a food crop with 1 indicating a completely commercialised/cash crop [28]. For each household, an average HCI was calculated over the range of crops cultivated determined by the quantity of crops sold against the amount retained for household consumption. Tropical Livestock Units (TLU) were used to decide whether households were livestock oriented or not. One TLU is equivalent to one mature cow weighing 250kg in sub-Saharan Africa [29]. If a household allocated 70 percent or more of its total cultivated land in 2013 to one crop and that crop had HCI of 0.5 or less, it was considered as practicing Single Food Crop. A household was categorised as practicing Multiple Food Crops if more than 70 percent of its farmland was devoted to more than one food crop and had an HCI of less than 0.5 for each crop. A household qualified as practicing Cash Crop if more than 70 percent of total cultivated land was allocated to crops with HCI of more than 0.5. Mixed Crop-Livestock contained households that practiced crop cultivation and possessed more than 7.3 TLUs (7.3 TLUs is the average number of livestock units in the study area generated from collected household farming data). Market Access Determination In this study, market access is measured by a proxy of the distance in minutes travelled by respondents to or from the common market they use to buy and/sell items. Other measures of market access. such as Rural Access Index (RAI), which estimates the proportion of rural population who live within 2 km of an all-season road, could not be adopted in this study because current indices are not specific to the villages data was collected and current data does not provide enough information to formulate a Rural Access Index or an alternative index. From the data, average distance of surveyed households to common output market was 61 minutes in Kishapu and 26 minutes in Mvomero. Binomial logistic regressions were run between Household Dietary Diversity Scores (HDDS), Household Food Insecurity (Access) Scale and Prevalence (HFIAS and HFIAP, respectively) as dependent variables and predictor variables were log of market distance in minutes, off-farm and farm income per capita, ownership of bicycle and mobile phone as predictor variables which were statistically significant (p<0.05) in explaining the dependent variable. Other variables such as level of education, sex of household head, age, household size, income quartile and farming systems were not statistically significant in explaining the dependent variables. Household Food Security Status Food security was measured separately in two ways, first using Household Food Insecurity (Access) Scale (HFIAS) and Household Dietary Diversity Scores (HDDS). The Household Food Insecurity (Access) Scale (HFIAS) measures the access component of food security at household level [30]. A set of nine questions measured feelings of
DOI: 10.18697/ajfand.91.18095 15882
anxiety, feelings of insufficiency of quality food and feelings of insufficiency of food intake in the household within 30 days prior interview. The scores range from 0 (most secure) to 27 (most insecure). If respondents answered affirmatively to a higher number of questions, it indicated the household had a more severe level of food insecurity (access). To measure diversity of diets in a household, HDDS was employed [31]. Twelve food groups were used and the lower the HDDS, the less the dietary diversity. Statistical tests All statistical tests were conducted at 5 percent significance level (confidence 95 percent). To investigate whether seasons influence food security status of households, a paired sample t-test was performed on Household Dietary Diversity Score (HDDS), Household Food Insecurity (Access) Scale (HFIAS) and Household Food Insecurity (Access) Prevalence (HFIAP) grouped by seasons. To test whether household food security status does not depend on household income, an analysis of variance was performed on Household Food Insecurity (Access) Scale Score and Household Food Insecurity (Access) Prevalence variables to determine if there was a statistically significant difference between means of these variables according to income quartiles and districts. Moreover, to test whether market access has any influence on food security status, the market access variable above was regressed against HFIAS, HDDS and HFIAP variables in binomial regressions where dependent variables were transformed into binary dummy variables indicating food secure and food insecure. RESULTS AND DISCUSSION Household Profile There were observable differences in household characteristics between Kishapu and Mvomero as outlined in Table 1, where on average Kishapu households were larger and their heads older than those in Mvomero. Moreover, in both districts, more than 50 percent of household members were dependents and the percentage of adults earning off-farm incomes was low. Household Economics Activities, Incomes and Food Security Household Economic Activities In both districts, farming comprised more than 95 percent of all economic activity and earned more than 60 percent of total annual income with little non-farm activity. However, non-farm economic activities contributed more to household income in Mvomero than in Kishapu. In Kishapu more than 45 percent of sampled households did not have any other source of income apart from agriculture and earned more than 80 percent of household income from it; while in Mvomero, more than 45 percent engaged in one extra economic activity other than farming which contributed only 44 percent of all household income.
Table 2 shows economic activities practiced in the areas.
DOI: 10.18697/ajfand.91.18095 15883
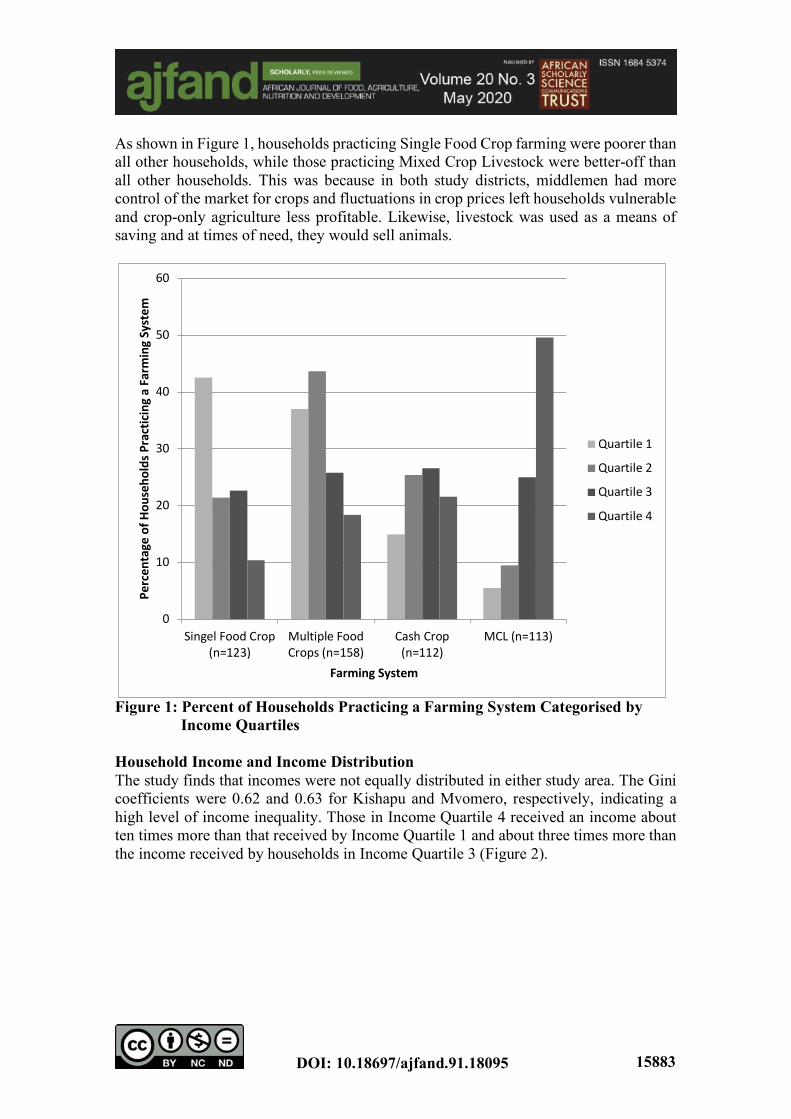
As shown in Figure 1, households practicing Single Food Crop farming were poorer than all other households, while those practicing Mixed Crop Livestock were better-off than all other households. This was because in both study districts, middlemen had more control of the market for crops and fluctuations in crop prices left households vulnerable and crop-only agriculture less profitable. Likewise, livestock was used as a means of saving and at times of need, they would sell animals.
Figure 1: Percent of Households Practicing a Farming System Categorised by
Income Quartiles Household Income and Income Distribution The study finds that incomes were not equally distributed in either study area. The Gini coefficients were 0.62 and 0.63 for Kishapu and Mvomero, respectively, indicating a high level of income inequality. Those in Income Quartile 4 received an income about ten times more than that received by Income Quartile 1 and about three times more than the income received by households in Income Quartile 3 (Figure 2).
0
10
20
30
40
50
60
Singel Food Crop(n=123)
Multiple FoodCrops (n=158)
Cash Crop(n=112)
MCL (n=113)
Perc
enta
ge o
f Hou
seho
lds P
ract
icing
a Fa
rmin
g Sys
tem
Farming System
Quartile 1
Quartile 2
Quartile 3
Quartile 4
DOI: 10.18697/ajfand.91.18095 15884
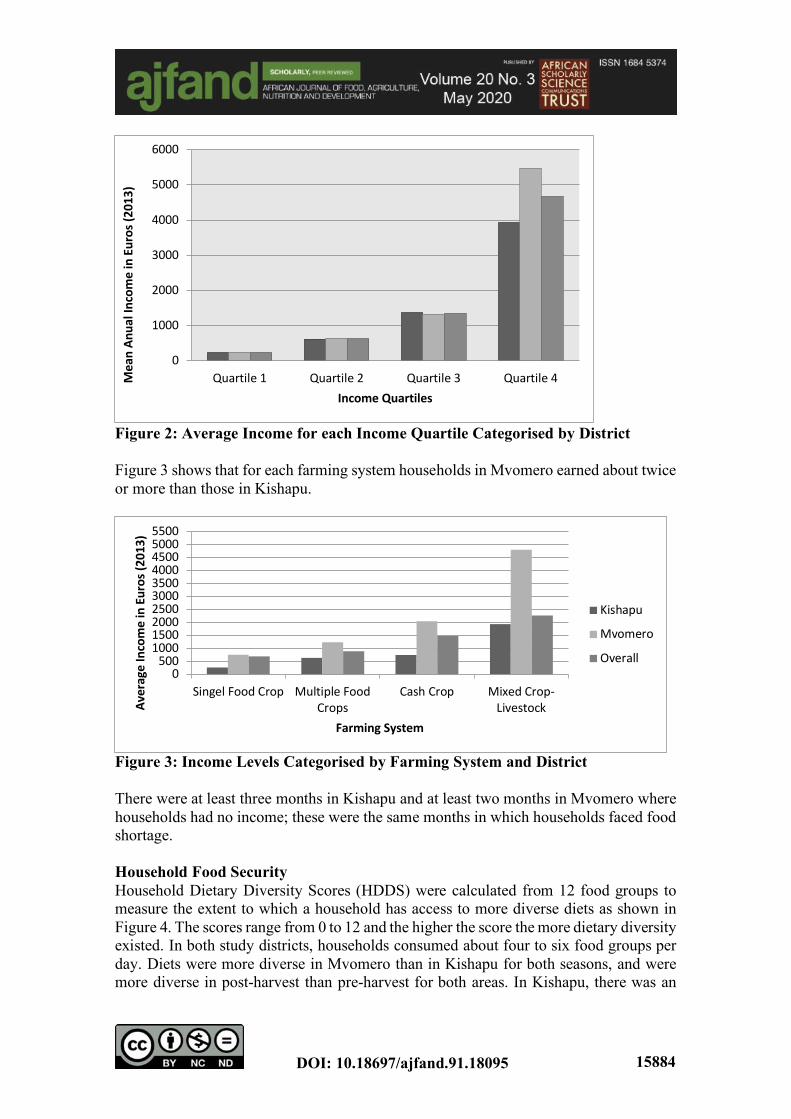
Figure 2: Average Income for each Income Quartile Categorised by District Figure 3 shows that for each farming system households in Mvomero earned about twice or more than those in Kishapu.
Figure 3: Income Levels Categorised by Farming System and District There were at least three months in Kishapu and at least two months in Mvomero where households had no income; these were the same months in which households faced food shortage. Household Food Security Household Dietary Diversity Scores (HDDS) were calculated from 12 food groups to measure the extent to which a household has access to more diverse diets as shown in Figure 4. The scores range from 0 to 12 and the higher the score the more dietary diversity existed. In both study districts, households consumed about four to six food groups per day. Diets were more diverse in Mvomero than in Kishapu for both seasons, and were more diverse in post-harvest than pre-harvest for both areas. In Kishapu, there was an
0
1000
2000
3000
4000
5000
6000
Quartile 1 Quartile 2 Quartile 3 Quartile 4Mea
n An
ual I
ncom
e in
Eur
os (2
013)
Income Quartiles
0500
1000150020002500300035004000450050005500
Singel Food Crop Multiple FoodCrops
Cash Crop Mixed Crop-LivestockAv
erag
e In
com
e in
Eur
os (2
013)
Farming System
Kishapu
Mvomero
Overall
DOI: 10.18697/ajfand.91.18095 15885
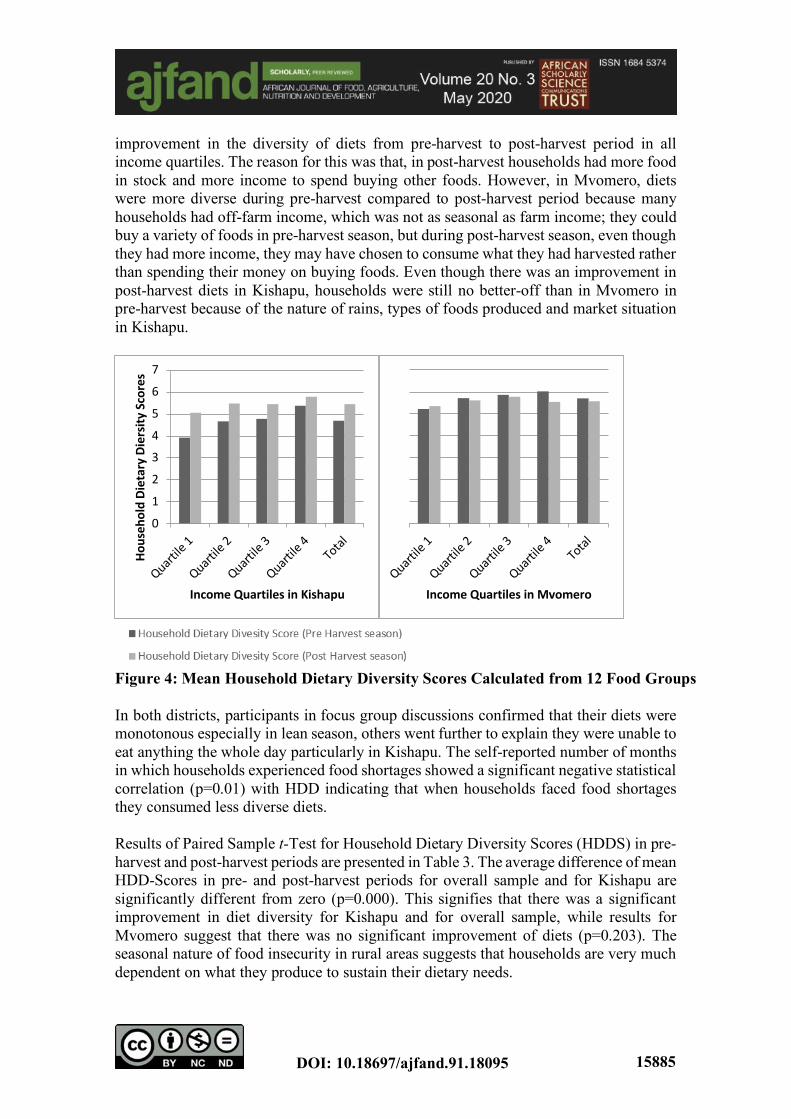
improvement in the diversity of diets from pre-harvest to post-harvest period in all income quartiles. The reason for this was that, in post-harvest households had more food in stock and more income to spend buying other foods. However, in Mvomero, diets were more diverse during pre-harvest compared to post-harvest period because many households had off-farm income, which was not as seasonal as farm income; they could buy a variety of foods in pre-harvest season, but during post-harvest season, even though they had more income, they may have chosen to consume what they had harvested rather than spending their money on buying foods. Even though there was an improvement in post-harvest diets in Kishapu, households were still no better-off than in Mvomero in pre-harvest because of the nature of rains, types of foods produced and market situation in Kishapu.
Figure 4: Mean Household Dietary Diversity Scores Calculated from 12 Food Groups In both districts, participants in focus group discussions confirmed that their diets were monotonous especially in lean season, others went further to explain they were unable to eat anything the whole day particularly in Kishapu. The self-reported number of months in which households experienced food shortages showed a significant negative statistical correlation (p=0.01) with HDD indicating that when households faced food shortages they consumed less diverse diets. Results of Paired Sample t-Test for Household Dietary Diversity Scores (HDDS) in pre-harvest and post-harvest periods are presented in Table 3. The average difference of mean HDD-Scores in pre- and post-harvest periods for overall sample and for Kishapu are significantly different from zero (p=0.000). This signifies that there was a significant improvement in diet diversity for Kishapu and for overall sample, while results for Mvomero suggest that there was no significant improvement of diets (p=0.203). The seasonal nature of food insecurity in rural areas suggests that households are very much dependent on what they produce to sustain their dietary needs.
01234567
Quartile
1
Quartile
2
Quartile
3
Quartile
4To
tal
Hous
ehol
d Di
etar
y Die
rsity
Scor
es
Income Quartiles in KishapuQuart
ile 1
Quartile
2
Quartile
3
Quartile
4To
tal
Income Quartiles in Mvomero
DOI: 10.18697/ajfand.91.18095 15886
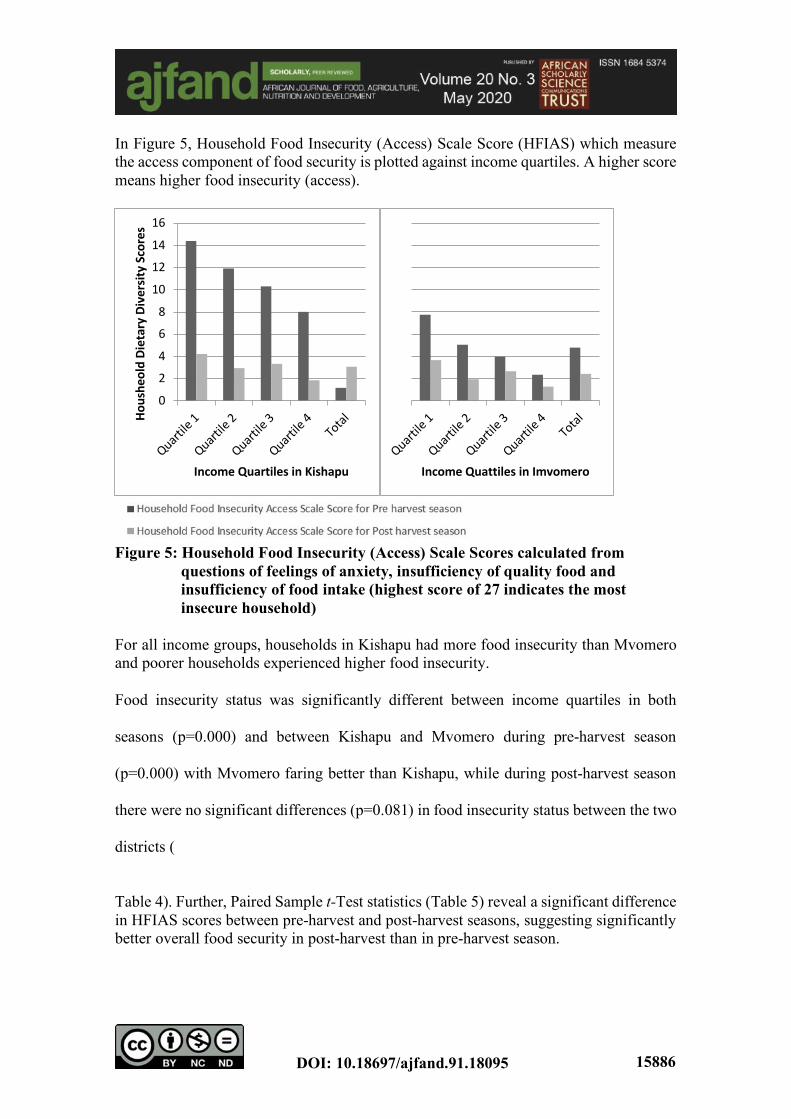
In Figure 5, Household Food Insecurity (Access) Scale Score (HFIAS) which measure the access component of food security is plotted against income quartiles. A higher score means higher food insecurity (access).
Figure 5: Household Food Insecurity (Access) Scale Scores calculated from
questions of feelings of anxiety, insufficiency of quality food and insufficiency of food intake (highest score of 27 indicates the most insecure household)
For all income groups, households in Kishapu had more food insecurity than Mvomero and poorer households experienced higher food insecurity. Food insecurity status was significantly different between income quartiles in both
seasons (p=0.000) and between Kishapu and Mvomero during pre-harvest season
(p=0.000) with Mvomero faring better than Kishapu, while during post-harvest season
there were no significant differences (p=0.081) in food insecurity status between the two
districts (
Table 4). Further, Paired Sample t-Test statistics (Table 5) reveal a significant difference in HFIAS scores between pre-harvest and post-harvest seasons, suggesting significantly better overall food security in post-harvest than in pre-harvest season.
0
24
68
10
1214
16
Quartile
1
Quartile
2
Quartile
3
Quartile
4To
talHous
heol
d Di
etar
y Div
ersit
y Sc
ores
Income Quartiles in KishapuQuart
ile 1
Quartile
2
Quartile
3
Quartile
4To
tal
Income Quattiles in Imvomero
DOI: 10.18697/ajfand.91.18095 15887
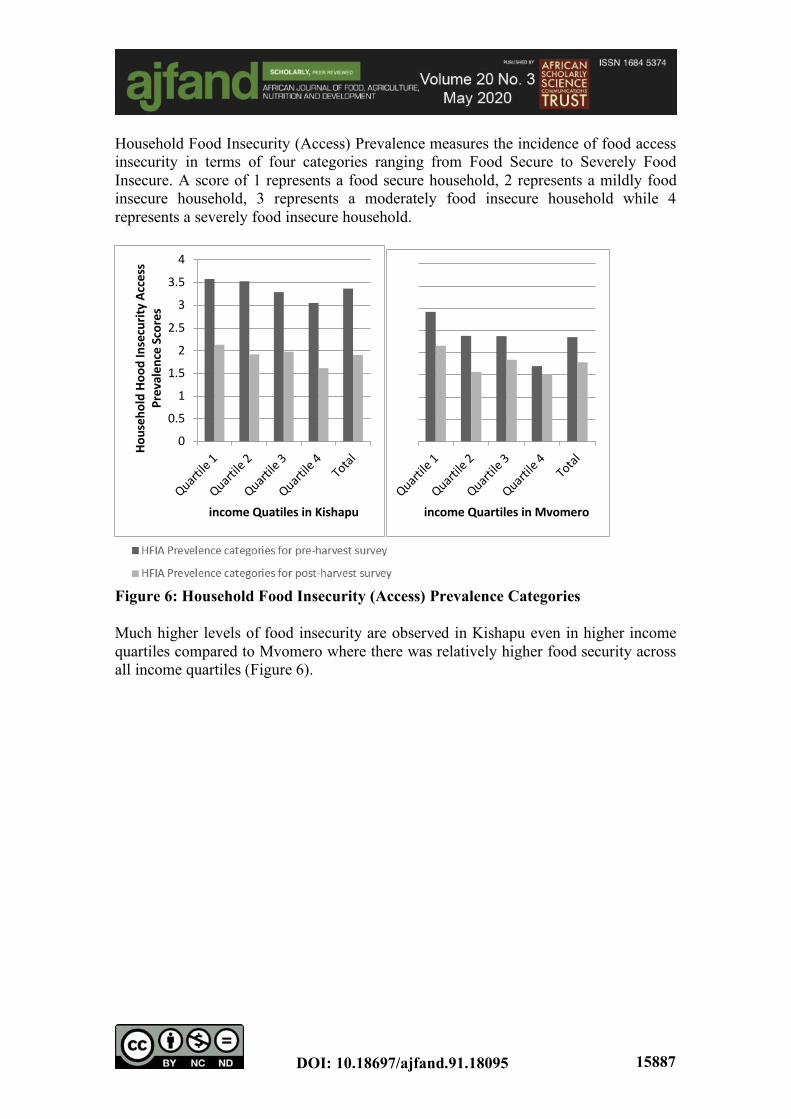
Household Food Insecurity (Access) Prevalence measures the incidence of food access insecurity in terms of four categories ranging from Food Secure to Severely Food Insecure. A score of 1 represents a food secure household, 2 represents a mildly food insecure household, 3 represents a moderately food insecure household while 4 represents a severely food insecure household.
Figure 6: Household Food Insecurity (Access) Prevalence Categories Much higher levels of food insecurity are observed in Kishapu even in higher income quartiles compared to Mvomero where there was relatively higher food security across all income quartiles (Figure 6).
0
0.5
1
1.5
2
2.5
3
3.5
4
Quartile
1
Quartile
2
Quartile
3
Quartile
4To
tal
Hous
ehol
d Ho
od In
secu
rity A
cces
s Pr
eval
ence
Scor
es
income Quatiles in KishapuQuart
ile 1
Quartile
2
Quartile
3
Quartile
4To
tal
income Quartiles in Mvomero
DOI: 10.18697/ajfand.91.18095 15888
Table 6 shows that food insecurity was more prevalent for lower income quartiles than higher income quartiles in both seasons. Thus, from the research question of whether household incomes affect household food security status we can conclude that household food security is affected by household income. The results of Paired Sample t-Test for HFIAP from
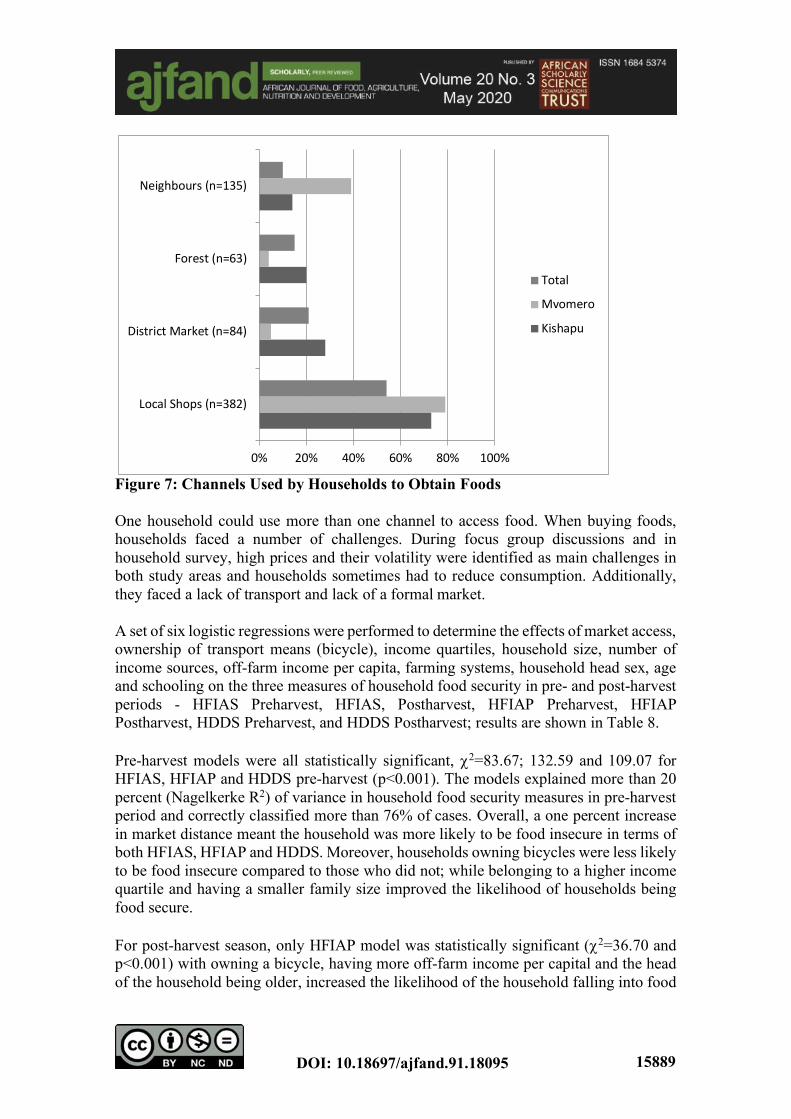
Table 7 show a significant difference in food access insecurity between the two seasons, meaning that household food insecurity (access) was significantly more prevalent during pre-harvest season than post-harvest season. Also, food insecurity (access) was significantly more prevalent in Kishapu than Mvomero during pre-harvest season, while during post-harvest season differences in food insecurity (access) prevalence were not significant between the two districts. Market access and Food Security Selling Channels and Challenges In both districts, farm output was sold to middlemen; selling to local village market and neighbouring village market was more common in Kishapu because its roads were bad, and households sold small portions they could transport to the weekly market in the district centre. In Kishapu, cotton farmers sold to cooperative society via contract. They also sold to neighbouring households, but this was not common because most households grew similar crops as their neighbour. The most common challenge in both districts was low prices for all kinds of farm produce, which they would sell anyway for they had no way of dealing with this problem. Some would either bargain or hold their produce to sell later. Poor weighing scale calibration was a common problem for cotton sellers in Kishapu. Farmers complained of having little power in influencing agents to properly calibrate weighing scales. They also lacked means to transport their farm produce to markets and there was an absence of a formal market. During focus group discussions, farmers pointed out local government levies and regulations prohibited them from accessing the market when they wished to sell. Buying Channels and Challenges Households were highly dependent on the market to access food. Out of all food consumed by households, bought food comprised 73 percent in Kishapu and 90 percent in Mvomero. This dependence on the market made them vulnerable as they did not have enough reliable income or a daily formal market where they could easily buy what they needed. They obtained food by buying from neighbours or picking forest foods (Figure 7).
DOI: 10.18697/ajfand.91.18095 15889
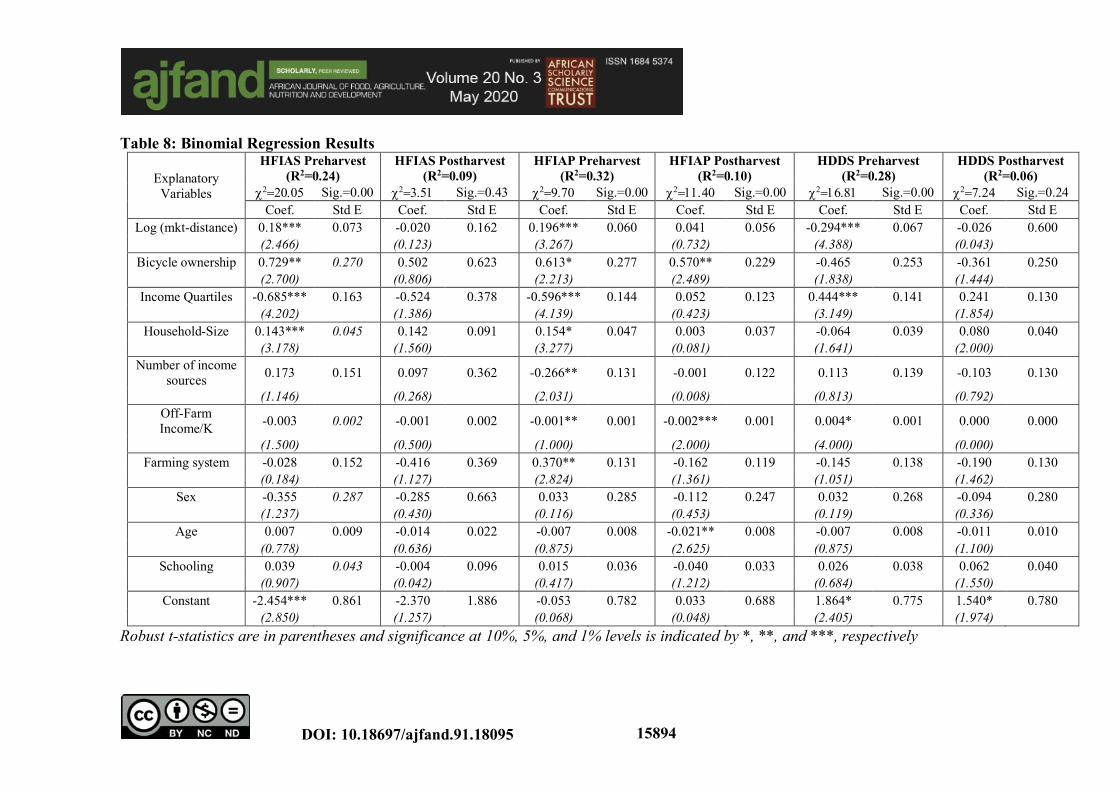
Figure 7: Channels Used by Households to Obtain Foods One household could use more than one channel to access food. When buying foods, households faced a number of challenges. During focus group discussions and in household survey, high prices and their volatility were identified as main challenges in both study areas and households sometimes had to reduce consumption. Additionally, they faced a lack of transport and lack of a formal market. A set of six logistic regressions were performed to determine the effects of market access, ownership of transport means (bicycle), income quartiles, household size, number of income sources, off-farm income per capita, farming systems, household head sex, age and schooling on the three measures of household food security in pre- and post-harvest periods - HFIAS Preharvest, HFIAS, Postharvest, HFIAP Preharvest, HFIAP Postharvest, HDDS Preharvest, and HDDS Postharvest; results are shown in Table 8. Pre-harvest models were all statistically significant, c2=83.67; 132.59 and 109.07 for HFIAS, HFIAP and HDDS pre-harvest (p<0.001). The models explained more than 20 percent (Nagelkerke R2) of variance in household food security measures in pre-harvest period and correctly classified more than 76% of cases. Overall, a one percent increase in market distance meant the household was more likely to be food insecure in terms of both HFIAS, HFIAP and HDDS. Moreover, households owning bicycles were less likely to be food insecure compared to those who did not; while belonging to a higher income quartile and having a smaller family size improved the likelihood of households being food secure. For post-harvest season, only HFIAP model was statistically significant (c2=36.70 and p<0.001) with owning a bicycle, having more off-farm income per capital and the head of the household being older, increased the likelihood of the household falling into food
0% 20% 40% 60% 80% 100%
Local Shops (n=382)
District Market (n=84)
Forest (n=63)
Neighbours (n=135)
Total
Mvomero
Kishapu
DOI: 10.18697/ajfand.91.18095 15890
insecurity access prevalence (HFIAP). There was no statistically significant result for HFIAS and HDDS post-harvest that also had low c2 values. All models explained less than 10 percent of variance in household food security measures in post-harvest and correctly classified more than 69% of cases. Lack of market access ultimately led to lack of income and food, which contributed to the food insecurity observed in the study areas. It was also observed that on average, more than 83 percent of households in Mvomero are close (45 minutes or less) to the market while in Kishapu only 55 percent of households are close to the market, leading to lower dietary diversity and higher food access insecurity in Kishapu. CONCLUSION This study set out to answer five research questions to determine whether incomes, seasons and market access influence household food security. Findings from this study reveal high incomes inequality between farming systems and between districts due to access to off-farm sources of income. Rural households are mostly reliant on farm income, and diversification on-farm and off-farm was minimal. Because of very low incomes and a complete lack of income for some periods of the year, low-income households faced food insecurity (access) threats. Furthermore, seasons explained differences in household food insecurity (access) especially within districts; post-harvest was better for both districts. Households with more incomes had significantly less food insecurity. On the other hand, market access is minimal especially in Kishapu and households located far from the common market were more likely to be food insecure. The rural economy should have diverse and accessible economic activities. Policies and strategies to support improvement and diversification of farm and off-farm incomes and to increasing farm output have important implications for low-income farm households; they should also focus on market access for rural poor; however, such policies and strategies would be more robust with more tests. Such initiatives could include improvements in transport infrastructure and access to credit, supporting market access, augment farm production and improve off-farm income. ACKNOWLEDGEMENTS This work would not have been completed without the support of the Irish Aid, which through the Higher Education Authority under the Program for Strategic Cooperation funded the AgriDiet Project. The AgriDiet team members worked tirelessly in every stage of the research to ensure its successful completion by offering their time, comments and support.
DOI: 10.18697/ajfand.91.18095 15891
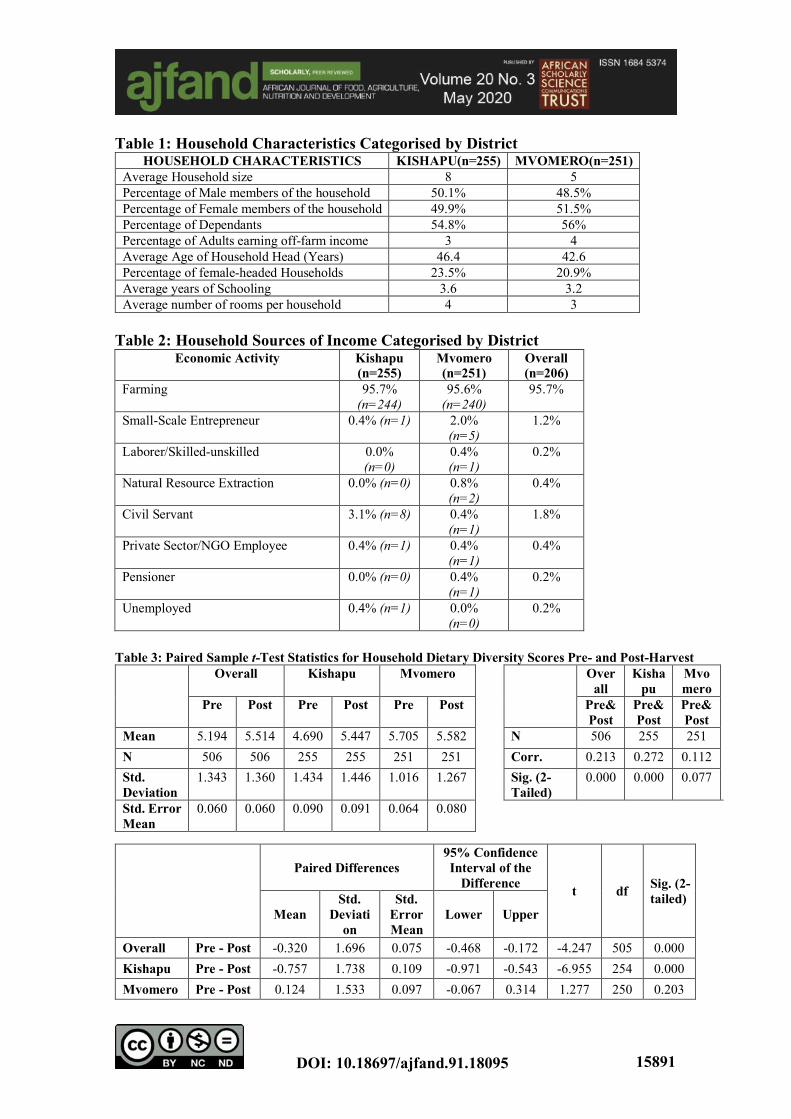
Table 1: Household Characteristics Categorised by District HOUSEHOLD CHARACTERISTICS KISHAPU(n=255) MVOMERO(n=251)
Average Household size 8 5 Percentage of Male members of the household 50.1% 48.5% Percentage of Female members of the household 49.9% 51.5% Percentage of Dependants 54.8% 56% Percentage of Adults earning off-farm income 3 4 Average Age of Household Head (Years) 46.4 42.6 Percentage of female-headed Households 23.5% 20.9% Average years of Schooling 3.6 3.2 Average number of rooms per household 4 3
Table 2: Household Sources of Income Categorised by District
Economic Activity Kishapu (n=255)
Mvomero (n=251)
Overall (n=206)
Farming 95.7% (n=244)
95.6% (n=240)
95.7%
Small-Scale Entrepreneur 0.4% (n=1) 2.0% (n=5)
1.2%
Laborer/Skilled-unskilled 0.0% (n=0)
0.4% (n=1)
0.2%
Natural Resource Extraction 0.0% (n=0) 0.8% (n=2)
0.4%
Civil Servant 3.1% (n=8) 0.4% (n=1)
1.8%
Private Sector/NGO Employee 0.4% (n=1) 0.4% (n=1)
0.4%
Pensioner 0.0% (n=0) 0.4% (n=1)
0.2%
Unemployed 0.4% (n=1) 0.0% (n=0)
0.2%
Table 3: Paired Sample t-Test Statistics for Household Dietary Diversity Scores Pre- and Post-Harvest
Overall Kishapu Mvomero Overall
Kishapu
Mvomero
Pre Post Pre Post Pre Post Pre& Post
Pre& Post
Pre& Post
Mean 5.194 5.514 4.690 5.447 5.705 5.582 N 506 255 251 N 506 506 255 255 251 251 Corr. 0.213 0.272 0.112 Std. Deviation
1.343 1.360 1.434 1.446 1.016 1.267 Sig. (2-Tailed)
0.000 0.000 0.077
Std. Error Mean
0.060 0.060 0.090 0.091 0.064 0.080
Paired Differences 95% Confidence Interval of the
Difference t df Sig. (2-tailed)
Mean Std.
Deviation
Std. Error Mean
Lower Upper
Overall Pre - Post -0.320 1.696 0.075 -0.468 -0.172 -4.247 505 0.000 Kishapu Pre - Post -0.757 1.738 0.109 -0.971 -0.543 -6.955 254 0.000 Mvomero Pre - Post 0.124 1.533 0.097 -0.067 0.314 1.277 250 0.203
DOI: 10.18697/ajfand.91.18095 15892
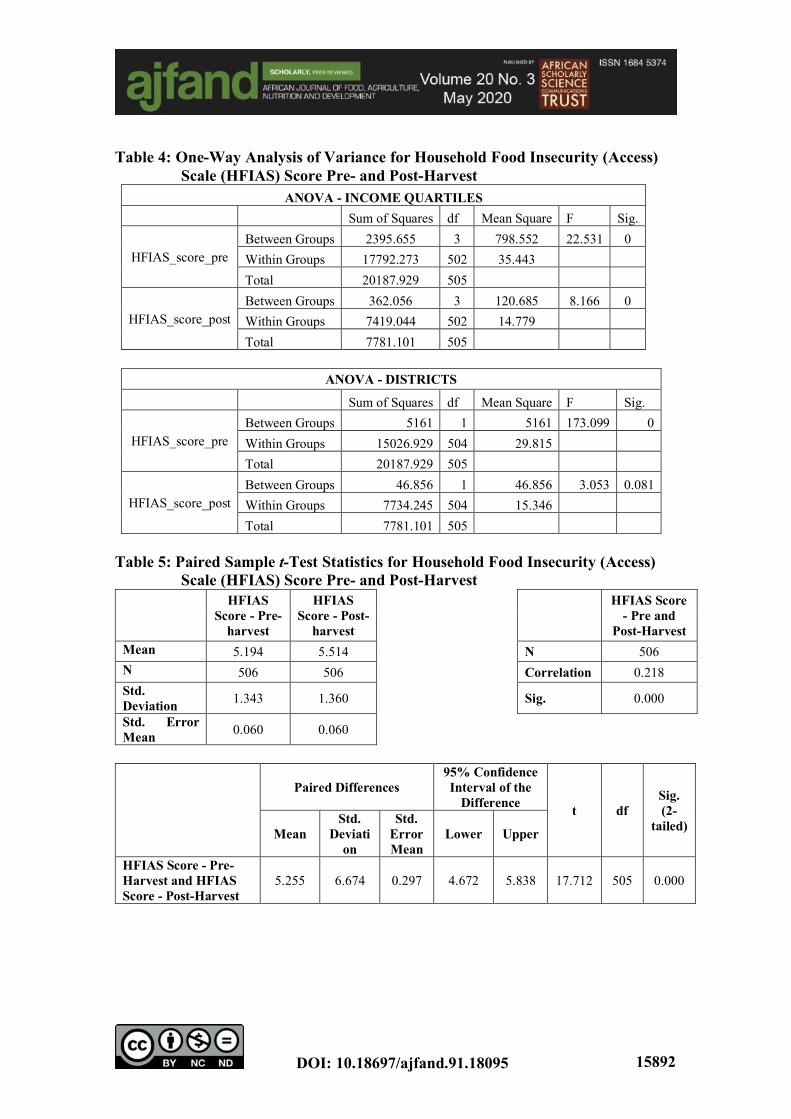
Table 4: One-Way Analysis of Variance for Household Food Insecurity (Access)
Scale (HFIAS) Score Pre- and Post-Harvest ANOVA - INCOME QUARTILES
Sum of Squares df Mean Square F Sig.
HFIAS_score_pre Between Groups 2395.655 3 798.552 22.531 0 Within Groups 17792.273 502 35.443 Total 20187.929 505
HFIAS_score_post Between Groups 362.056 3 120.685 8.166 0 Within Groups 7419.044 502 14.779 Total 7781.101 505
ANOVA - DISTRICTS
Sum of Squares df Mean Square F Sig.
HFIAS_score_pre Between Groups 5161 1 5161 173.099 0 Within Groups 15026.929 504 29.815 Total 20187.929 505
HFIAS_score_post Between Groups 46.856 1 46.856 3.053 0.081 Within Groups 7734.245 504 15.346 Total 7781.101 505
Table 5: Paired Sample t-Test Statistics for Household Food Insecurity (Access)
Scale (HFIAS) Score Pre- and Post-Harvest
HFIAS
Score - Pre-harvest
HFIAS Score - Post-
harvest
HFIAS Score - Pre and
Post-Harvest
Mean 5.194 5.514 N 506 N 506 506 Correlation 0.218 Std. Deviation 1.343 1.360 Sig. 0.000
Std. Error Mean 0.060 0.060
Paired Differences 95% Confidence Interval of the
Difference t df Sig. (2-
tailed) Mean Std.
Deviation
Std. Error Mean
Lower Upper
HFIAS Score - Pre-Harvest and HFIAS Score - Post-Harvest
5.255 6.674 0.297 4.672 5.838 17.712 505 0.000
DOI: 10.18697/ajfand.91.18095 15893
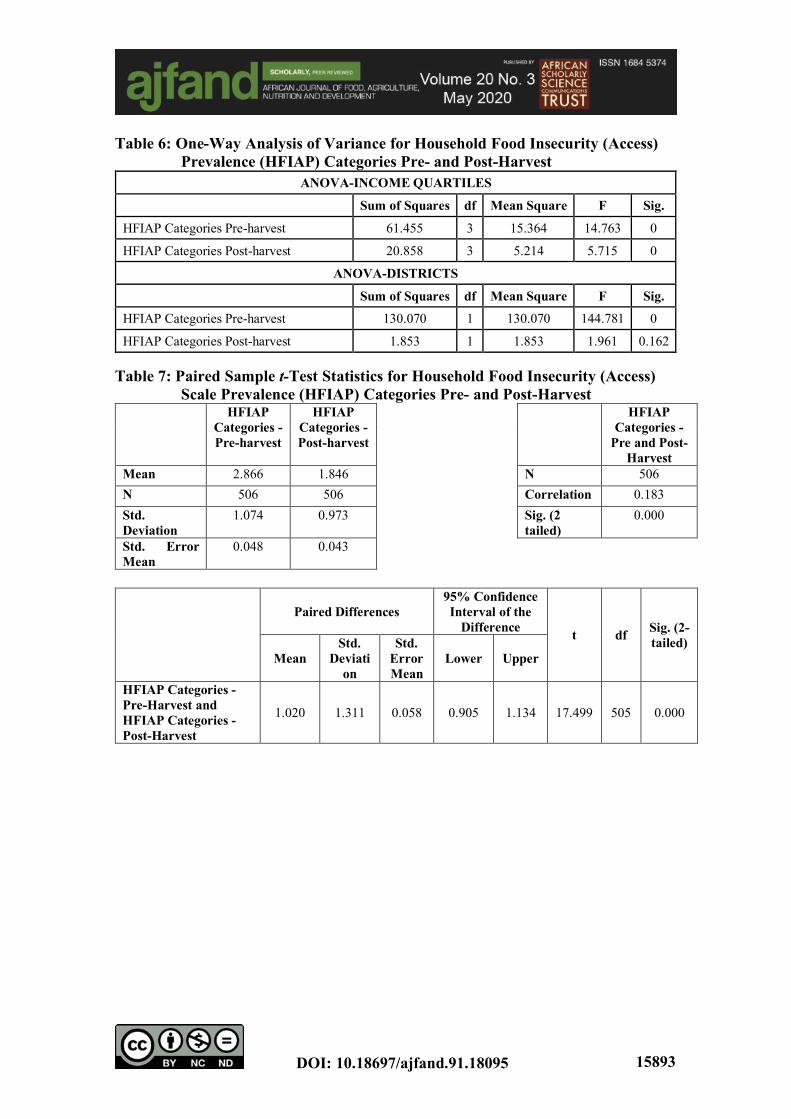
Table 6: One-Way Analysis of Variance for Household Food Insecurity (Access) Prevalence (HFIAP) Categories Pre- and Post-Harvest
ANOVA-INCOME QUARTILES
Sum of Squares df Mean Square F Sig.
HFIAP Categories Pre-harvest 61.455 3 15.364 14.763 0
HFIAP Categories Post-harvest 20.858 3 5.214 5.715 0
ANOVA-DISTRICTS
Sum of Squares df Mean Square F Sig.
HFIAP Categories Pre-harvest 130.070 1 130.070 144.781 0
HFIAP Categories Post-harvest 1.853 1 1.853 1.961 0.162 Table 7: Paired Sample t-Test Statistics for Household Food Insecurity (Access)
Scale Prevalence (HFIAP) Categories Pre- and Post-Harvest HFIAP
Categories - Pre-harvest
HFIAP Categories - Post-harvest
HFIAP Categories -
Pre and Post-Harvest
Mean 2.866 1.846 N 506 N 506 506 Correlation 0.183 Std. Deviation
1.074 0.973 Sig. (2 tailed)
0.000
Std. Error Mean
0.048 0.043
Paired Differences 95% Confidence Interval of the
Difference t df Sig. (2-tailed)
Mean Std.
Deviation
Std. Error Mean
Lower Upper
HFIAP Categories - Pre-Harvest and HFIAP Categories - Post-Harvest
1.020 1.311 0.058 0.905 1.134 17.499 505 0.000
DOI: 10.18697/ajfand.91.18095 15894
Table 8: Binomial Regression Results
Explanatory Variables
HFIAS Preharvest (R2=0.24)
HFIAS Postharvest (R2=0.09)
HFIAP Preharvest (R2=0.32)
HFIAP Postharvest (R2=0.10)
HDDS Preharvest (R2=0.28)
HDDS Postharvest (R2=0.06)
c2=20.05 Sig.=0.00 c2=3.51 Sig.=0.43 c2=9.70 Sig.=0.00 c2=11.40 Sig.=0.00 c2=16.81 Sig.=0.00 c2=7.24 Sig.=0.24 Coef. Std E Coef. Std E Coef. Std E Coef. Std E Coef. Std E Coef. Std E
Log (mkt-distance) 0.18*** 0.073 -0.020 0.162 0.196*** 0.060 0.041 0.056 -0.294*** 0.067 -0.026 0.600 (2.466) (0.123) (3.267) (0.732) (4.388) (0.043)
Bicycle ownership 0.729** 0.270 0.502 0.623 0.613* 0.277 0.570** 0.229 -0.465 0.253 -0.361 0.250 (2.700) (0.806) (2.213) (2.489) (1.838) (1.444)
Income Quartiles -0.685*** 0.163 -0.524 0.378 -0.596*** 0.144 0.052 0.123 0.444*** 0.141 0.241 0.130 (4.202) (1.386) (4.139) (0.423) (3.149) (1.854)
Household-Size 0.143*** 0.045 0.142 0.091 0.154* 0.047 0.003 0.037 -0.064 0.039 0.080 0.040 (3.178) (1.560) (3.277) (0.081) (1.641) (2.000)
Number of income sources 0.173 0.151 0.097 0.362 -0.266** 0.131 -0.001 0.122 0.113 0.139 -0.103 0.130
(1.146) (0.268) (2.031) (0.008) (0.813) (0.792)
Off-Farm Income/K -0.003 0.002 -0.001 0.002 -0.001** 0.001 -0.002*** 0.001 0.004* 0.001 0.000 0.000
(1.500) (0.500) (1.000) (2.000) (4.000) (0.000)
Farming system -0.028 0.152 -0.416 0.369 0.370** 0.131 -0.162 0.119 -0.145 0.138 -0.190 0.130 (0.184) (1.127) (2.824) (1.361) (1.051) (1.462)
Sex -0.355 0.287 -0.285 0.663 0.033 0.285 -0.112 0.247 0.032 0.268 -0.094 0.280 (1.237) (0.430) (0.116) (0.453) (0.119) (0.336)
Age 0.007 0.009 -0.014 0.022 -0.007 0.008 -0.021** 0.008 -0.007 0.008 -0.011 0.010 (0.778) (0.636) (0.875) (2.625) (0.875) (1.100)
Schooling 0.039 0.043 -0.004 0.096 0.015 0.036 -0.040 0.033 0.026 0.038 0.062 0.040 (0.907) (0.042) (0.417) (1.212) (0.684) (1.550)
Constant -2.454*** 0.861 -2.370 1.886 -0.053 0.782 0.033 0.688 1.864* 0.775 1.540* 0.780 (2.850) (1.257) (0.068) (0.048) (2.405) (1.974)
Robust t-statistics are in parentheses and significance at 10%, 5%, and 1% levels is indicated by *, **, and ***, respectively
DOI: 10.18697/ajfand.91.18095 15895
REFERENCES
1. NBS. Integrated Labour Force Survey 2014 (National Bureau of Statistics (NBS) [Tanzania], 2015).
2. NBS. Basic Demographic and Socio-Economic Profile (National Bureau of Statistics (NBS) [Tanzania], 2014).
3. Baiphethi MN and PT Jacobs "The Contribution of Subsistence Farming to Food Security in South Africa," Agrekon 2009;48: 459–482.
4. Luoga W, Kurwijila L, Nyange D and R Ryoba "Determinants of Access and Participation of Smallholder Farmers in Dairy Input and Output Markets in Tanzania Case study of Rungwe District," Tanzania Journal of Agricultural Sciences 2014,8.
5. Salami A, Kamara AB and Z Brixiova Smallholder Agriculture in East Africa: Trends, Constraints and Opportunities (African Development Bank Tunis, Tunisia, 2010).
6. UNDP. Tanzania Human Development Report 2014 (UNDP and Ministry of Finance Tanzania, 2015).
7. NBS. Household Budget Survey Poverty Key_Findings Report 2011-2012 (National Bureau of Statistics (NBS) [Tanzania], 2014).
8. IFAD. Rural Poverty Report 2011 (IFAD, 2011).
9. Okorie M Rural Agricultural Markets Reducing Poverty (MVIWATA, 2014).
10. Kassie M, Stage J, Teklewold H and O Erenstein "Gendered food security in rural Malawi: why is women’s food security status lower?," Food Security 2015;7: 1299–1320.
11. Koppmair S, Kassie M and M Qaim "Farm production, market access and dietary diversity in Malawi," Public health nutrition 2017;20: 325–335.
12. Stifel D and B Minten "Market access, well-being, and nutrition: evidence from Ethiopia," World Development 2017;90: 229–241.
13. Vilvert E, Lana M, Zander P and S Sieber "Multi-model approach for assessing the sunflower food value chain in Tanzania," Agricultural Systems 2018;159: 103–110.
14. Msoffe GE and ET Lwoga "Contribution of mobile phones in expanding human capabilities in selected rural districts of Tanzania," Global Knowledge, Memory and Communication (2019).
DOI: 10.18697/ajfand.91.18095 15896
15. Reardon T, Taylor JE, Stamoulis K, Lanjouw P and A Balisacan "Effects of non-farm employment on rural income inequality in developing countries: an investment perspective," Journal of agricultural economics 2000;51: 266–288.
16. Adams Jr RH "Nonfarm Income, Inequality, and Land in Rural Egypt*," Economic Development and Cultural Change 2002;50: 339–363.
17. Barrett CB, Reardon T and P Webb "Nonfarm income diversification and household livelihood strategies in rural Africa: concepts, dynamics, and policy implications," Food policy 2001;26: 315–331.
18. Magombeyi M, Taigbenu A and J Barron "Rural food insecurity and poverty mappings and their linkage with water resources in the Limpopo River Basin," Physics and Chemistry of the Earth, Parts A/B/C 2016;92: 20–33.
19. Mahadevan R and V Hoang "Is There a Link Between Poverty and Food Security?" Social Indicators Research 2016;128: 179–199.
20. Mailumo S, Folorunsho S, Amaza P and S Muhammad "Analysis of food security and poverty status of rural farming households in Bauchi state, Nigeria," Journal of Agricultural Research and Development 2016;15: 52–65.
21. Rosen S and S Shapouri "Effects of Income Distribution on Food Security," US Department of Agriculture Information Bulletin 2001;765–72.
22. Hirvonen K, Taffesse AS and IW Hassen "Seasonality and household diets in Ethiopia," Public Health Nutrition 2016;19: 1723–1730.
23. FAO. The State of Food and Agriculture: Leveraging Food Systems for Inclusive Rural Transformation (FAO, 2017).
24. RC-Shinyanga Shinyanga Regional Socio-Economic Profile (2013).
25. RC-Morogoro Morogoro Regional Socio-Economic Profile (The Planning Commission Dar Es Salaam and Regional Commissioner’s Office Morogoro, 2013).
26. ICF Macro. Tanzania Demographic and Health Survey 2010 (2011).
27. ICF and MUCHALI. Tanzania. MAFC ‘AGSTATS for Food Security: The /11 Final Food Crop Production Forecast for /12’. Dar Es Salaam. (2013), Vol. 7 SRC-GoogleScholar.
28. Gebremedhin B and M Jaleta "Commercialization of smallholders: Is market participation enough," in (2010).

DOI: 10.18697/ajfand.91.18095 15897
29. Njuki J, Kaaria S, Chamunorwa A and W Chiuri "Linking Smallholder Farmers to Markets, Gender and Intra-Household Dynamics: Does the Choice of Commodity Matter&quest," European Journal of Development Research 2011;23: 426–443.
30. Coates A, Swindale A and P Bilinsky "Food and Nutrition Technical Assistance Project (FANTA): Household Food Insecurity Access Scale (HFIAS) for Measurement of Food Access: Indicator Guide (v. 3)," Washington, DC: Food and Nutrition Technical Assistance Project (2007).
31. Swindale A and P Bilinsky "Household dietary diversity score (HDDS) for measurement of household food access: indicator guide," Washington, DC: Food and Nutrition Technical Assistance Project, Academy for Educational Development (2006).