Embed Size (px)
Citation preview

Low-Cost Radon Reduction Pilot Study William B. Rose, Paul W. Francisco, and Zachary Merrin Partnership for Advanced Residential Retrofit
September 2015

NOTICE
This report was prepared as an account of work sponsored by an agency of the United States government. Neither the United States government nor any agency thereof, nor any of their employees, subcontractors, or affiliated partners makes any warranty, express or implied, or assumes any legal liability or responsibility for the accuracy, completeness, or usefulness of any information, apparatus, product, or process disclosed, or represents that its use would not infringe privately owned rights. Reference herein to any specific commercial product, process, or service by trade name, trademark, manufacturer, or otherwise does not necessarily constitute or imply its endorsement, recommendation, or favoring by the United States government or any agency thereof. The views and opinions of authors expressed herein do not necessarily state or reflect those of the United States government or any agency thereof.
Available electronically at SciTech Connect http:/www.osti.gov/scitech
Available for a processing fee to U.S. Department of Energy and its contractors, in paper, from:
U.S. Department of Energy Office of Scientific and Technical Information P.O. Box 62 Oak Ridge, TN 37831-0062 OSTI http://www.osti.gov Phone: 865.576.8401 Fax: 865.576.5728 Email: [email protected]
Available for sale to the public, in paper, from: U.S. Department of Commerce National Technical Information Service 5301 Shawnee Road Alexandria, VA 22312 NTIS http://www.ntis.gov Phone: 800.553.6847 or 703.605.6000 Fax: 703.605.6900 Email: [email protected]
iii
Low-Cost Radon Reduction Pilot Study
Prepared for:
The National Renewable Energy Laboratory
On behalf of the U.S. Department of Energy’s Building America Program
Office of Energy Efficiency and Renewable Energy
15013 Denver West Parkway
Golden, CO 80401
NREL Contract No. DE-AC36-08GO28308
Prepared by:
William B. Rose, Paul Francisco, and Zachary Merrin
Partnership for Advanced Residential Retrofit
Indoor Climate Research and Training
Illinois Sustainable Technology Center
University of Illinois at Urbana-Champaign
1 Hazelwood Drive
Champaign, IL 61820
NREL Technical Monitor: Stacey Rothgeb
Prepared under Subcontract No. KNDJ-0-40346-04
September 2015
iv
The work presented in this report does not represent performance of any product relative to regulated minimum efficiency requirements.
The laboratory and/or field sites used for this work are not certified rating test facilities. The conditions and methods under which products were characterized for this work differ from standard rating conditions, as described.
Because the methods and conditions differ, the reported results are not comparable to rated product performance and should only be used to estimate performance under the measured conditions.
v
Contents List of Figures ............................................................................................................................................ vi List of Tables ............................................................................................................................................. vii Acknowledgments ................................................................................................................................... viii Executive Summary ................................................................................................................................... ix 1 Introduction and Background ............................................................................................................. 1
1.1 Introduction ...................................................................................................................................... 1 1.2 Relevance to Building America’s Goals .......................................................................................... 1 1.3 Cost-Effectiveness ........................................................................................................................... 2 1.4 Trade-Offs and Other Benefits ......................................................................................................... 2
2 Experimental Methods ......................................................................................................................... 3 2.1 Research Questions .......................................................................................................................... 3 2.2 Technical Approach ......................................................................................................................... 3 2.3 Houses ............................................................................................................................................ 4
2.3.1 Group 1 ............................................................................................................................... 4 2.3.2 Group 2 ............................................................................................................................... 5 2.3.3 Group 3 ............................................................................................................................... 6
2.4 Investigation and Diagnostics .......................................................................................................... 8 2.5 Air-Sealing Work ............................................................................................................................. 8 2.6 Equipment ...................................................................................................................................... 11
2.6.1 Radon Instrumentation ...................................................................................................... 11 2.6.2 Temperature and Humidity Instrumentation ..................................................................... 14
3 Results ................................................................................................................................................. 15 3.1 Airtightness Measurements ............................................................................................................ 15 3.2 Duct Tightness ............................................................................................................................... 18 3.3 Moisture Balance ........................................................................................................................... 20 3.4 Radon .......................................................................................................................................... 22
3.4.1 Study Dates ....................................................................................................................... 22 3.4.2 Data Selection ................................................................................................................... 24 3.4.3 Radon Averages ................................................................................................................ 26 3.4.4 Correlation of Radon Readings with Weather Conditions ................................................ 33
4 Individual House Findings ................................................................................................................. 39 4.1 PR-10: Furnace Fan Operation ...................................................................................................... 39 4.2 PR-13 and PR-14: Crawl Space Venting ....................................................................................... 39 4.3 PR-12 and PR-08: Windows—Open Condition ............................................................................ 41
5 Conclusions ........................................................................................................................................ 43 References ................................................................................................................................................. 45 Bibliography .............................................................................................................................................. 46 Appendix A: Charts of Included and Excluded Data for Each House ................................................. 47 Appendix B: Add-a-Hole Methods ........................................................................................................... 50 Appendix C: Moisture Balance Calculations .......................................................................................... 54 Appendix D: Ellipse Calculations ............................................................................................................ 56 Appendix E: Field Data Sheet .................................................................................................................. 57
vi
List of Figures Figure 1. Sealing of abandoned panned return (left); use of rigid foam and sealant to shut
abandoned supply boots (right) .......................................................................................................... 8 Figure 2. Foam sealing at plumbing penetrations and at supply boot (left); air sealing at ductwork
joints (right) ........................................................................................................................................... 9 Figure 3. Large bypasses at the basement entry (left); ductwork sealing (center); sealing at an
abandoned laundry chute (right) ........................................................................................................ 9 Figure 4. Sealing leakage at the furnace (located in the crawl space) associated with the humidifier
(left) and panned return (right) .......................................................................................................... 10 Figure 5. House 5, showing blown cellulose floor system in a crawl space area (left) and ductwork
showing a panned return and abandoned riser (right) ................................................................... 10 Figure 6. Continuous radon monitor showing a small central processing unit mounted to rear. The
power supply for the monitor and computer is shown at the right. .............................................. 11 Figure 7. Radon monitoring equipment in place in a crawl space (House 4, left) and in an upstairs
bedroom (right) ................................................................................................................................... 11 Figure 8. Results of intercalibration test of 12 radon monitoring units .............................................. 12 Figure 9. Climate classes as defined under International Organization for Standardization 13788 20 Figure 10. Moisture balance calculation for PR-04 pretreatment; moisture balance was calculated
as 674 Pa. Data in red are excluded from the moisture balance estimate using the two stated criteria. ................................................................................................................................................. 21
Figure 11. House PR-04 radon levels, living space compared to foundation. Data points shown as “0” represent time when the occupant had the building in “open” condition ............................. 24
Figure 12. House 2 comparison of living-space radon to foundation radon, where the house was kept in closed-house conditions throughout the study ................................................................. 25
Figure 13. Visual identification of closed-condition data for houses 1, 3, and 5 ............................... 26 Figure 14. Average radon concentration pre- and posttreatment in the living level, pCi/L .............. 28 Figure 15. Average radon concentration pre- and posttreatment in the foundation level, pCi/L ..... 28 Figure 16. Correlation of foundation radon at House PR-01 with outdoor air temperature.
Regression is second-order polynomial. R2 is higher for polynomial than for linear regression. .......................................................................................................................................... 36
Figure 17. Hourly foundation and living-level radon for house PR-10 with continuous furnace fan operation ............................................................................................................................................. 39
Figure 18. Hourly foundation and living-level radon showing vents-open effect .............................. 40 Figure 19. Comparison of PR-13 foundation radon (x-axis) and living-level radon (y-axis), showing
vents-open effect ................................................................................................................................ 40 Figure 20. House PR-14 showing crawl space vents-open effect ........................................................ 41 Figure 21. House PR-12 showing windows-open effect ....................................................................... 41 Figure 22. House PR-12 data, comparison of foundation radon (x-axis) against living-level radon
(y-axis) ................................................................................................................................................. 42 Figure 23. House PR-08 comparison of hourly foundation radon (x-axis) with living-level radon (y-
axis) showing the weaker influence of the window-open condition ............................................. 43
Unless otherwise noted, all figures were created by the PARR team.

vii
List of Tables Table 1. Summary of Individual House Characteristics .......................................................................... 7 Table 2. Relative Percent Differences among Twelve Continuous Radon Monitors, 44-Hour Test . 13 Table 3. Measured Foundation Zone Pressures in 15 Houses, Pre- and Posttreatment with the
House Depressurized by 50 Pa ......................................................................................................... 16 Table 4. House-to-Zone Calculated Net Opening Areas Pre- and Posttreatment ............................... 16 Table 5. Zone-to-Outdoor Calculated Net Opening Areas Pre- and Posttreatment ........................... 17 Table 6. Pressure Pan Readings (Pa of Pressure Difference with the Indoors, Under 50 Pa House
Pressure) ............................................................................................................................................. 19 Table 7. Moisture Balance Results (Pa) .................................................................................................. 23 Table 8. Dates of Deployment, Retrofit and Retrieval for the Three Study Periods by Group .......... 23 Table 9. Radon Average Results (pCi/L) ................................................................................................. 27 Table 10. Average Radon for the Periods Intended To Be Used as Control ....................................... 29 Table 11. R2 and Slope, Comparing Living-Level Radon Average ....................................................... 31 Table 12. Restatement of Radon Levels Pre- and Posttreatment ........................................................ 31 Table 13. Summary Table Showing Ratios of Posttreatment to Pretreatment ................................... 32 Table 14. R2 Comparison of Hourly Radon, Pretreatment with Hourly Weather Conditions ............ 34 Table 15. Slope of Comparison of Hourly Radon, Pretreatment with Temperature and Barometric
Pressure .............................................................................................................................................. 34 Table 16. R2 Comparison of Hourly Radon, Posttreatment with Hourly Weather Conditions .......... 35 Table 17. Slope of a Comparison of Hourly Radon, Posttreatment with Temperature and
Barometric Pressure .......................................................................................................................... 35 Table 18. Rate of Change of Radon Following Rain Over 36 Hours (pCi/L/day) ................................ 38
Unless otherwise noted, all tables were created by the PARR team.
viii
Acknowledgments
The authors would like to acknowledge those who contributed to this study. These include the U.S. Department of Energy Building America program with Stacy Rothgeb, National Renewable Energy Laboratory technical manager; Lori Shupe from the University of Illinois Sustainable Technology Center, who managed the participant contacts; Terry Brennan of Camroden Associates for technical guidance; the Illinois Emergency Management Agency; Patrick Daniel, director; and especially the homeowners and their families who participated in the study.
ix
Executive Summary
The U.S. Department of Energy’s Building America research team Partnership for Advanced Residential Retrofits conducted a primary scoping study on the impact of air sealing between the foundation and the living space on radon transport reduction across the foundation and living space floor assembly. Fifteen homes in the Champaign, Illinois, area participated in the study. These homes were instrumented for hourly continuous radon measurements and simultaneous temperature and humidity measurements. Blower door and zone pressure diagnostics were conducted at each house. The treatments consisted of using air-sealing foams at the underside of the floor that separated the living space from the foundation and providing duct sealing on the ductwork that is situated in the foundation area. The hypothesis was that air sealing the floor system that separated the foundation from the living space should better isolate the living space from the foundation; this isolation should lead to less radon entering the living space from the foundation. If the hypothesis had been proven, retrofit energy-efficiency programs may have chosen to adopt these isolation methods for enhanced radon protection to the living space.
The research was conducted in three groups of five homes. The homes in each group were instrumented for approximately 3 months. Treatments for each home occurred either at the end of the first month or at the end of the second month. In this way, two or three of the five homes could be used as controls (with no treatment and no change in conditions) during the 2-month period when the other homes received treatment.
Radon measurements are usually conducted in “closed-house conditions” under which windows are not to be opened, clothes dryers are not to be used, and signs are posted at doors to ensure that they are used only briefly. These restrictions were not applicable to a 3-month research term. When possible, houses were instrumented for window operation. Some occupants provided feedback about window operation. In the first group, one occupant maintained excellent logs of window operation; when data from that house were plotted for a comparison of house radon to foundation radon, a distinguishable pattern emerged that provided a means to distinguish house-open data from house-closed data for other houses. This distinction was applied to the data from all the houses.
The research yielded the following findings:
In most houses the treatment led to a measurable change in zone pressure calculations. Net opening areas were calculated using add-a-hole methods and showed greater isolation of the living space and foundation zone posttreatment compared to pretreatment.
This increased isolation did not cause a statistically significant change in living-level average radon. Of the 15 houses, two showed essentially no change, six showed decreased radon, and seven showed increased radon relative to pretreatment levels. Changes in radon levels were all within normal variations, so no changes in either direction could be directly attributed to the treatments.
The study design included a means to use part of the sample as controls while the remaining part underwent treatment. Living-space radon levels in different houses, adjusted for closed-house conditions, showed low correlation; R2 values from comparing pairs of homes ranged from 0.221
x
to 3E-6. Even within a single house the correlations between the R2 values of the first-floor and foundation space radon were below 0.6. These low correlations show that factors beyond the weather conditions, which all homes experienced, influence radon levels and demonstrate that control for weather cannot be adequately accomplished with such a small sample size.
The study showed that the living-space and foundation radon levels changed somewhat in tandem from pretreatment to posttreatment. They did not show a strong change, as hypothesized, toward a higher foundation average together with the average from the lower living level as a consequence of increased isolation between the two zones.
The study showed a rather strong correlation between outdoor air temperature and foundation radon levels in which lower outdoor air temperatures correlated to lowered foundation radon levels. Possible reasons for this correlation are discussed. Relations between barometric pressure and radon levels were also seen.
A review of individual home findings shows that: (1) continuous air handling fan operation leads to a high level of foundation air and living-level air mixing, (2) radon levels are lower when crawl space vents are open, and (3) living-level radon levels are lower when windows are open.

1
1 Introduction and Background
1.1 Introduction The research was originally designed to address these questions:
How effectively does targeted floor air sealing isolate the living space from the foundation space?
How great an impact did this air sealing have on radon levels?
Which air sealing targets should be used?
What is the role of ductwork in achieving this isolation?
The test plan for this research provides the background context for these questions.
This study focused on single-family detached homes in which the foundation level was not the lowest living level. It was designed to determine the level of reduction in lowest-living-level radon readings that results from providing air-sealing measures in the floor above the basement or crawl space and from providing duct sealing. Because these measures are among those already considered in energy-efficiency programs, they may be easily integrated into the work scopes of such programs, support the “do no harm” philosophy, and provide other energy and health and safety benefits. Thus, this study adds to the list of “other types of radon reduction methods” described by the U.S. Environmental Protection Agency (EPA 1993).
1.2 Relevance to Building America’s Goals Overall, the goal of the U.S. Department of Energy’s Building America program is to “reduce home energy use by 30%-50% (compared to 2009 energy codes for new homes and pre-retrofit energy use for existing homes).” To this end, the Building America research team Partnership for Advanced Residential Retrofits conducted research to “develop market-ready energy solutions that improve the efficiency of new and existing homes in each U.S. climate zone, while increasing comfort, safety, and durability.”1
This project addressed radon reduction directly and energy savings indirectly. In recent years some discussion has taken place about the possibility of testing the homes for radon that are already scheduled to undergo energy retrofits. Given the cost of remediation relative to typical retrofit budgets, this policy could result in deferrals for many of these homes.
Radon reduction may be necessary in radon zones 1 and 2. If the United States has 100 million homes, zones 1 and 2 may contain 60 million homes. The U.S. Environmental Protection Agency has compiled state-by-state and county-by-county radon measurements. For the 60th percentile of radon activity by county, the average of its estimate of the fraction of homes that have radon levels higher than 4 picoCuries per liter (4 pCi/L) is approximately 7%. This represents 4.2 million homes.
1 http://www1.eere.energy.gov/buildings/building_america/program_goals.html

2
If research showed that air sealing between the living space and the foundation space effectively reduced living-level radon, it could lead to practices that allow energy retrofits to go forward in many homes that might otherwise be deferred. Although post-retrofit radon levels may not be reduced lower than 4 pCi/L, they may still be improved relative to pre-retrofit levels.
The elements of the work described here were designed to lead to possible inclusion in a future Measure Guideline for first-floor air sealing for radon reduction.
1.3 Cost-Effectiveness The budgeted cost of first-floor air sealing in this research project was $700 per house. The cost of active soil depressurization, the standard radon mitigation method, is claimed to be $800–$1,500 nationally.2 Sources local to the test site indicate that the costs for active soil depressurization are $1,200–$2,000.
In practice this will not equate to a $700 cost increase compared to a standard energy retrofit. First-floor air sealing uses standard energy retrofit contracting tools, skills, materials, and personnel. It is done as a part of energy-retrofit contracting, so it requires no additional overhead or on-site personnel. This may have budget impacts of two kinds:
The $700 cost may in part be subsumed into other energy-retrofit costs, such as rim joist sealing and duct sealing, so $700 may be an overestimate of the incremental cost.
Setup and logistical costs for added air sealing would be negligible, because the same contractor performs the radon reduction contractor and the energy retrofit.
The situation would be different if a mitigation system were required. A mitigation system would be entirely new spending relative to standard practice; thus, depending on state regulations, it may require additional contractors and licensing of retrofit staff to conduct any testing.
1.4 Tradeoffs and Other Benefits Air sealing at the floor that separates the foundation (basement or crawl space) from the living space may have benefits above and beyond those from radon reduction. These may include:
Reduced convective heat transfer from the living space
Better isolation of the living space from moisture, foundation smells, pesticide residues, stored volatile organic compounds, and other contaminants that may be in the foundation space
Improved heating, ventilating, and air-conditioning equipment performance, given the inclusion of duct sealing in the methods under study
Reduced buoyancy air exchange with greater isolation between the foundation and living spaces—shorter stack
Improved sound control.
2 SOSradon.com. National Radon Program Services at Kansas State University funded by the U.S. Environmental Protection Agency under Cooperative Agreement XA-83312602.
3
2 Experimental Methods
2.1 Research Questions The research team sought to address these questions:
How effectively does targeted floor air sealing isolate the living space from the foundation space?
The researchers conducted floor air sealing and duct sealing at 15 homes. The effectiveness of floor air sealing was determined with blower door testing, including add-a-hole zone pressure testing. This test method allowed an estimate of the actual opening area both before and after the air-sealing treatment. The add-a-hole diagnostics allowed pre- and posttreatment estimates of the opening area of the floor separating the foundation from the living space and the opening area between the foundation and the outside. (See Appendix B for a description of add-a-hole methods.)
How great an impact does this air sealing have on radon levels?
RadStar continuous radon monitors were used to measure the impact on radon reduction. The averaging period was approximately 1 month immediately before and immediately after intervention. The average results are given in Table 9 and Table 12. The design for controls during the treatment is of questionable applicability given the apparent independence of readings from house to house. The radon results are mixed and are described in subsequent sections.
Which air-sealing targets should be used?
The increased isolation is demonstrated in the findings. However, this did not lead to statistically significant reductions in radon. Thus, no conclusion can be drawn about sealing targets. The degree of air sealing that was typically achievable using these standard methods was not sufficient to clearly reduce radon levels in the living space.
What is the role of ductwork in achieving this isolation?
Pressure pan measurements were used to assess the airtightness of the ductwork pre- and posttreatment.
2.2 Technical Approach A test plan for this work was submitted to Building America in February 2013. Its principal elements were to:
Use a sample of convenience from the Champaign, Illinois, area.
Study 15 homes during 2013–2014.
Work in compliance with measurement protocols from the Illinois Emergency Management Agency, the radon regulator in Illinois.
Schedule the work into three periods so that

4
o During the first two periods, some of the homes will receive pretreatment measurement, treatment, and posttreatment measurement; the other homes will be monitored without treatment and may serve as controls.
o During the second and third periods, the homes that served as controls earlier will receive treatment and those that had already received treatment will serve as controls.
A public notice inviting participants was placed in the weekly University of Illinois posting for research participation (EWeek). Respondents were screened for having a crawl space or unoccupied basement.
A project investigator visited each property to determine whether the house was appropriate for the project. At that first visit the investigator assessed the condition of the basement or crawl space and the lowest level floor and photographed the conditions. Homes that used the basements as the lowest living areas and homes that did not have a substantial barrier between the foundation and the living level were not included in the study. The aims and scope of the research were discussed with the clients.
An agreement form for study participants was drafted and reviewed. It discussed:
The nature of the research
The way the results will be used
The nature of the air-sealing work
The measurements method
The consequences for study participants (no personal identifiers were published).
2.3 Houses The study was conducted in three groups of five houses each. The first group was studied in fall-winter 2013, the second in spring 2014, and the third in summer-fall 2014. An advertisement was placed in a local news service to solicit participants. The primary criteria for selection were (1) willingness of the participant and (2) active separation of the living space from the foundation; that is, the house had a basement door or a crawl space hatch.
2.3.1 Group 1 PR-01: This one-story ranch house on a crawl space was constructed in the 1960s. The original heating system was a ducted furnace. In the 1980s an addition was put on the rear of the house and the entire heating system was changed from forced air to hot water. The duct boots remained in place but were taped over. Two window air conditioners were in place. The crawl space had a poly ground cover that was not sealed. The subfloor was 1 × 6.
PR-02: This large (2,400-ft2) ranch was built in the early 1990s on a crawl space with a poly ground cover. It was equipped with forced-air heating and central air conditioning. The crawl space vents were closed at the time of first audit and an exhaust fan designed for continuous operation with outlet outside just above ground level was in place. The owner participated in part

5
because of interest in the effectiveness of the fan and agreed to discontinue use of the fan for the duration of the test. The subfloor was plywood.
PR-03. This was an original construction one-story house on a basement with a concrete floor. The house had two additions, the first of which provided a second-story bedroom. The additions contained both basement and crawl space foundations. The original construction was more than 100 years old. The heating system was a ducted furnace in the basement. The subfloor was 1 × 6.
PR-04. This one-story house was approximately 60 years old on a deep crawl space—approximately 5 feet deep. The crawl space had a gravel floor with no ground cover. The heating and cooling were by forced air; the unit and all ducts were situated in the crawl space. The water heater was also in the crawl space. The subfloor was 1 × 6.
PR-05. This Post-World War II two-story house was situated on a basement. An addition was built at the rear of the house in the 1970s on three individual crawl spaces. The crawl spaces had no ground cover. The heating and cooling was by a forced-air unit situated in the basement. The subfloor was 1 × 6.
2.3.2 Group 2 The second group comprised four homes on crawl spaces and one house with basement and an attached crawl space. The radon levels in Group 2 were, on average, lower than those in Group 1.
PR-06: This two-story single-family home was built in approximately 2005. The house was built on a conditioned basement that contained a covered sump pump pit, furnace, water heater, and much of the house’s ducting. A small unvented crawl space was adjacent to the basement with a complete but unsealed ground cover over the dirt floor.
PR-07: This two-story single-family home custom was built by an architect in the 1970s on a dirt floor crawl space with access from the main living area. The crawl space had a highly deteriorated ground cover over the dirt floor and obvious signs of moisture issues. The expansive duct system in the crawl space was in poor shape; multiple sections were rusted to failure or were simply disconnected.
PR-08: This one-story single-family house was built in the 1970s. The foundation was a normally vented crawl space with access from the attached garage. The crawl space contained all the ducting and plumbing and had an unsealed ground cover over most of the dirt floor.
PR-09: This two-story single-family house was built in the 1970s over a vented crawl space with dual access points from the garage and from an interior closet. The crawl space had an unsealed ground cover over the dirt floor.
PR-10: This two-story single-family house was built in the 1980s. The foundation was a gravel floor crawl space with access from outside. The crawl space was normally vented with temperature-controlled louvers that opened during warmer weather. The crawl space contained an open sump pump pit. The furnace blower fan operated continuously.

6
2.3.3 Group 3 Low radon averages in Group 2 led to a selection process for Group 3 that entailed screening for radon levels higher than 4 pCi/L before intervention. This screening was done by deploying continuous radon monitors for a period before enrollment that varied from 3 weeks to 7 weeks.
PR-11: This one-story single-family house was built in the 1960s and had vaulted ceilings over a gravel floor crawl space. Crawl space access was from a bedroom closet on an exterior wall. The crawl space was vented at the beginning of the study, but modifications made to the house during the project eliminated the vents by the end. The crawl space contained poorly insulated ducts. The building was unoccupied during study. (All other buildings in the study were occupied during the study period.)
PR-12: This one-story single-family home was built in 1978. The foundation was a conditioned basement with two adjacent dirt floor unvented crawl spaces. Access to the crawl spaces was through regularly open holes that connected to the basement. The crawl spaces had sporadic unsealed ground covers.
PR-13: This two-story single-family house was built in 1991 with a high ceiling living room that connected to a loft bedroom. The foundation was a dirt floor crawl space with six normally open vents (closed for this study). Crawl space access was from a centrally located interior closet.
PR-14: This one-story single-family house was built in 1985. The foundation was a dirt floor crawl space with two vents that were opened in the cooling season and sealed from the outside with duct tape during the heating season. The crawl space contained multiple duct board supply and return runs with large penetrations and missing sections. Crawl space access was from a centrally located interior closet.
PR-15: This two-story single-family house was built in 1978. The foundation was a normally vented crawl space with a dirt floor and a comprehensive but unsealed ground cover. Crawl space access was from an interior hallway.
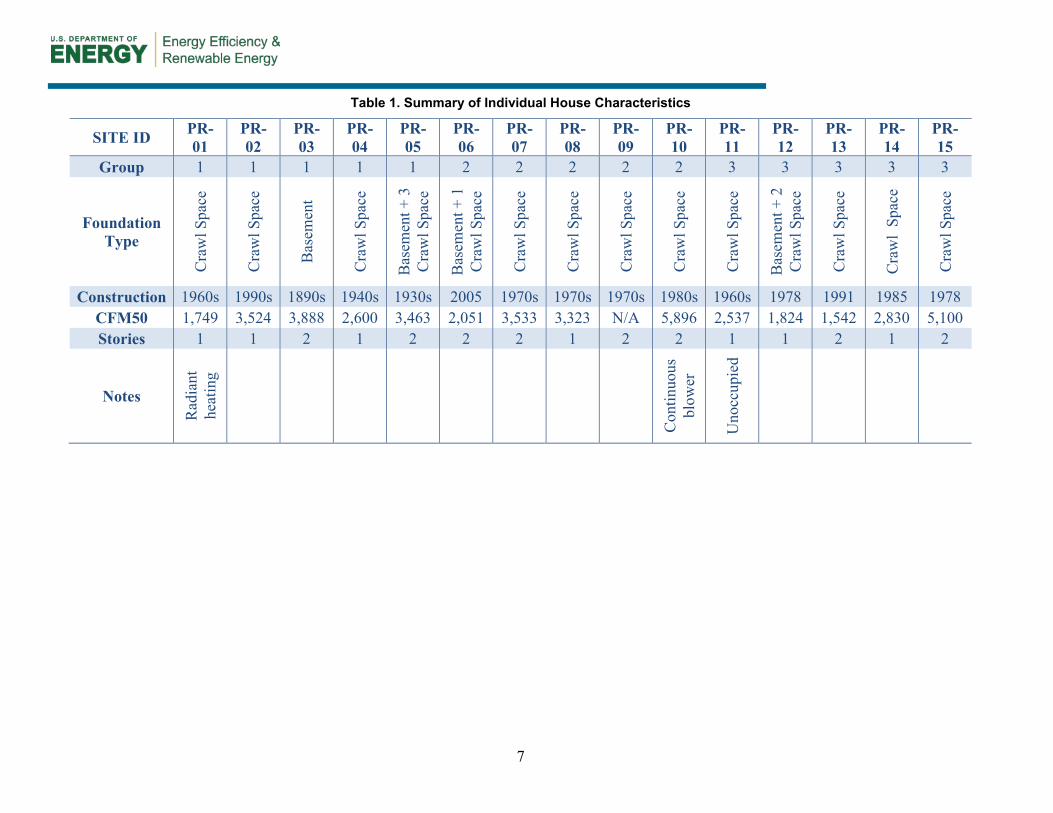
The house characteristics are summarized in Table 1.
7
Table 1. Summary of Individual House Characteristics
SITE ID PR-01
PR-02
PR-03
PR-04
PR-05
PR-06
PR-07
PR-08
PR-09
PR- 10
PR- 11
PR-12
PR-13
PR-14
PR-15
Group 1 1 1 1 1 2 2 2 2 2 3 3 3 3 3
Foundation Type
Cra
wl S
pace
Cra
wl S
pace
Bas
emen
t
Cra
wl S
pace
Bas
emen
t + 3
C
raw
l Spa
ce
Bas
emen
t + 1
C
raw
l Spa
ce
Cra
wl S
pace
Cra
wl S
pace
Cra
wl S
pace
Cra
wl S
pace
Cra
wl S
pace
Bas
emen
t + 2
C
raw
l Spa
ce
Cra
wl S
pace
Cra
wl
Spac
e
Cra
wl S
pace
Construction 1960s 1990s 1890s 1940s 1930s 2005 1970s 1970s 1970s 1980s 1960s 1978 1991 1985 1978 CFM50 1,749 3,524 3,888 2,600 3,463 2,051 3,533 3,323 N/A 5,896 2,537 1,824 1,542 2,830 5,100 Stories 1 1 2 1 2 2 2 1 2 2 1 1 2 1 2
Notes
Rad
iant
he
atin
g
Con
tinuo
us
blow
er
Uno
ccup
ied

8
2.4 Investigation and Diagnostics The investigator conducted blower door and other diagnostic tests before doing the air-sealing work and again after the air-sealing work was completed. A spreadsheet-based checklist was prepared and was used at each house to record the conditions and results of diagnostic testing. The blower door tests included zone pressure measurements of the foundation area (basement or crawl space) with add-a-hole methods to permit estimation of the actual net opening area from the house to the zone and from the zone to the outside. These estimates were used as the basis for determining the extent of the air-sealing work done in each of the pilot homes. (See Appendix B for a description of add-a-hole methods.)
The investigator conducted pressure pan tests to assess duct leakage.
The checklist used by the investigator is shown in Appendix E. It was a spreadsheet program designed for use with a tablet computer. The checklist is a variant of the one used in other research studies that involve weatherization.
2.5 Air-Sealing Work The contractor aimed to substantially reduce the net opening area between the basement or crawl space and the lowest living area to increase the isolation of the living space from the foundation space. Standard air-sealing techniques were used. These included:
One- and two-part foam for small to medium openings
Metal flashing and code-approved heat-resistant caulk for sealing around chimneys and flues
Rigid foam or other panels and one-part foam for larger openings
Duct sealing using tape and mastic.
The purpose of supply duct sealing was to close the openings in ducts that constituted bypasses between the foundation and the lowest living level. These bypasses allowed air exchange regardless of the operation of the air handling unit. The purpose of return duct sealing includes both the bypass concern as well as the potential for depressurizing the foundation space and thereby bringing in additional radon (see Figure 1).
Figure 1. Sealing of abandoned panned return (left); use of rigid foam
and sealant to shut abandoned supply boots (right)

9
Air sealing in the first group of homes is described below.
House 1 presented many opportunities for air sealing between the foundation and first floor (see Figure 2). The original forced-air system had been abandoned for a hydronic system. The neatness of foaming by the crew improved from House 1 to subsequent houses.
Figure 2. Foam sealing at plumbing penetrations and at supply boot (left); air sealing at ductwork joints (right)
House 2 (Figure 3) shows typical air sealing using one-part foam at penetrations, custom repair for large openings, and application of duct mastic to ducts. House 3 was more than 100 years old and had two additions. The basement extended under the original house and the two additions, but crawl space foundations were also situated under a large part of the additions. The ductwork, particularly the return ductwork, showed large cracks at joints and at a panned return.
Figure 3. Large bypasses at the basement entry (left); ductwork sealing (center);
sealing at an abandoned laundry chute (right)

10
House 4 (Figure 4) was a ranch house on a deep crawl space. The subfloor was 1 × 6 and it was not clear how to ensure good airtightness between floors with such a subfloor.
Figure 4. Sealing leakage at the furnace (located in the crawl space)
associated with the humidifier (left) and panned return (right)
House 5 (Figure 5) was a post-World War II two-story house with an addition at the rear. The primary foundation was a basement, though three small crawl space areas were situated beneath an addition room. Radon monitors were installed in both the basement and the crawl space. The poorly installed cellulose insulation in the floor system above the crawl space made achieving airtightness difficult. The crawl spaces had no poly ground covers.
Figure 5. House 5, showing blown cellulose floor system in a crawl space area (left)
and ductwork showing a panned return and abandoned riser (right)
11
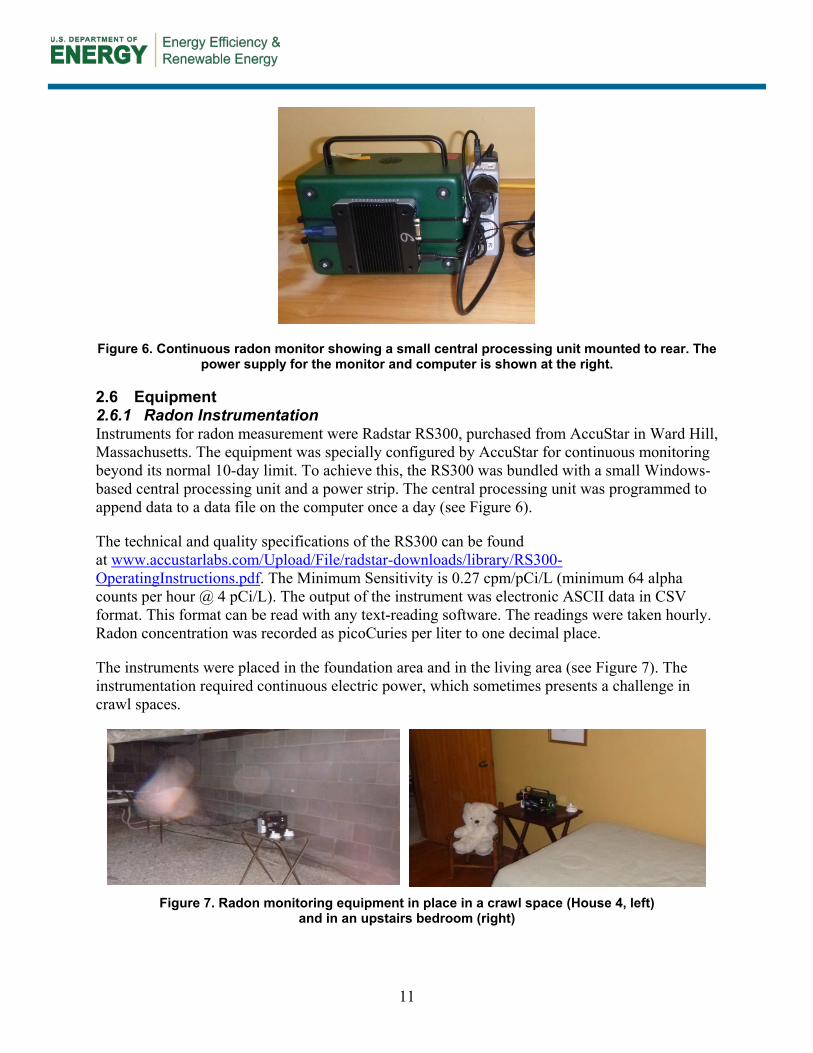
Figure 6. Continuous radon monitor showing a small central processing unit mounted to rear. The power supply for the monitor and computer is shown at the right.
2.6 Equipment 2.6.1 Radon Instrumentation Instruments for radon measurement were Radstar RS300, purchased from AccuStar in Ward Hill, Massachusetts. The equipment was specially configured by AccuStar for continuous monitoring beyond its normal 10-day limit. To achieve this, the RS300 was bundled with a small Windows-based central processing unit and a power strip. The central processing unit was programmed to append data to a data file on the computer once a day (see Figure 6).
The technical and quality specifications of the RS300 can be found at www.accustarlabs.com/Upload/File/radstar-downloads/library/RS300-OperatingInstructions.pdf. The Minimum Sensitivity is 0.27 cpm/pCi/L (minimum 64 alpha counts per hour @ 4 pCi/L). The output of the instrument was electronic ASCII data in CSV format. This format can be read with any text-reading software. The readings were taken hourly. Radon concentration was recorded as picoCuries per liter to one decimal place.
The instruments were placed in the foundation area and in the living area (see Figure 7). The instrumentation required continuous electric power, which sometimes presents a challenge in crawl spaces.
Figure 7. Radon monitoring equipment in place in a crawl space (House 4, left)
and in an upstairs bedroom (right)
12
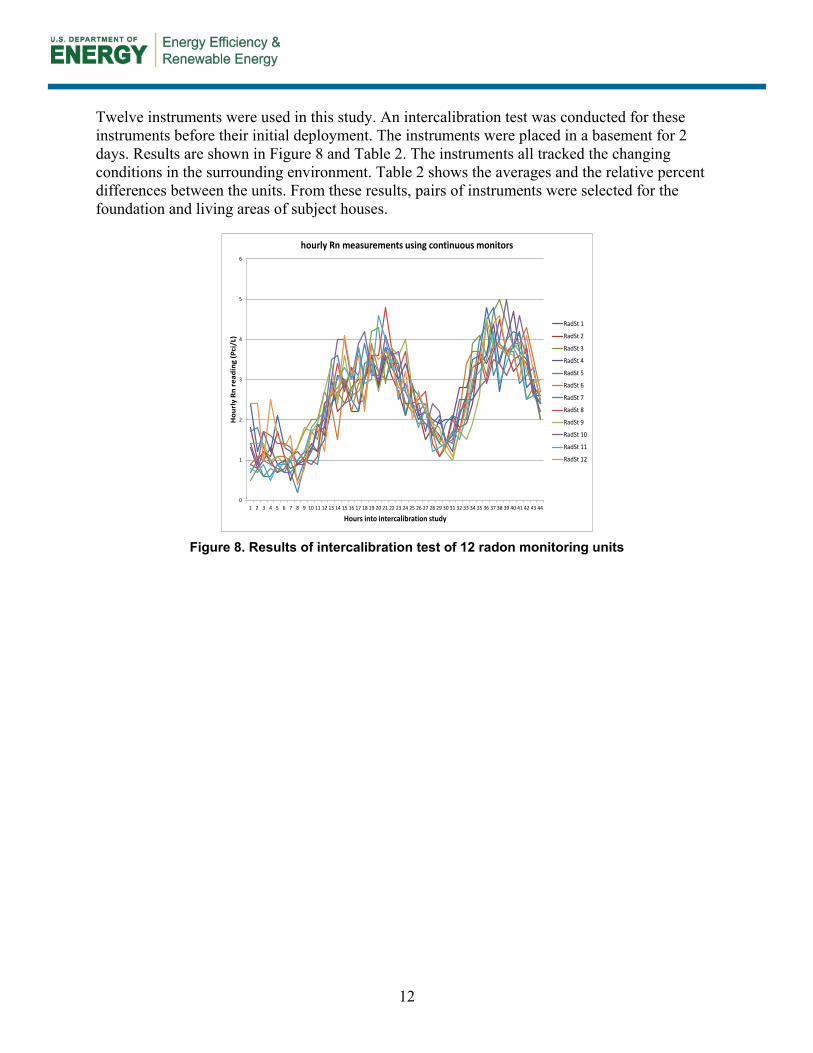
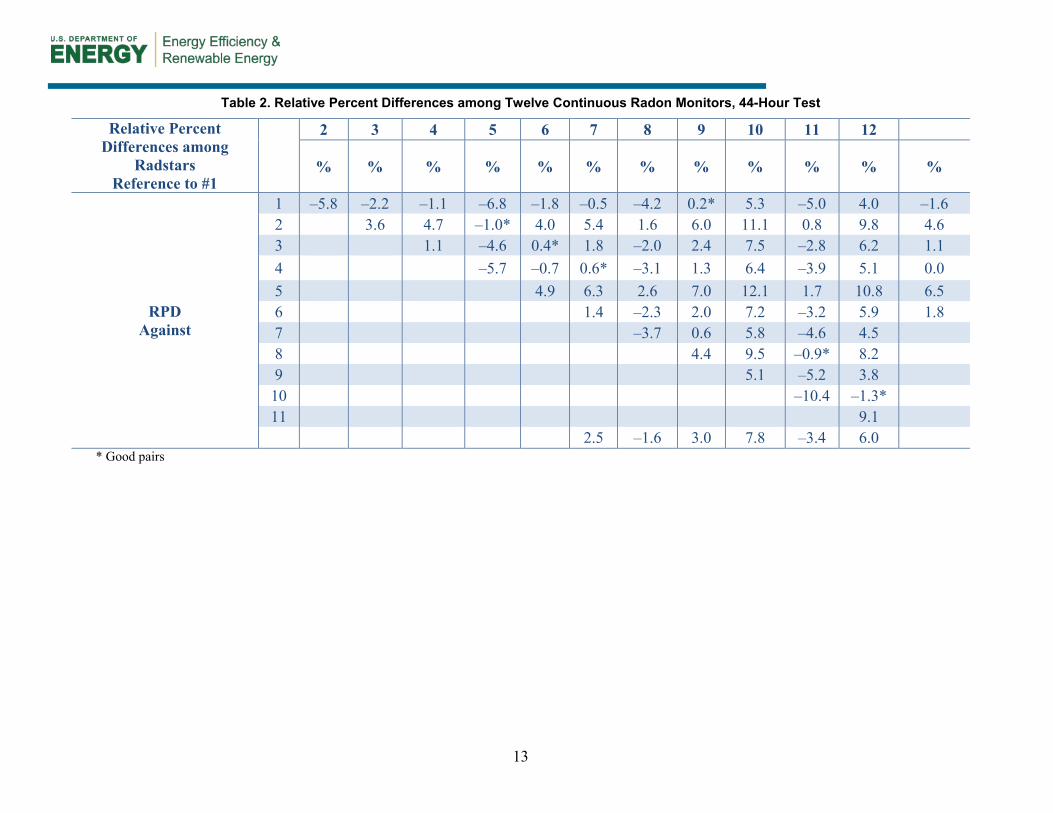
Twelve instruments were used in this study. An intercalibration test was conducted for these instruments before their initial deployment. The instruments were placed in a basement for 2 days. Results are shown in Figure 8 and Table 2. The instruments all tracked the changing conditions in the surrounding environment. Table 2 shows the averages and the relative percent differences between the units. From these results, pairs of instruments were selected for the foundation and living areas of subject houses.
Figure 8. Results of intercalibration test of 12 radon monitoring units
0
1
2
3
4
5
6
1 2 3 4 5 6 7 8 9 10 11 12 13 14 15 16 17 18 19 20 21 22 23 24 25 26 27 28 29 30 31 32 33 34 35 36 37 38 39 40 41 42 43 44
Hou
rly
Rn re
adin
g (P
ci/L
)
Hours into intercalibration study
hourly Rn measurements using continuous monitors
RadSt 1
RadSt 2
RadSt 3
RadSt 4
RadSt 5
RadSt 6
RadSt 7
RadSt 8
RadSt 9
RadSt 10
RadSt 11
RadSt 12
13
Table 2. Relative Percent Differences among Twelve Continuous Radon Monitors, 44-Hour Test
Relative Percent Differences among
Radstars Reference to #1
2 3 4 5 6 7 8 9 10 11 12
% % % % % % % % % % % %
RPD Against
1 –5.8 –2.2 –1.1 –6.8 –1.8 –0.5 –4.2 0.2* 5.3 –5.0 4.0 –1.6 2 3.6 4.7 –1.0* 4.0 5.4 1.6 6.0 11.1 0.8 9.8 4.6 3 1.1 –4.6 0.4* 1.8 –2.0 2.4 7.5 –2.8 6.2 1.1 4 –5.7 –0.7 0.6* –3.1 1.3 6.4 –3.9 5.1 0.0 5 4.9 6.3 2.6 7.0 12.1 1.7 10.8 6.5 6 1.4 –2.3 2.0 7.2 –3.2 5.9 1.8 7 –3.7 0.6 5.8 –4.6 4.5 8 4.4 9.5 –0.9* 8.2 9 5.1 –5.2 3.8 10 –10.4 –1.3* 11 9.1 2.5 –1.6 3.0 7.8 –3.4 6.0 * Good pairs
14
2.6.2 Temperature and Humidity Instrumentation Passive battery-powered temperature and humidity data loggers were installed in the same locations and for the same durations as the radon monitors. The temperature and humidity study calculated the resulting vapor pressure in the study locations of the house compared to outdoor vapor pressure to identify weather impacts (and perhaps for use as a second indicator of air change rate within the house and from foundation area to the lowest living level). The moisture balance approach was used to estimate the moisture conditions in the house (see Section 3.3).
For redundancy, pairs of similar loggers were installed in the same location as the radon monitors (see Figure 7).
15
3 Results
3.1 Airtightness Measurements Blower door testing was conducted pre- and posttreatment.
The testing included add-a-hole zone pressure testing, which permitted estimates of the net opening size from house to zone and from zone to outdoors. Add-a-hole methods were used to calculate the values in Table 4. Add-a-hole methods have a high uncertainty and consist of two zone pressure measurements: one taken under normal conditions and one in which an opening is created between either the house and the zone or the zone and the outside. The actual opening size of the added hole is of no consequence. Add-a-hole methods are described in detail in Appendix B. The uncertainties are normally calculated by assuming the likely error in pressure measurements, then calculating the opening area using the bounded pressure values. The uncertainty error is not calculated here but is commonly higher than 25%.
The results from Table 4 show that, except for house PR-01, the intervention apparently reduced the net opening size from house to zone. This suggests that the interventions increased the isolation of the living space from the foundation.
The utility of these values must be considered in light of the results shown in Table 5.
These results show changes in the net opening area from zone to outdoors. The project was not intended to change the rate of radon entry into the foundation space by virtue of the treatment or to effect any change in the airtightness of the foundation with respect to the outdoors. These results suggest changes in airtightness that are likely due to a combination of imprecision in the measurement technique and connections from the foundation space to outside via wall cavities or ductwork. For example, if a bypass connects the foundation to the home and to the attic, sealing that bypass will increase the isolation of the foundation space from both the house and outdoors.
Table 3 shows the zone pressure measurements and the percent reduction in zone pressure. The aim was to increase the isolation of the living level from the foundation level. A value that is lower than 100% shows increased isolation. In general, the treatment work increased the isolation of the living space from the foundation.

16
Table 3. Measured Foundation Zone Pressures in 15 Houses, Pre- and Posttreatment with the House Depressurized by 50 Pa
PR-01
PR-02
PR-03
PR-04
PR-05
PR-06
PR-07
PR-08
PR-09
PR-10
PR-11 PR-12 PR-
13 PR-14
PR-15
ZP-Prea (Pa) 19 18.7 21.6 24.4 42.1 40.4 46.6 13.1 13 28.3 42.7 40.3 38 40.1 41.5
ZP-Postb (Pa) 17.9 12 19 20 43.7 42.5 46.5 11.2 12.6 20.5 43.5 28 31 35.3 30.3
Ratio Post/Prec 0.94 0.64 0.88 0.82 1.04 1.05 1.00 0.85 0.97 0.72 1.02 0.69 0.82 0.88 0.73
Foundation Type
Cra
wl S
pace
Cra
wl S
pace
Bas
emen
t
Cra
wl S
pace
Bas
emen
t + 3
C
raw
l Spa
ce
Bas
emen
t + 1
C
raw
l Spa
ce
Cra
wl S
pace
Cra
wl S
pace
Cra
wl S
pace
Cra
wl S
pace
Cra
wl S
pace
Bas
emen
t + 2
C
raw
l Spa
ce
Cra
wl S
pace
Cra
wl S
pace
Cra
wl S
pace
a The measured zone pressure with respect to outdoors in Pa pretreatment b The measured zone pressure with respect to outdoors in Pa posttreatment c Shows values below 1 for improvements in zone pressure-measured airtightness
Table 4. House-to-Zone Calculated Net Opening Areas Pre- and Posttreatment
PR-01
PR-02
PR-03
PR-04
PR-05
PR-06
PR-07
PR-08 PR-09 PR-
10 PR-11
PR-12
PR-13
PR-14
PR-15
HZA-Pre (in.2)a 66 115 224 205 347 512 oorc 84 130 229 oor 172 85 oor 77
HZA-Post (in.2)b 86 55 185 135 198 76 oor oor 125 225 – 103 45 115 oor
Ratio Post/Pre 1.31 0.48 0.82 0.66 0.57 0.15 – – 0.96 0.98 – 0.60 0.53 – –
a The net house-to-zone opening area in in.2 pretreatment b The net house-to-zone opening area in in.2 posttreatment c Out of range values. These occur when the difference in zone pressure between closed condition and open condition is less than 5.5 Pa.

17
Table 5. Zone-to-Outdoor Calculated Net Opening Areas Pre- and Posttreatment
PR-01
PR-02
PR-03
PR-04
PR-05
PR-06
PR-07
PR-08
PR-09
PR-10
PR-11
PR-12
PR-13
PR-14
PR-15
ZOA-Pre (in.2)a 92 162 263 213 117 184 oorc 166 256 171 oor 76 43 oor 27
ZOA-Post (in.2)b 126 117 264 175 57 22 oor oor 254 299 87 29 58 oor
Ratio Post/Pre 1.38 0.72 1.00 0.82 0.49 0.12 0.99 1.75 1.15 0.67
a The calculated net opening area from the foundation zone to the outdoors pretreatment, in.2. b The calculated net opening area from the foundation zone to the outdoors posttreatment. c Out of range.
18
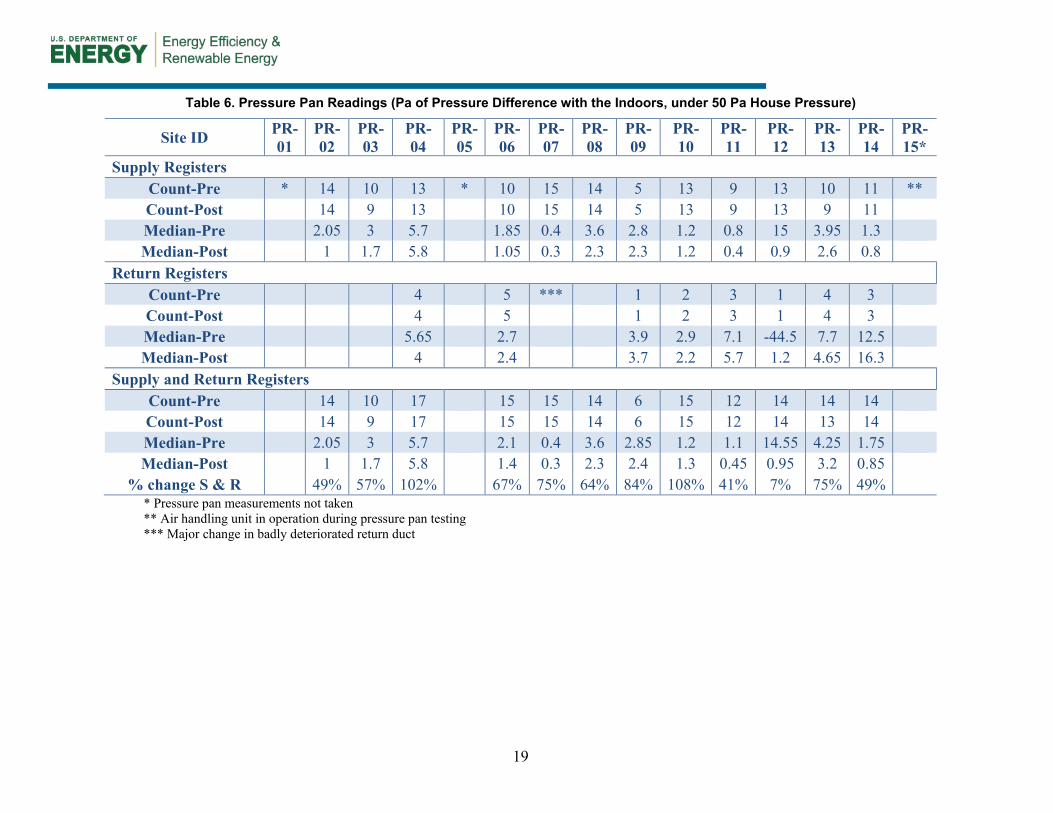
3.2 Duct Tightness Pressure pan test results provide an estimate of the amount of leakage of the ductwork to the exterior. Most of the houses were on crawl spaces with vents closed for the duration of the test. So leaks from the ductwork were not leaks directly to the exterior, and these results must be interpreted in light of the leakiness of the crawl space to the outside, which varies from house to house. Nevertheless, the findings from the pressure pan tests indicate that most of the ducts were tighter posttreatment.
Pressure pan readings were taken at supply registers and return grilles. There were more supply measurements than return measurements, so the supply results may be used with greater confidence. Pressure pan readings, especially low readings, have uncertainty associated with outdoor wind conditions and other factors. Pressure pan average readings are given in Table 6.
Return leaks may be more significant than supply leaks with respect to radon transfer from foundation space to living space. When return ducts are located in the foundation space, return leaks may depressurize the foundation space, draw in foundation air, and redistribute it rapidly to the living space. Conversely, supply leaks in the foundation space could reduce the amount of soil gas entering the foundation space but act as bypasses when the system was off. The lower number of return readings does not allow this speculation to be tested. In addition to standard duct sealing techniques, tightening of returns involved, in many cases, sealing the furnace filter cover with magnetic or metal-faced tape.
19
Table 6. Pressure Pan Readings (Pa of Pressure Difference with the Indoors, under 50 Pa House Pressure)
Site ID PR-01
PR-02
PR-03
PR-04
PR-05
PR-06
PR- 07
PR-08
PR-09
PR-10
PR-11
PR-12
PR-13
PR-14
PR-15*
Supply Registers Count-Pre * 14 10 13 * 10 15 14 5 13 9 13 10 11 ** Count-Post 14 9 13 10 15 14 5 13 9 13 9 11 Median-Pre 2.05 3 5.7 1.85 0.4 3.6 2.8 1.2 0.8 15 3.95 1.3 Median-Post 1 1.7 5.8 1.05 0.3 2.3 2.3 1.2 0.4 0.9 2.6 0.8
Return Registers Count-Pre 4 5 *** 1 2 3 1 4 3 Count-Post 4 5 1 2 3 1 4 3 Median-Pre 5.65 2.7 3.9 2.9 7.1 -44.5 7.7 12.5 Median-Post 4 2.4 3.7 2.2 5.7 1.2 4.65 16.3
Supply and Return Registers Count-Pre 14 10 17 15 15 14 6 15 12 14 14 14 Count-Post 14 9 17 15 15 14 6 15 12 14 13 14 Median-Pre 2.05 3 5.7 2.1 0.4 3.6 2.85 1.2 1.1 14.55 4.25 1.75 Median-Post 1 1.7 5.8 1.4 0.3 2.3 2.4 1.3 0.45 0.95 3.2 0.85
% change S & R 49% 57% 102% 67% 75% 64% 84% 108% 41% 7% 75% 49% * Pressure pan measurements not taken ** Air handling unit in operation during pressure pan testing *** Major change in badly deteriorated return duct
20
3.3 Moisture Balance Battery-operated self-contained temperature and relative humidity loggers were placed in basements and living spaces where they would be unaffected by sunlight or proximity to sources of cold or heat and where they would be undisturbed by occupants. Loggers were placed on the initial visit and retrieved at the end of the house monitoring period.
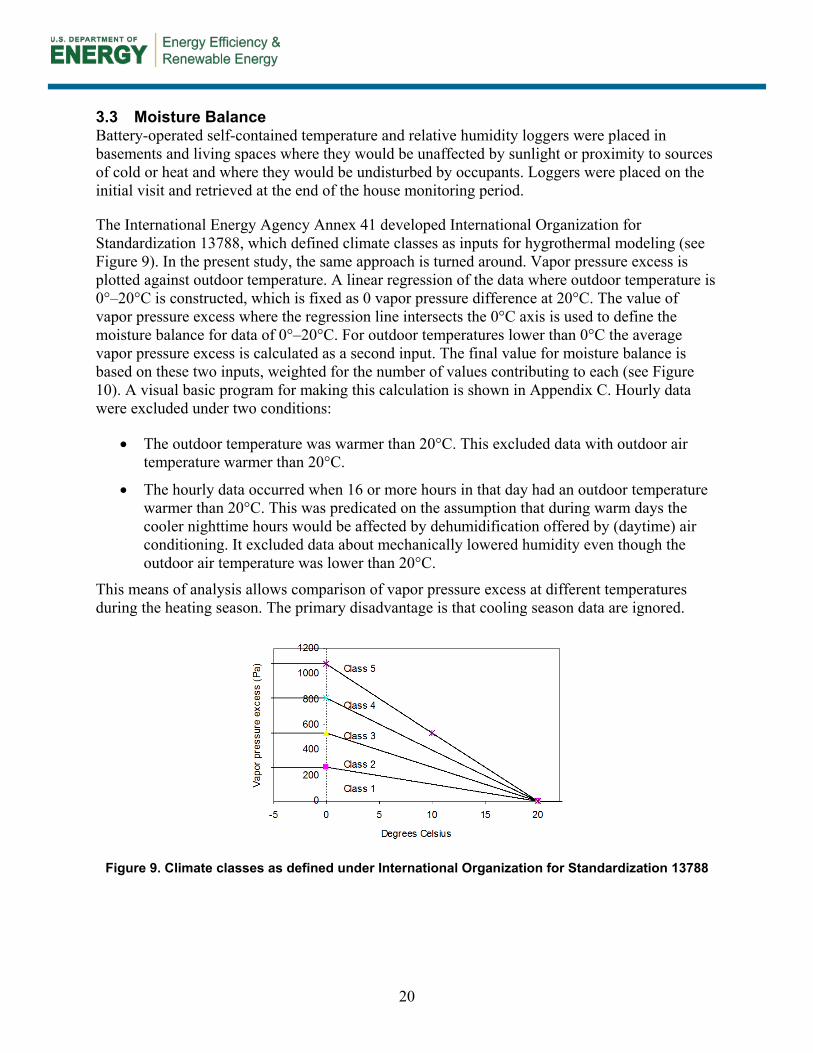
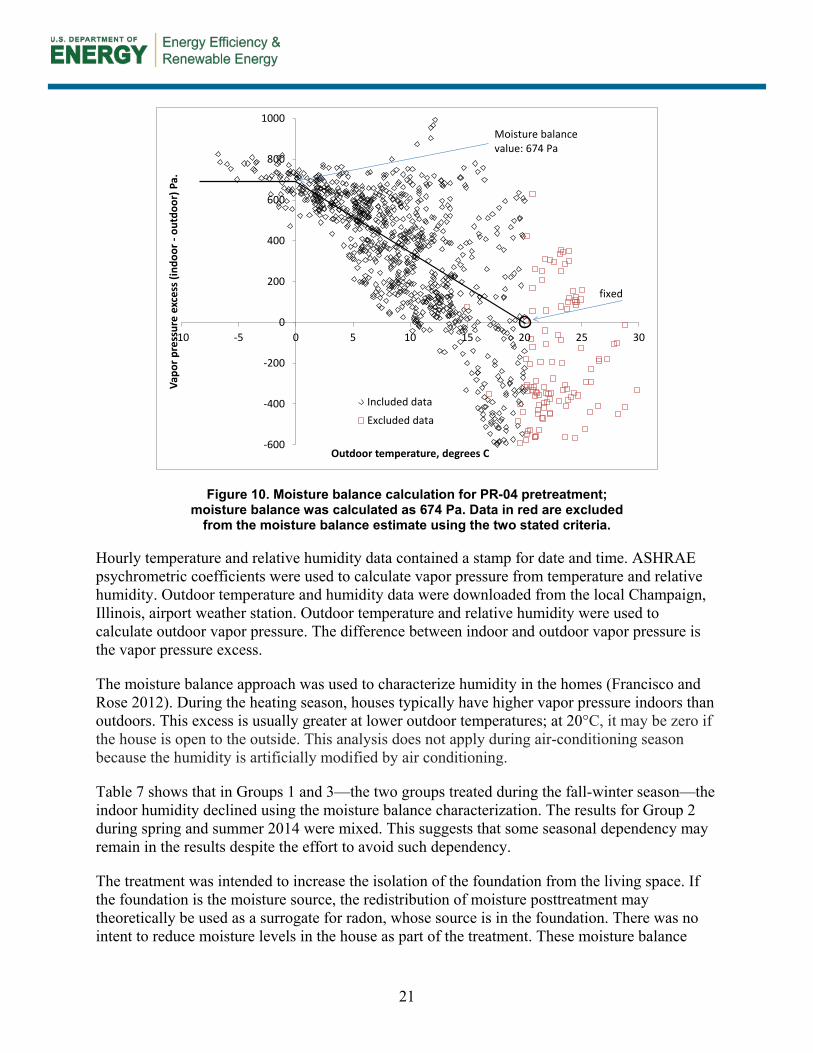
The International Energy Agency Annex 41 developed International Organization for Standardization 13788, which defined climate classes as inputs for hygrothermal modeling (see Figure 9). In the present study, the same approach is turned around. Vapor pressure excess is plotted against outdoor temperature. A linear regression of the data where outdoor temperature is 0°–20°C is constructed, which is fixed as 0 vapor pressure difference at 20°C. The value of vapor pressure excess where the regression line intersects the 0°C axis is used to define the moisture balance for data of 0°–20°C. For outdoor temperatures lower than 0°C the average vapor pressure excess is calculated as a second input. The final value for moisture balance is based on these two inputs, weighted for the number of values contributing to each (see Figure 10). A visual basic program for making this calculation is shown in Appendix C. Hourly data were excluded under two conditions:
The outdoor temperature was warmer than 20°C. This excluded data with outdoor air temperature warmer than 20°C.
The hourly data occurred when 16 or more hours in that day had an outdoor temperature warmer than 20°C. This was predicated on the assumption that during warm days the cooler nighttime hours would be affected by dehumidification offered by (daytime) air conditioning. It excluded data about mechanically lowered humidity even though the outdoor air temperature was lower than 20°C.
This means of analysis allows comparison of vapor pressure excess at different temperatures during the heating season. The primary disadvantage is that cooling season data are ignored.
Figure 9. Climate classes as defined under International Organization for Standardization 13788
21
Figure 10. Moisture balance calculation for PR-04 pretreatment; moisture balance was calculated as 674 Pa. Data in red are excluded
from the moisture balance estimate using the two stated criteria.
Hourly temperature and relative humidity data contained a stamp for date and time. ASHRAE psychrometric coefficients were used to calculate vapor pressure from temperature and relative humidity. Outdoor temperature and humidity data were downloaded from the local Champaign, Illinois, airport weather station. Outdoor temperature and relative humidity were used to calculate outdoor vapor pressure. The difference between indoor and outdoor vapor pressure is the vapor pressure excess.
The moisture balance approach was used to characterize humidity in the homes (Francisco and Rose 2012). During the heating season, houses typically have higher vapor pressure indoors than outdoors. This excess is usually greater at lower outdoor temperatures; at 20°C, it may be zero if the house is open to the outside. This analysis does not apply during air-conditioning season because the humidity is artificially modified by air conditioning.
Table 7 shows that in Groups 1 and 3—the two groups treated during the fall-winter season—the indoor humidity declined using the moisture balance characterization. The results for Group 2 during spring and summer 2014 were mixed. This suggests that some seasonal dependency may remain in the results despite the effort to avoid such dependency.
The treatment was intended to increase the isolation of the foundation from the living space. If the foundation is the moisture source, the redistribution of moisture posttreatment may theoretically be used as a surrogate for radon, whose source is in the foundation. There was no intent to reduce moisture levels in the house as part of the treatment. These moisture balance
-600
-400
-200
0
200
400
600
800
1000
-10 -5 0 5 10 15 20 25 30
Vapo
r pre
ssur
e ex
cess
(ind
oor -
outd
oor)
Pa.
Outdoor temperature, degrees C
Included data
Excluded data
Moisture balance value: 674 Pa
fixed

22
results suggest that factors other than treatment are important for defining moisture levels in the foundation and living space. If moisture levels are determined largely by factors other than treatment, perhaps radon levels may be as well.
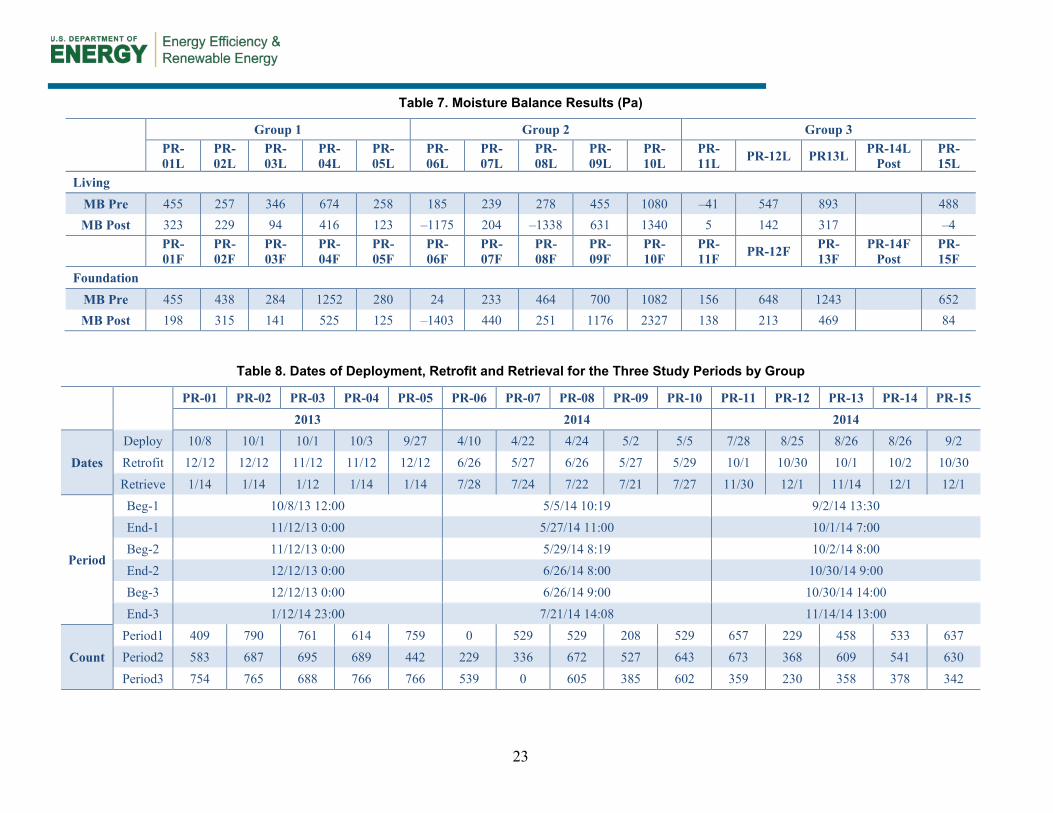
3.4 Radon 3.4.1 Study Dates Table 8 shows the dates of the study. Monitors were deployed and retrieved on the dates shown. The retrofit date for each house is shown. The table also shows the beginning and end dates that were selected for each of the three periods in each of the three study groups. The number “count” of hours of data collection represents the count of simultaneous living-level and foundation readings.
The dates for retrofit occurred with approximately 1 month of difference for the individual members within a group. The aim was to establish control periods (see Section 3.4.2). Individual houses were selected for date of retrofit as a matter of convenience for the occupants.
23
Table 7. Moisture Balance Results (Pa)
Group 1 Group 2 Group 3 PR-01L
PR-02L
PR-03L
PR-04L
PR-05L
PR-06L
PR-07L
PR-08L
PR-09L
PR-10L
PR-11L PR-12L PR13L PR-14L
Post PR-15L
Living MB Pre 455 257 346 674 258 185 239 278 455 1080 –41 547 893 488 MB Post 323 229 94 416 123 –1175 204 –1338 631 1340 5 142 317 –4
PR-01F
PR-02F
PR-03F
PR-04F
PR-05F
PR-06F
PR-07F
PR-08F
PR-09F
PR-10F
PR-11F PR-12F PR-
13F PR-14F
Post PR-15F
Foundation MB Pre 455 438 284 1252 280 24 233 464 700 1082 156 648 1243 652 MB Post 198 315 141 525 125 –1403 440 251 1176 2327 138 213 469 84
Table 8. Dates of Deployment, Retrofit and Retrieval for the Three Study Periods by Group
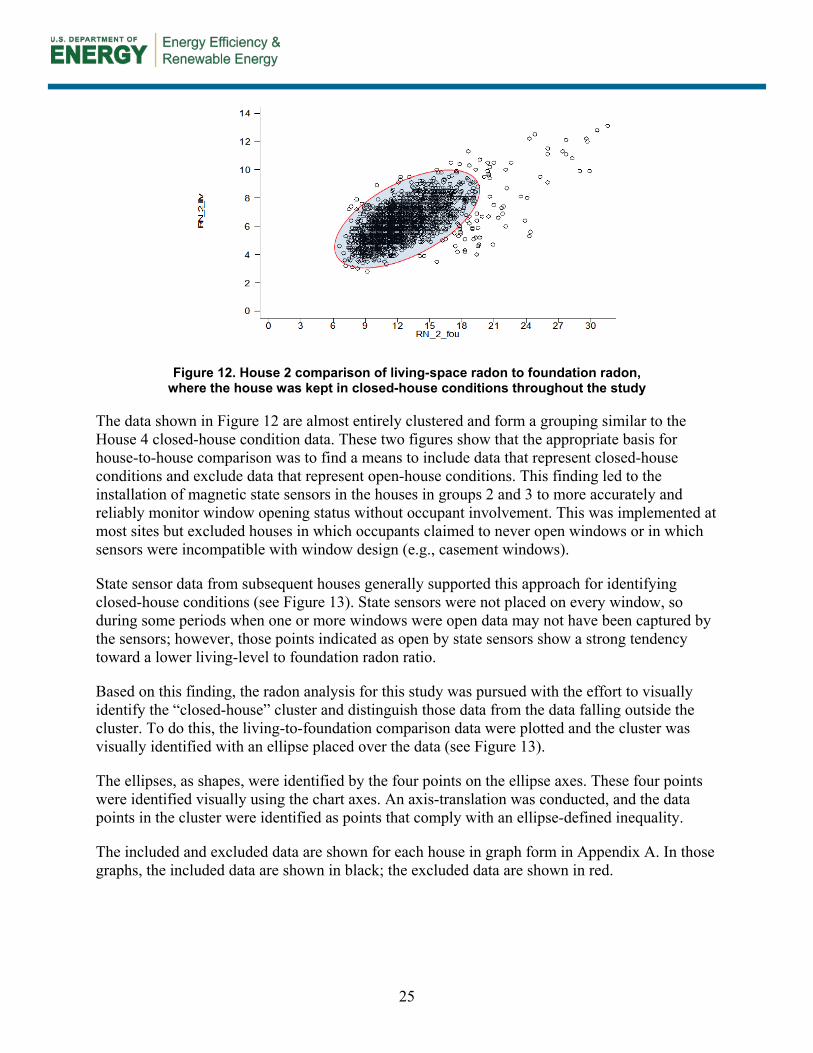
PR-01 PR-02 PR-03 PR-04 PR-05 PR-06 PR-07 PR-08 PR-09 PR-10 PR-11 PR-12 PR-13 PR-14 PR-15
2013 2014 2014
Dates Deploy 10/8 10/1 10/1 10/3 9/27 4/10 4/22 4/24 5/2 5/5 7/28 8/25 8/26 8/26 9/2 Retrofit 12/12 12/12 11/12 11/12 12/12 6/26 5/27 6/26 5/27 5/29 10/1 10/30 10/1 10/2 10/30 Retrieve 1/14 1/14 1/12 1/14 1/14 7/28 7/24 7/22 7/21 7/27 11/30 12/1 11/14 12/1 12/1
Period
Beg-1 10/8/13 12:00 5/5/14 10:19 9/2/14 13:30 End-1 11/12/13 0:00 5/27/14 11:00 10/1/14 7:00 Beg-2 11/12/13 0:00 5/29/14 8:19 10/2/14 8:00 End-2 12/12/13 0:00 6/26/14 8:00 10/30/14 9:00 Beg-3 12/12/13 0:00 6/26/14 9:00 10/30/14 14:00 End-3 1/12/14 23:00 7/21/14 14:08 11/14/14 13:00
Count Period1 409 790 761 614 759 0 529 529 208 529 657 229 458 533 637 Period2 583 687 695 689 442 229 336 672 527 643 673 368 609 541 630 Period3 754 765 688 766 766 539 0 605 385 602 359 230 358 378 342

24
3.4.2 Data Selection Protocols for making radon concentration measurements usually contain a requirement for maintaining “closed-house conditions” for the duration of the test. To overcome the error associated with short-term measurement variability, this study extended over a 3-month period. For Group 1, some occupants provided information about when their houses were open and when they were closed. The most useful of these were at Site PR-02, which the resident indicated was always in closed-house conditions, and Site PR-04, for which the resident provided detailed logs of when windows were open.
Occupant records provided a comparison of the living-space radon concentration to foundation radon concentration that was conducted for House 4. The results are shown in Figure 11. Data with windows closed are noted as “1”; data with windows open are noted as “0.”
Figure 11. House PR-04 radon levels, living space compared to foundation. Data points shown as “0” represent time when the occupant had the building in “open” condition
The effect of having windows open in the house is readily apparent in the figure. Open-house conditions lead to low radon readings for the living space, as expected. How then should the houses be compared if the house-open time varies from house to house and depends on occupant behavior?
The results from House 2 are shown in Figure 12. The occupant stated that the house remained closed during the entire study period; the clustering of data support that claim.
25
Figure 12. House 2 comparison of living-space radon to foundation radon, where the house was kept in closed-house conditions throughout the study
The data shown in Figure 12 are almost entirely clustered and form a grouping similar to the House 4 closed-house condition data. These two figures show that the appropriate basis for house-to-house comparison was to find a means to include data that represent closed-house conditions and exclude data that represent open-house conditions. This finding led to the installation of magnetic state sensors in the houses in groups 2 and 3 to more accurately and reliably monitor window opening status without occupant involvement. This was implemented at most sites but excluded houses in which occupants claimed to never open windows or in which sensors were incompatible with window design (e.g., casement windows).
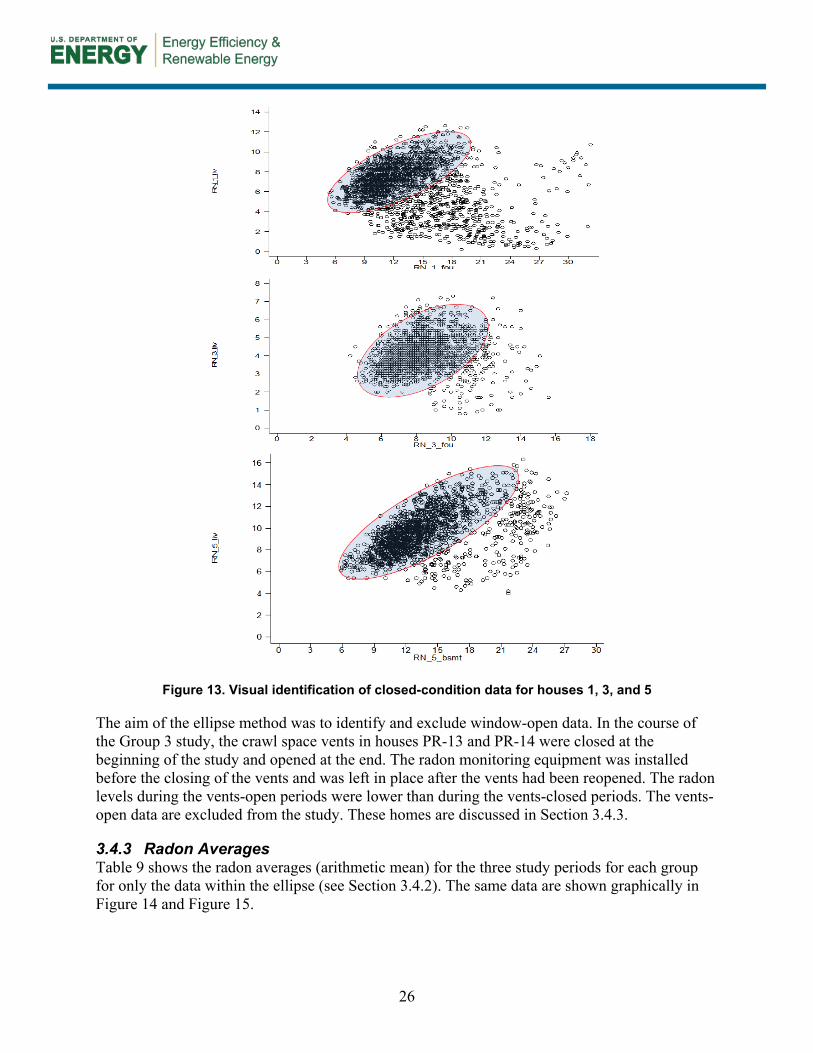
State sensor data from subsequent houses generally supported this approach for identifying closed-house conditions (see Figure 13). State sensors were not placed on every window, so during some periods when one or more windows were open data may not have been captured by the sensors; however, those points indicated as open by state sensors show a strong tendency toward a lower living-level to foundation radon ratio.
Based on this finding, the radon analysis for this study was pursued with the effort to visually identify the “closed-house” cluster and distinguish those data from the data falling outside the cluster. To do this, the living-to-foundation comparison data were plotted and the cluster was visually identified with an ellipse placed over the data (see Figure 13).
The ellipses, as shapes, were identified by the four points on the ellipse axes. These four points were identified visually using the chart axes. An axis-translation was conducted, and the data points in the cluster were identified as points that comply with an ellipse-defined inequality.
The included and excluded data are shown for each house in graph form in Appendix A. In those graphs, the included data are shown in black; the excluded data are shown in red.
26
Figure 13. Visual identification of closed-condition data for houses 1, 3, and 5
The aim of the ellipse method was to identify and exclude window-open data. In the course of the Group 3 study, the crawl space vents in houses PR-13 and PR-14 were closed at the beginning of the study and opened at the end. The radon monitoring equipment was installed before the closing of the vents and was left in place after the vents had been reopened. The radon levels during the vents-open periods were lower than during the vents-closed periods. The vents-open data are excluded from the study. These homes are discussed in Section 3.4.3.
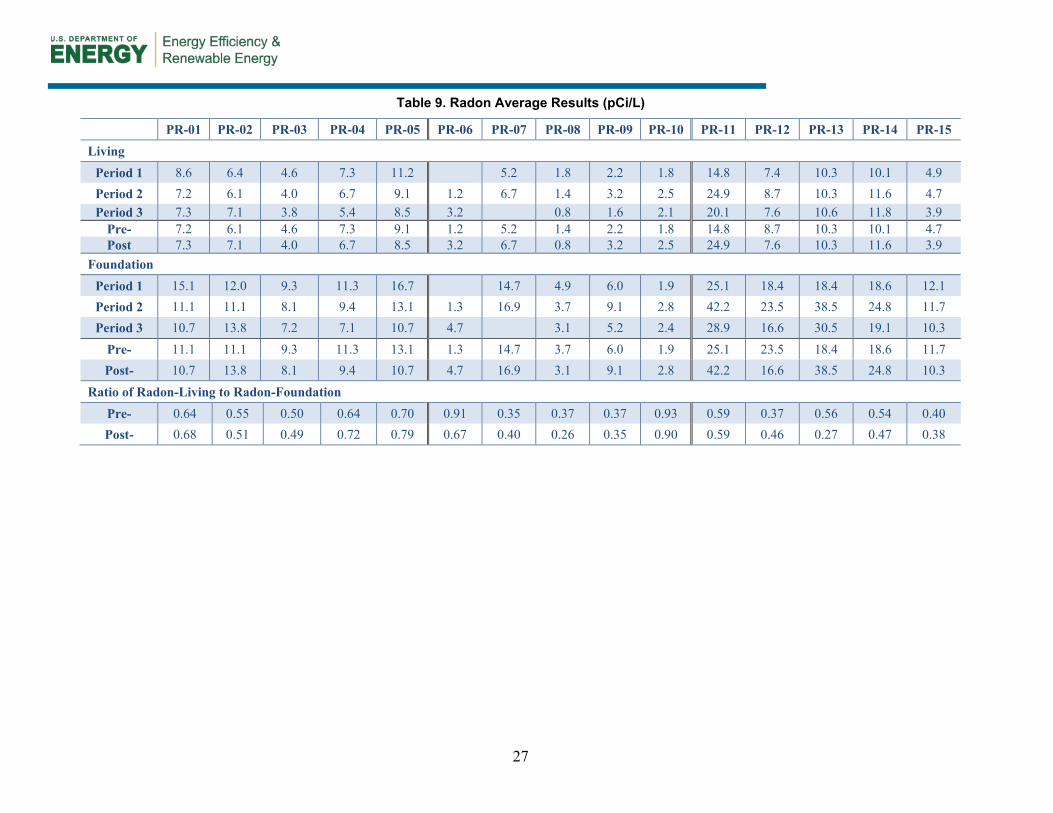
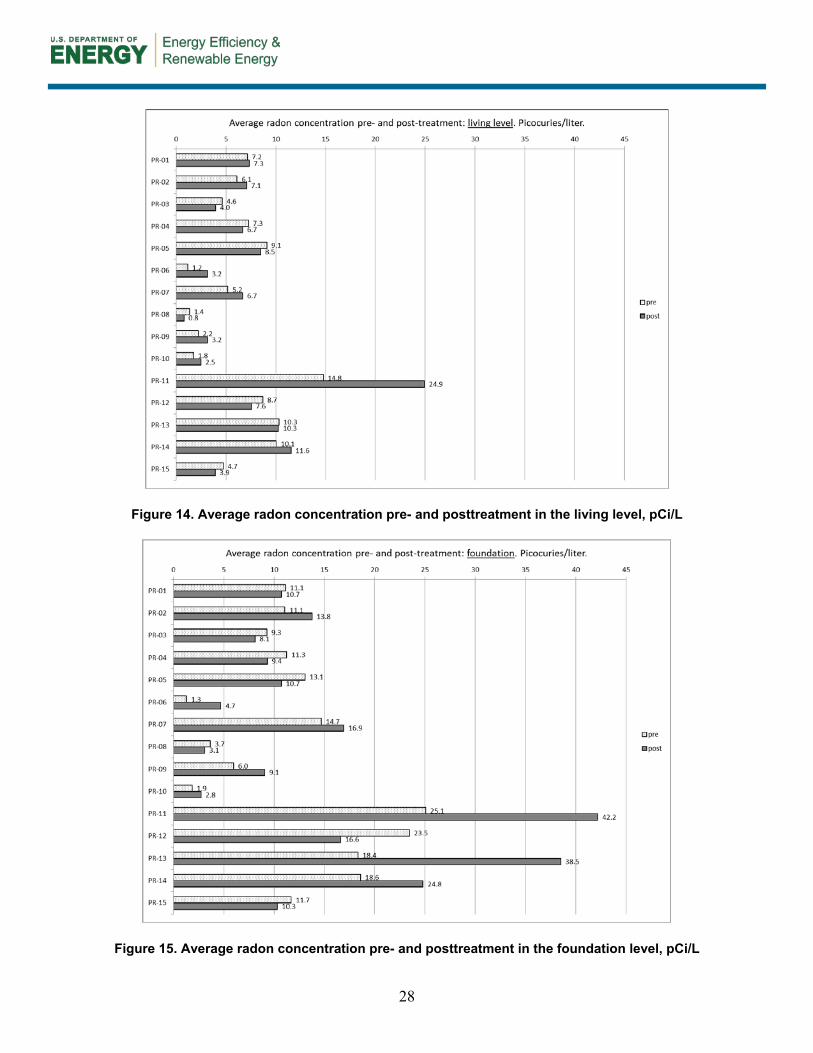
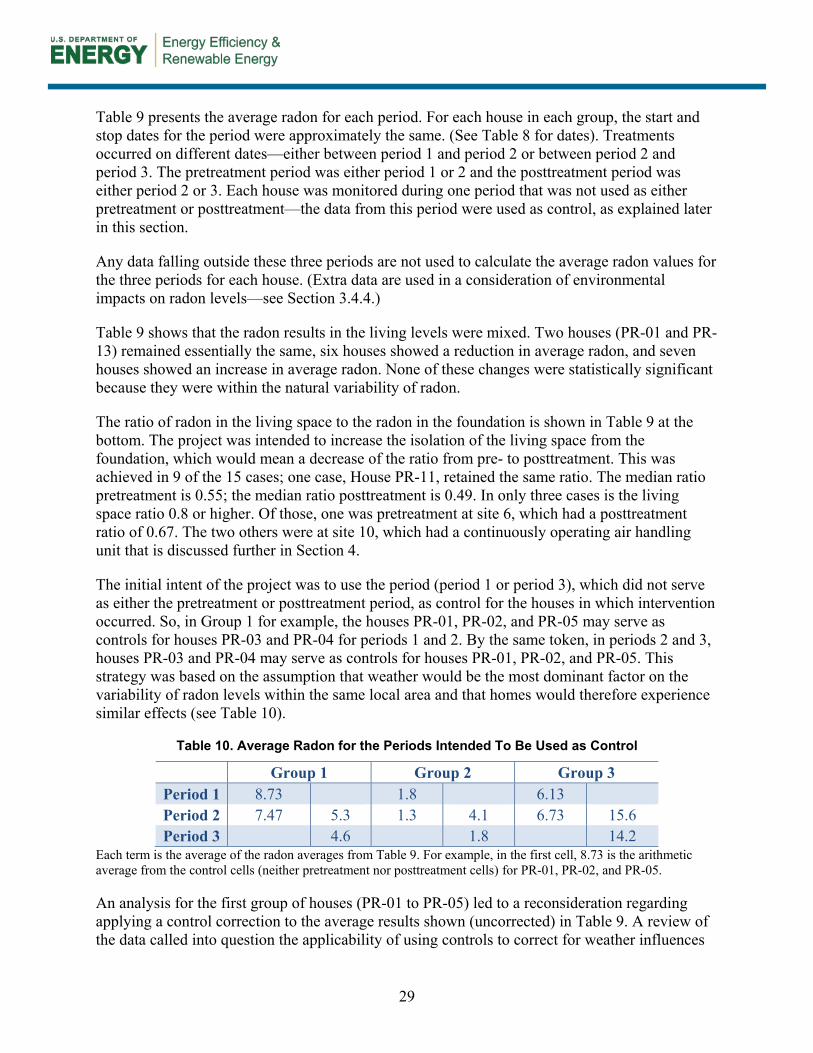
3.4.3 Radon Averages Table 9 shows the radon averages (arithmetic mean) for the three study periods for each group for only the data within the ellipse (see Section 3.4.2). The same data are shown graphically in Figure 14 and Figure 15.
27
Table 9. Radon Average Results (pCi/L)
PR-01 PR-02 PR-03 PR-04 PR-05 PR-06 PR-07 PR-08 PR-09 PR-10 PR-11 PR-12 PR-13 PR-14 PR-15 Living
Period 1 8.6 6.4 4.6 7.3 11.2 5.2 1.8 2.2 1.8 14.8 7.4 10.3 10.1 4.9 Period 2 7.2 6.1 4.0 6.7 9.1 1.2 6.7 1.4 3.2 2.5 24.9 8.7 10.3 11.6 4.7 Period 3 7.3 7.1 3.8 5.4 8.5 3.2 0.8 1.6 2.1 20.1 7.6 10.6 11.8 3.9
Pre- 7.2 6.1 4.6 7.3 9.1 1.2 5.2 1.4 2.2 1.8 14.8 8.7 10.3 10.1 4.7 Post 7.3 7.1 4.0 6.7 8.5 3.2 6.7 0.8 3.2 2.5 24.9 7.6 10.3 11.6 3.9
Foundation Period 1 15.1 12.0 9.3 11.3 16.7 14.7 4.9 6.0 1.9 25.1 18.4 18.4 18.6 12.1 Period 2 11.1 11.1 8.1 9.4 13.1 1.3 16.9 3.7 9.1 2.8 42.2 23.5 38.5 24.8 11.7 Period 3 10.7 13.8 7.2 7.1 10.7 4.7 3.1 5.2 2.4 28.9 16.6 30.5 19.1 10.3
Pre- 11.1 11.1 9.3 11.3 13.1 1.3 14.7 3.7 6.0 1.9 25.1 23.5 18.4 18.6 11.7 Post- 10.7 13.8 8.1 9.4 10.7 4.7 16.9 3.1 9.1 2.8 42.2 16.6 38.5 24.8 10.3
Ratio of Radon-Living to Radon-Foundation Pre- 0.64 0.55 0.50 0.64 0.70 0.91 0.35 0.37 0.37 0.93 0.59 0.37 0.56 0.54 0.40 Post- 0.68 0.51 0.49 0.72 0.79 0.67 0.40 0.26 0.35 0.90 0.59 0.46 0.27 0.47 0.38
28
Figure 14. Average radon concentration pre- and posttreatment in the living level, pCi/L
Figure 15. Average radon concentration pre- and posttreatment in the foundation level, pCi/L
29
Table 9 presents the average radon for each period. For each house in each group, the start and stop dates for the period were approximately the same. (See Table 8 for dates). Treatments occurred on different dates—either between period 1 and period 2 or between period 2 and period 3. The pretreatment period was either period 1 or 2 and the posttreatment period was either period 2 or 3. Each house was monitored during one period that was not used as either pretreatment or posttreatment—the data from this period were used as control, as explained later in this section.
Any data falling outside these three periods are not used to calculate the average radon values for the three periods for each house. (Extra data are used in a consideration of environmental impacts on radon levels—see Section 3.4.4.)
Table 9 shows that the radon results in the living levels were mixed. Two houses (PR-01 and PR-13) remained essentially the same, six houses showed a reduction in average radon, and seven houses showed an increase in average radon. None of these changes were statistically significant because they were within the natural variability of radon.
The ratio of radon in the living space to the radon in the foundation is shown in Table 9 at the bottom. The project was intended to increase the isolation of the living space from the foundation, which would mean a decrease of the ratio from pre- to posttreatment. This was achieved in 9 of the 15 cases; one case, House PR-11, retained the same ratio. The median ratio pretreatment is 0.55; the median ratio posttreatment is 0.49. In only three cases is the living space ratio 0.8 or higher. Of those, one was pretreatment at site 6, which had a posttreatment ratio of 0.67. The two others were at site 10, which had a continuously operating air handling unit that is discussed further in Section 4.
The initial intent of the project was to use the period (period 1 or period 3), which did not serve as either the pretreatment or posttreatment period, as control for the houses in which intervention occurred. So, in Group 1 for example, the houses PR-01, PR-02, and PR-05 may serve as controls for houses PR-03 and PR-04 for periods 1 and 2. By the same token, in periods 2 and 3, houses PR-03 and PR-04 may serve as controls for houses PR-01, PR-02, and PR-05. This strategy was based on the assumption that weather would be the most dominant factor on the variability of radon levels within the same local area and that homes would therefore experience similar effects (see Table 10).
Table 10. Average Radon for the Periods Intended To Be Used as Control
Group 1 Group 2 Group 3 Period 1 8.73 1.8 6.13 Period 2 7.47 5.3 1.3 4.1 6.73 15.6 Period 3 4.6 1.8 14.2
Each term is the average of the radon averages from Table 9. For example, in the first cell, 8.73 is the arithmetic average from the control cells (neither pretreatment nor posttreatment cells) for PR-01, PR-02, and PR-05.
An analysis for the first group of houses (PR-01 to PR-05) led to a reconsideration regarding applying a control correction to the average results shown (uncorrected) in Table 9. A review of the data called into question the applicability of using controls to correct for weather influences
30
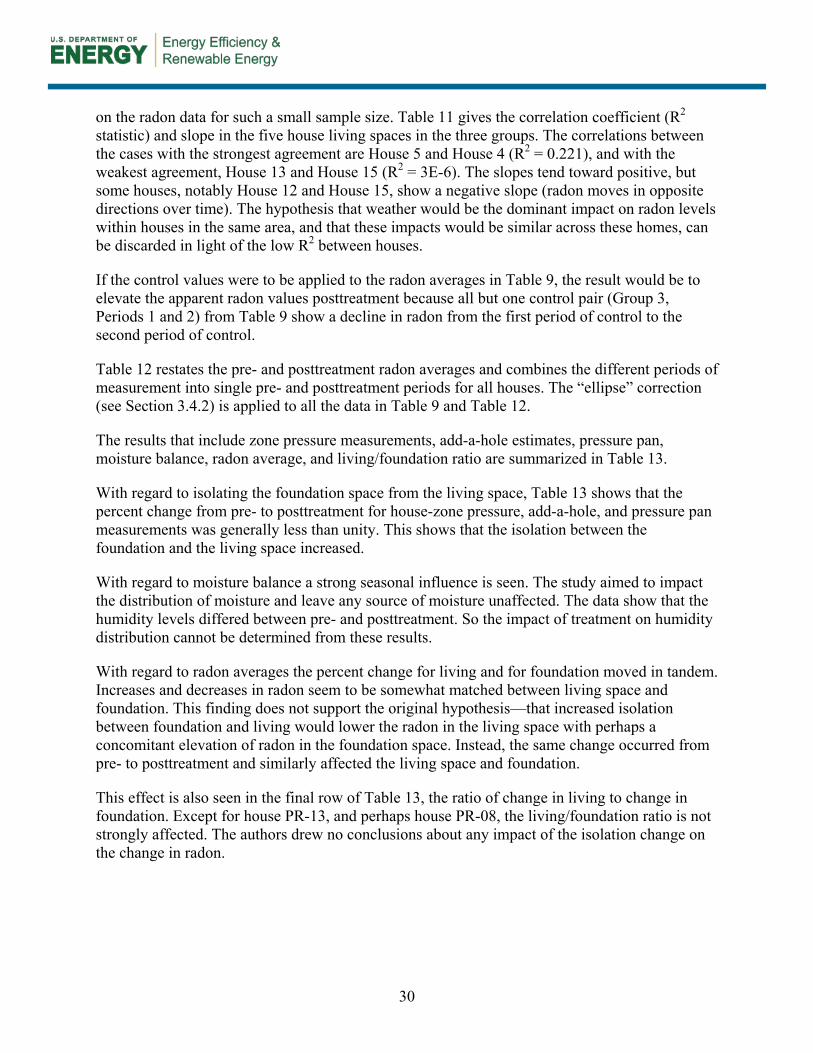
on the radon data for such a small sample size. Table 11 gives the correlation coefficient (R2 statistic) and slope in the five house living spaces in the three groups. The correlations between the cases with the strongest agreement are House 5 and House 4 (R2 = 0.221), and with the weakest agreement, House 13 and House 15 (R2 = 3E-6). The slopes tend toward positive, but some houses, notably House 12 and House 15, show a negative slope (radon moves in opposite directions over time). The hypothesis that weather would be the dominant impact on radon levels within houses in the same area, and that these impacts would be similar across these homes, can be discarded in light of the low R2 between houses.
If the control values were to be applied to the radon averages in Table 9, the result would be to elevate the apparent radon values posttreatment because all but one control pair (Group 3, Periods 1 and 2) from Table 9 show a decline in radon from the first period of control to the second period of control.
Table 12 restates the pre- and posttreatment radon averages and combines the different periods of measurement into single pre- and posttreatment periods for all houses. The “ellipse” correction (see Section 3.4.2) is applied to all the data in Table 9 and Table 12.
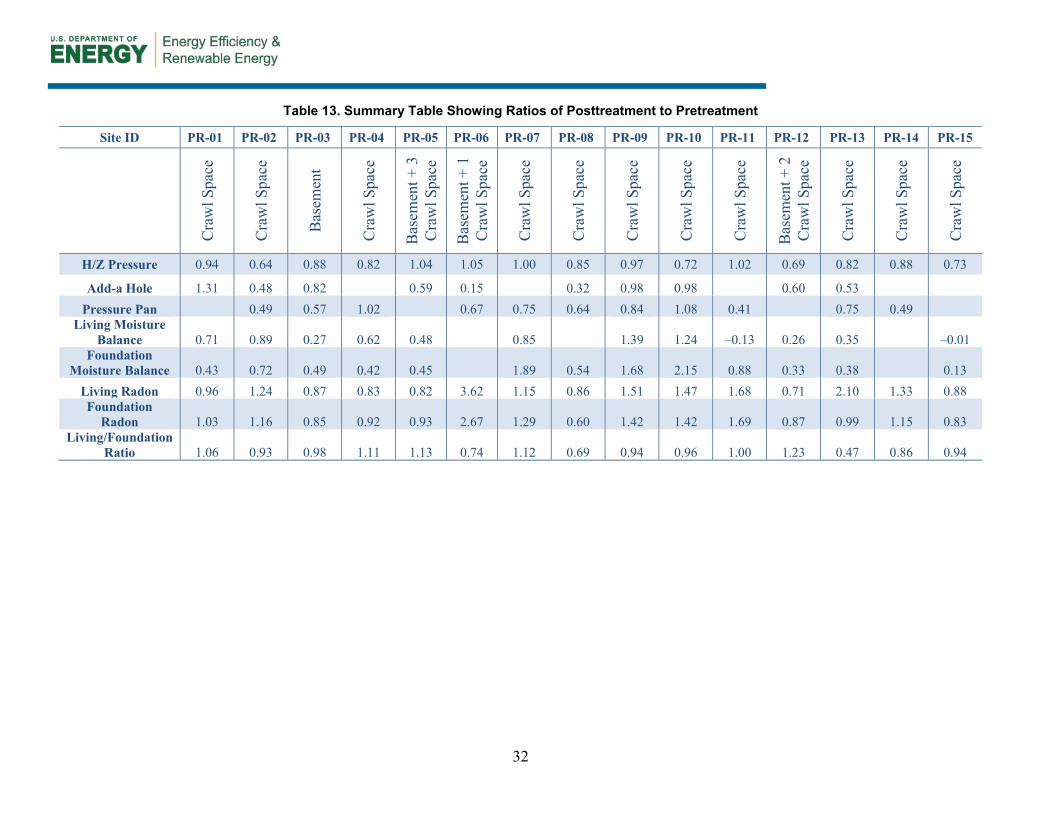
The results that include zone pressure measurements, add-a-hole estimates, pressure pan, moisture balance, radon average, and living/foundation ratio are summarized in Table 13.
With regard to isolating the foundation space from the living space, Table 13 shows that the percent change from pre- to posttreatment for house-zone pressure, add-a-hole, and pressure pan measurements was generally less than unity. This shows that the isolation between the foundation and the living space increased.
With regard to moisture balance a strong seasonal influence is seen. The study aimed to impact the distribution of moisture and leave any source of moisture unaffected. The data show that the humidity levels differed between pre- and posttreatment. So the impact of treatment on humidity distribution cannot be determined from these results.
With regard to radon averages the percent change for living and for foundation moved in tandem. Increases and decreases in radon seem to be somewhat matched between living space and foundation. This finding does not support the original hypothesis—that increased isolation between foundation and living would lower the radon in the living space with perhaps a concomitant elevation of radon in the foundation space. Instead, the same change occurred from pre- to posttreatment and similarly affected the living space and foundation.
This effect is also seen in the final row of Table 13, the ratio of change in living to change in foundation. Except for house PR-13, and perhaps house PR-08, the living/foundation ratio is not strongly affected. The authors drew no conclusions about any impact of the isolation change on the change in radon.
31
Table 11. R2 and Slope, Comparing Living-Level Radon Average
R2 PR-02 PR-03 PR-04 PR-05 PR-07 PR-08 PR-09 PR-10 PR-12 PR-13 PR-14 PR-15 0.051 0.007 0.040 0.028 PR-01 0.074 0.0002 0.013 0.075 PR-06 0.022 0.015 3E-05 0.019 PR-11
0.002 0.025 0.030 PR-02 0.016 0.067 0.128 PR-07 0.018 0.02 0.118 PR-12
6 E-05 0.008 PR-03 0.031 0.0002 PR-08 0.070 3E-06 PR-13
0.221 PR-04 0.038 PR-09 0.025 PR-14 Slope
0.336 0.192 0.217 0.138 PR-01 0.478 0.026 –0.17 1.056 PR-06 0.135 –0.15 –0.006 0.563 PR-11
–0.08 0.114 0.095 PR-02 –0.21 0.262 0.855 PR-07 –0.18 0.165 –1.58 PR-12
0.004 0.032 PR-03 -0.11 0.021 PR-08 0.226 0.006 PR-13
0.356 PR-04 0.455 PR-09 –0.62 PR-14
Table 12. Restatement of Radon Levels Pre- and Posttreatment
Radon, Corrected, Living Pre 7.2 6.1 4.6 7.3 9.1 1.2 5.2 1.4 2.2 1.8 14.8 8.7 10.3 10.1 4.7 Post 7.3 7.1 4.0 6.7 8.5 3.2 6.7 0.8 3.2 2.5 24.9 7.6 10.3 11.6 3.9
Radon, Corrected, Foundation Pre 11.1 11.1 9.3 11.3 13.1 1.3 14.7 3.7 6.0 1.9 25.1 23.5 18.4 18.6 11.7 Post 10.7 13.8 8.1 9.4 10.7 4.7 16.9 3.1 9.1 2.8 42.2 16.6 38.5 24.8 10.3
32
Table 13. Summary Table Showing Ratios of Posttreatment to Pretreatment
Site ID PR-01 PR-02 PR-03 PR-04 PR-05 PR-06 PR-07 PR-08 PR-09 PR-10 PR-11 PR-12 PR-13 PR-14 PR-15
C
raw
l Spa
ce
Cra
wl S
pace
Bas
emen
t
Cra
wl S
pace
Bas
emen
t + 3
C
raw
l Spa
ce
Bas
emen
t + 1
C
raw
l Spa
ce
Cra
wl S
pace
Cra
wl S
pace
Cra
wl S
pace
Cra
wl S
pace
Cra
wl S
pace
Bas
emen
t + 2
C
raw
l Spa
ce
Cra
wl S
pace
Cra
wl S
pace
Cra
wl S
pace
H/Z Pressure 0.94 0.64 0.88 0.82 1.04 1.05 1.00 0.85 0.97 0.72 1.02 0.69 0.82 0.88 0.73
Add-a Hole 1.31 0.48 0.82
0.59 0.15
0.32 0.98 0.98
0.60 0.53 Pressure Pan
0.49 0.57 1.02
0.67 0.75 0.64 0.84 1.08 0.41
0.75 0.49
Living Moisture Balance 0.71 0.89 0.27 0.62 0.48
0.85
1.39 1.24 –0.13 0.26 0.35
–0.01
Foundation Moisture Balance 0.43 0.72 0.49 0.42 0.45
1.89 0.54 1.68 2.15 0.88 0.33 0.38
0.13
Living Radon 0.96 1.24 0.87 0.83 0.82 3.62 1.15 0.86 1.51 1.47 1.68 0.71 2.10 1.33 0.88 Foundation
Radon 1.03 1.16 0.85 0.92 0.93 2.67 1.29 0.60 1.42 1.42 1.69 0.87 0.99 1.15 0.83 Living/Foundation
Ratio 1.06 0.93 0.98 1.11 1.13 0.74 1.12 0.69 0.94 0.96 1.00 1.23 0.47 0.86 0.94
33
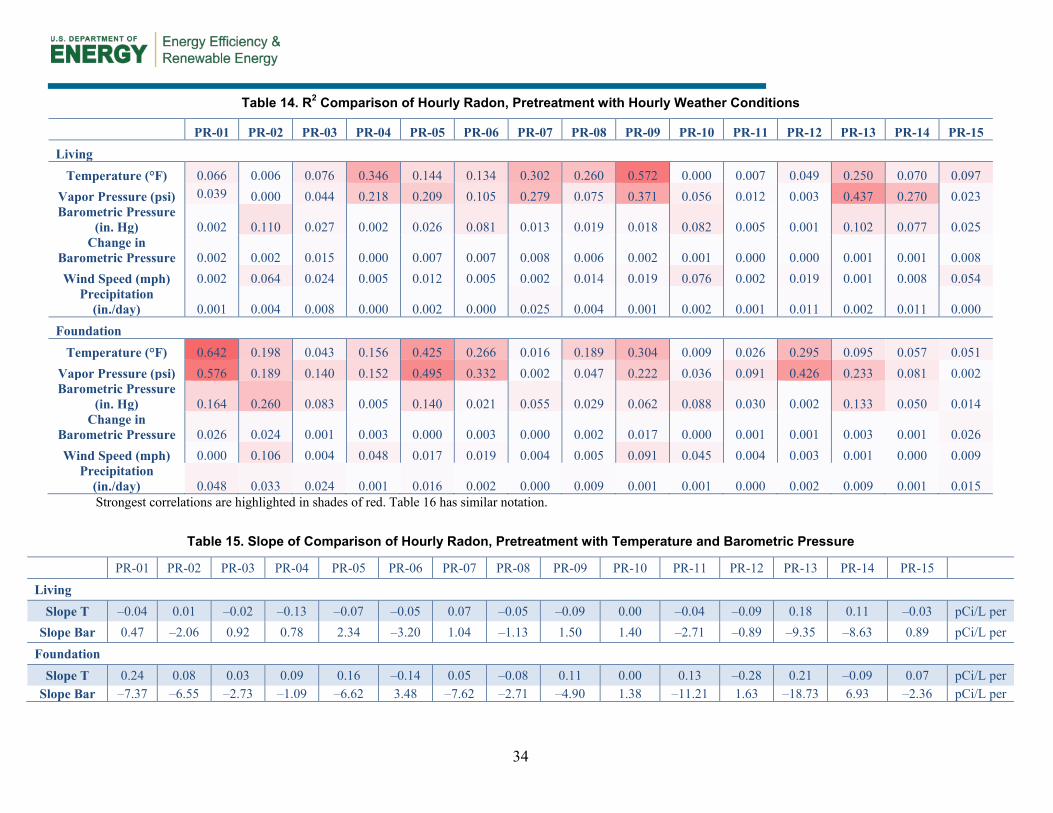
3.4.4 Correlation of Radon Readings with Weather Conditions Temperature. Local Champaign area weather data were collected from a University of Illinois weather monitoring site. Hourly radon readings were compared to concurrent values of outdoor temperature (dry bulb), vapor pressure, barometric pressure, and changes in barometric pressure, wind speed, and precipitation.
This comparison includes all the data. The date of retrofit is used to distinguish pretreatment (Table 14 and Table 15) from posttreatment (Table 16 and Table 17).
Some of the radon data show a high correlation with outdoor temperature—those with dark red formatting. Vapor pressure also shows some correlation with radon, but vapor pressure tends to correlate with outdoor air temperature because the upper limit of vapor pressure is a function of temperature. Radon also correlates weakly with barometric pressure. The nature of the barometric pressure relationship is seen in Table 15 and Table 17, which show the slope as sometimes positive and sometimes negative.
Of these effects, temperature appears to be strongest with foundation radon concentration. Both pre- and posttreatment, 11 of 15 foundations show a positive slope of foundation radon against outdoor air temperature. Those houses with the strongest R2 show a positive slope. This runs counter to the common assumption that indoor radon levels increase with colder outdoor air temperatures.
34
Table 14. R2 Comparison of Hourly Radon, Pretreatment with Hourly Weather Conditions
PR-01 PR-02 PR-03 PR-04 PR-05 PR-06 PR-07 PR-08 PR-09 PR-10 PR-11 PR-12 PR-13 PR-14 PR-15
Living Temperature (°F) 0.066 0.006 0.076 0.346 0.144 0.134 0.302 0.260 0.572 0.000 0.007 0.049 0.250 0.070 0.097
Vapor Pressure (psi) 0.039 0.000 0.044 0.218 0.209 0.105 0.279 0.075 0.371 0.056 0.012 0.003 0.437 0.270 0.023 Barometric Pressure
(in. Hg) 0.002 0.110 0.027 0.002 0.026 0.081 0.013 0.019 0.018 0.082 0.005 0.001 0.102 0.077 0.025 Change in
Barometric Pressure 0.002 0.002 0.015 0.000 0.007 0.007 0.008 0.006 0.002 0.001 0.000 0.000 0.001 0.001 0.008 Wind Speed (mph) 0.002 0.064 0.024 0.005 0.012 0.005 0.002 0.014 0.019 0.076 0.002 0.019 0.001 0.008 0.054
Precipitation (in./day) 0.001 0.004 0.008 0.000 0.002 0.000 0.025 0.004 0.001 0.002 0.001 0.011 0.002 0.011 0.000
Foundation Temperature (°F) 0.642 0.198 0.043 0.156 0.425 0.266 0.016 0.189 0.304 0.009 0.026 0.295 0.095 0.057 0.051
Vapor Pressure (psi) 0.576 0.189 0.140 0.152 0.495 0.332 0.002 0.047 0.222 0.036 0.091 0.426 0.233 0.081 0.002 Barometric Pressure
(in. Hg) 0.164 0.260 0.083 0.005 0.140 0.021 0.055 0.029 0.062 0.088 0.030 0.002 0.133 0.050 0.014 Change in
Barometric Pressure 0.026 0.024 0.001 0.003 0.000 0.003 0.000 0.002 0.017 0.000 0.001 0.001 0.003 0.001 0.026 Wind Speed (mph) 0.000 0.106 0.004 0.048 0.017 0.019 0.004 0.005 0.091 0.045 0.004 0.003 0.001 0.000 0.009
Precipitation (in./day) 0.048 0.033 0.024 0.001 0.016 0.002 0.000 0.009 0.001 0.001 0.000 0.002 0.009 0.001 0.015 Strongest correlations are highlighted in shades of red. Table 16 has similar notation.
Table 15. Slope of Comparison of Hourly Radon, Pretreatment with Temperature and Barometric Pressure
PR-01 PR-02 PR-03 PR-04 PR-05 PR-06 PR-07 PR-08 PR-09 PR-10 PR-11 PR-12 PR-13 PR-14 PR-15 Living
Slope T –0.04 0.01 –0.02 –0.13 –0.07 –0.05 0.07 –0.05 –0.09 0.00 –0.04 –0.09 0.18 0.11 –0.03 pCi/L per Slope Bar 0.47 –2.06 0.92 0.78 2.34 –3.20 1.04 –1.13 1.50 1.40 –2.71 –0.89 –9.35 –8.63 0.89 pCi/L per
Foundation Slope T 0.24 0.08 0.03 0.09 0.16 –0.14 0.05 –0.08 0.11 0.00 0.13 –0.28 0.21 –0.09 0.07 pCi/L per
Slope Bar –7.37 –6.55 –2.73 –1.09 –6.62 3.48 –7.62 –2.71 –4.90 1.38 –11.21 1.63 –18.73 6.93 –2.36 pCi/L per
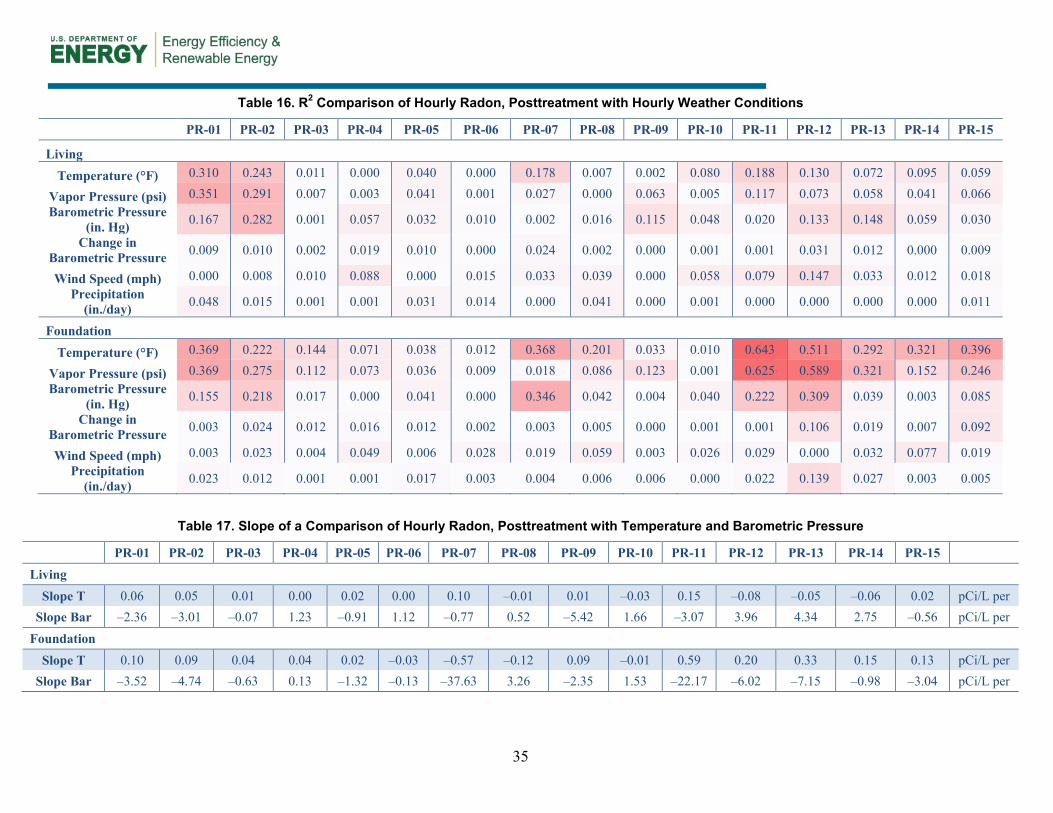
35
Table 16. R2 Comparison of Hourly Radon, Posttreatment with Hourly Weather Conditions
PR-01 PR-02 PR-03 PR-04 PR-05 PR-06 PR-07 PR-08 PR-09 PR-10 PR-11 PR-12 PR-13 PR-14 PR-15
Living Temperature (°F) 0.310 0.243 0.011 0.000 0.040 0.000 0.178 0.007 0.002 0.080 0.188 0.130 0.072 0.095 0.059
Vapor Pressure (psi) 0.351 0.291 0.007 0.003 0.041 0.001 0.027 0.000 0.063 0.005 0.117 0.073 0.058 0.041 0.066 Barometric Pressure
(in. Hg) 0.167 0.282 0.001 0.057 0.032 0.010 0.002 0.016 0.115 0.048 0.020 0.133 0.148 0.059 0.030
Change in Barometric Pressure 0.009 0.010 0.002 0.019 0.010 0.000 0.024 0.002 0.000 0.001 0.001 0.031 0.012 0.000 0.009
Wind Speed (mph) 0.000 0.008 0.010 0.088 0.000 0.015 0.033 0.039 0.000 0.058 0.079 0.147 0.033 0.012 0.018 Precipitation
(in./day) 0.048 0.015 0.001 0.001 0.031 0.014 0.000 0.041 0.000 0.001 0.000 0.000 0.000 0.000 0.011
Foundation Temperature (°F) 0.369 0.222 0.144 0.071 0.038 0.012 0.368 0.201 0.033 0.010 0.643 0.511 0.292 0.321 0.396
Vapor Pressure (psi) 0.369 0.275 0.112 0.073 0.036 0.009 0.018 0.086 0.123 0.001 0.625 0.589 0.321 0.152 0.246 Barometric Pressure
(in. Hg) 0.155 0.218 0.017 0.000 0.041 0.000 0.346 0.042 0.004 0.040 0.222 0.309 0.039 0.003 0.085
Change in Barometric Pressure 0.003 0.024 0.012 0.016 0.012 0.002 0.003 0.005 0.000 0.001 0.001 0.106 0.019 0.007 0.092
Wind Speed (mph) 0.003 0.023 0.004 0.049 0.006 0.028 0.019 0.059 0.003 0.026 0.029 0.000 0.032 0.077 0.019 Precipitation
(in./day) 0.023 0.012 0.001 0.001 0.017 0.003 0.004 0.006 0.006 0.000 0.022 0.139 0.027 0.003 0.005
Table 17. Slope of a Comparison of Hourly Radon, Posttreatment with Temperature and Barometric Pressure
PR-01 PR-02 PR-03 PR-04 PR-05 PR-06 PR-07 PR-08 PR-09 PR-10 PR-11 PR-12 PR-13 PR-14 PR-15 Living
Slope T 0.06 0.05 0.01 0.00 0.02 0.00 0.10 –0.01 0.01 –0.03 0.15 –0.08 –0.05 –0.06 0.02 pCi/L per Slope Bar –2.36 –3.01 –0.07 1.23 –0.91 1.12 –0.77 0.52 –5.42 1.66 –3.07 3.96 4.34 2.75 –0.56 pCi/L per
Foundation Slope T 0.10 0.09 0.04 0.04 0.02 –0.03 –0.57 –0.12 0.09 –0.01 0.59 0.20 0.33 0.15 0.13 pCi/L per
Slope Bar –3.52 –4.74 –0.63 0.13 –1.32 –0.13 –37.63 3.26 –2.35 1.53 –22.17 –6.02 –7.15 –0.98 –3.04 pCi/L per

36
Figure 16 shows the hourly correlation of foundation radon at House PR-01 with outdoor air temperature. The linear R2 is 0.642; the quadratic regression gives 0.6799.
Figure 16. Correlation of foundation radon at House PR-01 with outdoor air temperature.
Regression is second-order polynomial. R2 is higher for polynomial than for linear regression.
How can the apparent decrease in foundation radon at lower outdoor temperatures be explained? An increase in radon at lower temperatures might be expected given that (1) the house has thermal buoyancy, which would create negative air pressures at the lower parts of the house in colder weather, and (2) the exterior soil was capped from snow and ice, which enhanced the possibility of soil gas exchange with the warmer house foundation. Three effects that would contribute to the relationship that is seen are:
The increased thermal buoyancy led to a higher air exchange rate, which may have more than compensated for any increased radon entry.
The rate of radon diffusion decreased through soil gas at lower soil gas temperatures.
The porosity (pore volume) of the soil gas decreased corresponding to the well-documented increase in soil moisture content of colder soil.
A fourth possibility merits consideration: At lower temperature the soil moisture content increases. The increase may be met by liquid water from precipitation or from capillary water. It may also be met by phase change of water vapor contained in the soil gas into bound water. By vapor leaving the gas phase, a vacuum is created. If the molar volume of water vapor in soil gas is 1% (a conservative estimate) and if only 1% of this vapor changes phase to bound water, it
R² = 0.6799
5
10
15
20
25
30
35
0 10 20 30 40 50 60 70 80 90
Foun
datio
n ra
don
pCi/
L
Outdoor air temperature, degrees F
Correlation of foundation radon (house PR-1) with outdoor air temperature
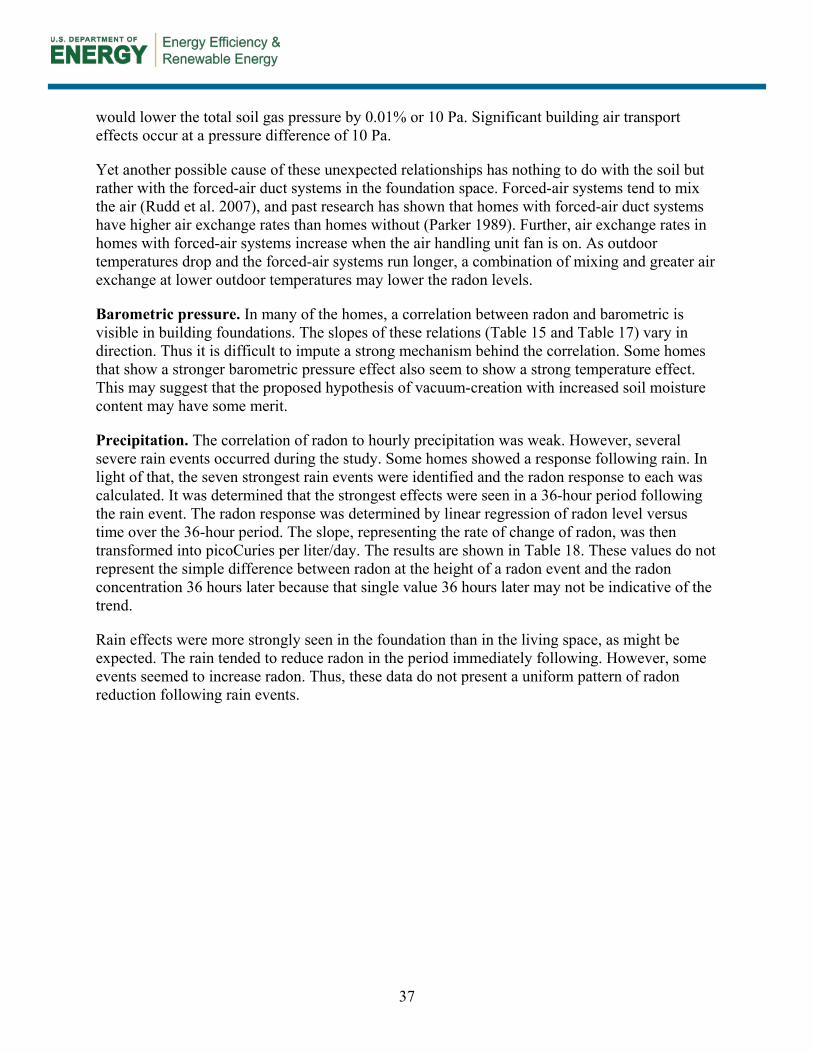
37
would lower the total soil gas pressure by 0.01% or 10 Pa. Significant building air transport effects occur at a pressure difference of 10 Pa.
Yet another possible cause of these unexpected relationships has nothing to do with the soil but rather with the forced-air duct systems in the foundation space. Forced-air systems tend to mix the air (Rudd et al. 2007), and past research has shown that homes with forced-air duct systems have higher air exchange rates than homes without (Parker 1989). Further, air exchange rates in homes with forced-air systems increase when the air handling unit fan is on. As outdoor temperatures drop and the forced-air systems run longer, a combination of mixing and greater air exchange at lower outdoor temperatures may lower the radon levels.
Barometric pressure. In many of the homes, a correlation between radon and barometric is visible in building foundations. The slopes of these relations (Table 15 and Table 17) vary in direction. Thus it is difficult to impute a strong mechanism behind the correlation. Some homes that show a stronger barometric pressure effect also seem to show a strong temperature effect. This may suggest that the proposed hypothesis of vacuum-creation with increased soil moisture content may have some merit.
Precipitation. The correlation of radon to hourly precipitation was weak. However, several severe rain events occurred during the study. Some homes showed a response following rain. In light of that, the seven strongest rain events were identified and the radon response to each was calculated. It was determined that the strongest effects were seen in a 36-hour period following the rain event. The radon response was determined by linear regression of radon level versus time over the 36-hour period. The slope, representing the rate of change of radon, was then transformed into picoCuries per liter/day. The results are shown in Table 18. These values do not represent the simple difference between radon at the height of a radon event and the radon concentration 36 hours later because that single value 36 hours later may not be indicative of the trend.
Rain effects were more strongly seen in the foundation than in the living space, as might be expected. The rain tended to reduce radon in the period immediately following. However, some events seemed to increase radon. Thus, these data do not present a uniform pattern of radon reduction following rain events.
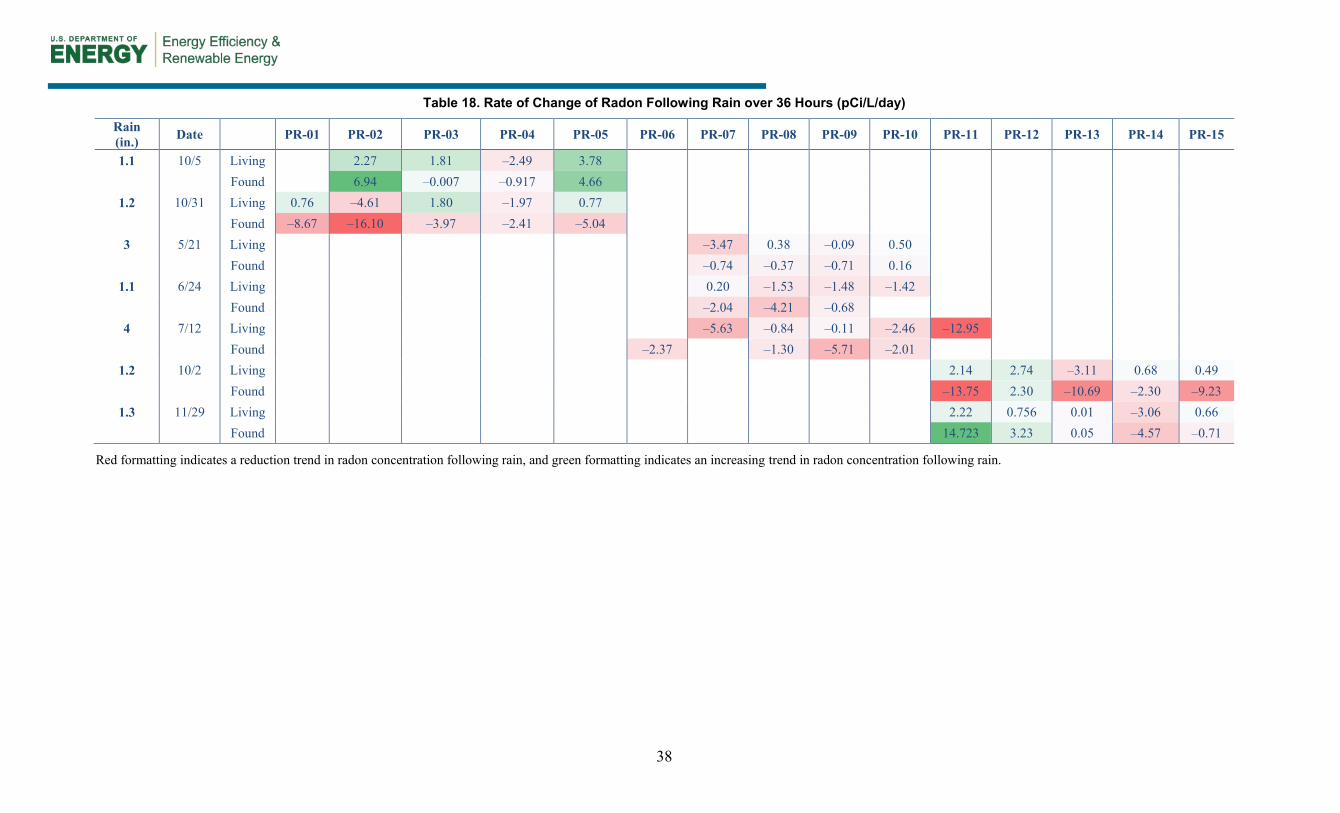
38
Table 18. Rate of Change of Radon Following Rain over 36 Hours (pCi/L/day)
Rain (in.) Date PR-01 PR-02 PR-03 PR-04 PR-05 PR-06 PR-07 PR-08 PR-09 PR-10 PR-11 PR-12 PR-13 PR-14 PR-15
1.1 10/5 Living 2.27 1.81 –2.49 3.78 Found 6.94 –0.007 –0.917 4.66
1.2 10/31 Living 0.76 –4.61 1.80 –1.97 0.77 Found –8.67 –16.10 –3.97 –2.41 –5.04
3 5/21 Living –3.47 0.38 –0.09 0.50 Found –0.74 –0.37 –0.71 0.16
1.1 6/24 Living 0.20 –1.53 –1.48 –1.42 Found –2.04 –4.21 –0.68
4 7/12 Living –5.63 –0.84 –0.11 –2.46 –12.95 Found –2.37 –1.30 –5.71 –2.01
1.2 10/2 Living 2.14 2.74 –3.11 0.68 0.49
Found –13.75 2.30 –10.69 –2.30 –9.23 1.3 11/29 Living 2.22 0.756 0.01 –3.06 0.66
Found 14.723 3.23 0.05 –4.57 –0.71
Red formatting indicates a reduction trend in radon concentration following rain, and green formatting indicates an increasing trend in radon concentration following rain.
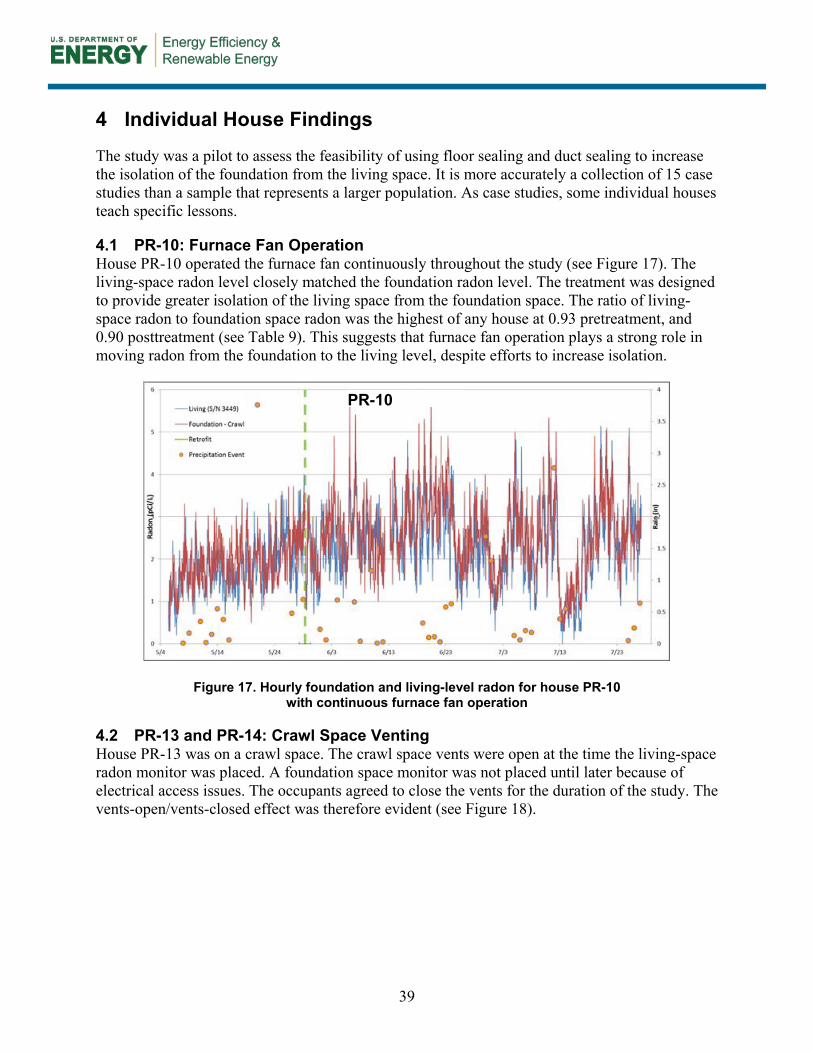
39
4 Individual House Findings
The study was a pilot to assess the feasibility of using floor sealing and duct sealing to increase the isolation of the foundation from the living space. It is more accurately a collection of 15 case studies than a sample that represents a larger population. As case studies, some individual houses teach specific lessons.
4.1 PR-10: Furnace Fan Operation House PR-10 operated the furnace fan continuously throughout the study (see Figure 17). The living-space radon level closely matched the foundation radon level. The treatment was designed to provide greater isolation of the living space from the foundation space. The ratio of living-space radon to foundation space radon was the highest of any house at 0.93 pretreatment, and 0.90 posttreatment (see Table 9). This suggests that furnace fan operation plays a strong role in moving radon from the foundation to the living level, despite efforts to increase isolation.
Figure 17. Hourly foundation and living-level radon for house PR-10 with continuous furnace fan operation
4.2 PR-13 and PR-14: Crawl Space Venting House PR-13 was on a crawl space. The crawl space vents were open at the time the living-space radon monitor was placed. A foundation space monitor was not placed until later because of electrical access issues. The occupants agreed to close the vents for the duration of the study. The vents-open/vents-closed effect was therefore evident (see Figure 18).
PR-10
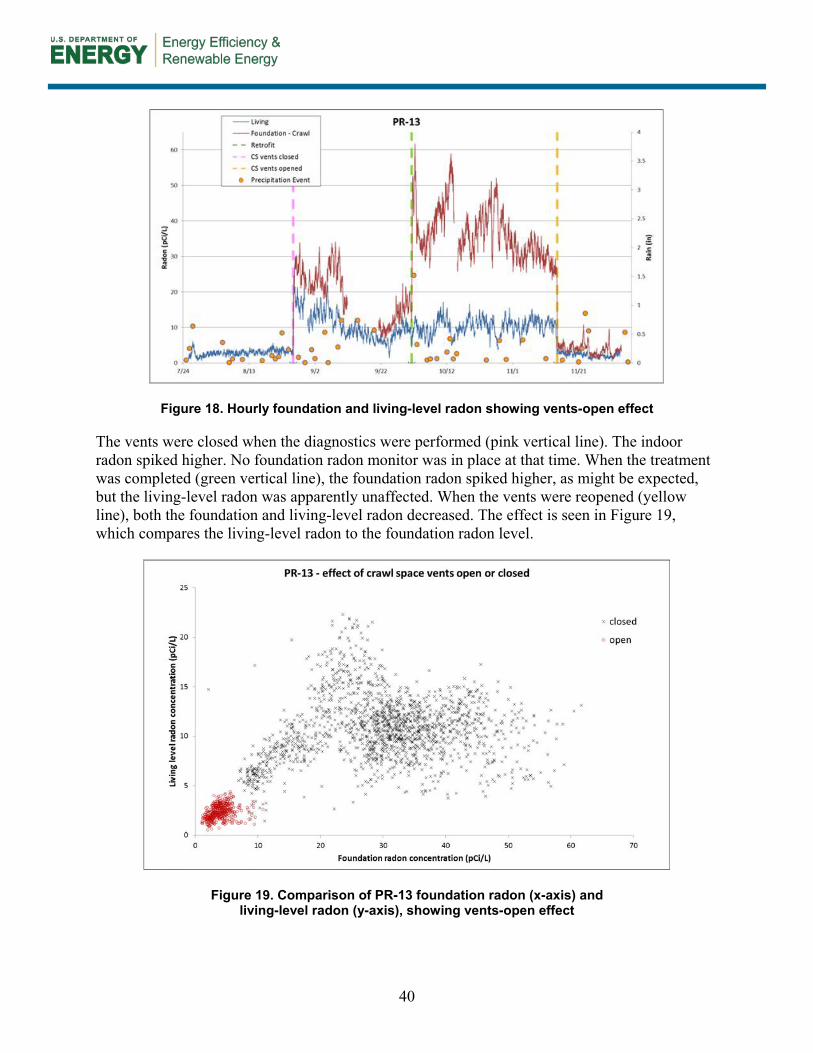
40
Figure 18. Hourly foundation and living-level radon showing vents-open effect
The vents were closed when the diagnostics were performed (pink vertical line). The indoor radon spiked higher. No foundation radon monitor was in place at that time. When the treatment was completed (green vertical line), the foundation radon spiked higher, as might be expected, but the living-level radon was apparently unaffected. When the vents were reopened (yellow line), both the foundation and living-level radon decreased. The effect is seen in Figure 19, which compares the living-level radon to the foundation radon level.
Figure 19. Comparison of PR-13 foundation radon (x-axis) and living-level radon (y-axis), showing vents-open effect

41
House PR-14 was studied with the crawl space vents closed, but the monitors were left in place for approximately 2 weeks after the vents were opened (orange vertical line in Figure 20). The foundation radon level declined with the vents open, but not to the extent seen in house PR-13 (see Figure 18). The impact of the windows-open condition, as determined using state sensors, is also apparent in Figure 20.
Figure 20. House PR-14 showing crawl space vents-open effect
4.3 PR-12 and PR-08: Windows—Open Condition Figure 21 shows the impact of having windows open on the ratio of foundation radon to living-level radon, using self-reported data. Two subsequent houses (PR-12 and PR-08) had successful campaigns of using window state loggers.
Figure 21. House PR-12 showing windows-open effect
PR-12
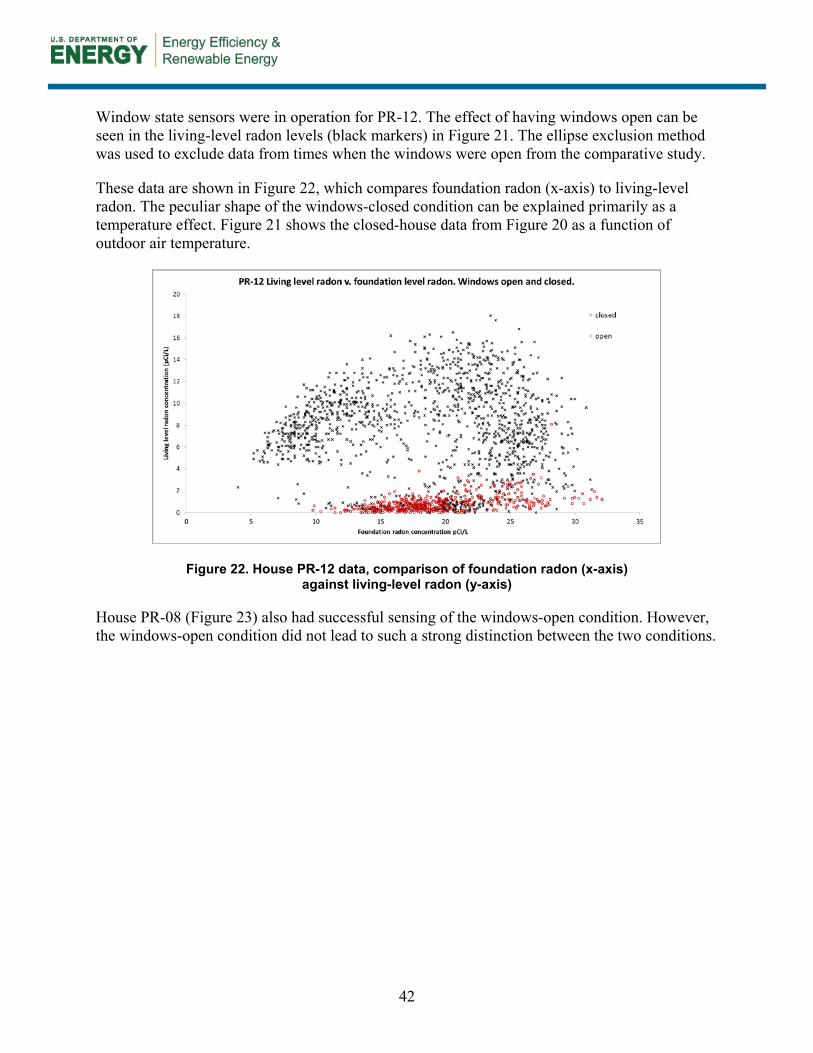
42
Window state sensors were in operation for PR-12. The effect of having windows open can be seen in the living-level radon levels (black markers) in Figure 21. The ellipse exclusion method was used to exclude data from times when the windows were open from the comparative study.
These data are shown in Figure 22, which compares foundation radon (x-axis) to living-level radon. The peculiar shape of the windows-closed condition can be explained primarily as a temperature effect. Figure 21 shows the closed-house data from Figure 20 as a function of outdoor air temperature.
Figure 22. House PR-12 data, comparison of foundation radon (x-axis) against living-level radon (y-axis)
House PR-08 (Figure 23) also had successful sensing of the windows-open condition. However, the windows-open condition did not lead to such a strong distinction between the two conditions.
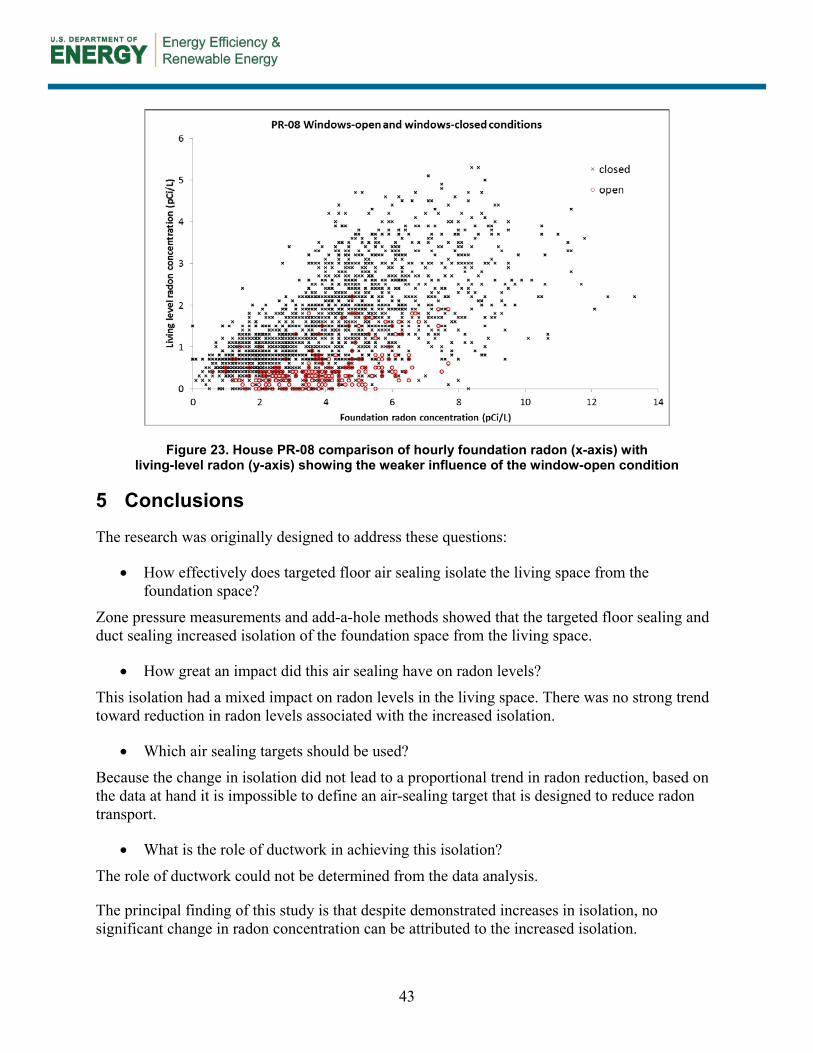
43
Figure 23. House PR-08 comparison of hourly foundation radon (x-axis) with
living-level radon (y-axis) showing the weaker influence of the window-open condition
5 Conclusions
The research was originally designed to address these questions:
How effectively does targeted floor air sealing isolate the living space from the foundation space?
Zone pressure measurements and add-a-hole methods showed that the targeted floor sealing and duct sealing increased isolation of the foundation space from the living space.
How great an impact did this air sealing have on radon levels?
This isolation had a mixed impact on radon levels in the living space. There was no strong trend toward reduction in radon levels associated with the increased isolation.
Which air sealing targets should be used?
Because the change in isolation did not lead to a proportional trend in radon reduction, based on the data at hand it is impossible to define an air-sealing target that is designed to reduce radon transport.
What is the role of ductwork in achieving this isolation?
The role of ductwork could not be determined from the data analysis.
The principal finding of this study is that despite demonstrated increases in isolation, no significant change in radon concentration can be attributed to the increased isolation.

44
The changes in radon concentration tended to occur in the same direction and at approximately the same magnitude in the living space and in the foundation. The initial hypothesis—that increased isolation may reduce living-level radon perhaps with elevated foundation-level radon—is not supported by the data.
The use of controls with a sample size this small must be questioned. This practice is predicated on the assumption that common factors, particularly weather, will impact all the houses. The data show that houses respond very differently to weather and show very little correlation between houses.
Some of the houses show a moderately strong positive correlation between foundation radon and outdoor air temperature. This was seen in 11 of 15 houses, both pre- and posttreatment. Lower temperature reduces radon. The reasons for this relationship deserve further study; however, they may be associated with soil moisture content, which is higher during cold weather. Another possibility may be the effect of greater use of forced-air systems when outdoor temperatures are colder.
Individual houses show patterns in their operation:
A house with continuous fan operation showed strong mixing of foundation air with living-level air both pre- and posttreatment.
Two houses were monitored with crawl spaces in the open and closed conditions. Crawl space open conditions are associated with lowered radon.
Three houses had effective monitoring of window operation by occupant log or via sensors. Living-space radon is significantly lower when windows are open.
45
References
EPA (1993). Protocols for Radon and Radon Decay Product Measurements in Homes. http://www.epa.gov/radon/pdfs/homes_protocols.pdf . Also an ANSI standard: AARST Consortium on National Radon Standards. 2014. Protocols for Measuring Radon and Radon Decay Products in Homes (MAH 2014).
Francisco, P., and W. Rose. 2012. Temperature and Humidity Measurements in 71 Homes Participating in an IAQ Improvement Program. Performance of the Exterior Envelopes of Whole Buildings XI. December 2012. Clearwater FL.
Parker, D.S. “Evidence of Increased Levels of Space Heat Consumption and Air Leakage Associated With Forced Air Heating Systems in Houses in the Pacific Northwest.” ASHRAE Transactions 95, Part 2 (1989).
Rudd, A., Townsend, A., Hendron, B., Anderson, R., Barley, D., and E. Hancock. 2007. “Field Test of Room-to-Room Distribution of Outside Air with Two Residential Ventilation Systems.” Paper presented at the IAQ2007 Conference, Baltimore, Maryland.
46
Bibliography
American Lung Association in Illinois. 2011a. Radon Measurement Licensure Course.
American Lung Association in Illinois. 2011b. Radon Mitigation Licensure Course.
Illinois Joint Committee on Administrative Rules. Administrative Code. Undated. Title 32: Energy, Chapter Ii: Illinois Emergency Management Agency, Subchapter B: Radiation Protection, Part 422 Regulations for Radon Service Providers, accessed June 18, 2015. http://www.ilga.gov/commission/jcar/admincode/032/03200422sections.html.
Pigg, S., Tonn, B., and Francisco P. 2011. “Radon in WAP Homes: Pre-Weatherization Results from National Indoor Environmental Quality Study.” Presented at the 2011 National Weatherization Training Conference, December 14, 2011. http://www.waptac.org/data/files/Website_Docs/events/conferences/2011-DOE-National-Conference/Wednesday/W31-Radon-Impact-and-Implications-for-Weatherization-Pigg.pdf.

47
Appendix A: Charts of Included and Excluded Data for Each House
The foundation radon measurement is plotted against the concurrent living-space radon measurement. Red circles represent excluded data. Diagonal lines represent equal radon concentration, foundation, and living level. Axis scales are the same except for Group 3 PR-11 and PR-13.
A1.1 Group 1
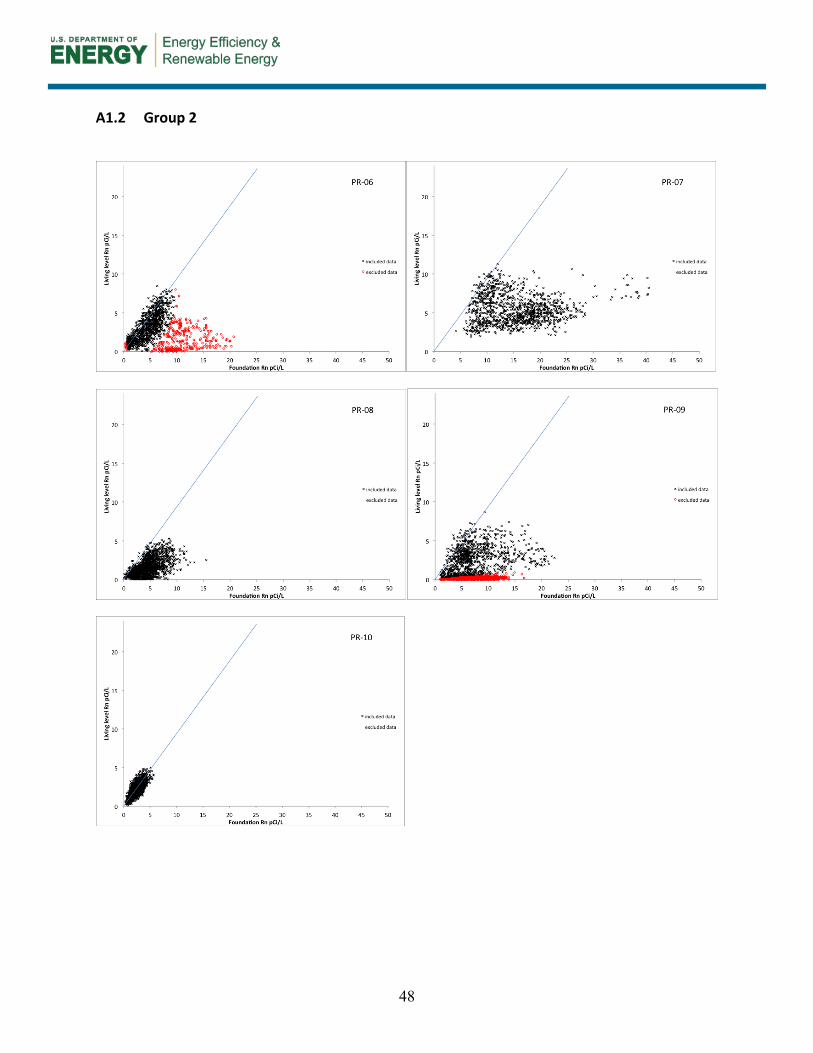
48
A1.2 Group 2
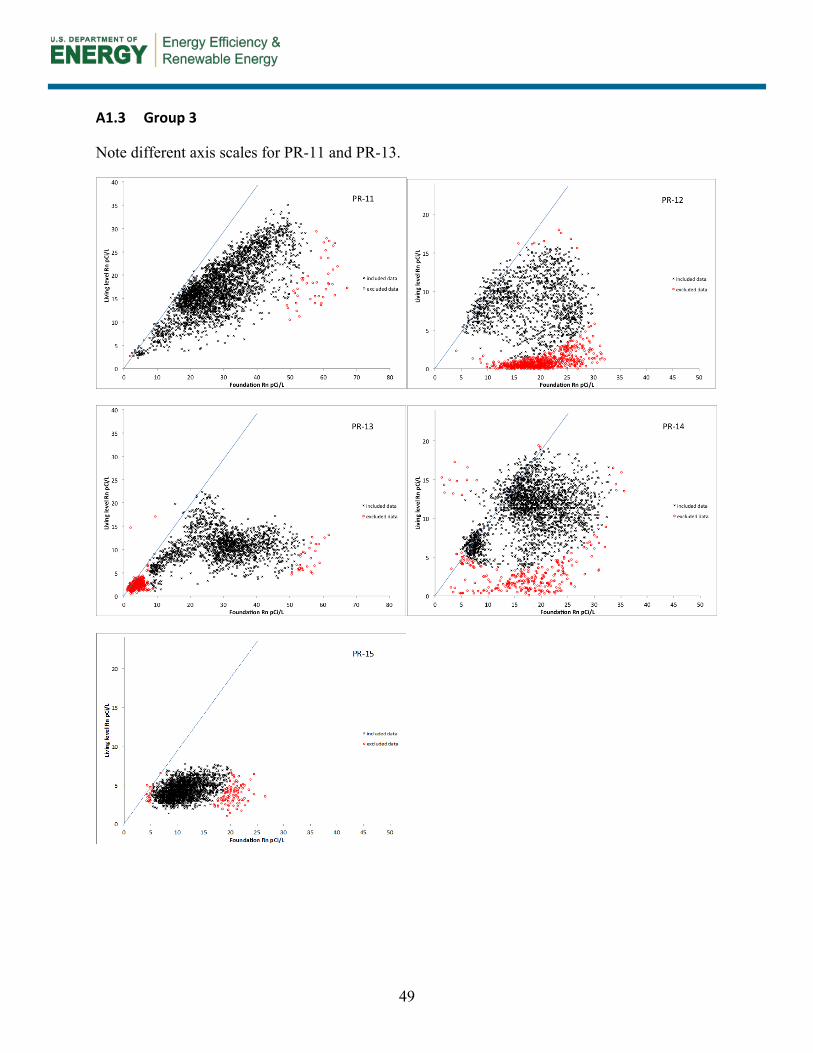
49
A1.3 Group 3
Note different axis scales for PR-11 and PR-13.
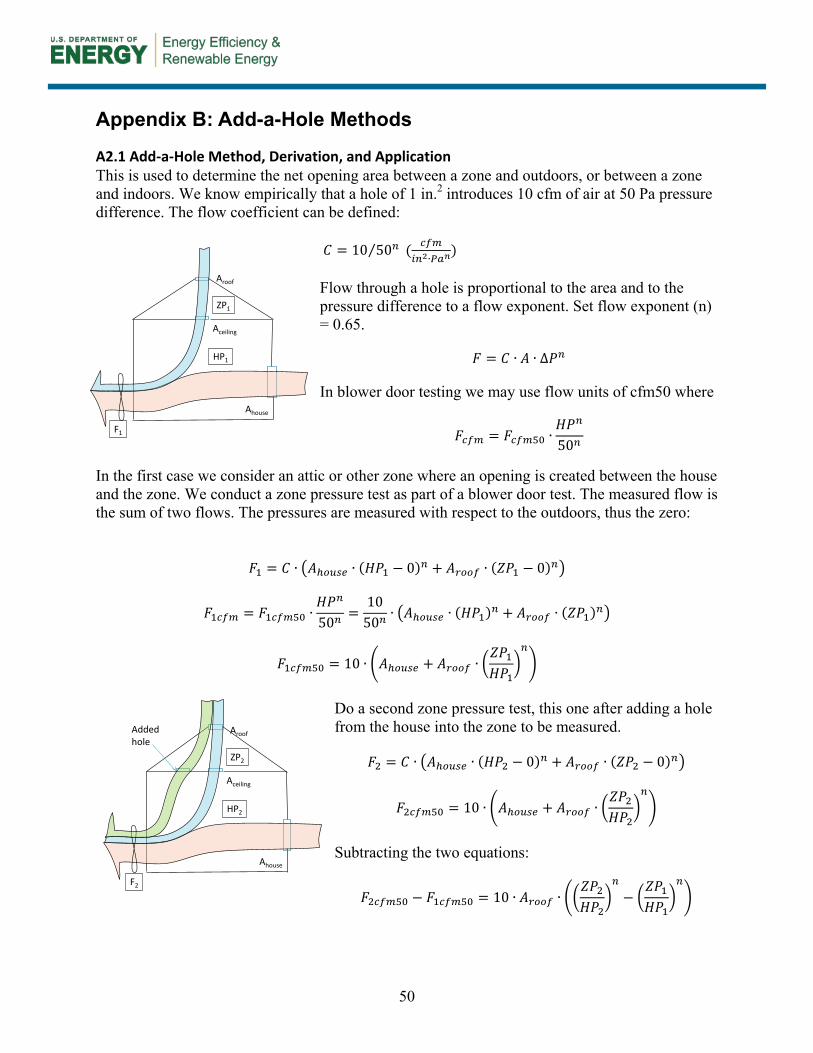
50
Appendix B: Add-a-Hole Methods
A2.1 Add-a-Hole Method, Derivation, and Application This is used to determine the net opening area between a zone and outdoors, or between a zone and indoors. We know empirically that a hole of 1 in.2 introduces 10 cfm of air at 50 Pa pressure difference. The flow coefficient can be defined:
= 10 50 ( )
Flow through a hole is proportional to the area and to the pressure difference to a flow exponent. Set flow exponent (n) = 0.65.
=
In blower door testing we may use flow units of cfm50 where
=50
In the first case we consider an attic or other zone where an opening is created between the house and the zone. We conduct a zone pressure test as part of a blower door test. The measured flow is the sum of two flows. The pressures are measured with respect to the outdoors, thus the zero:
= ( 0) + ( 0)
=50
=10
50( ) + ( )
= 10 +
Do a second zone pressure test, this one after adding a hole from the house into the zone to be measured.
= ( 0) + ( 0)
= 10 +
Subtracting the two equations:
= 10
Aceiling
Aroof
Ahouse
Addedhole
ZP2
HP2
F2
Aceiling
Aroof
Ahouse
ZP1
HP1
F1
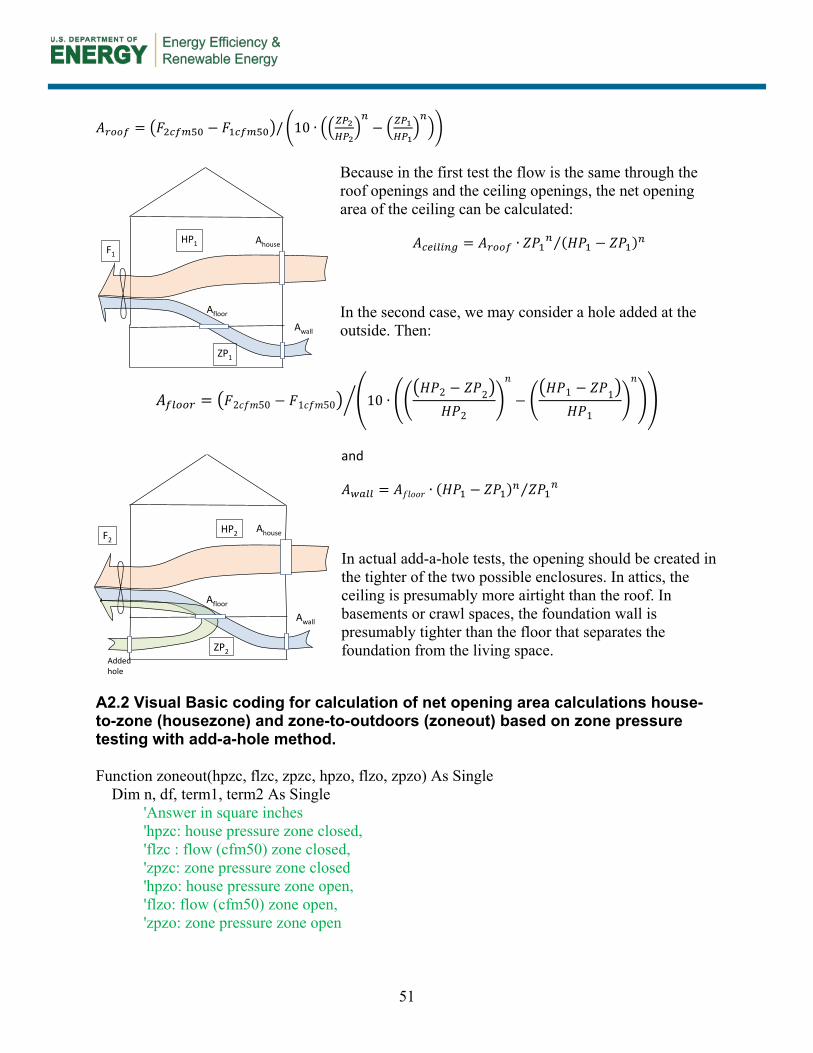
51
= / 10
Because in the first test the flow is the same through the roof openings and the ceiling openings, the net opening area of the ceiling can be calculated:
= ( )
In the second case, we may consider a hole added at the outside. Then:
= 2 50 1 50 10 2 2
2
1 1
1
and
= ( )
In actual add-a-hole tests, the opening should be created in the tighter of the two possible enclosures. In attics, the ceiling is presumably more airtight than the roof. In basements or crawl spaces, the foundation wall is presumably tighter than the floor that separates the foundation from the living space.
A2.2 Visual Basic coding for calculation of net opening area calculations house-to-zone (housezone) and zone-to-outdoors (zoneout) based on zone pressure testing with add-a-hole method. Function zoneout(hpzc, flzc, zpzc, hpzo, flzo, zpzo) As Single Dim n, df, term1, term2 As Single
'Answer in square inches 'hpzc: house pressure zone closed, 'flzc : flow (cfm50) zone closed, 'zpzc: zone pressure zone closed 'hpzo: house pressure zone open, 'flzo: flow (cfm50) zone open, 'zpzo: zone pressure zone open
Afloor
Awall
Ahouse
ZP1
HP1F1
Afloor
Awall
Ahouse
ZP2
HP2F2
Addedhole

52
n = 0.65 'flow exponent
'To avoid problems with sign hpzc = Abs(hpzc): hpzo = Abs(hpzo): flzc = Abs(flzc) flzo = Abs(flzo): zpzc = Abs(zpzc): zpzo = Abs(zpzo)
'Adjusted zone pressure values zpzc = zpzc * 50 / hpzc: zpzo = zpzo * 50 / hpzo df = flzo - flzc term1 = (zpzo / hpzo) ^ n - (zpzc / hpzc) ^ n term2 = ((hpzo - zpzo) / hpzo) ^ n - ((hpzc - zpzc) / hpzc) ^ n If term1 > 0 Then zoneout = df / term1 / 10 Else zoneout = df / term2 / 10 * ((hpzc - zpzc) / zpzc) ^ n End If
‘apply out of range estimate (from Blasnik) If Abs(zpzc - zpzo) <= 5.5 Then zoneout = "out of range" End Function
Function housezone(hpzc, flzc, zpzc, hpzo, flzo, zpzo) As Single Dim n, df, term1, term2 As Single
'Answer in square inches 'hpzc: house pressure zone closed, 'flzc : flow (cfm50) zone closed, 'zpzc: zone pressure zone closed 'hpzo: house pressure zone open, 'flzo: flow (cfm50) zone open, 'zpzo: zone pressure zone open
n = 0.65 'flow exponent
'To avoid problems with sign hpzc = Abs(hpzc): hpzo = Abs(hpzo): flzc = Abs(flzc) flzo = Abs(flzo): zpzc = Abs(zpzc): zpzo = Abs(zpzo)
'Adjusted zone pressure values zpzc = zpzc * 50 / hpzc: zpzo = zpzo * 50 / hpzo df = flzo - flzc term1 = (zpzo / hpzo) ^ n - (zpzc / hpzc) ^ n term2 = ((hpzo - zpzo) / hpzo) ^ n - ((hpzc - zpzc) / hpzc) ^ n If term1 < 0 Then housezone = df / term2 / 10 Else

53
housezone = df / term1 / 10 * (zpzc / (hpzc - zpzc)) ^ n End If If Abs(zpzc - zpzo) <= 5.5 Then housezone = "out of range" End Function
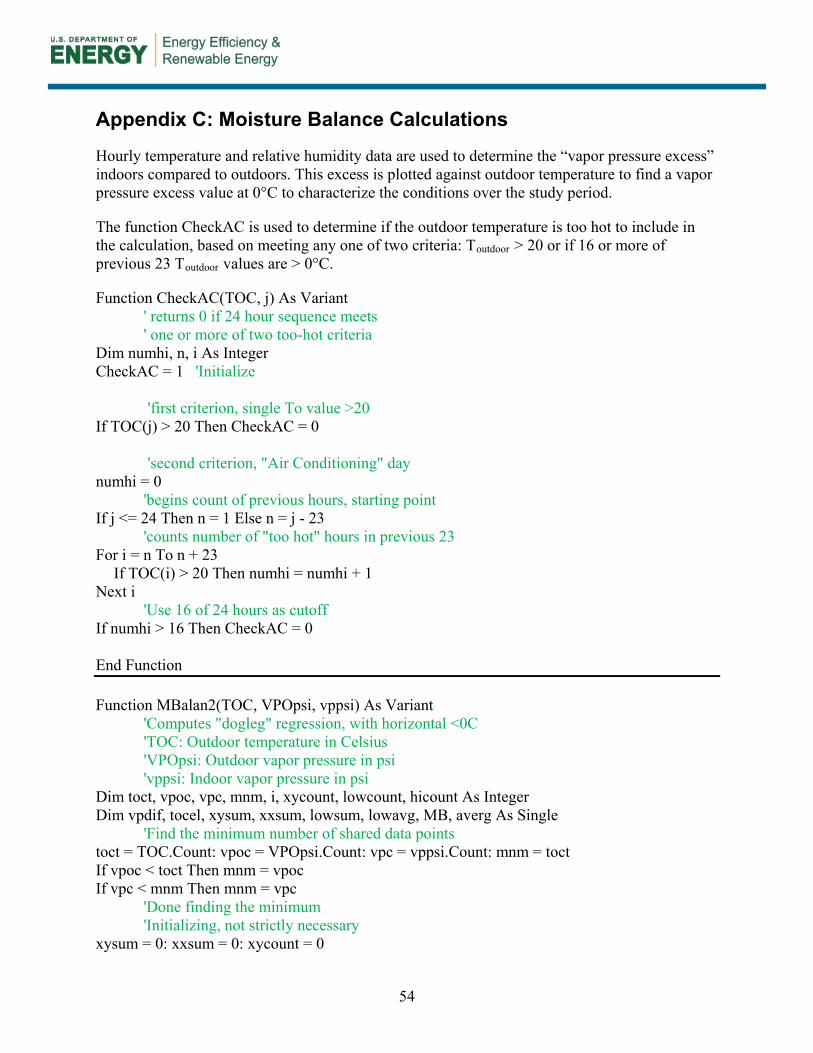
54
Appendix C: Moisture Balance Calculations
Hourly temperature and relative humidity data are used to determine the “vapor pressure excess” indoors compared to outdoors. This excess is plotted against outdoor temperature to find a vapor pressure excess value at 0°C to characterize the conditions over the study period.
The function CheckAC is used to determine if the outdoor temperature is too hot to include in the calculation, based on meeting any one of two criteria: Toutdoor > 20 or if 16 or more of previous 23 Toutdoor values are > 0°C.
Function CheckAC(TOC, j) As Variant ' returns 0 if 24 hour sequence meets ' one or more of two too-hot criteria
Dim numhi, n, i As Integer CheckAC = 1 'Initialize
'first criterion, single To value >20 If TOC(j) > 20 Then CheckAC = 0
'second criterion, "Air Conditioning" day numhi = 0
'begins count of previous hours, starting point If j <= 24 Then n = 1 Else n = j - 23
'counts number of "too hot" hours in previous 23 For i = n To n + 23 If TOC(i) > 20 Then numhi = numhi + 1 Next i
'Use 16 of 24 hours as cutoff If numhi > 16 Then CheckAC = 0 End Function Function MBalan2(TOC, VPOpsi, vppsi) As Variant
'Computes "dogleg" regression, with horizontal <0C 'TOC: Outdoor temperature in Celsius 'VPOpsi: Outdoor vapor pressure in psi 'vppsi: Indoor vapor pressure in psi
Dim toct, vpoc, vpc, mnm, i, xycount, lowcount, hicount As Integer Dim vpdif, tocel, xysum, xxsum, lowsum, lowavg, MB, averg As Single
'Find the minimum number of shared data points toct = TOC.Count: vpoc = VPOpsi.Count: vpc = vppsi.Count: mnm = toct If vpoc < toct Then mnm = vpoc If vpc < mnm Then mnm = vpc
'Done finding the minimum 'Initializing, not strictly necessary
xysum = 0: xxsum = 0: xycount = 0

55
lowsum = 0: lowcount = 0: hicount = 0 For i = 1 To mnm
'Skip blanks, and values where To is >20C If vppsi(i) = 0 Or VPOpsi(i) = 0 Or CheckAC(TOC, i) = 0 Then hicount = hicount + 1 'May serve as count of unused values Else If TOC(i) > 0 Then 'For sloped segment
vpdif = vppsi(i) - VPOpsi(i) 'vapor pressure difference tocel = TOC(i) - 20 'Shift scale so 20 degC is the origin xysum = xysum + tocel * vpdif 'simple slope calculation xxsum = xxsum + tocel ^ 2 xycount = xycount + 1 Else 'For horizontal segment lowsum = lowsum + vppsi(i) - VPOpsi(i) lowcount = lowcount + 1
End If End If Next i If lowcount = 0 Then lowavg = 0 'Corrects where lowcount = 0 Else lowavg = lowsum / lowcount End If MB = (-20) * xysum / xxsum ' finds the intersection on the 'vapor pressure y axis at 0 degrees C with the slope. averg = MB + (lowavg - MB) * lowcount / (xycount + lowcount)
'Uses number of data points in two segments to weigh 'the value of each segment's contribution to moisture 'balance value.
MBalan2 = averg * 6894.75 'output in Pa End Function

56
Appendix D: Ellipse Calculations
Cartesian coordinates used to determine if an x-y pair lies within an ellipse defined by four points: a, b, c, and d. “Four” represents the foundation radon value on the x-coordinate and “liv” represents the living-level radon on the y-coordinate.
Function inout(xa, ya, xb, yb, xc, yc, xd, yd, fou, liv) As Single
'for an ellipse defined by four points a,b,c,d 'determines whether a point is within or without the ellipse 'a and b on the same axis, c and d on the same axis ‘fou: foundation radon value, on the x-axis ‘liv: living radon value, on the y-axis
m = xd - xc: n = yd - yc: mm = xb - xa: nn = yb - ya h = xd - m / 2: j = yd - n / 2 a = ((m * m) + (n * n)) ^ 0.5 / 2 b = ((mm * mm) + (nn * nn)) ^ 0.5 / 2 xx = (fou * m / n + liv + xd * n / m - yd) / (n / m + m / n) yy = n / m * (xx - xd) + yd p = ((xx - h) ^ 2 + (yy - j) ^ 2) ^ 0.5 q = ((yy - liv) ^ 2 + (xx - fou) ^ 2) ^ 0.5 test = (p / a) ^ 2 + (q / b) ^ 2 If test <= 1 Then inout = 1 Else inout = 0 '1 is in, 0 is out End Function
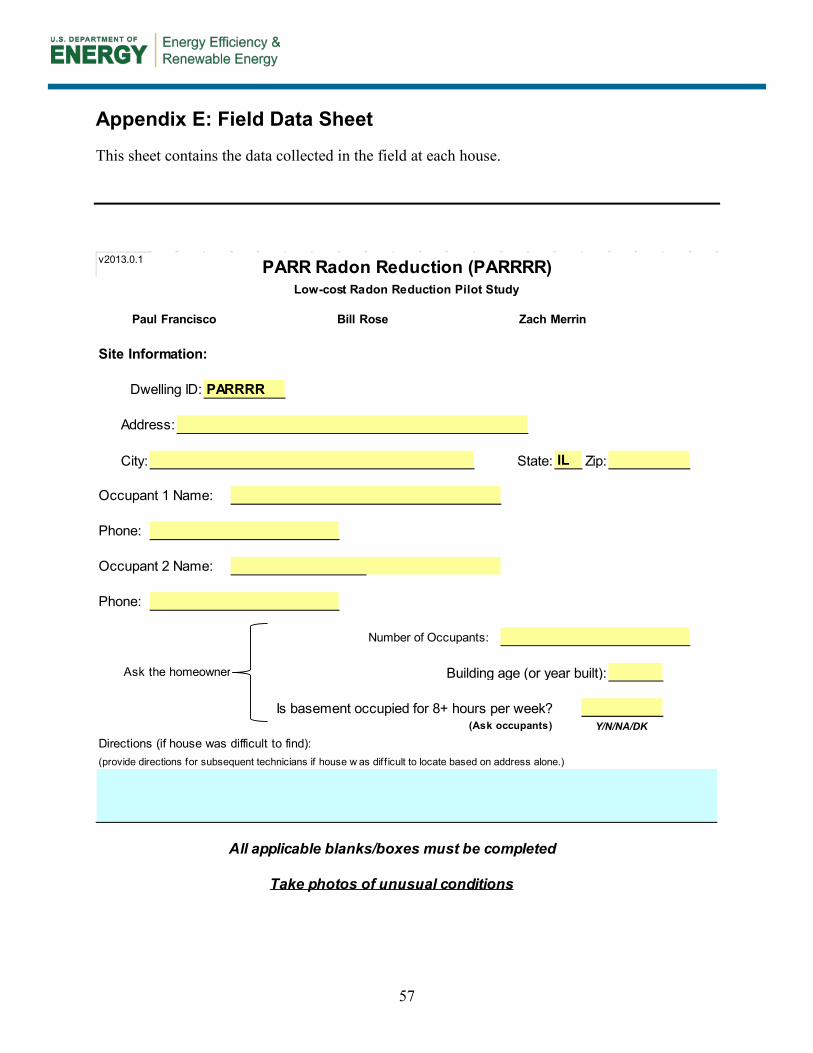
57
Appendix E: Field Data Sheet
This sheet contains the data collected in the field at each house.
Paul Francisco Bill Rose Zach Merrin
Site Information:
Dwelling ID:
Address:
City: State: IL Zip:
Occupant 1 Name:
Phone:
Occupant 2 Name:
Phone:
Number of Occupants:
Is basement occupied for 8+ hours per week?(Ask occupants) Y/N/NA/DK
Directions (if house was difficult to find):(provide directions for subsequent technicians if house w as diff icult to locate based on address alone.)
Take photos of unusual conditions
PARRRR
All applicable blanks/boxes must be completed
Ask the homeowner
PARR Radon Reduction (PARRRR)v2013.0.1
Building age (or year built):
Low-cost Radon Reduction Pilot Study
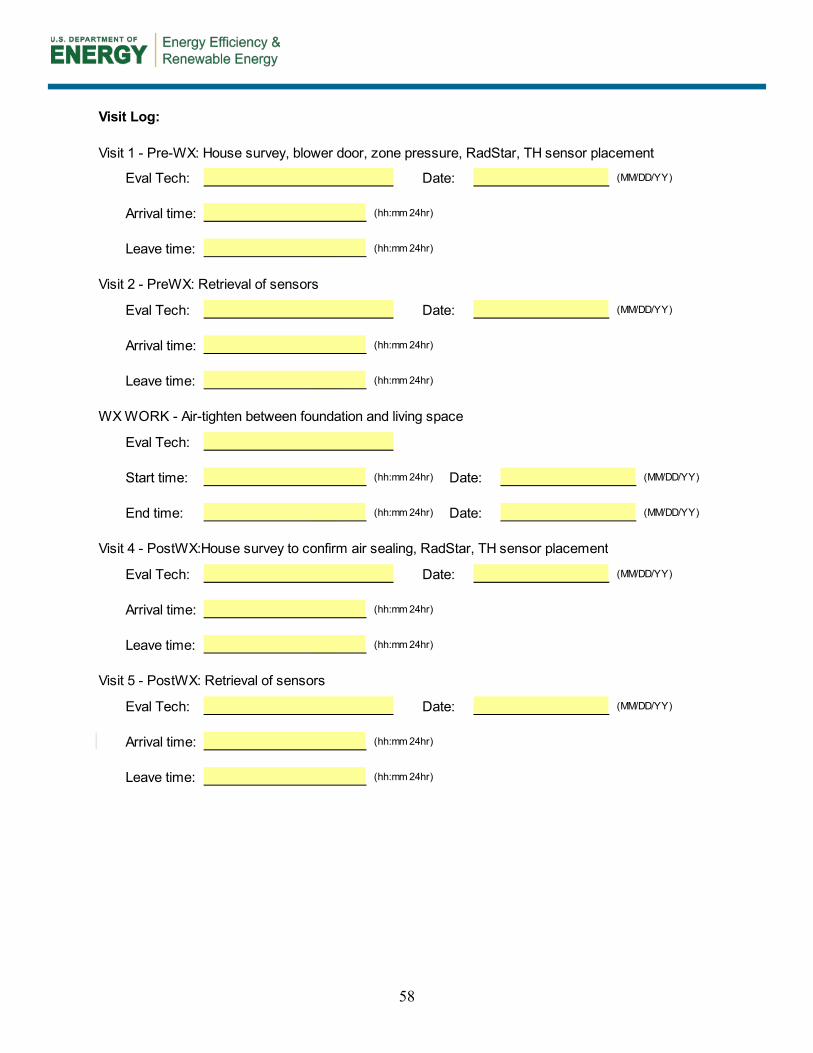
58
Visit Log:
Visit 1 - Pre-WX: House survey, blower door, zone pressure, RadStar, TH sensor placement
Eval Tech: Date: (MM/DD/YY)
Arrival time: (hh:mm 24hr)
Leave time: (hh:mm 24hr)
Visit 2 - PreWX: Retrieval of sensors
Eval Tech: Date: (MM/DD/YY)
Arrival time: (hh:mm 24hr)
Leave time: (hh:mm 24hr)
WX WORK - Air-tighten between foundation and living space
Eval Tech:
Start time: (hh:mm 24hr) Date: (MM/DD/YY)
End time: (hh:mm 24hr) Date: (MM/DD/YY)
Visit 4 - PostWX:House survey to confirm air sealing, RadStar, TH sensor placement
Eval Tech: Date: (MM/DD/YY)
Arrival time: (hh:mm 24hr)
Leave time: (hh:mm 24hr)
Visit 5 - PostWX: Retrieval of sensors
Eval Tech: Date: (MM/DD/YY)
Arrival time: (hh:mm 24hr)
Leave time: (hh:mm 24hr)
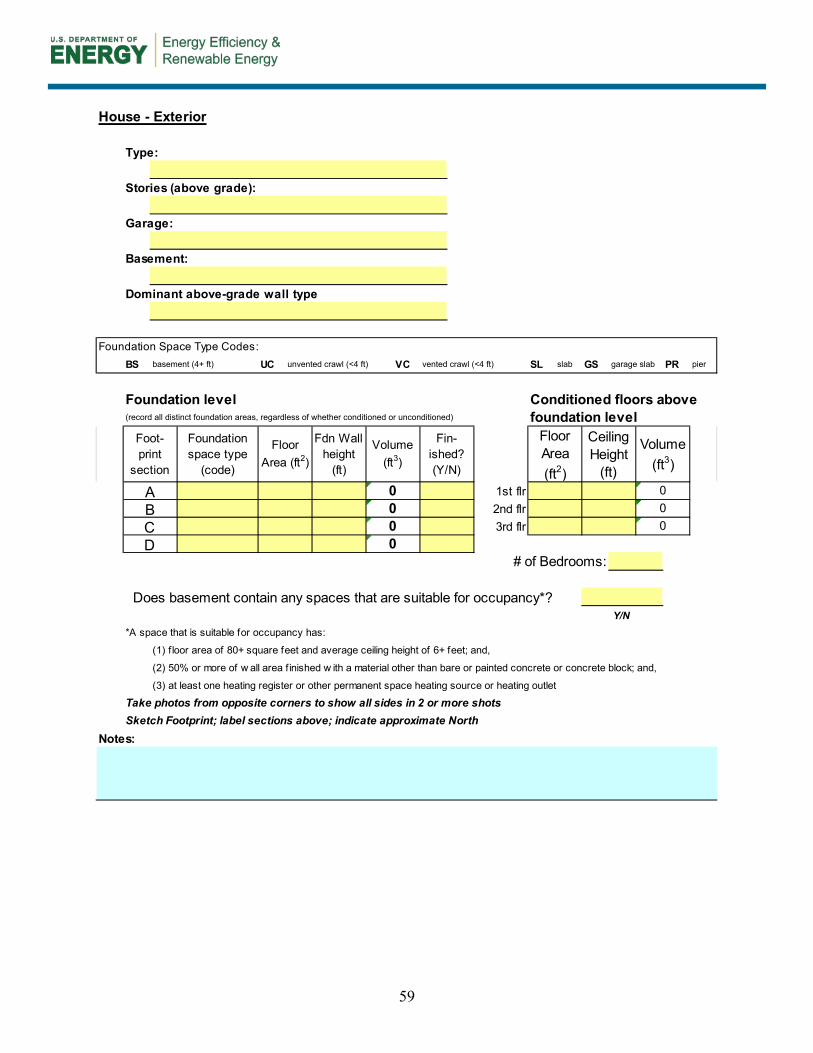
59
House - Exterior
Type:
Stories (above grade):
Garage:
Basement:
Dominant above-grade wall type
Foundation Space Type Codes:BS basement (4+ ft) UC unvented crawl (<4 ft) VC vented crawl (<4 ft) SL slab GS garage slab PR pier
Foundation level Conditioned floors above(record all distinct foundation areas, regardless of whether conditioned or unconditioned) foundation level
1st flr2nd flr3rd flr
# of Bedrooms:
Does basement contain any spaces that are suitable for occupancy*?Y/N
*A space that is suitable for occupancy has:
(1) f loor area of 80+ square feet and average ceiling height of 6+ feet; and,
(2) 50% or more of w all area f inished w ith a material other than bare or painted concrete or concrete block; and,
(3) at least one heating register or other permanent space heating source or heating outlet
Take photos from opposite corners to show all sides in 2 or more shotsSketch Footprint; label sections above; indicate approximate North
Notes:
0
Foot-print
section
000
0A
Foundation space type
(code)
Floor Area (ft2)
Volume (ft3)
Fdn Wall height
(ft)
CD
0
Fin-ished? (Y/N)
Ceiling Height
(ft)
Floor Area (ft2)
Volume (ft3)
0
B
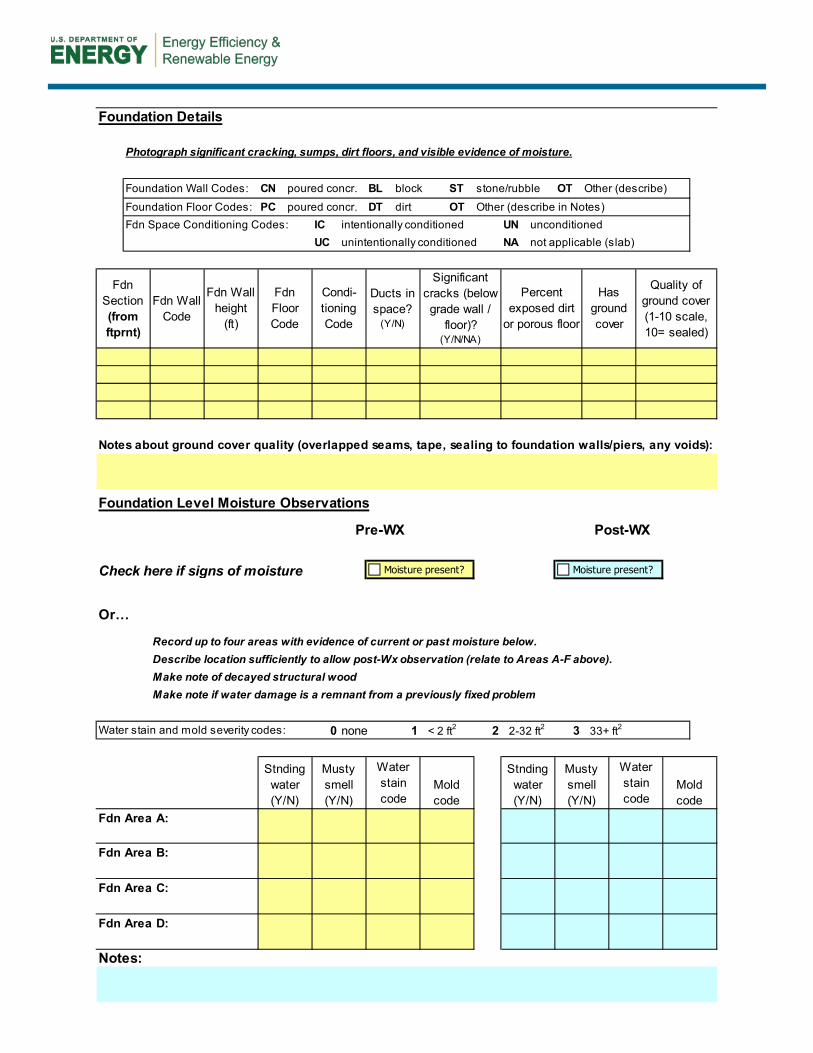
60
Foundation Details
Photograph significant cracking, sumps, dirt floors, and visible evidence of moisture.
Foundation Wall Codes: CN poured concr. BL block ST stone/rubble OT Other (describe)
Foundation Floor Codes: PC poured concr. DT dirt OT Other (describe in Notes)Fdn Space Conditioning Codes: IC intentionally conditioned UN unconditioned
UC unintentionally conditioned NA not applicable (slab)
Notes about ground cover quality (overlapped seams, tape, sealing to foundation walls/piers, any voids):
Foundation Level Moisture Observations
Pre-WX Post-WX
Check here if signs of moisture
Or…
Record up to four areas with evidence of current or past moisture below.Describe location sufficiently to allow post-Wx observation (relate to Areas A-F above).Make note of decayed structural wood Make note if water damage is a remnant from a previously fixed problem
Water stain and mold severity codes: 0 none 1 < 2 ft2 2 2-32 ft2 3 33+ ft2
Fdn Area A:
Fdn Area B:
Fdn Area C:
Fdn Area D:
Notes:
Musty smell (Y/N)
Fdn Section (from ftprnt)
Significant cracks (below grade wall /
floor)? (Y/N/NA)
Fdn Wall Code
Stnding water (Y/N)
Musty smell (Y/N)
Water stain code
Stnding water (Y/N)
Fdn Wall height
(ft)
Fdn Floor Code
Condi-tioning Code
Mold code
Mold code
Water stain code
Ducts in space?
(Y/N)
Percent exposed dirt
or porous floor
Has ground cover
Quality of ground cover (1-10 scale, 10= sealed)
Moisture present? Moisture present?
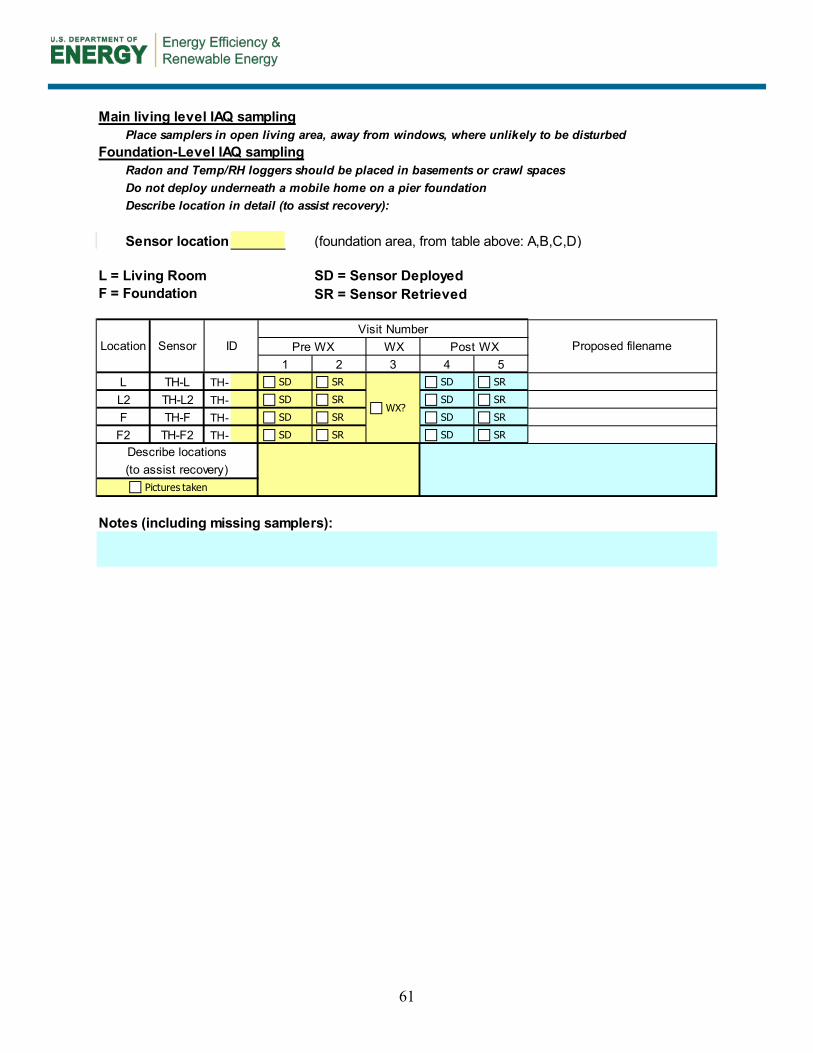
61
Main living level IAQ samplingPlace samplers in open living area, away from windows, where unlikely to be disturbed
Foundation-Level IAQ samplingRadon and Temp/RH loggers should be placed in basements or crawl spacesDo not deploy underneath a mobile home on a pier foundationDescribe location in detail (to assist recovery):
Sensor location (foundation area, from table above: A,B,C,D)
TH-TH-TH-TH-
Notes (including missing samplers):
L
Proposed filenamePre WX Post WXWXLocation
SD = Sensor DeployedSR = Sensor RetrievedF = Foundation
L = Living Room
Describe locations
F
2 3TH-L
TH-F
(to assist recovery)
L2 TH-L2
4 5Sensor ID
1
Visit Number
F2 TH-F2
Pictures taken
SD
SD
SD
SD
SR
SR
SR
SRWX?
SD SDSR SR
SD SDSR SR
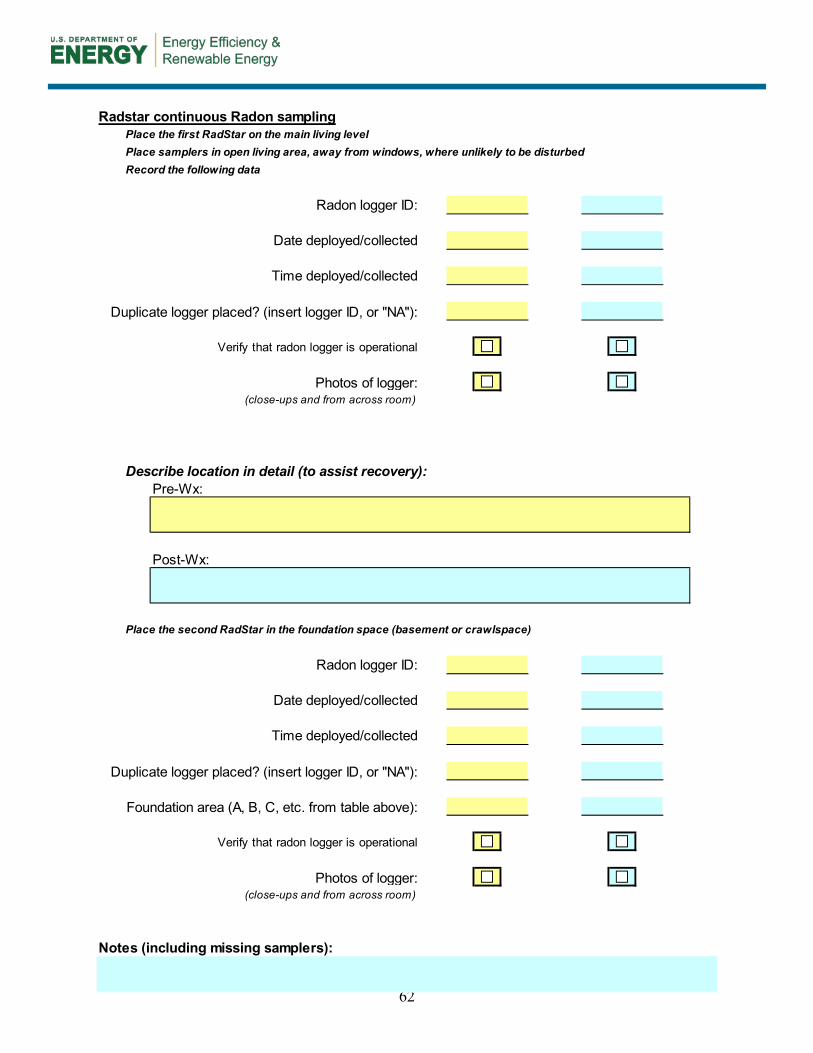
62
Radstar continuous Radon samplingPlace the first RadStar on the main living levelPlace samplers in open living area, away from windows, where unlikely to be disturbedRecord the following data
Radon logger ID:
Date deployed/collected
Time deployed/collected
Duplicate logger placed? (insert logger ID, or "NA"):
Verify that radon logger is operational
Photos of logger:(close-ups and from across room)
Describe location in detail (to assist recovery):Pre-Wx:
Post-Wx:
Place the second RadStar in the foundation space (basement or crawlspace)
Radon logger ID:
Date deployed/collected
Time deployed/collected
Duplicate logger placed? (insert logger ID, or "NA"):
Foundation area (A, B, C, etc. from table above):
Verify that radon logger is operational
Photos of logger:(close-ups and from across room)
Notes (including missing samplers):
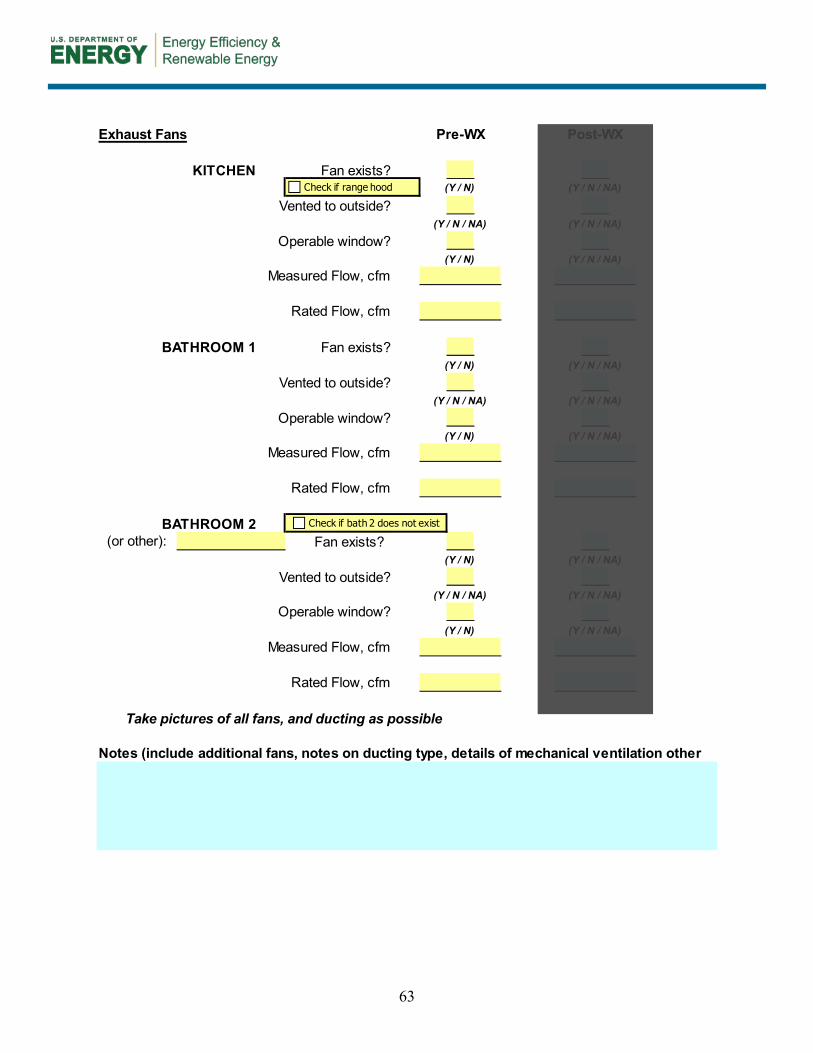
63
Exhaust Fans Pre-WX Post-WX
KITCHEN(Y / N) (Y / N / NA)
Vented to outside?(Y / N / NA) (Y / N / NA)
Operable window?(Y / N) (Y / N / NA)
BATHROOM 1(Y / N) (Y / N / NA)
(Y / N / NA) (Y / N / NA)
Operable window?(Y / N) (Y / N / NA)
BATHROOM 2Fan exists?
(Y / N) (Y / N / NA)
(Y / N / NA) (Y / N / NA)
(Y / N) (Y / N / NA)
Take pictures of all fans, and ducting as possible
(or other):
Vented to outside?
Rated Flow, cfm
Fan exists?
Operable window?
Rated Flow, cfm
Notes (include additional fans, notes on ducting type, details of mechanical ventilation other
Vented to outside?
Measured Flow, cfm
Measured Flow, cfm
Measured Flow, cfm
Rated Flow, cfm
Fan exists?
Check if range hood
Check if bath 2 does not exist
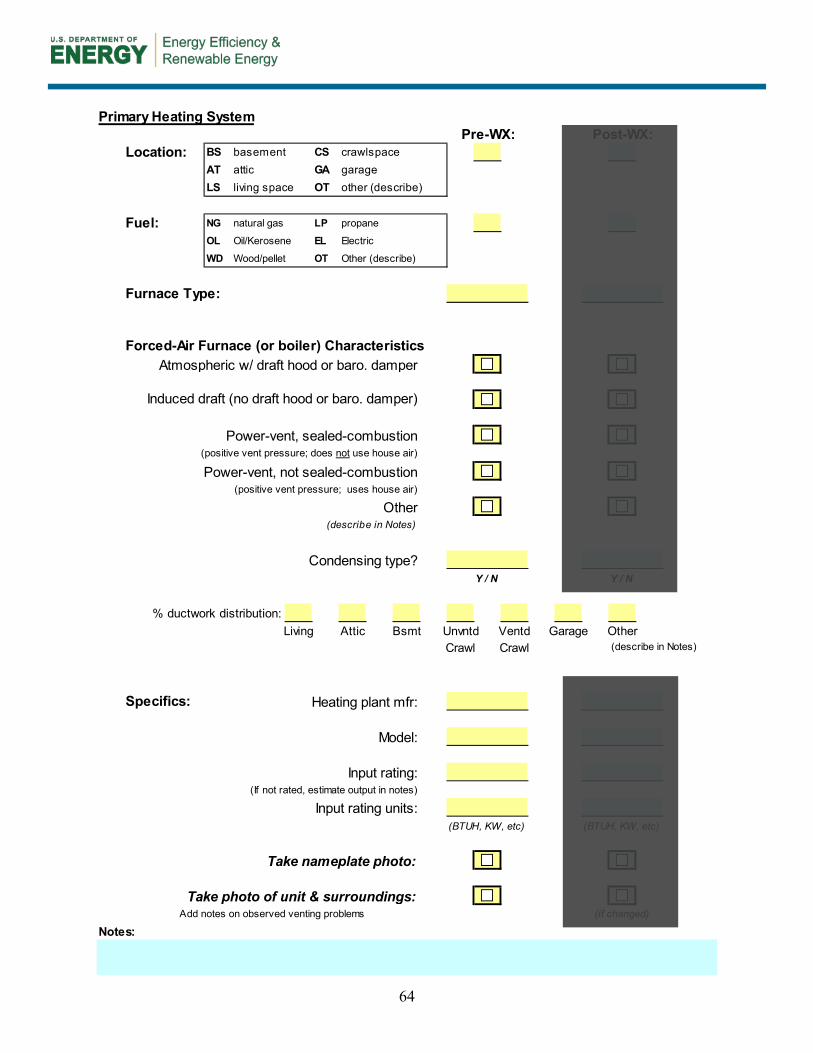
64
Primary Heating SystemPre-WX: Post-WX:
Location: BS basement CS crawlspaceAT attic GA garageLS living space OT other (describe)
Fuel: NG natural gas LP propane
OL Oil/Kerosene EL Electric
WD Wood/pellet OT Other (describe)
Furnace Type:
Forced-Air Furnace (or boiler) CharacteristicsAtmospheric w/ draft hood or baro. damper ###
Induced draft (no draft hood or baro. damper)
Power-vent, sealed-combustion(positive vent pressure; does not use house air)
Power-vent, not sealed-combustion(positive vent pressure; uses house air)
Other(describe in Notes)
Condensing type?Y / N Y / N
% ductwork distribution:Living Attic Bsmt Unvntd Ventd Garage Other
Crawl Crawl (describe in Notes)
Specifics: Heating plant mfr:
Model:
Input rating:(If not rated, estimate output in notes)
Input rating units:(BTUH, KW, etc) (BTUH, KW, etc)
Take nameplate photo:
Take photo of unit & surroundings:Add notes on observed venting problems (if changed)
Notes:
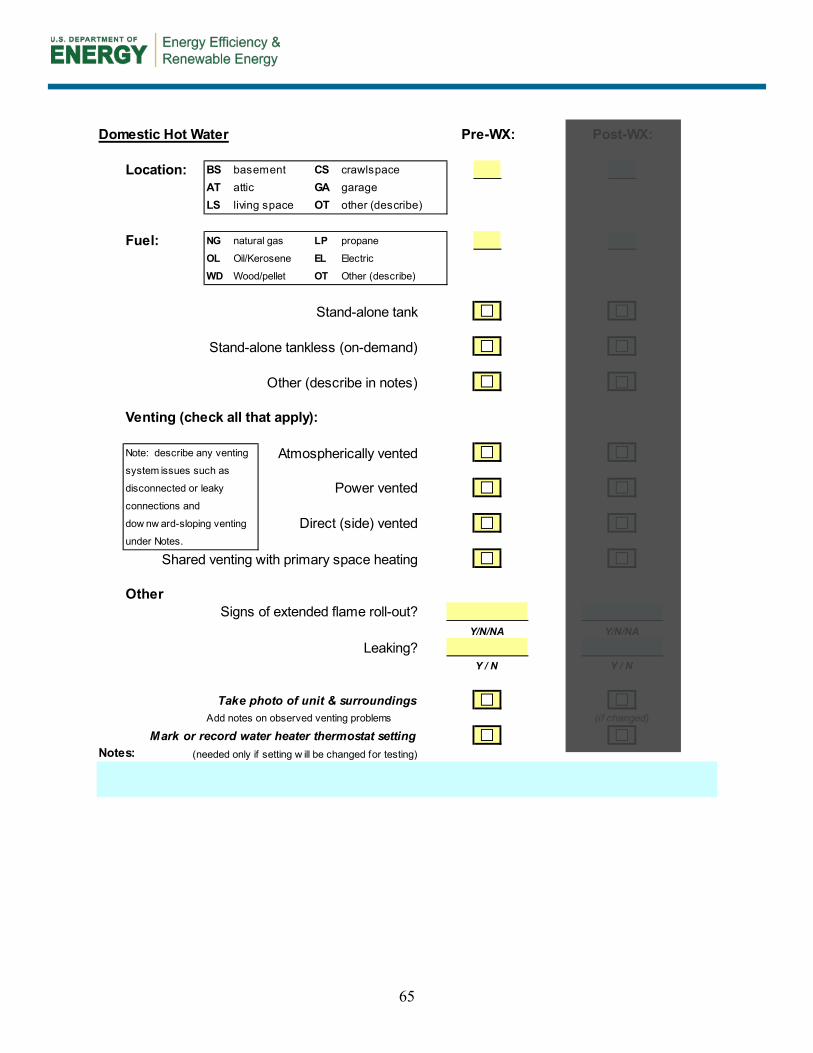
65
Domestic Hot Water
Location: BS basement CS crawlspaceAT attic GA garageLS living space OT other (describe)
Fuel: NG natural gas LP propane
OL Oil/Kerosene EL Electric
WD Wood/pellet OT Other (describe)
Stand-alone tank
Stand-alone tankless (on-demand)
Other (describe in notes)
Venting (check all that apply):
Note: describe any venting Atmospherically ventedsystem issues such as
disconnected or leaky Power ventedconnections and
dow nw ard-sloping venting Direct (side) ventedunder Notes.
Shared venting with primary space heating
Other
Y/N/NA Y/N/NALeaking?
Y / N Y / N
Take photo of unit & surroundingsAdd notes on observed venting problems (if changed)
Mark or record water heater thermostat settingNotes: (needed only if setting w ill be changed for testing)
Post-WX:Pre-WX:
Signs of extended flame roll-out?
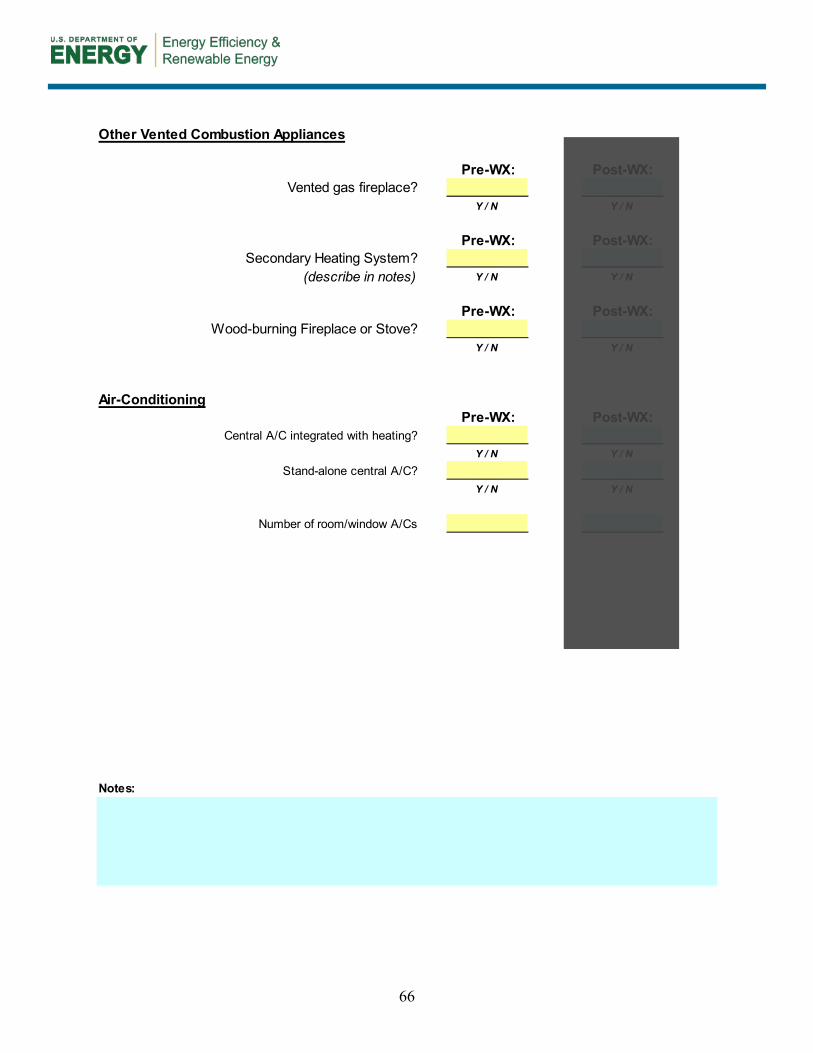
66
Other Vented Combustion Appliances
Vented gas fireplace?Y / N Y / N
Secondary Heating System?(describe in notes) Y / N Y / N
Wood-burning Fireplace or Stove?Y / N Y / N
Air-Conditioning
Central A/C integrated with heating?Y / N Y / N
Stand-alone central A/C?Y / N Y / N
Number of room/window A/Cs
Notes:
Pre-WX:
Pre-WX: Post-WX:
Post-WX:
Pre-WX: Post-WX:
Pre-WX: Post-WX:
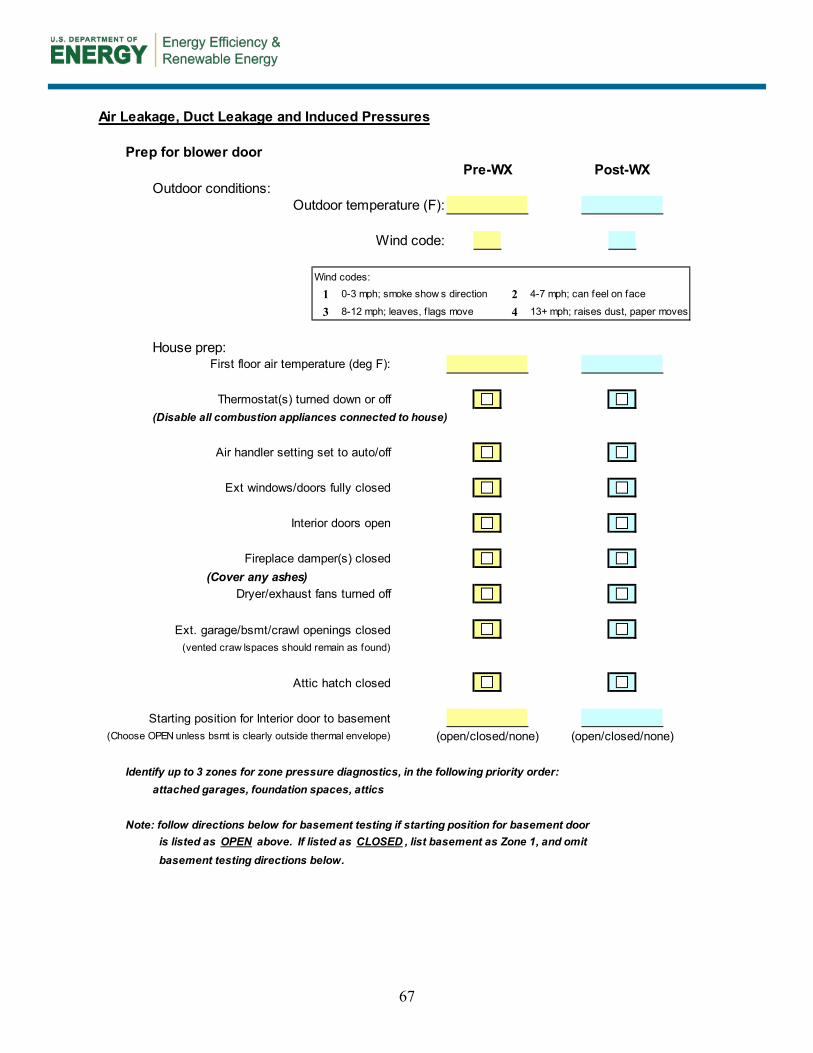
67
Air Leakage, Duct Leakage and Induced Pressures
Prep for blower door
Outdoor conditions:Outdoor temperature (F):
Wind code:
Wind codes:
1 0-3 mph; smoke show s direction 2 4-7 mph; can feel on face
3 8-12 mph; leaves, f lags move 4 13+ mph; raises dust, paper moves
House prep:
(Disable all combustion appliances connected to house)
(Cover any ashes)
Ext. garage/bsmt/crawl openings closed(vented craw lspaces should remain as found)
Attic hatch closed
Starting position for Interior door to basement(Choose OPEN unless bsmt is clearly outside thermal envelope) (open/closed/none) (open/closed/none)
Identify up to 3 zones for zone pressure diagnostics, in the following priority order:attached garages, foundation spaces, attics
Note: follow directions below for basement testing if starting position for basement door is listed as OPEN above. If listed as CLOSED , list basement as Zone 1, and omit basement testing directions below.
Pre-WX
Interior doors open
Ext windows/doors fully closed
Thermostat(s) turned down or off
Post-WX
Dryer/exhaust fans turned off
First floor air temperature (deg F):
Fireplace damper(s) closed
Air handler setting set to auto/off
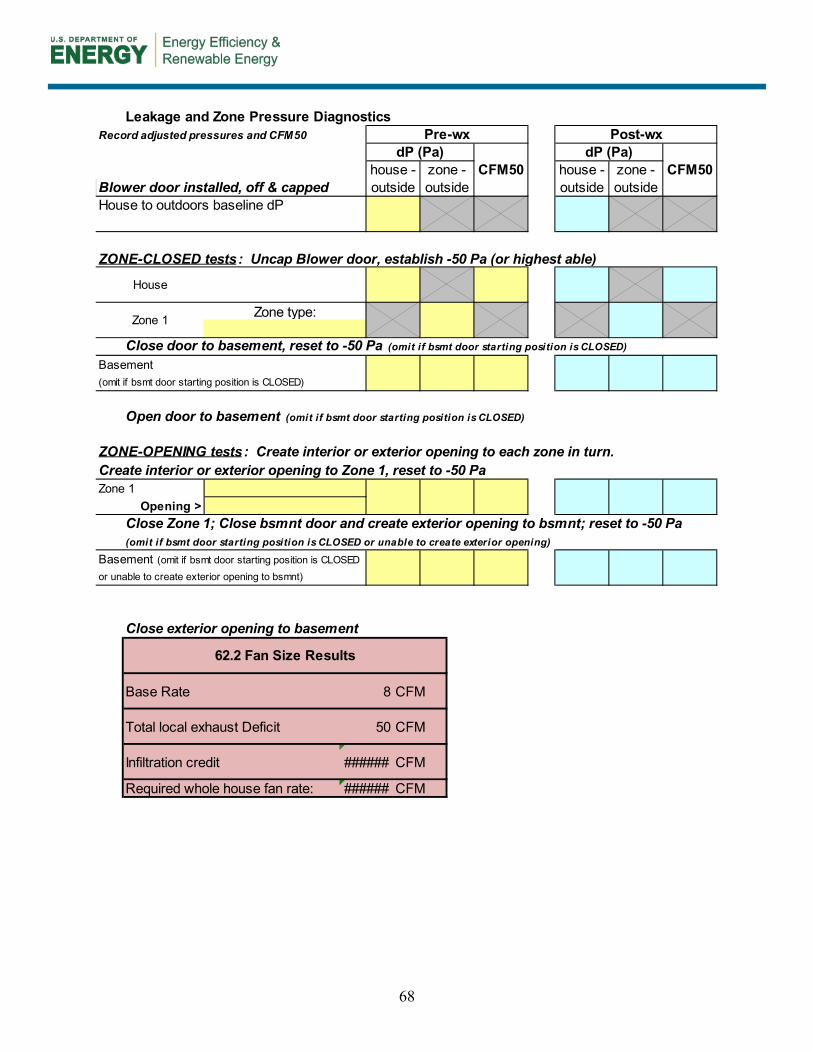
68
Leakage and Zone Pressure DiagnosticsRecord adjusted pressures and CFM50
Blower door installed, off & cappedHouse to outdoors baseline dP
ZONE-CLOSED tests: Uncap Blower door, establish -50 Pa (or highest able)
Close door to basement, reset to -50 Pa (omit if bsmt door starting position is CLOSED)
Basement(omit if bsmt door starting position is CLOSED)
Open door to basement (omit if bsmt door starting position is CLOSED)
ZONE-OPENING tests: Create interior or exterior opening to each zone in turn.Create interior or exterior opening to Zone 1, reset to -50 PaZone 1
Opening >Close Zone 1; Close bsmnt door and create exterior opening to bsmnt; reset to -50 Pa(omit if bsmt door starting position is CLOSED or unable to create exterior opening)
Basement (omit if bsmt door starting position is CLOSEDor unable to create exterior opening to bsmnt)
Close exterior opening to basement
Post-wx
Base Rate
House
Zone type:
outside
Pre-wx
CFM50zone -dP (Pa)dP (Pa)
Zone 1
8
CFM50zone -outsideoutside
62.2 Fan Size Results
house - house -outside
CFM
CFM
######
Required whole house fan rate:
CFMInfiltration credit
Total local exhaust Deficit
######
50
CFM
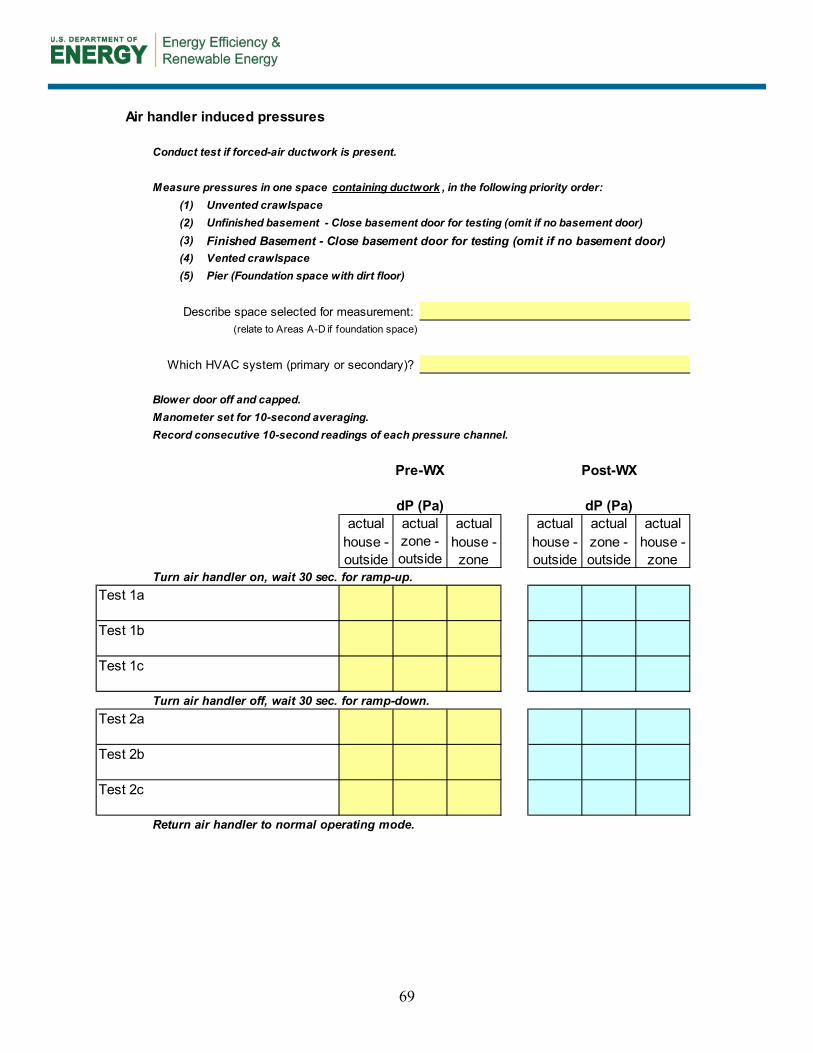
69
Air handler induced pressures
Conduct test if forced-air ductwork is present.
Measure pressures in one space containing ductwork , in the following priority order:(1) Unvented crawlspace(2) Unfinished basement - Close basement door for testing (omit if no basement door)(3) Finished Basement - Close basement door for testing (omit if no basement door)(4) Vented crawlspace(5) Pier (Foundation space with dirt floor)
Describe space selected for measurement: (relate to Areas A-D if foundation space)
Which HVAC system (primary or secondary)?
Blower door off and capped.Manometer set for 10-second averaging.Record consecutive 10-second readings of each pressure channel.
Turn air handler on, wait 30 sec. for ramp-up.Test 1a
Test 1b
Test 1c
Turn air handler off, wait 30 sec. for ramp-down.Test 2a
Test 2b
Test 2c
Return air handler to normal operating mode.
dP (Pa)
Pre-WX
actualactualdP (Pa)
house -zone zone
actual actual
outsidehouse -house -
Post-WX
outside outsidezone -zone -
actual
outsidehouse -
actual
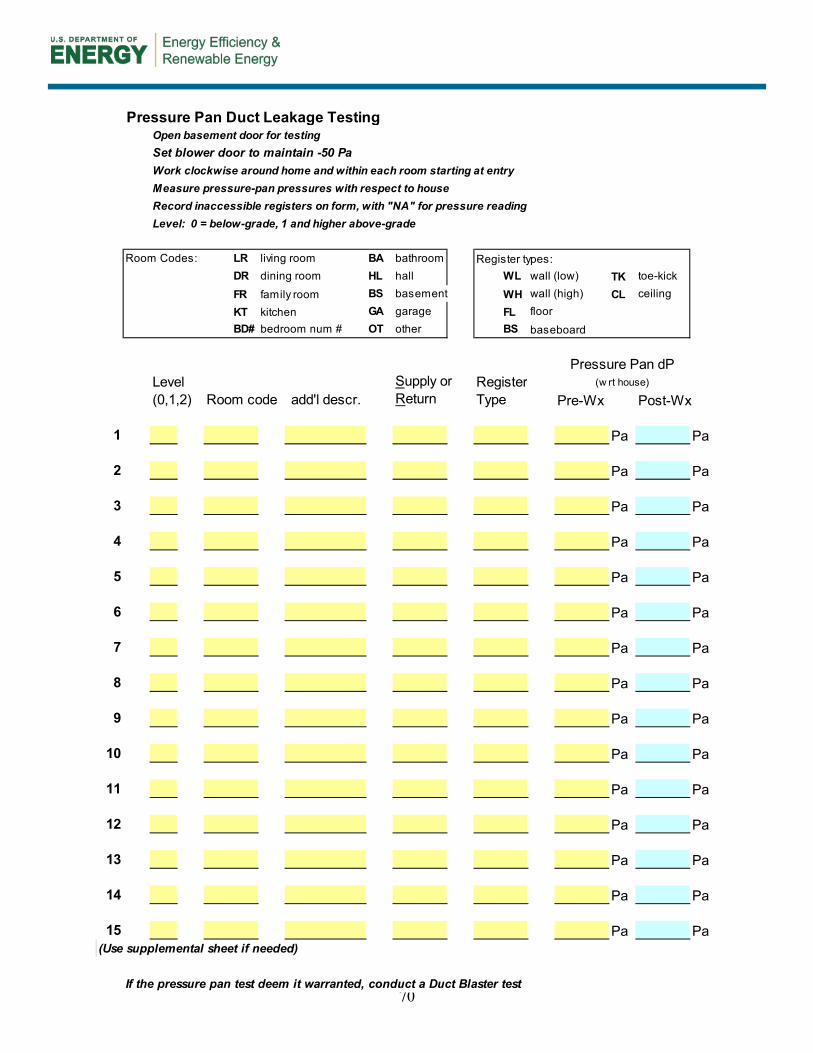
70
Pressure Pan Duct Leakage TestingOpen basement door for testingSet blower door to maintain -50 PaWork clockwise around home and within each room starting at entryMeasure pressure-pan pressures with respect to houseRecord inaccessible registers on form, with "NA" for pressure readingLevel: 0 = below-grade, 1 and higher above-grade
Room Codes: LR living room BA bathroom Register types:DR dining room HL hall WL wall (low) TK toe-kick
FR family room BS basement WH wall (high) CL ceiling
KT kitchen GA garage FL floorBD# bedroom num # OT other BS baseboard
Pressure Pan dPLevel Supply or Register (w rt house)
(0,1,2) Room code add'l descr. Return Type Pre-Wx Post-Wx
1 Pa Pa
2 Pa Pa
3 Pa Pa
4 Pa Pa
5 Pa Pa
6 Pa Pa
7 Pa Pa
8 Pa Pa
9 Pa Pa
10 Pa Pa
11 Pa Pa
12 Pa Pa
13 Pa Pa
14 Pa Pa
15 Pa Pa(Use supplemental sheet if needed)
If the pressure pan test deem it warranted, conduct a Duct Blaster test
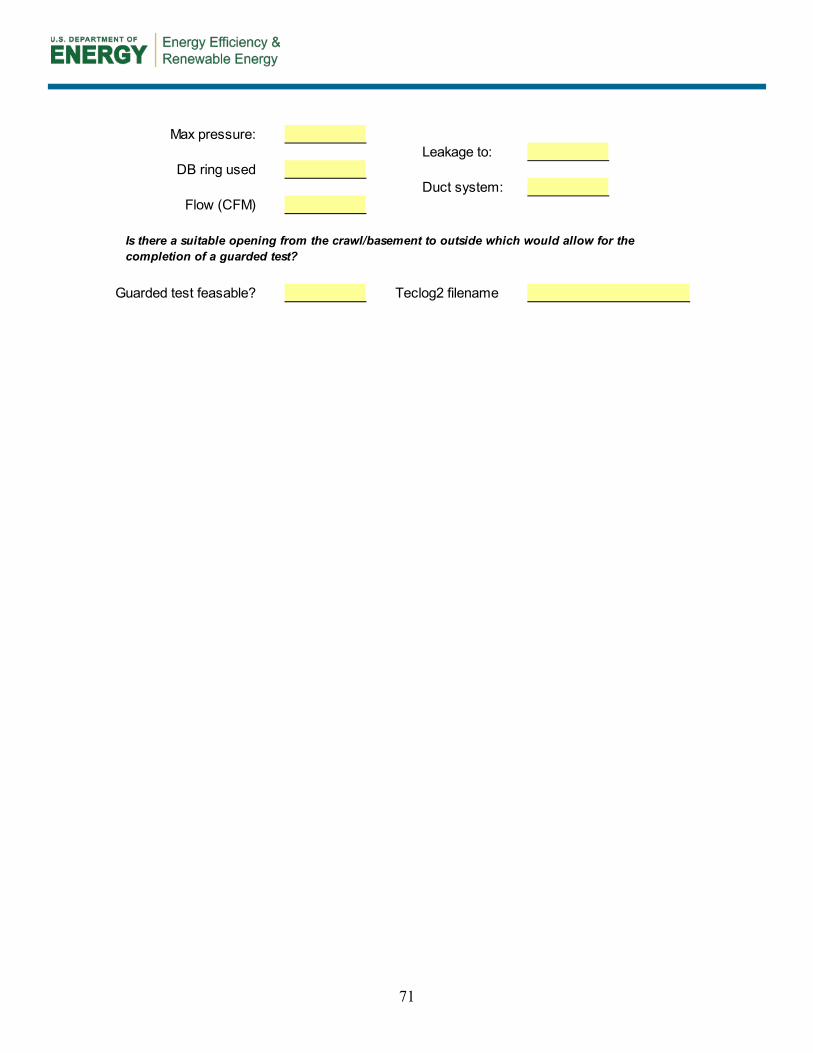
71
Max pressure:Leakage to:
DB ring usedDuct system:
Flow (CFM)
Guarded test feasable? Teclog2 filename
Is there a suitable opening from the crawl/basement to outside which would allow for the completion of a guarded test?
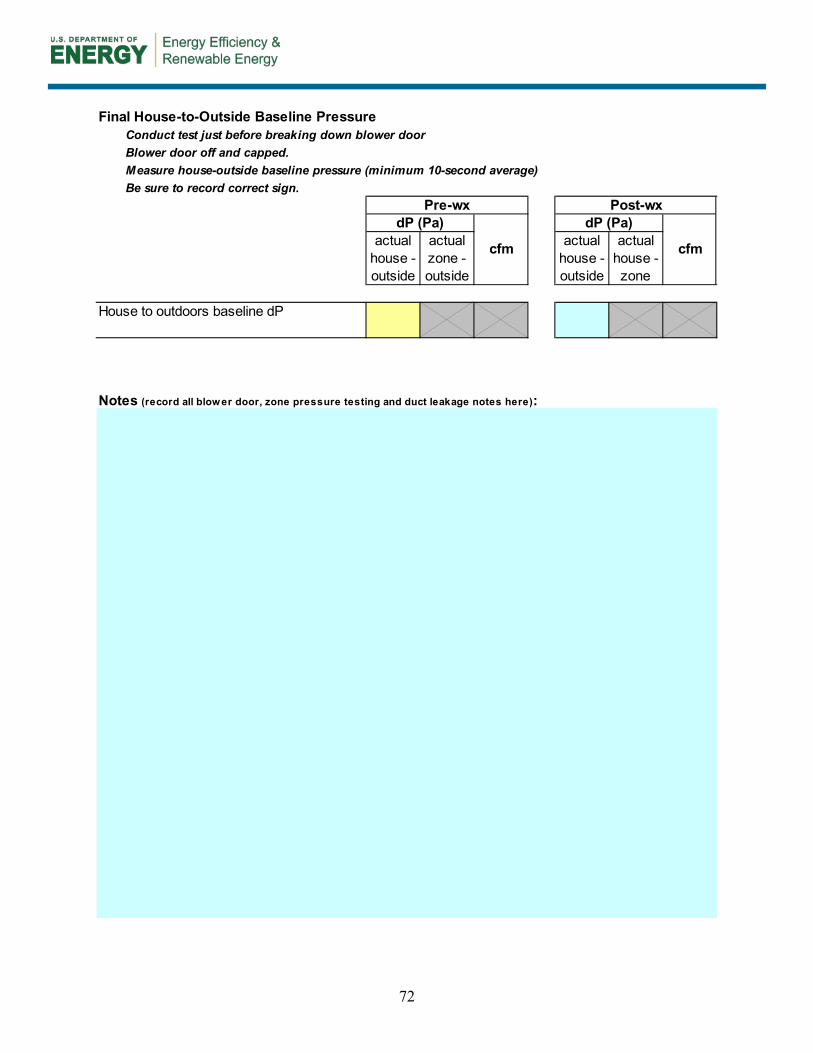
72
Final House-to-Outside Baseline PressureConduct test just before breaking down blower doorBlower door off and capped.Measure house-outside baseline pressure (minimum 10-second average)Be sure to record correct sign.
House to outdoors baseline dP
cfm
dP (Pa)actual
house - house -actualzone -
outside outside
Post-wx
Notes (record all blower door, zone pressure testing and duct leakage notes here):
Pre-wxdP (Pa)
actual actual
zoneoutside
cfmhouse -
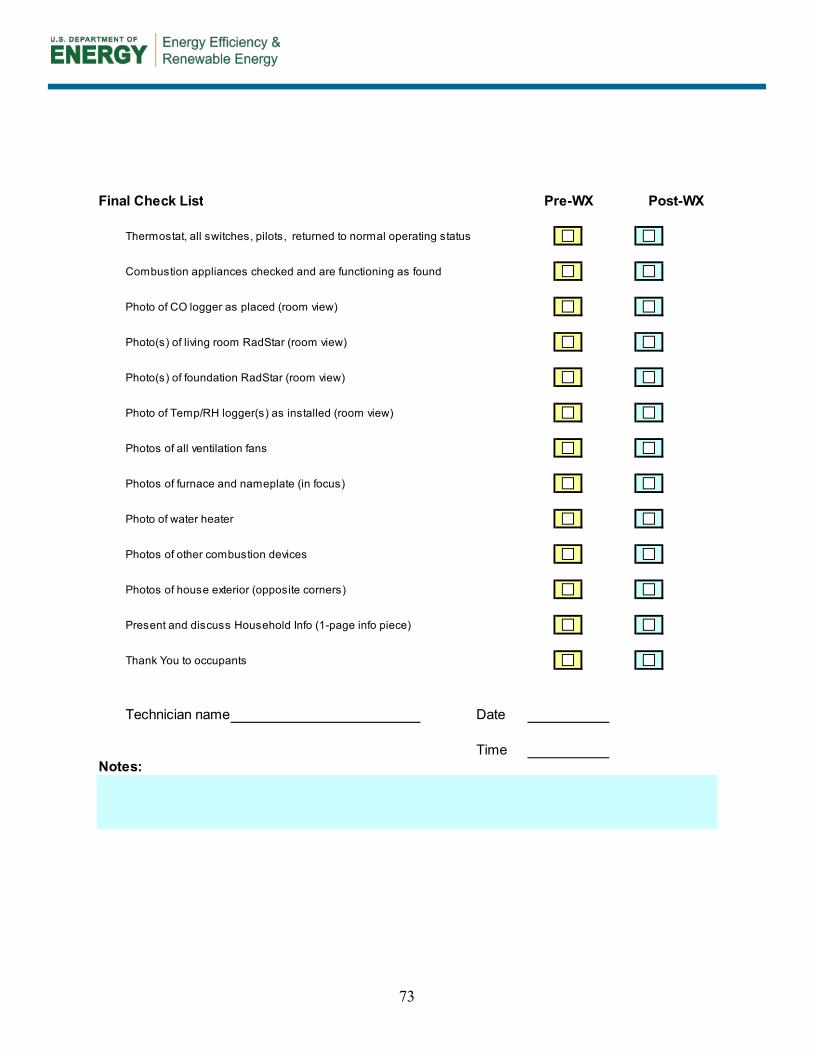
73
Final Check List
Thermostat, all switches, pilots, returned to normal operating status
Combustion appliances checked and are functioning as found
Photo of CO logger as placed (room view)
Photo(s) of living room RadStar (room view)
Photo(s) of foundation RadStar (room view)
Photo of Temp/RH logger(s) as installed (room view)
Photos of all ventilation fans
Photos of furnace and nameplate (in focus)
Photo of water heater
Photos of other combustion devices
Photos of house exterior (opposite corners)
Present and discuss Household Info (1-page info piece)
Thank You to occupants
Technician name Date
TimeNotes:
Pre-WX Post-WX
DOE/GO-102015-4686 September 2015
buildingamerica.gov