Embed Size (px)
Citation preview

EasyChair Preprint№ 4372
Low-Cost Image Processing System forEvaluating Pavement Surface Distress
Keerti Kembhavi, M. R. Archana and V. Anjaneyappa
EasyChair preprints are intended for rapiddissemination of research results and areintegrated with the rest of EasyChair.
October 12, 2020
1
Low-Cost Image Processing System for Evaluating Pavement Surface Distress
Abstract
Most asphalt pavement condition evaluation use rating frameworks in which asphalt pavement distress is
estimated by type, extent, and severity. Rating is carried out by the pavement condition rating (PCR) which are
tedious and expensive. This paper presents the development of a low-cost technique for image pavement distress
analysis that permits the identification of pothole and cracks. Paper explores the application of image processing
tools for the detection of potholes and cracks. Longitudinal cracking and pothole are detected using Fuzzy-C-
Means (FCM) and proceeded with the Spectral Theory algorithm. The framework comprises three phases
including image acquisition, processing, and extraction of features. A digital camera, (Gopro) camera with the
holder is used to capture pavement distress images on a moving vehicle. FCM classifier and Spectral Theory
algorithms are used to compute features and classify the longitudinal cracking and pothole. The Matlab2016Ra
Image preparing tool kit utilizes performance analysis to identify the viability of pavement distress on selected
urban stretches of Bengaluru city, India. The outcomes of image evaluation with the utilization semi-
computerized image handling framework represented the features of longitudinal crack and pothole with an
accuracy of about 80%. Further, the detected images are validated with the actual dimensions and it is seen that
dimension variability is about 0.46. The linear regression model y=1.171x-0.155 is obtained using the existing
and experimental / image processing area. The R2 correlation square obtained from the best fit line is 0.807
which is considered in the linear regression model to be ‘large positive linear association’.
Keywords: Crack detection, Pothole detection, Spectral clustering, Image processing, Image segmentation,
Fuzzy-C-Means (FCM).
1. Introduction
1.1 Background
Pavement condition must be evaluated for planning maintenance activities. The evaluation is carried out either
with manual or automatic methods. Manual evaluation is concentrated and reliant on the evaluator, and is
inclined to subjectivity, which involves high labour costs. Recent advancements in technology that offer an
ever-increasing number of opportunities for automated identification and grouping of pavement distress. After
distress detection, mechanized information is utilized for classifying and auditing. Maintaining the pavement in
an ideal condition while reducing expenses during the design life of the pavement is a challenge. Pavement
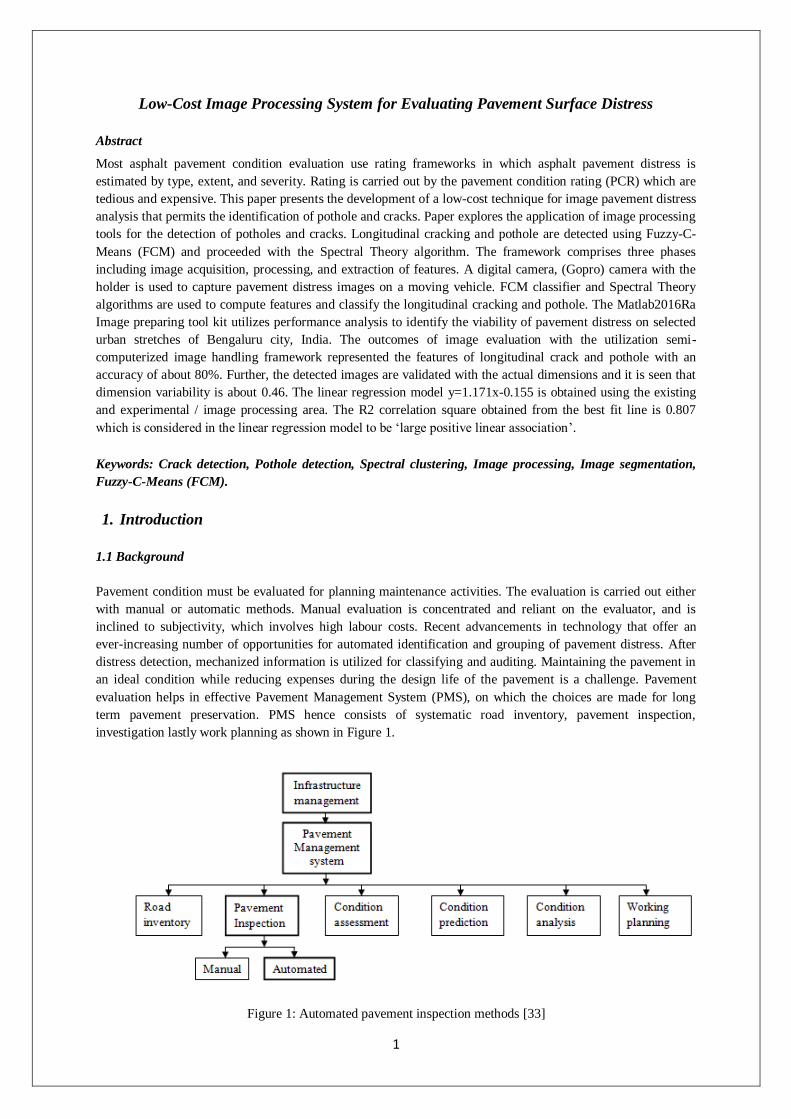
evaluation helps in effective Pavement Management System (PMS), on which the choices are made for long
term pavement preservation. PMS hence consists of systematic road inventory, pavement inspection,
investigation lastly work planning as shown in Figure 1.
Figure 1: Automated pavement inspection methods [33]
2
In recent years, the emphasis has been on the improvement of inventive strategies and algorithms to update
manual-based road condition studies. Although automated computerized solutions have been proposed, a manual
pavement condition survey is still essentially utilized [14, 15] for distinguishing and estimating type and severity of
asphalt pavement distress [16, 17]. The American Vehicle Exploration Department (ATRB) and the UK Transport
Research Laboratory (TRL) have prescribed the elimination of manual tasks to decrease road survey costs, just as
featuring the disadvantages of the new computerized framework is also explained in [14,18].
Many researchers have presented commercial solutions to deal with the different distress. Particularly for the
distresses related to pavement micro-texture to be implemented in a cost-effective way. Distresses such as potholes
show accuracy of scientific method 20% more than commercial method [20].Comparison of multi resolution
methods for detection of pavement distress using [PIAS] Pavement image acquisition system focusing on multi
resolution texture analysis for fast isolation of pavement cracks and potholes using algorithms namely Wavelet,
ridgelet and curvelet based vector have shown that accuracy rate pothole detection is 97.9% [21].A novel
approach called ConnCrack is proposed for road crack detection combining conditional Wasserstein generative
adversarial network and connection maps by fixing Gopro camera, on the rearside of the moving vehicle achieves
state-of-the-art efficiency of 72% compared to other methods [22].Another novel detection algorithm based on
fuzzy logic is used as a feature of transformation which can classify the cracks type based on information from the
projections in four directions [23]. Summary of image processing methods for detecting crack on road pavement
are presented [24]. New non-supervised approach on spectral clustering system detected all potholes on the surface
with an accuracy of 81 per cent [25].Detection of crack using three pattern recognition algorithms (i.e. K-nearest
neighbours, artificial neural network, and vector supporting machine) .The support vector machine model was
obtained with calibration set recognition rates of 95.1 percent and prediction set rates of 97.1 percent [26]
A literature review was carried out to get a better understanding of topics related to image processing and its
various techniques, algorithms related to vision-based, block-based, and clustering methods. Researchers have
presented different automatic pavement evaluation system in which images are collected from the video/camera
being mounted on the vehicle. It can be seen that in the era of intelligent vehicle technology, big data, and
IoT(Internet of things) that such techniques can serve as a data provider.
Although numerous analysts attempted to introduce strategies and gadgets for a superior assessment of asphalt
surface features, center around minimal effort innovation, use of portable smart-phones and such low-cost approach
of evaluation techniques are not so popular. Most of the studies show that a single algorithm is used to detect a
single type of distress. In this paper, an attempt is made to use combination k-Nearest Neighbor (kNN) and spectral
theory algorithm algorithms, and a single code is prepared, which can identify multiple distresses using a single
system.
1.2 Objective of paper
The objective of this work is to provide automatic pavement condition assessment utilizing image processing
techniques
i. To process and investigate the pavement distress and to develop a technique for assessment of asphalt
pavement surface condition.
ii. Assess the efficiency of feature analysis.
2. Theory and Concepts
In this section, a short presentation of employed techniques such as fuzzy C-means (FCM) clustering, spectral
clustering algorithms are mentioned in brief.
3
Three predominant strategies are utilized, to identify the features of an image. Filtering techniques are used
specifically to obtain specific features. Wrapper techniques use a goal characteristic to pick characteristic features.
Embedded techniques are hybrid techniques which integrate the two strategies mentioned previously.
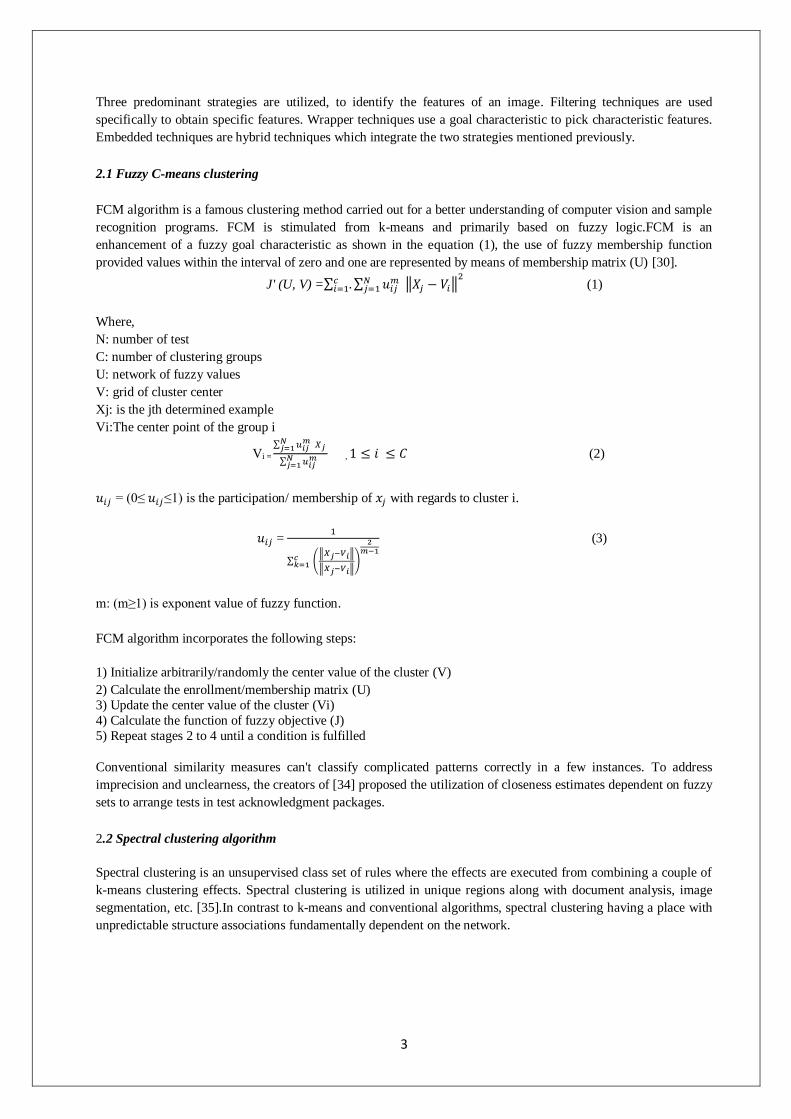
2.1 Fuzzy C-means clustering
FCM algorithm is a famous clustering method carried out for a better understanding of computer vision and sample
recognition programs. FCM is stimulated from k-means and primarily based on fuzzy logic.FCM is an
enhancement of a fuzzy goal characteristic as shown in the equation (1), the use of fuzzy membership function
provided values within the interval of zero and one are represented by means of membership matrix (U) [30].
J' (U, V) =∑ .𝑐𝑖=1 ∑ 𝑢𝑖𝑗
𝑚 ‖𝑋𝑗 − 𝑉𝑖‖2𝑁
𝑗=1 (1)
Where,
N: number of test
C: number of clustering groups
U: network of fuzzy values
V: grid of cluster center
Xj: is the jth determined example
Vi:The center point of the group i
Vi =
∑ 𝑢𝑖𝑗 𝑚 𝑋𝑗 𝑁
𝑗=1
∑ 𝑢𝑖𝑗 𝑚𝑁
𝑗=1 , 1 ≤ 𝑖 ≤ 𝐶 (2)
𝑢𝑖𝑗 = (0≤ 𝑢𝑖𝑗≤1) is the participation/ membership of 𝑥𝑗 with regards to cluster i.
𝑢𝑖𝑗 = 1
∑ (‖𝑋𝑗−𝑉𝑖‖
‖𝑋𝑗−𝑉𝑖‖)
2𝑚−1
𝑐𝑘=1
(3)
m: (m≥1) is exponent value of fuzzy function.
FCM algorithm incorporates the following steps:
1) Initialize arbitrarily/randomly the center value of the cluster (V)
2) Calculate the enrollment/membership matrix (U)
3) Update the center value of the cluster (Vi)
4) Calculate the function of fuzzy objective (J)
5) Repeat stages 2 to 4 until a condition is fulfilled
Conventional similarity measures can't classify complicated patterns correctly in a few instances. To address
imprecision and unclearness, the creators of [34] proposed the utilization of closeness estimates dependent on fuzzy
sets to arrange tests in test acknowledgment packages.
2.2 Spectral clustering algorithm
Spectral clustering is an unsupervised class set of rules where the effects are executed from combining a couple of
k-means clustering effects. Spectral clustering is utilized in unique regions along with document analysis, image
segmentation, etc. [35].In contrast to k-means and conventional algorithms, spectral clustering having a place with
unpredictable structure associations fundamentally dependent on the network.
4
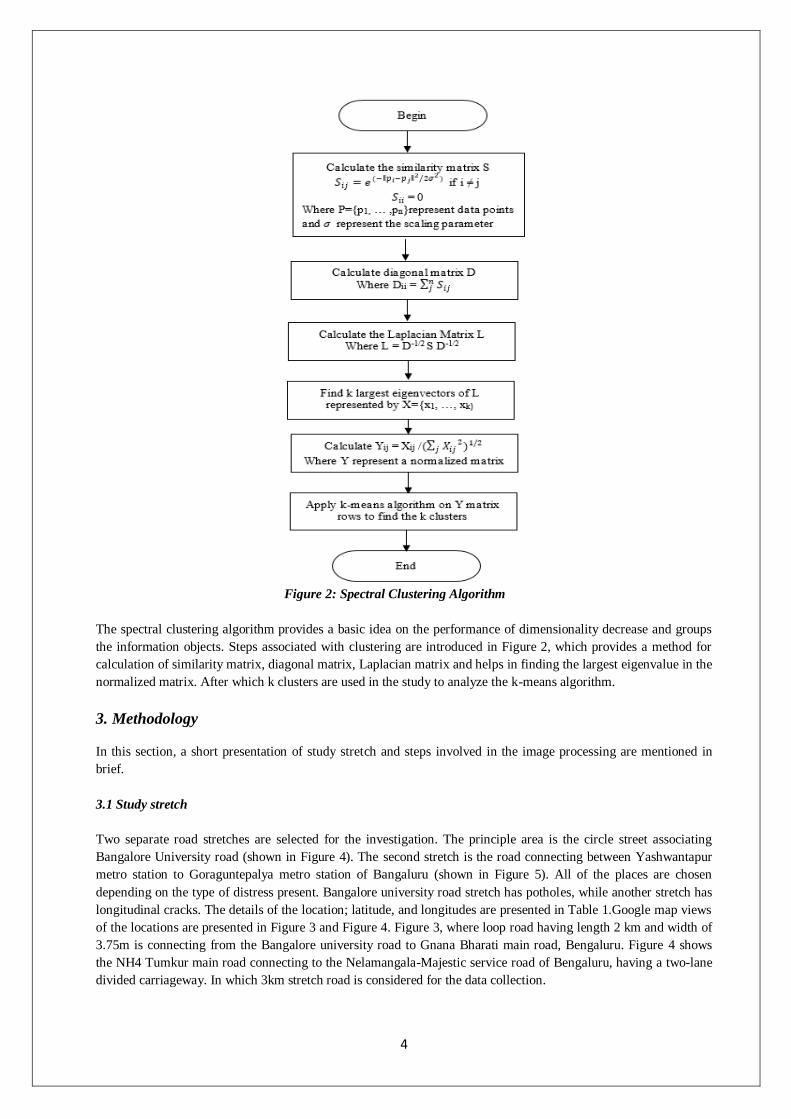
Figure 2: Spectral Clustering Algorithm
The spectral clustering algorithm provides a basic idea on the performance of dimensionality decrease and groups
the information objects. Steps associated with clustering are introduced in Figure 2, which provides a method for
calculation of similarity matrix, diagonal matrix, Laplacian matrix and helps in finding the largest eigenvalue in the
normalized matrix. After which k clusters are used in the study to analyze the k-means algorithm.
3. Methodology
In this section, a short presentation of study stretch and steps involved in the image processing are mentioned in
brief.
3.1 Study stretch
Two separate road stretches are selected for the investigation. The principle area is the circle street associating
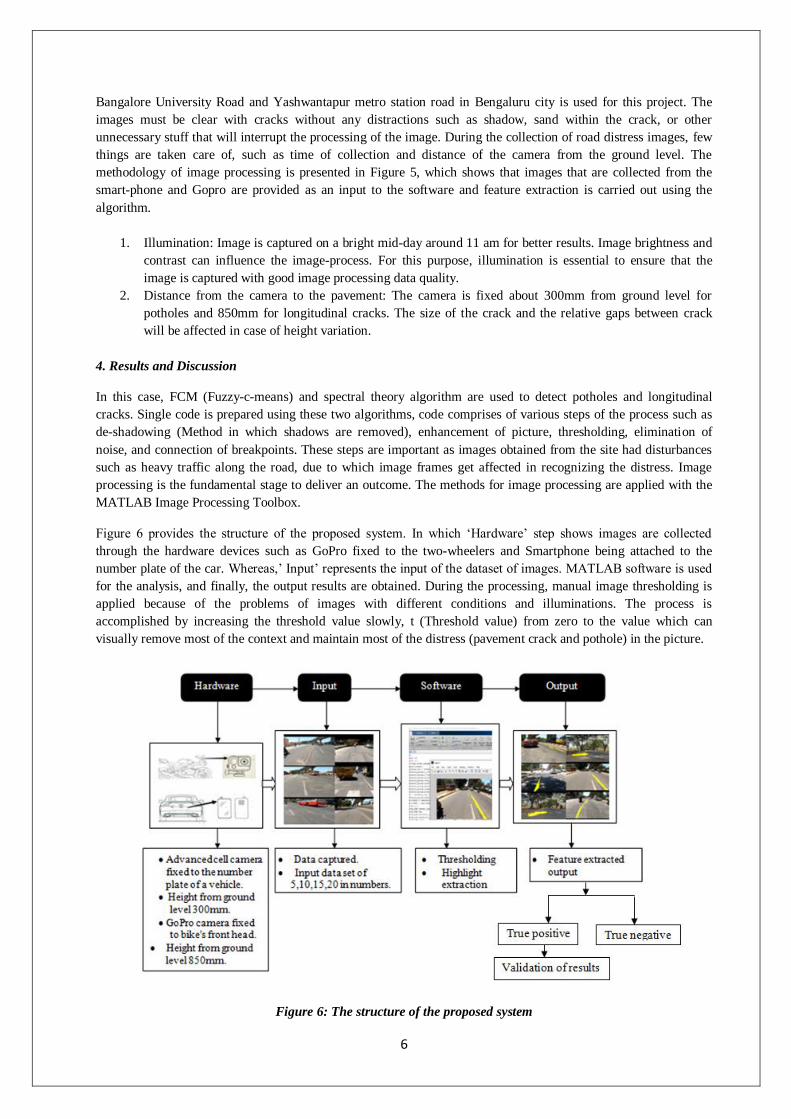
Bangalore University road (shown in Figure 4). The second stretch is the road connecting between Yashwantapur
metro station to Goraguntepalya metro station of Bangaluru (shown in Figure 5). All of the places are chosen
depending on the type of distress present. Bangalore university road stretch has potholes, while another stretch has
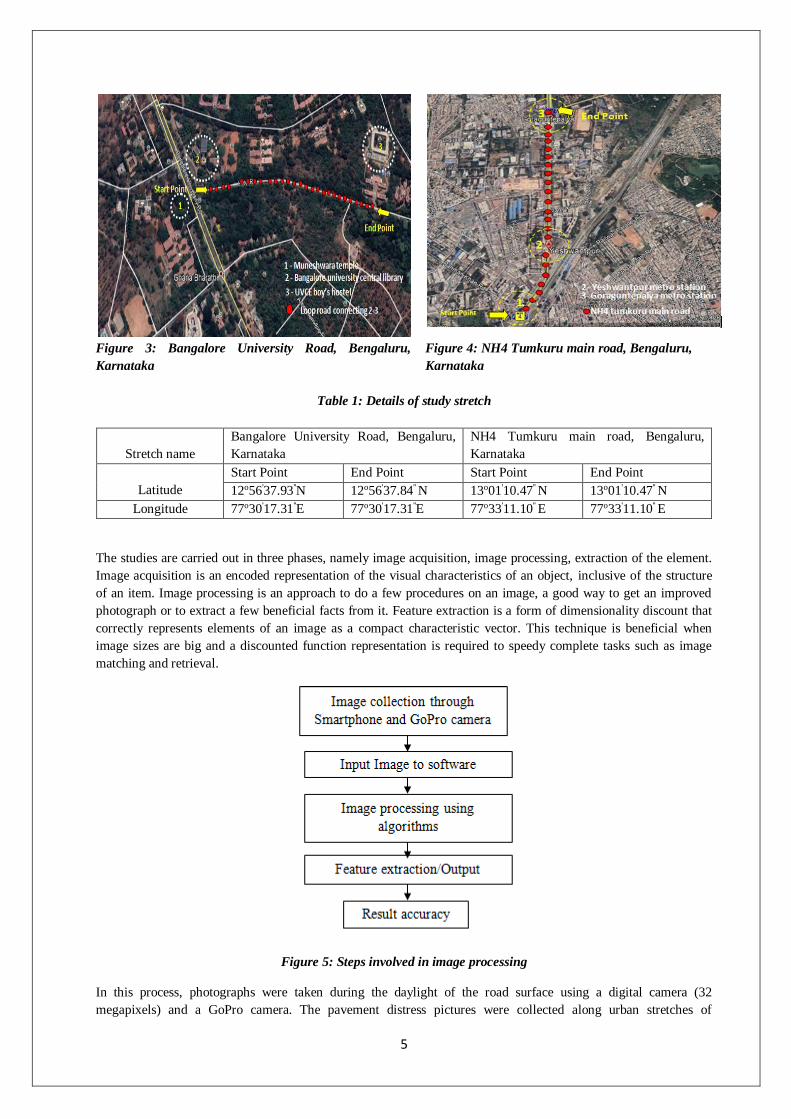
longitudinal cracks. The details of the location; latitude, and longitudes are presented in Table 1.Google map views
of the locations are presented in Figure 3 and Figure 4. Figure 3, where loop road having length 2 km and width of
3.75m is connecting from the Bangalore university road to Gnana Bharati main road, Bengaluru. Figure 4 shows
the NH4 Tumkur main road connecting to the Nelamangala-Majestic service road of Bengaluru, having a two-lane
divided carriageway. In which 3km stretch road is considered for the data collection.
5
Figure 3: Bangalore University Road, Bengaluru,
Karnataka
Figure 4: NH4 Tumkuru main road, Bengaluru,
Karnataka
Table 1: Details of study stretch
Stretch name
Bangalore University Road, Bengaluru,
Karnataka
NH4 Tumkuru main road, Bengaluru,
Karnataka
Latitude
Start Point End Point Start Point End Point
12o56'37.93''N 12o56'37.84'' N 13o01'10.47'' N 13o01'10.47'' N
Longitude 77o30'17.31''E 77o30'17.31''E 77o33'11.10'' E 77o33'11.10'' E
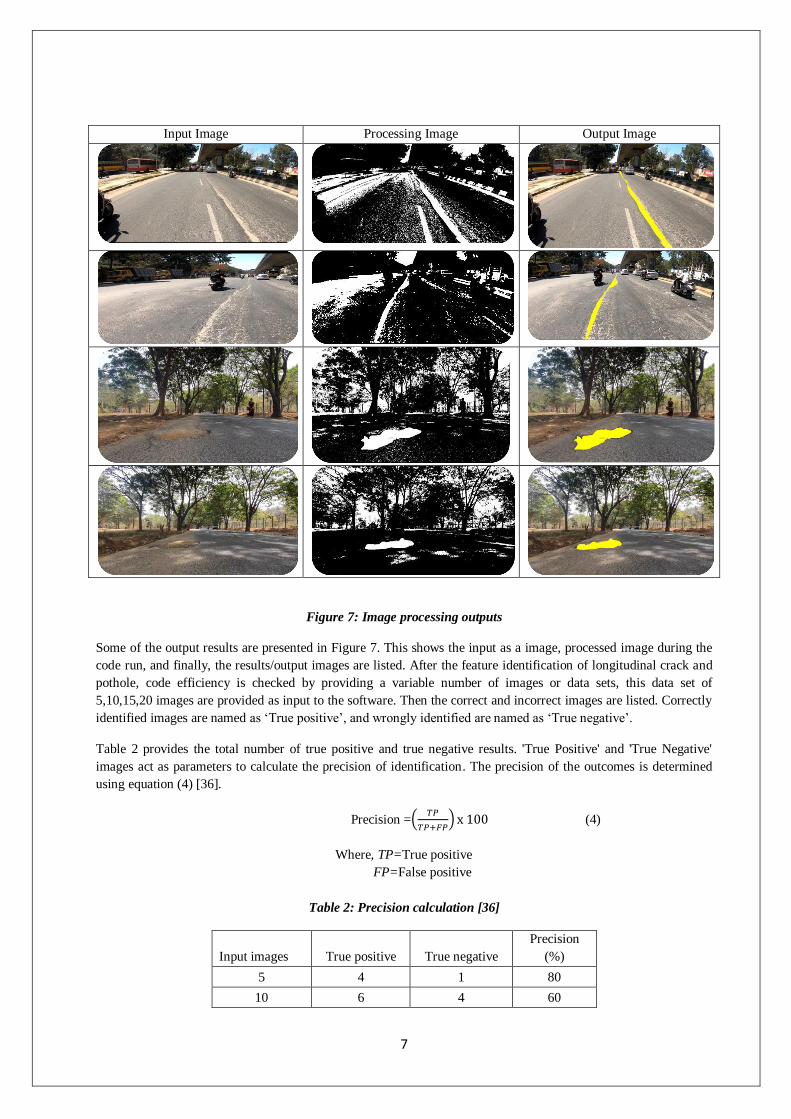
The studies are carried out in three phases, namely image acquisition, image processing, extraction of the element.
Image acquisition is an encoded representation of the visual characteristics of an object, inclusive of the structure
of an item. Image processing is an approach to do a few procedures on an image, a good way to get an improved
photograph or to extract a few beneficial facts from it. Feature extraction is a form of dimensionality discount that
correctly represents elements of an image as a compact characteristic vector. This technique is beneficial when
image sizes are big and a discounted function representation is required to speedy complete tasks such as image
matching and retrieval.
Figure 5: Steps involved in image processing
In this process, photographs were taken during the daylight of the road surface using a digital camera (32
megapixels) and a GoPro camera. The pavement distress pictures were collected along urban stretches of
6
Bangalore University Road and Yashwantapur metro station road in Bengaluru city is used for this project. The
images must be clear with cracks without any distractions such as shadow, sand within the crack, or other
unnecessary stuff that will interrupt the processing of the image. During the collection of road distress images, few
things are taken care of, such as time of collection and distance of the camera from the ground level. The
methodology of image processing is presented in Figure 5, which shows that images that are collected from the
smart-phone and Gopro are provided as an input to the software and feature extraction is carried out using the
algorithm.
1. Illumination: Image is captured on a bright mid-day around 11 am for better results. Image brightness and
contrast can influence the image-process. For this purpose, illumination is essential to ensure that the
image is captured with good image processing data quality.
2. Distance from the camera to the pavement: The camera is fixed about 300mm from ground level for
potholes and 850mm for longitudinal cracks. The size of the crack and the relative gaps between crack
will be affected in case of height variation.
4. Results and Discussion
In this case, FCM (Fuzzy-c-means) and spectral theory algorithm are used to detect potholes and longitudinal
cracks. Single code is prepared using these two algorithms, code comprises of various steps of the process such as
de-shadowing (Method in which shadows are removed), enhancement of picture, thresholding, elimination of
noise, and connection of breakpoints. These steps are important as images obtained from the site had disturbances
such as heavy traffic along the road, due to which image frames get affected in recognizing the distress. Image
processing is the fundamental stage to deliver an outcome. The methods for image processing are applied with the
MATLAB Image Processing Toolbox.
Figure 6 provides the structure of the proposed system. In which ‘Hardware’ step shows images are collected
through the hardware devices such as GoPro fixed to the two-wheelers and Smartphone being attached to the
number plate of the car. Whereas,’ Input’ represents the input of the dataset of images. MATLAB software is used
for the analysis, and finally, the output results are obtained. During the processing, manual image thresholding is
applied because of the problems of images with different conditions and illuminations. The process is
accomplished by increasing the threshold value slowly, t (Threshold value) from zero to the value which can
visually remove most of the context and maintain most of the distress (pavement crack and pothole) in the picture.
Figure 6: The structure of the proposed system
7
Input Image Processing Image Output Image
Figure 7: Image processing outputs
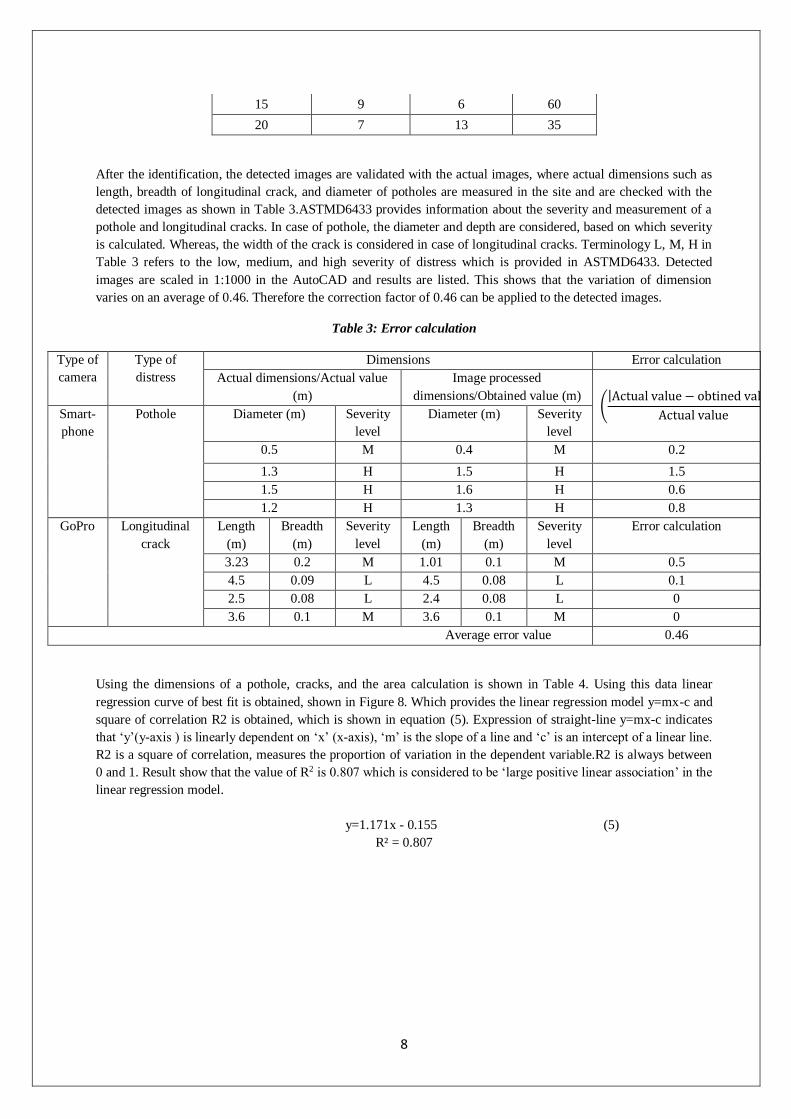
Some of the output results are presented in Figure 7. This shows the input as a image, processed image during the
code run, and finally, the results/output images are listed. After the feature identification of longitudinal crack and
pothole, code efficiency is checked by providing a variable number of images or data sets, this data set of
5,10,15,20 images are provided as input to the software. Then the correct and incorrect images are listed. Correctly
identified images are named as ‘True positive’, and wrongly identified are named as ‘True negative’.
Table 2 provides the total number of true positive and true negative results. 'True Positive' and 'True Negative'
images act as parameters to calculate the precision of identification. The precision of the outcomes is determined
using equation (4) [36].
Precision =(𝑇𝑃
𝑇𝑃+𝐹𝑃) x 100 (4)
Where, TP=True positive
FP=False positive
Table 2: Precision calculation [36]
Input images True positive True negative
Precision
(%)
5 4 1 80
10 6 4 60
8
15 9 6 60
20 7 13 35
After the identification, the detected images are validated with the actual images, where actual dimensions such as
length, breadth of longitudinal crack, and diameter of potholes are measured in the site and are checked with the
detected images as shown in Table 3.ASTMD6433 provides information about the severity and measurement of a
pothole and longitudinal cracks. In case of pothole, the diameter and depth are considered, based on which severity
is calculated. Whereas, the width of the crack is considered in case of longitudinal cracks. Terminology L, M, H in
Table 3 refers to the low, medium, and high severity of distress which is provided in ASTMD6433. Detected
images are scaled in 1:1000 in the AutoCAD and results are listed. This shows that the variation of dimension
varies on an average of 0.46. Therefore the correction factor of 0.46 can be applied to the detected images.
Table 3: Error calculation
Type of
camera
Type of
distress
Dimensions Error calculation
Actual dimensions/Actual value
(m)
Image processed
dimensions/Obtained value (m)
(|Actual value − obtined value|
Actual value)
Smart-
phone
Pothole Diameter (m) Severity
level
Diameter (m) Severity
level
0.5 M 0.4 M 0.2
1.3 H 1.5 H 1.5
1.5 H 1.6 H 0.6
1.2 H 1.3 H 0.8
GoPro Longitudinal
crack
Length
(m)
Breadth
(m)
Severity
level
Length
(m)
Breadth
(m)
Severity
level
Error calculation
3.23 0.2 M 1.01 0.1 M 0.5
4.5 0.09 L 4.5 0.08 L 0.1
2.5 0.08 L 2.4 0.08 L 0
3.6 0.1 M 3.6 0.1 M 0
Average error value 0.46
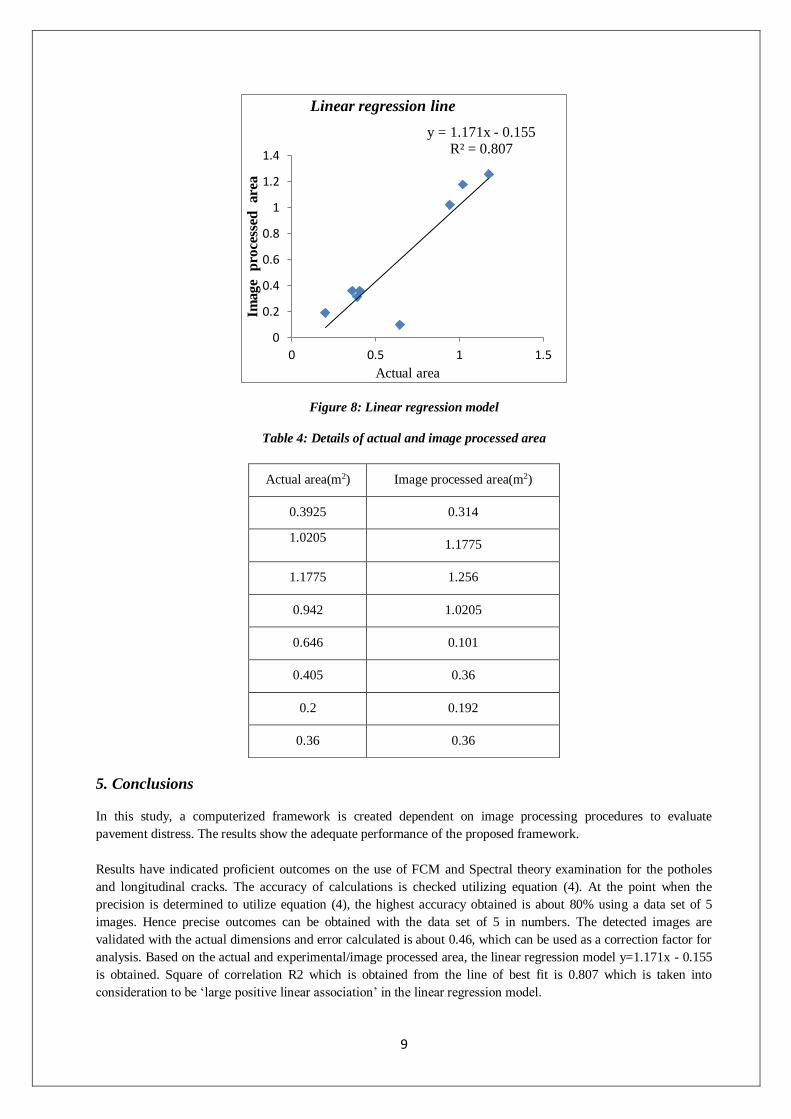
Using the dimensions of a pothole, cracks, and the area calculation is shown in Table 4. Using this data linear
regression curve of best fit is obtained, shown in Figure 8. Which provides the linear regression model y=mx-c and
square of correlation R2 is obtained, which is shown in equation (5). Expression of straight-line y=mx-c indicates
that ‘y’(y-axis ) is linearly dependent on ‘x’ (x-axis), ‘m’ is the slope of a line and ‘c’ is an intercept of a linear line.
R2 is a square of correlation, measures the proportion of variation in the dependent variable.R2 is always between
0 and 1. Result show that the value of R2 is 0.807 which is considered to be ‘large positive linear association’ in the
linear regression model.
y=1.171x - 0.155 (5)
R² = 0.807
9
Figure 8: Linear regression model
Table 4: Details of actual and image processed area
5. Conclusions
In this study, a computerized framework is created dependent on image processing procedures to evaluate
pavement distress. The results show the adequate performance of the proposed framework.
Results have indicated proficient outcomes on the use of FCM and Spectral theory examination for the potholes
and longitudinal cracks. The accuracy of calculations is checked utilizing equation (4). At the point when the
precision is determined to utilize equation (4), the highest accuracy obtained is about 80% using a data set of 5
images. Hence precise outcomes can be obtained with the data set of 5 in numbers. The detected images are
validated with the actual dimensions and error calculated is about 0.46, which can be used as a correction factor for
analysis. Based on the actual and experimental/image processed area, the linear regression model y=1.171x - 0.155
is obtained. Square of correlation R2 which is obtained from the line of best fit is 0.807 which is taken into
consideration to be ‘large positive linear association’ in the linear regression model.
y = 1.171x - 0.155R² = 0.807
0
0.2
0.4
0.6
0.8
1
1.2
1.4
0 0.5 1 1.5
Imag
e p
roce
ssed
are
a
Actual area
Linear regression line
Actual area(m2) Image processed area(m2)
0.3925 0.314
1.0205 1.1775
1.1775 1.256
0.942 1.0205
0.646 0.101
0.405 0.36
0.2 0.192
0.36 0.36

10
To get productive yield, the picture must be clear without unsettling influences, such as darkness, sand within
agitation, or other disruptions that will interrupt the image processing. In this work, extensive time and exertion
were distributed to achieve dependable outcomes which can be influenced by environmental factors. Even though
the image obtaining process needs traffic controlling. The benefit of this system is its quick-handling, operation
ease, and easy to use work. Also, it can identify the feature of distress, which is significant for choosing
maintenance strategies. The consequences of the proposed system can be actualized in the project level pavement
management systems and also for road safety enhancement.
11
REFERENCES
[1] C. Koch, K. Georgieva, V. Kasireddy, B. Akinci, and P. Fieguth, “A review on computer vision-based defect
detection and condition assessment of concrete and asphalt civil infrastructure”, Advanced Engineering
Informatics, 29(2), 196-210, 2015.
[2] H. Zakeri, F.M. Nejad, and A. Fahimifar. "Image-Based Techniques for Crack Detection, Classification, and
Quantification in Asphalt Pavement: A Review." Archives of Computational Methods in Engineering 1-43, (2016).
[3] M. Gopikrishna, G. Baladi, T. Dawson, M. Prohaska, and K. Thomas. "Impacts of Maintenance Treatments on
the Life Cycle Pavement Condition and Distress of the LTPP SPS-3 Test Sections." In Transportation Research
Board 95th Annual Meeting, no. 16-5077. 2016. [4] D. Wang, C.F. Augusto, M. Goeke, M.P. Wistuba, and Y.
Tsai. "A multi-scale diagnosis model for asphalt pavement cracking in China." In Functional Pavement Design:
Proceedings of the 4th Chinese-European Workshop on Functional Pavement Design (4th CEW 2016, Delft, The
Netherlands, July 2016.
[5] L. Li, and K.C.P. Wang. "Bounding Box–Based Technique for Pavement Crack Classification and
Measurement Using 1 mm 3D Laser Data." Journal of Computing in Civil Engineering 30, no. 5, 2016.
[6] A. Banharnsakun. "Hybrid ABC-ANN for pavement surface distress detection and classification." International
Journal of Machine Learning and Cybernetics 8, no. 2, 2017.
[7] H. Rababaah, "Asphalt pavement crack classification: A comparative study of three AI approaches: Multilayer
perceptron, genetic algorithms, and self-organizing maps." Ph.D. diss., Indiana University South Bend, 2005.
[8] T. Saar and O. Talvik. "Automatic asphalt pavement crack detection and classification using neural networks."
In Electronics Conference (BEC), 2010 12th Biennial Baltic, pp. 345-348. 2010.
[9] P. Lv, P. Yang, Y. Dong and L. Gu. "An efficient and scalable KNN based on Euclidean similarity." 2016 IEEE
International Joint Conference on Neural Networks (IJCNN), pp. 5141-5148., 2016.
[10] P. Thamilselvan J.G.R. Sathiaseelan. "A comparative study of data mining algorithms for image
classification." International Journal of Education and Management Engineering 2, 2015.
[11] S.S. Tabrizi, and N. Cavus. "A hybrid KNN-SVM model for Iranian license plate recognition." Procedia
Computer Science 102:588-594, 2016.
[12] A. Shubair, S. Ramadass, and A.A. Altyeb. "kENFIS: kNN-based evolving neuro-fuzzy inference system for
computer worms detection." Journal of Intelligent & Fuzzy Systems 26, no. 4, 2014.
[13] S. Sajadi, and M. Amirfakhrian. "Fuzzy K-Nearest Neighbor Method to Classify Data in a Closed Area"
International Journal of Mathematical Modelling & Computations 3, no. 2, 109-114, 2013.
[14] R. Medina, J. Gmez-Garca-Bermejo, E. Zalam, Automated visual inspection of road surface cracks,
Proceeding of the 27th ISARC, IIT Madras, 25–27 June 2010, Chennai, India, 2010, pp. 155–164.
[15] A. Wimsatt, S. Hurlebaus, T. Scullion, E. Fernando, Promising existing and emerging technologies and
techniques, Proceedings of the International Symposium on Nondestructive Testing for Design Evaluation and
Construction Inspection, Washington, DC, USA, 18 January 2008, 2008.
[16] Y.O. Ouma, J. Opudo, S. Nyambenya, Comparison of fuzzy AHP and fuzzy TOPSIS for road pavement
maintenance prioritization: methodological exposition and case study, Adv. Civ. Eng. 2015 (2015) 1–17
140189(140189).
[17] S.C. Radopoulou, I. Brilakis, Improving road asset condition monitoring, Transp. Res. Procedia 14 (2016)
(2016) 3004–3012. 2016.05.436.
[18] S. M Robbie, A. Wright, Crack Detection on Local Roads. TTS Research-Phase I, Transport Research
Laboratory, Washington, DC, USA, 2005.
[19] E. Schnebele, B.F. Tanyu, G. Cervone, N. Waters, Review of remote sensing methodologies for pavement
management and assessment, Eur. Transp. Res. Rev. 7 (7) (2015) 1–19.
[20]T. B. J. Coenen and A. Golroo, “A review on automated pavement distress detection
methods,”CogentEng.,vol.4,no.1,pp.1–23, 2017, doi: 10.1080/23311916.2017.1374822.
[21]F. Moghadas Nejad and H. Zakeri, “A comparison of multi-resolution methods for detection and isolation of
pavement distress,” Expert Syst. Appl., vol. 38, no. 3, pp. 2857–2872, 2011, doi: 10.1016/j.eswa.2010.08.079.
[22]Q. Mei and M. Gül, “A cost effective solution for pavement crack inspection using cameras and deep neural
networks,” Constr. Build. Mater., vol. 256, no. November, 2020, doi: 10.1016/j.conbuildmat.2020.119397.
[23]Q. Li and X. Liu, “Novel approach to pavement image segmentation based on neighboring difference
histogram method,” Proc. - 1st Int. Congr. Image Signal Process. CISP 2008, vol. 2, pp. 792–796, 2008, doi:
12
10.1109/CISP.2008.13.
[24]S. Chambon and J. M. Moliard, “Automatic road pavement assessment with image processing: Review and
comparison,” Int. J. Geophys., vol. 2011, 2011, doi: 10.1155/2011/989354.
[25]M. Graphics, M. Nieniewski, L. J. Chmielewski, and A. Informatics, “Morphological detection and feature-
based classification of cracked regions in ferrites,” no. January, 1999.
[26] H. Lin, J. Zhao, L. Sun, Q. Chen, Z. Sun, and F. Zhou, “Stiffness measurement of eggshell by acoustic
resonance and PLS models,” J. Food Eng., vol. 103, no. 4, pp. 351–356, 2011, doi: 10.1016/j.jfoodeng.2010.11.
003.
[27]X. J. Wan, L. Liu, Z. Xu, Z. Xu, Q. Li, and F. Xu, “Fault diagnosis of rolling bearing based on optimized soft
competitive learning Fuzzy ART and similarity evaluation technique,” Adv. Eng. Informatics, vol. 38, no. July
2017, pp. 91–100, 2018, doi: 10.1016/j.aei.2018.06.006.
[28]G. M. Hadjidemetriou, P. A. Vela, and S. E. Christodoulou, “Automated Pavement Patch Detection and
Quantification Using Support Vector Machines,” J. Comput. Civ. Eng., vol. 32, no. 1, 2018, doi:
10.1061/(ASCE)CP.1943-5487.0000724.
[29]G. M. Hadjidemetriou, P. A. Vela, and S. E. Christodoulou, “Automated Pavement Patch Detection and
Quantification Using Support Vector Machines,” J. Comput. Civ. Eng., vol. 32, no. 1, pp. 1–11, 2018, doi:
10.1061/(ASCE)CP.1943-5487.0000724.
[30] Abdelkarim Ben Ayed, Mohamed Ben Halima, Adel M. Alimi. "Adaptive fuzzy exponent cluster ensemble
system based feature selection and spectral clustering", 2017 IEEE International Conference on Fuzzy Systems (FUZZ-IEEE), 2017
[31]N. D. Hoang, “Image processing based automatic recognition of asphalt pavement patch using a metaheuristic
optimized machine learning approach,” Adv. Eng. Informatics, vol. 40, no. April, pp. 110–120, 2019, doi:
10.1016/j.aei.2019.04.004.
[32]W. Yeung and X. Yuan, “A low-cost video-based pavement distress screening system for low volume roads.”
[33] Cohen, A., Rabut, C., Schumaker, L., (Eds.), Curves and Surface ... Chambon, S., Moliard,
J.M., 2011. Automatic road pavement assessment with image processing review and comparison. Int. J. Geophy,
2011.20”
[34] L. Baccour, A.M. Alimi, R.I. John: Similarity measures for intuitionistic fuzzy sets: State of the art, J. Intell.
Fuzzy Syst. 24(1), 37–49, 2013.
[35]Kutter M., Jordan F. and Ebrahimi T.: Proposal of a watermarking technique for hiding/retriving data in
compressed and ... 179182, 2001
[36] Q. Mei and M. Gül, “A cost effective solution for pavement crack inspection using cameras and deep neural
networks,” Constr. Build. Mater., vol. 256, no. November, 2020, doi: 10.1016/j.conbuildmat.2020.119397.
[37]Y. Zhou, F. Wang, N. Meghanathan, and Y. Huang, “Seed-based approach for automated crack detection from
pavement images,” Transp. Res. Rec., vol. 2589, no. January, pp. 162–171, 2016, doi: 10.3141/2589-18.
[38]E. Salari and G. Bao, “Automated pavement distress inspection based on 2D and 3D information,” IEEE Int.
Conf. Electro Inf. Technol., pp. 2–5, 2011, doi: 10.1109/EIT.2011.5978575.
[39]H. D. Cheng and M. Miyojim, “Novel system for automatic pavement distress detection,” J. Comput. Civ.
Eng., vol. 12, no. 3, pp. 145–152, 1998, doi: 10.1061/(ASCE)0887-3801(1998)12:3(145).
[40]W. Y. Yan and X. X. Yuan, “A low-cost video-based pavement distress screening system for low-volume
roads,” J. Intell. Transp. Syst. Technol. Planning, Oper., vol. 22, no. 5, pp. 376–389, 2018, doi:
10.1080/15472450.2017.1366320.


![Concrete Paving Session - [[Organization]] | [[City, …web.ftba.com/external/wcpages/wcmedia/documents/SCHIESS_Concet… · evaluating pavement structures using ... ´1986 AASHTO](https://img.pdfslide.us/doc/110x75/5b94c9b909d3f252738d6db2/concrete-paving-session-organization-city-webftbacomexternalwcpageswcmediadocumentsschiessconcet.jpg)