Embed Size (px)
Citation preview

13th World Conference on Earthquake Engineering Vancouver, B.C., Canada
August 1-6, 2004 Paper No. 2003
LOW-COST ACCELEROMETERS FOR STUDENT LABORATORY PROJECTS
Can C. SIMSIR1 and Mark A. ASCHHEIM2
SUMMARY This paper describes the results of a project to develop low-cost accelerometers for use by students in earthquake engineering. With the basic knowledge of accelerometer circuit electronics explained in this paper, students can fabricate a custom-made accelerometer tailored to the specific needs of an experiment for approximately US$ 45. Frequency response characteristics of the accelerometer obtained from forced vibration tests are presented. Comparisons are made with the performance of two other accelerometers. The low-cost accelerometer has good response characteristics over a large range of frequencies, that compare well to other commercially available accelerometers.
INTRODUCTION In a collaborative effort headed by the Mid-America Earthquake Center, three earthquake engineering research centers (MAE, MCEER, PEER) formed the University Consortium for Instructional Shake Tables (UCIST) to develop plans for the construction of a bench-top shake table. Funded by the National Science Foundation, UCIST consisted of 23 educational institutions when it began in 2000. Currently, over 50 universities are members of UCIST. Each has purchased a bench-top shake table manufactured by the Quanser Company [10] of Markham, Ontario, Canada, in many cases with assistance provided by the NSF CCLI program. The UCIST institutions have developed educational experiments that use the shake table to illustrate structural dynamics and earthquake engineering to undergraduate and graduate students (Dyke et al. [6], MAE [8], and UCIST [13]). The low-cost accelerometers described in this paper were developed to:
• serve the demand for accelerometers associated with the growing number of educational shake table experiments.
• encourage creative exploration and experimentation in the laboratory, enabling larger numbers of accelerometers to be used to study response throughout a range of performance levels that includes collapse. This is not economically feasible using conventional laboratory grade accelerometers, which are an order of magnitude more costly.
1 Ph.D. Candidate, University of Illinois, Urbana, USA. Email: [email protected] 2 Associate Professor, Santa Clara University, California, USA. Email: [email protected]

• further develop students’ understanding of instrumentation; in particular, to clarify the principles by which chip-based accelerometers work.
Carlson [4] and Newton [9] presented guidelines for the electronics of a low-cost accelerometer (LCA) for the amateur seismologist for the purpose of detecting and measuring earthquake ground motions. To build their seismographs, Carlson [4] used a silicon chip from Analog Devices, while Newton [9] used a vibration transducer manufactured by Geophone for use by the oil industry. Zhang et al. [15] used a silicon chip from Analog Devices together with a micro-controller (equipped with a processor, flash memory and LCD display driver) to create a multi-functional but more costly accelerometer. This paper describes an LCA built for the purpose of measuring accelerations in structural dynamics experiments. A silicon chip from Analog Devices is the basis of the accelerometer, shown in Figure 1 next to a quarter and a portion of a ruler. The paper describes basic operational principles of the accelerometer circuit, and provides information on the design and fabrication of the printed circuit board (PCB). A simple technique to calibrate the accelerometer is discussed. Response data collected from forced vibration tests on the bench-top shake table is presented to assess the performance of the accelerometer with respect to commercially available accelerometers provided by Quanser and Endevco for use in rigorous experimental research programs.
Figure 1. Low-cost accelerometer.
ACCELEROMETER APPLICATION CIRCUIT
The Chip The main component of the LCA circuit is the ADXL105AQC silicon chip manufactured by Analog Devices. This chip can measure accelerations up to ±5g along a single axis (g is the acceleration of gravity). Analog Devices [3] has other chips that provide a higher acceleration range on multiple axes; however, the ADXL105AQC has lower noise (225 µg/√Hz) and wider bandwidth (10 kHz), rivaling the performance of more expensive chips (Doscher [5]). Consequently, the ADXL105AQC was chosen for its yellow cost and high performance capabilities. Three sub-circuits exist on the single monolithic integrated circuit (IC) of the chip. These are: 1. A one-axis acceleration sensor, to measure static or dynamic acceleration. The acceleration sensor (within the chip) is a 2-µm-thick polysilicon beam suspended by polysilicon springs over a silicon wafer. A 1-g acceleration causes the beam to deflect 1 nanometer between two fixed plates of a differential capacitor. The deflection of the polysilicon structure changes the differential capacitance, resulting in an output signal that is proportional to acceleration. ADXL105 Datasheet [1] and Doscher [5] provide a more detailed explanation of the operation of the acceleration sensor. Walter [14] explains the mechanical and

electrical properties of silicon, and its incorporation as an ideal material into micro-electromechanical sensor (MEMS) technology. 2. A temperature sensor, to allow for compensation of the output, which may be offset due to ambient temperatures, to enable very sensitive measurements. This sensor was not used because the LCA is intended to be used indoors in a controlled environment, where offset due to temperature is very small and may be neglected in most cases. 3. A general-purpose operational amplifier, used to amplify or attenuate the output signal of the acceleration sensor in order to adjust the measurement range of the accelerometer. The amplifier can also be set up as a filter to attenuate the signal in undesired frequency bands. Figure 2 shows the physical dimensions of the IC package (the chip) in inches and mm (in parentheses). The chip is a surface mount type (SMT) with 14 terminals (pins) spaced 0.05 inches apart. The pins are numbered from 1 to 7 on one edge of the chip and from 8 to 14 on the other edge, as shown in Figure 2.
Figure 2. Outline dimensions for ADXL105AQC (courtesy of Analog Devices).
The Circuit A typical application circuit for ADXL105AQC is shown in Figure 3. The large rectangle is the chip that contains the three sub-circuits. On the edges of the rectangle are the circled pins that are not numbered in the same order as in Figure 2, for the purposes of this illustration. Only nine of the 14 pins are being used.
Figure 3. Typical application circuit for ADXL105AQC (courtesy of Analog Devices).
In Figure 3, pins 13 and 14 are connected together to (+) of a power supply, preferably a high accuracy and ripple-free supply operating at a voltage range between 2.7V and 5.25V DC. A power supply with 2

W output capability is sufficient. For this project, a 5V DC, 2.5A power adapter was used. Alternatively, a personal computer power supply may be used, as these already output 5V DC at sufficient amperage. The adapter was located away from the circuit. A 0.22 µF capacitor is placed on the circuit board itself, connected in parallel with the power supply in order to reduce electromagnetic interference (EMI) from the supply. The free end of the capacitor is grounded. Regardless of the power source, Pins 4 and 7 are connected together and grounded. Pins 9 and 10 are also connected directly together, but are not grounded. Wire connections to the circuit are described in accelerometer fabrication later in the paper. For a 5V DC supply, the acceleration sensor (X Sensor in Figure 3) provides a 5V/2 = 2.5V continuous output signal at pin 8 for an acceleration of 0g. This occurs when the IC is mounted horizontally and is motionless, and thus measures 0g. Pin 8 is pre-configured by the manufacturer to a nominal scale factor of 250 mV/g (for a 5V-power supply). The resistors R1 and R2 are connected in series between pins 8, 11 and 12 as shown in Figure 3. The values of R1 and R2 can be selected for the desired gain, to relate the desired range of output signal to the range of accelerations to be recorded, as shown in Table 1. For this project, both resistors were selected as 50 kΩ to achieve a gain of 1, allowing accelerations to ±5g to be measured over an output range of (2.5V) + (5g)(0.25V/g) = 3.75V to (2.5V) - (5g)(0.25V/g) = 1.25V. The maximum output range of the accelerometer is 0 to 5 V DC. The resistors do not need to have high precision; the ones used here are inexpensive carbon-composition resistors, the most common type available.
Table 1. Increasing scale factors using R1 and R2. Acceleration Range (± g) Gain Scale (mV/g) R1 (kΩ) R2 (kΩ) Output Range (V) if no offset
5 1 250 50 50 1.25 to 3.75 4 2 500 50 100 0.50 to 4.50 3 3 750 50 150 0.25 to 4.75 2 4 1000 50 200 0.50 to 4.50
The scale factors in Table 1 can also be calculated from Equation 1.
1
2)250()/(
R
RgmVScale = (1)
The ADXL105 Datasheet [1] indicates that the output signal of 2.5V at 0g may inadvertently contain an offset error of up to ±625 mV for an output gain of 1. Caution should be exercised when selecting a higher gain (to obtain better sensitivity at smaller acceleration ranges) because the offset error is multiplied by the gain. Using a gain of greater than 4 could result in the offset error generating an output of as low as 0V or as much as 5V at 0g. To compensate for this error, a third resistor and a 10 kΩ variable resistor (potentiometer) can be added between pin 11 and the power supply, as suggested in the ADXL105 Datasheet [1]. Because the amplifier in this application had a gain of 1, the offset error (if any) was not further amplified. Therefore, it was not necessary to correct the offset error electronically, as the output range including the offset error was within the range of 0 to 5 V that could be read on the data acquisition board (supplied by Quanser with the bench-top shake table) that was used to acquire the acceleration data. Thus, during calibration at 0g, if the output was 2.75V, the offset error of 0.25V would be subtracted from all the readings during the post-processing of the data before converting the recorded data to acceleration values. Since the temperature sensor is not in use, an additional offset error due to temperature can be present in the output signal. The operating temperature that minimizes this error is +25ºC (77ºF, or room temperature) but as the temperature approaches the operating limits of -40ºC and +85ºC, offset errors of up to ±50 mV can be expected. The chip should not be used below -40ºC or above +85ºC.

Filtering While resistors R1 and R2 are used for adjusting the gain, capacitors may be introduced to electronically filter the output signal, in order to attenuate undesired frequency bands, allowing the accelerometer to be configured to measure vibrations at the frequencies of interest. In theory, there are four types of filters: 1. Low-pass filter: passes all frequencies below the cut-off frequency; inhibits all frequencies above the cut-off. 2. High-pass filter: passes all frequencies above the cut-off frequency; inhibits all frequencies below the cut-off. 3. Band-pass filter: passes all frequencies between the low-frequency cut-off and high-frequency cut-off; inhibits all other frequencies. 4. Notch-reject filter: inhibits all frequencies between the low-frequency cut-off and high-frequency cut-off; passes all other frequencies. Figure 4 shows the typical application circuit of Figure 3 with two additional components to introduce a band-pass filter (if low-pass cut-off is greater than high-pass cut-off) or a notch-reject filter (if high-pass cut-off is greater than low-pass cut-off). The additional components are capacitors C1 and C2. Capacitor C1 is connected in series with R1, and C2 is connected in parallel with R2. These are shown in dashed rectangles in Figure 4. If C1 is removed from the circuit, a low-pass filter results; if instead C2 is removed, a high-pass filter results. The capacitors do not need to have high precision; the ones used here are commonly available low-voltage ceramic capacitors.
+
-
+5 V
VDD VDD0.22 µF
ST
COM
TOUT
VMID
UCAOUT
VNIN VIN
AOUT
COM
TEMP.SENSOR
X SENSOR
ANALOGOUTPUT
ADXL 105
C1 R1
R2
C2
High-PassFilter
Low-PassFilter
Figure 4. Application circuit with filtering. The cut-off frequency for the low-pass filter, flow-pass is a function of R2 and C2, and is given by Equation 2, where R2 and C2 have the units of Ohm (Ω) and Farad (F), respectively.
)2)(2(2
1)(
CRHzf passlow π
=− (2)
The cut-off frequency for the high-pass filter, fhigh-pass is a function of R1 and C1, and is given by Equation 3, where R1 and C1 have the units of Ohm (Ω) and Farad (F), respectively.
)1)(1(2
1)(
CRHzf passhigh π
=− (3)

Because R1 and R2 have already been established to obtain the desired gain, C1 and C2 can be determined from Equations 2 and 3 to obtain the desired cut-off frequencies. It is important to note that when high-pass or band-pass filters are used, 0 Hz frequency is filtered out and therefore, static accelerations (i.e. when the accelerometer is at rest) cannot be measured. In this project, a low-pass filter was used and thus, capacitor C1 was not required, thereby allowing the accelerometer to be calibrated statically using the acceleration of gravity, as described later in the paper. The accelerometer was designed to filter out all frequencies above 100 Hz; from Equation 2, C2 = 0.032 µF given that R2 = 50 kΩ. An ideal filter has very sharp filtering characteristics. For example, the gain of an ideal low-pass filter with a cut-off of 100 Hz ideally would be 1 for f < 100 Hz, and 0 for higher frequencies. Actual filters only approximate this ideal behavior. The filter described above is a 1-pole filter, and has the gain described by Figure 4. Higher order filters (such as 2-pole and 3-pole filters) more closely approximate an ideal filter but require more components. The ADXL105 Datasheet [1] provides information on incorporating a 2-pole Bessel filter into the application circuit. The actual gain of a 1-pole band-pass filter circuit as a function of angular frequency (ω) is given by Equation 4, where ω(rad/s) = 2πf and the resistances (R1 and R2) and capacitances (C1 and C2) have the units of Ohm (Ω) and Farad (F), respectively.
( ) 2222222222 )2()1()2()1()2()2()1()1(1
)1)(2(
CCRRCRCR
CRGain
ωω +++= (4)
For a band-pass filter with fhigh-pass = 0.1 Hz, flow-pass = 100 Hz, and R1 = R2 = 50 kΩ (Gain = 1), the frequency response (calculated from Equation 4) is plotted in Figure 5, using a logarithmic scale for the frequency axis. In this figure, the normal gain in the band-pass region is approximately 1, and it drops to 0.707 at the two cut-off frequencies of 0.1 Hz and 100 Hz. For the low-pass filter that was used in this project, the values of C1 in the numerator and denominator of Equation 4 were set equal to one to achieve a gain of 1 for frequencies down to 0 Hz.
0
0 .1
0 .2
0 .3
0 .4
0 .5
0 .6
0 .7
0 .8
0 .9
1
1 .1
0 .0 1 0 .1 1 1 0 10 0 10 00F re qu en cy , f (H z )
Gai
n
Figure 5. Frequency response for the band-pass filter.
ACCELEROMETER FABRICATION
The components for the accelerometer circuit were purchased from the Electronics Services Shop [7] at the University of Illinois. Table 2 provides a complete list of the required components used in the
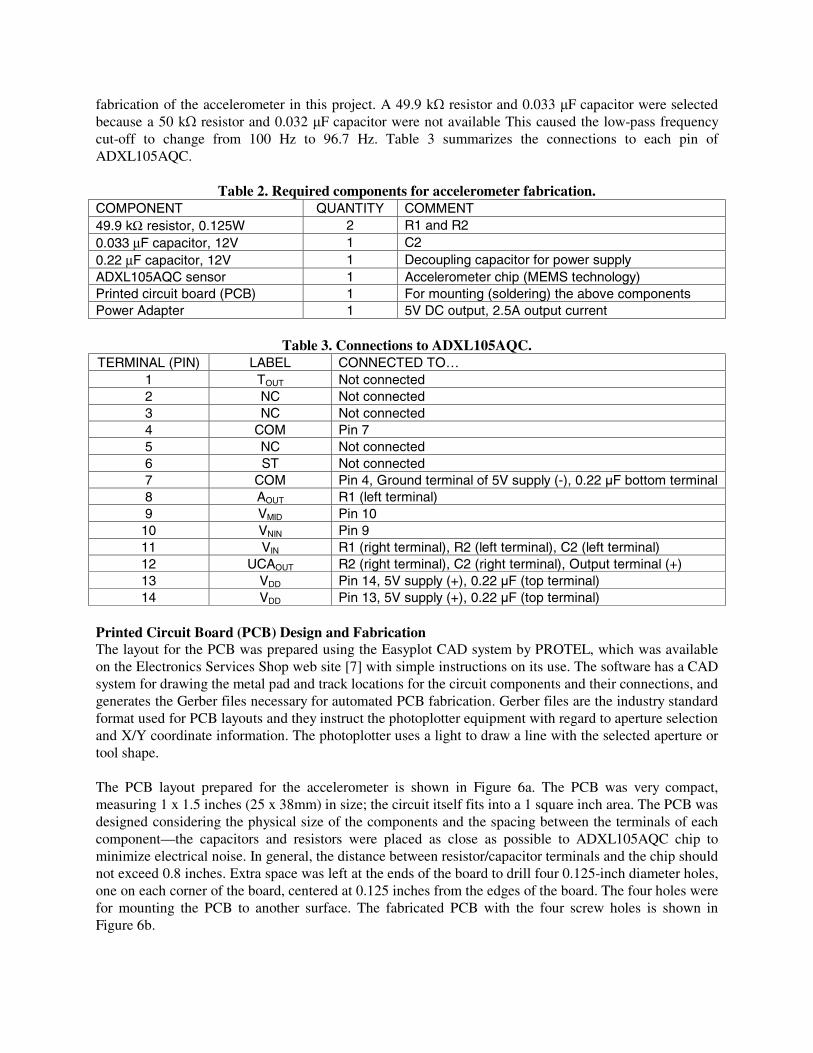
fabrication of the accelerometer in this project. A 49.9 kΩ resistor and 0.033 µF capacitor were selected because a 50 kΩ resistor and 0.032 µF capacitor were not available This caused the low-pass frequency cut-off to change from 100 Hz to 96.7 Hz. Table 3 summarizes the connections to each pin of ADXL105AQC.
Table 2. Required components for accelerometer fabrication. COMPONENT QUANTITY COMMENT 49.9 kΩ resistor, 0.125W 2 R1 and R2 0.033 µF capacitor, 12V 1 C2 0.22 µF capacitor, 12V 1 Decoupling capacitor for power supply ADXL105AQC sensor 1 Accelerometer chip (MEMS technology) Printed circuit board (PCB) 1 For mounting (soldering) the above components Power Adapter 1 5V DC output, 2.5A output current
Table 3. Connections to ADXL105AQC. TERMINAL (PIN) LABEL CONNECTED TO…
1 TOUT Not connected 2 NC Not connected 3 NC Not connected 4 COM Pin 7 5 NC Not connected 6 ST Not connected 7 COM Pin 4, Ground terminal of 5V supply (-), 0.22 µF bottom terminal 8 AOUT R1 (left terminal) 9 VMID Pin 10
10 VNIN Pin 9 11 VIN R1 (right terminal), R2 (left terminal), C2 (left terminal) 12 UCAOUT R2 (right terminal), C2 (right terminal), Output terminal (+) 13 VDD Pin 14, 5V supply (+), 0.22 µF (top terminal) 14 VDD Pin 13, 5V supply (+), 0.22 µF (top terminal)
Printed Circuit Board (PCB) Design and Fabrication The layout for the PCB was prepared using the Easyplot CAD system by PROTEL, which was available on the Electronics Services Shop web site [7] with simple instructions on its use. The software has a CAD system for drawing the metal pad and track locations for the circuit components and their connections, and generates the Gerber files necessary for automated PCB fabrication. Gerber files are the industry standard format used for PCB layouts and they instruct the photoplotter equipment with regard to aperture selection and X/Y coordinate information. The photoplotter uses a light to draw a line with the selected aperture or tool shape. The PCB layout prepared for the accelerometer is shown in Figure 6a. The PCB was very compact, measuring 1 x 1.5 inches (25 x 38mm) in size; the circuit itself fits into a 1 square inch area. The PCB was designed considering the physical size of the components and the spacing between the terminals of each component—the capacitors and resistors were placed as close as possible to ADXL105AQC chip to minimize electrical noise. In general, the distance between resistor/capacitor terminals and the chip should not exceed 0.8 inches. Extra space was left at the ends of the board to drill four 0.125-inch diameter holes, one on each corner of the board, centered at 0.125 inches from the edges of the board. The four holes were for mounting the PCB to another surface. The fabricated PCB with the four screw holes is shown in Figure 6b.

1 7
814
Ground (-)
Power (+)Output (+)
Figure 6a. Accelerometer PCB layout. Figure 6b. Fabricated PCB.
The PCB was fabricated by AP Circuits [2] on a laminate of type FR4 having a thickness of 0.062 inches. FR4 is an electrical insulation material made out of glass-reinforced epoxy, which possesses good mechanical strength and is easily machined and die cut. Only the top layer of the PCB was coated with the grid of metal pads. The SMT chip and the remaining components can be soldered on to the metal pads without the need for drilled holes. However, for this project, eleven 0.060-inch diameter (one of the free drill sizes provided by AP Circuits) through-holes were drilled. Eight of the eleven holes were for the terminals of the four components; three holes were for ground, power, and output signal terminals (Figure 6b). Metal coating was provided around the holes at the bottom layer to enable the soldering of the component terminals to achieve a secure mechanical attachment of the components to the board. The fabrication order to AP Circuits [2] was sent by an e-mail that included the top layer Gerber file along with the drill and drill tool size files. 150 PCBs were fabricated for a cost of less than US$ 2 per board including shipping. These are available to the UCIST institutions by request. Soldering and Wire Connections The IC, resistors, and capacitors were soldered to the PCB (Figure 6b). Extra care is required when soldering the closely spaced terminals of the IC to prevent short-circuiting or melting the metal pads for the terminals. Also, the IC should not be touched unless one is properly grounded to reduce the risk of damage to the IC from electrostatic discharge. Proper soldering of the components is important because the entire circuit is eventually subjected to vibrations during measurements; only soldering can ensure that the IC does not vibrate independently of the object to which the LCA is securely mounted. Shuster et al. [11] provides good tips for an effective mounting of the IC. In addition to soldering the components to the PCB, the (+) wire from the power adapter also must be soldered to the power (+) terminal on the PCB, and the (-) wire must be soldered to the ground (-) terminal. The output (+) terminal was connected to (+) of the display/data acquisition device, and ground (-) terminal was connected to (-) of the display/data acquisition device. In this case, the output display/data acquisition device was a data acquisition board on a PC running LabView software provided by Quanser; alternatively a voltmeter or an oscilloscope may be used.
ACCELEROMETER PERFORMANCE Tests were performed to compare the response of the LCA described in the previous section with accelerometers provided by Quanser (as part of the bench-top shake table purchase) and laboratory grade

accelerometers produced by Endevco. As previously stated, the LCA tested was designed to have a low pass filter cut-off frequency of 100 Hz. Calibration and Sensitivity of the LCA Because the initial value of the accelerometer output at 0g might be slightly offset from 2.5 V due to offset and because deviations in the actual power supply from +5V, the scale factor may differ slightly from 0.250 mV/g, a calibration of the LCA is required to determine the exact relationship between the output voltage and the measured acceleration. The calibration factors (gain and offset) can then be applied in the post-processing of the data after it has been acquired with the data acquisition board and software (e.g. National Instruments LabView). The accelerometer was calibrated by a common technique informally known as “Turnover Calibration,” described in Simsir and Banas [12]. This technique uses the force of gravity to provide a stable, accurate and convenient acceleration relative to the orientation of the accelerometer. By orienting the LCA parallel to the Earth’s surface, and at +90° and -90° to the Earth's surface, readings at 0g, -1g, and +1g are acquired, respectively. Total offset is the reading at 0g less 2.5V; the scale factor is the difference between 1g and 0g readings. A more accurate scale factor can be obtained by using the measurements at 1g and -1g. In this case, the scale factor of the LCA was calculated as 0.255 V/g from Equation 5:
2/)]1(1[)/( readinggreadingggVFactorScale −−= (5) Forced Vibration Tests Screws were used to temporarily align and attach the LCA PCB to a thin aluminum mounting plate while an epoxy bonding agent set. Epoxy is electrically conductive and should not be spread over the conductors of the PCB but may be adhered to the non-conductive side of the PCB. The thin aluminum plate was then bolted to the surface of the bench-top shake table. The axis of the acceleration sensor (X-sensor in Figure 3) in the LCA was oriented parallel to the direction of motion. The bench-top shake table acquired by the UCIST institutions is shown in Figure 7. The table has dimensions of 18 x 18 inches and a payload capacity of 33 lbs (15 kg). It slides on linear ball bearings along two steel shafts, providing single axis motion. As illustrated in Figure 8, the table has limitations of ±3 inches stroke, 33 in/s velocity, 2.5g acceleration, and 20 Hz operational bandwidth. More information on the specifications and operation of the shake table are available from Quanser [10] and UCIST [13].
18”x18” table
1 Hp brushlessservo motor
Shaft
Linear ballbearing
Figure 7. The bench-top shake table.

0
0.5
1
1.5
2
2.5
3
0 2 4 6 8 10 12 14 16 18 20Frequency (Hz)
Acc
eler
atio
n (g
) or
Dis
plac
emen
t (in
)
Acceleration limit (g)
Displacement limt (in)
velocity limitof 33 in/s
acceleration limitof 2.5g
disp limitof 3 in
Figure 8. Table performance limitations.
A total of 10 forced vibration tests were carried out to determine and compare the performance of the LCA to that of accelerometers provided by Quanser and Endevco (model 2262C-25). The latter two accelerometers were also bolted to the table surface, aligned parallel to the direction of shaking. The 5-second long tests consisted of both low and high amplitude sinusoidal displacement input at five different frequency levels, as listed in Table 4. A sampling frequency of 1000 Hz was used to record the accelerations from all three accelerometers. The accelerometers had different power supplies: the aforementioned 5V DC power adapter for LCA, Quanser's universal power module for the Quanser accelerometer, and Measurements Group 2100 System for the Endevco accelerometer. The analog output of all three accelerometers was converted to a digital signal using the same analog-to-digital board, which is the board provided by Quanser together with the bench-top shake table.
Table 4. Forced vibration test program. 0.5 Hz 1 Hz 5 Hz 10 Hz 20 Hz
Low amplitude
Test #1 1 in
Test #3 0.5 in
Test #5 0.02 in
Test #7 0.01 in
Test #9 0.005 in
Sinusoidal displacement
amplitude High
amplitude Test #2
2 in Test #4
2 in Test #6 0.2 in
Test #8 0.05 in
Test #10 0.03 in
Test Results An illustration of the acceleration response obtained from all three accelerometers is provided in Figure 9, for a 0.5-second interval during Test #6. While the Quanser accelerometer output was relatively smooth, the LCA and Endevco accelerometers produced more jagged curves. The LCA and Endevco accelerometers measured larger peak acceleration amplitudes since these measurements contained higher frequency components than were recorded by the Quanser accelerometer. The same trends were observed in all ten tests.

-1
-0.8
-0.6
-0.4
-0.2
0
0.2
0.4
0.6
0.8
1
0 0.05 0.1 0.15 0.2 0.25 0.3 0.35 0.4 0.45 0.5
Time (s)
Acc
eler
atio
n (g
)
Endevco
LCA
Quanser
Endevco
Quanser
LCA
Figure 9. Acceleration response (Test #6: 5Hz at 0.2 inches).
A Fast Fourier Transform (FFT) of the recorded accelerations was used to determine the frequency content of the acceleration responses recorded for all three accelerometers, for all ten tests. Results are shown in Figures 10a and 10b for a frequency bandwidth of 0 to 100 Hz, with the power spectral density (PSD - amplitude of the frequency content) plotted on a logarithmic scale. The scale is the same for all plots in Figures 10a and 10b. For all tests the LCA and Endevco accelerometer responses were the most closely correlated of the three accelerometers, especially for frequencies above 20 Hz. For any given test (forcing) frequency, the correlation between the LCA and Endevco accelerometer responses was observed to be lower for the larger amplitude test relative to the smaller amplitude test.
Figure 10a. Accelerometer response frequency content (Tests 1-2).

Figure 10b. Accelerometer response frequency content (Tests 3-10).

At the excitation frequency, the ratio of the PSD for LCA to PSD for Endevco, and the ratio of the PSD for Quanser to PSD for Endevco are listed in Table 5, for all tests. These ratios can be considered to be the PSD for LCA and Quanser accelerometer for the PSD of the Endevco accelerometer normalized to a value of 1 at the applied forcing frequency. Figure 11 shows the variation of these ratios with respect to the forcing frequency. While the PSD of the LCA at the forcing frequency exceeds that of Endevco by about 10% in all tests, the PSD of Quanser accelerometer decreases considerably with respect to that of the Endevco accelerometer with increasing forcing frequency (Figure 11).
Table 5. Comparison of PSD Ratios. Forcing
Frequency (Hz)
Low Amplitude
Test Number
PSDLCA / PSDEndevco
PSDQuanser / PSDEndevco
High Amplitude
Test Number
PSDLCA / PSDEndevco
PSDQuanser / PSDEndevco
0.5 1 1.116 1.052 2 1.069 0.998 1 3 1.087 0.996 4 1.094 1.008 5 5 1.164 0.928 6 1.140 0.956 10 7 1.090 0.636 8 1.097 0.620 20 9 1.076 0.188 10 1.082 0.178
0
0.2
0.4
0.6
0.8
1
1.2
1.4
0 5 10 15 20Applied Forcing Frequency (Hz)
PS
D R
atio
(w
hen
PS
DE
ndev
co=
1)
LCA, Low AmplitudeQuanser, Low AmplitudeLCA, High AmplitudeQuanser, High Amplitude
Endevco
Quanser
LCA
Figure 11. Comparison of PSD ratios.

CONCLUSIONS Results of a project to develop low-cost accelerometers for use by students are described. Information required to design and fabricate low-cost accelerometers was presented. Conclusions drawn from the project include: 1. It is feasible for students to design and construct accelerometers using parts that cost about US $45. This is about an order of magnitude less than the cost of a commercial laboratory grade accelerometer. 2. The desired gain and filtering frequencies for the accelerometer can be obtained by selecting circuit components, allowing accelerometers to be custom-tailored to the specific needs of an experiment. 3. The low-cost accelerometer was shown to have good response characteristics over a large range of frequencies, approaching that of a laboratory grade accelerometer and exceeding that of the accelerometers provided by Quanser with the bench-top shake tables. 4. The low-cost accelerometers can be useful in a variety of educational experiments including those undertaken as part of UCIST. The availability of a large number of inexpensive accelerometers allows students to explore dynamic response over a large range of performance, including collapse, in a laboratory setting without being concerned about the potential damage to and loss of expensive laboratory equipment. 5. The design and fabrication of the low-cost accelerometer provides students with an understanding of instrumentation and sensor technology; in particular, illuminating the principles by which chip-based accelerometers work.
ACKNOWLEDGMENTS The support of the National Science Foundation via the CCLI program and a CAREER award (CMS-9984830) to the second author is gratefully acknowledged. This work was supported in part by the Earthquake Engineering Research Centers Program of the National Science Foundation under Award Number EEC-9701785. The findings and conclusions do not necessarily represent the views of the sponsor. The authors would like to acknowledge the helpful information provided by Balkan Simsir on the principles of accelerometer circuit electronics. The findings and conclusions do not necessarily represent the views of the individuals and sponsors identified above.
REFERENCES 1. "ADXL105 Datasheet, High Accuracy 1 g to 5 g Single Axis iMEMS Accelerometer with Analog
Input, Rev. A". Analog Devices, Inc., 1999. 2. Alberta Printed Circuits Ltd. web site: http://www.apcircuits.com/ 3. Analog Devices Inc. web site: http://www.analog.com 4. Carlson S. "The Amateur Scientist, The New Backyard Seismology". Scientific American, April
1996: 100-102. 5. Doscher J. "ADXL105: A Lower-Noise, Wider-Bandwidth Accelerometer Rivals Performance of
More Expensive Sensors". Analog Dialogue, June 1999; 33(6). 6. Dyke SJ, Johnson SM, Ranf RT, Caicedo JM, Soto-Fournier M. "Advancing Earthquake
Engineering Education through A Cooperative Effort Based on Instructional Shake Tables".

Proceedings of the 7th US National Conference on Earthquake Engineering, EERI, Boston, MA, July 2002.
7. Electronics Services Shop at the University of Illinois at Urbana-Champaign web site: http://www.ece.uiuc.edu/eshop/pcbdesign/
8. MAE, Mid-America Earthquake Center web site: http://mae.ce.uiuc.edu/ 9. Newton R. "Listen to the Earth with this Seismic Detector". Electronics Now, November 1999: 33-
38. 10. Quanser company web site: http://www.quanser.com 11. Shuster M, Briano B, Kitchin C. "Mounting Considerations for ADXL Series Accelerometers, AN-
379 Application Note". Analog Devices, May 1995. 12. Simsir C, Banas G. "Accelerometers: Theory, Instrumentation and Installation". Civil Engineering
Manuals, University of Illinois, Urbana, March 2003. 13. UCIST, University Consortium of Instructional Shake Tables web site:
http://ucist.cive.wustl.edu/main.htm 14. Walter PL. "Dynamic Force, Pressure, & Acceleration Measurement, Part 2 - The Application of
Silicon and Piezoelectric Transduction Technologies, Professional Course". Measurements & Control Journal, June 1999: 76-82.
15. Zhang J, Zhang Y, Ni H. "Multi-functional Accelerometer". Nuts & Volts, February 2003; 24(2): 34-38.