Embed Size (px)
Citation preview
Do you have the power to transform?
Low Carbon, High Stakes

Contents
Forewords 4
Executive Summary 6
2°C: The Tipping Point for Utilities 8
Five Trends Make the Prevailing Utility Business Model Unsustainable 12
Value Shifts in a Low-Carbon World 18
Five Business Model Pathways Toward a Low-Carbon Energy System 22
Making the Move: Key Actions to Drive Transformation 36
Appendix: Assessing the Value of Low-Carbon Business Model Pathways 40
References 42

4
ForewordsFew challenges are so critical as accelerating the transformation of the energy infrastructure of the world to fuel the needs of a smarter, efficient, renewably powered economy. The upcoming COP21 conference represents a unique opportunity for the international community to accelerate the transition to a low-carbon economy producing an ambitious and concrete commitment to combat climate change and its impacts. As a global energy company, Enel feels called to break ranks with business as usual and lead the energy revolution. Around 47% of the energy currently generated by the Group already comes from CO2 free sources and we are committed to reach carbon neutrality by
2050, consistent with the level of de-carbonization required to limit global warming to 2°C as a Science Based Target. Our business plan foresees €8.8bn of investment in renewables growth by 2019, a 50% increase compared to the previous plan, which means over 7 GW of new clean power capacity.
We put sustainability at the core of our strategy and will keep investing in the most advanced and innovative technologies, upgrading and digitalizing infrastructures and driving efficiency, to accelerate the process of de-carbonization over the next few years, convinced as we are that climate change is a reality requiring urgent action.
In the last decades, the world has undergone massive changes. Technology has allowed us to change the way we communicate, work, socialize and live. Utilities play an important part in this changing game, evolving from pure-play centralized power generators and distributors to energy solution providers.Steered by an inspiring vision: To be a global energy providing company, leader in creating value, innovation and sustainability, EDP has managed to stay ahead of the game and move into clean generation, clean mobility, efficiency services, access to energy, smart grids, pump and storage, just to name a few.
All these new businesses required anticipation and initiative. In some of them EDP acted as a technology developer, in others as project facilitator and in some others even as a visionary entrepreneur. In all of them EDP is harvesting greenfield opportunities and creating additional value in what previously looked like a zero-sum game. All these new businesses aim to solve consumer’s needs or concerns and
contribute towards a sustainable future.As a result of its strategy, EDP accepted its responsibility in shaping the future by: reducing CO2 specific emissions in 75% till 2030 (in comparison with 2005); surpassing 75% renewable generation installed capacity by 2020; reaching more than 1TWh cumulative savings through energy services in 2020; investing €200m till 2020 in research dedicated to clean energy, efficiency and smart grids and installing smart grids in more than 90% of its Iberian customers by 2030.
We believe that change to a more sustainable world is happening right now and we are proud to be inspirational leaders of that drive. The utility sector is a key player in this transformation. This is the time to foster collaborative partnerships built upon innovation, commitment, cooperation and audacity. This is the time to set an ambitious agenda to a more sustainable and resilient path of doing business. Only with a strong ambition we will be able to succeed in our common endeavor of transformation to a low-carbon economy.
Francesco Starace CEO and General ManagerEnel Group
António Mexia CEO EDP

5
The electricity system and the utilities that operate it play a large role in creating prosperity and providing the comfort that we have come to expect from electric power. However, the environmental and societal consequences of fossil-fuel based power generation can no longer be ignored. We are starting to see the first impacts of climate change affect our lives and livelihoods. Droughts and floods are disrupting our food supply, and increasingly frequent extreme weather events cause havoc to towns and cities.
Business leaders recognize the need for a change and governments have begun to act to foster a transition to a low-carbon economy. President Obama, for instance, announced additional incentives to support private sector investment in renewable energy. And China has unveiled its plans for a national emission-trading system to cut greenhouse gas emissions. We expect other business and political leaders to follow suit in the lead-up to the UNFCCC Conference of the Parties in Paris in December 2015, and rally around a critical goal: limiting the average global temperature rise to 2°C.
As part of this objective, CO2 emissions from energy supply will need to drop by 90 percent or more below 2010 levels between 2040 and 20701. For the electricity sector players, this means facing some very difficult choices today and in the years ahead. They must find a way to make the transition for their businesses from being traditionally carbon-intensive to lower-carbon ones—all while maintaining their ability to meet the world’s ever-increasing energy needs and sustaining profitable growth.
It is a tall order, to be sure. However, with these challenges also come significant new value and business opportunities—according to Accenture Strategy’s estimates, potentially worth €135 to €225 billion in saved and avoided costs and €110 to €155 billion in new revenue per year worldwide in 2030.
Capturing this value will require utilities to consider three emerging business model platforms. Leading utilities have already started to adopt these new business models to some extent demonstrating the viability of low-carbon alternatives that also drive change throughout the energy system.
In this report, we examine five potential business model pathways in the quest toward a low-carbon energy system. We analyze the environmental and economic value they can deliver, and explore the capabilities utilities need to adopt and sustain.
The research behind this report is based on interviews with executives at leading businesses in the electricity utilities sector that are part of the transition, as well as Accenture Strategy’s modelling and CDP data analysis. We hope our findings and conclusions will inspire and help electric utilities in the transition to the low-carbon energy system that will define our future.
Peter Lacy Managing DirectorAccenture Strategy, Sustainability Services
Paul Dickinson Executive Chairman, CDP
6
Executive Summary In the quest toward a low-carbon energy system, the electric utilities sector—with a 25 percent share of all carbon emissions globally2—plays a crucial role. How can utilities move away from fossil fuels in an economically sustainable way? Five low-carbon business model pathways could enable utilities to significantly reduce greenhouse gas emissions and capitalize on €135 to €225 billion in saved and avoided costs and €110 to €155 billion in new revenue for the electricity sector worldwide in 2030.
The global community continues to direct its collective strength to combat climate change. A major milestone in these efforts is expected in December 2015, when the annual UNFCCC Conference of Parties hopes to create a legally binding and universal agreement to limit the rise in average global temperature to 2°C—a significant drop from the prevailing trend of 3.6°C 3. It is an ambitious goal, but one that is necessary to significantly reduce the impacts on the planet of greenhouse gas emissions and increasing water scarcity.
With a 25 percent share of all carbon emissions globally, electric utilities must successfully embrace low-carbon solutions for the 2°C goal to be achieved. Yet because their business model is little changed from a century ago, utilities will also encounter major challenges in substantially reducing—and ultimately
eliminating—their reliance on fossil fuels. Utilities have been making progress to reduce greenhouse gas emissions and increase their share of renewable energy. But the reality is that merely continuing doing what is required by climate regulation will no longer be enough. They will need to substantially accelerate efforts to realize the long-term ambitions required in a 2°C world.
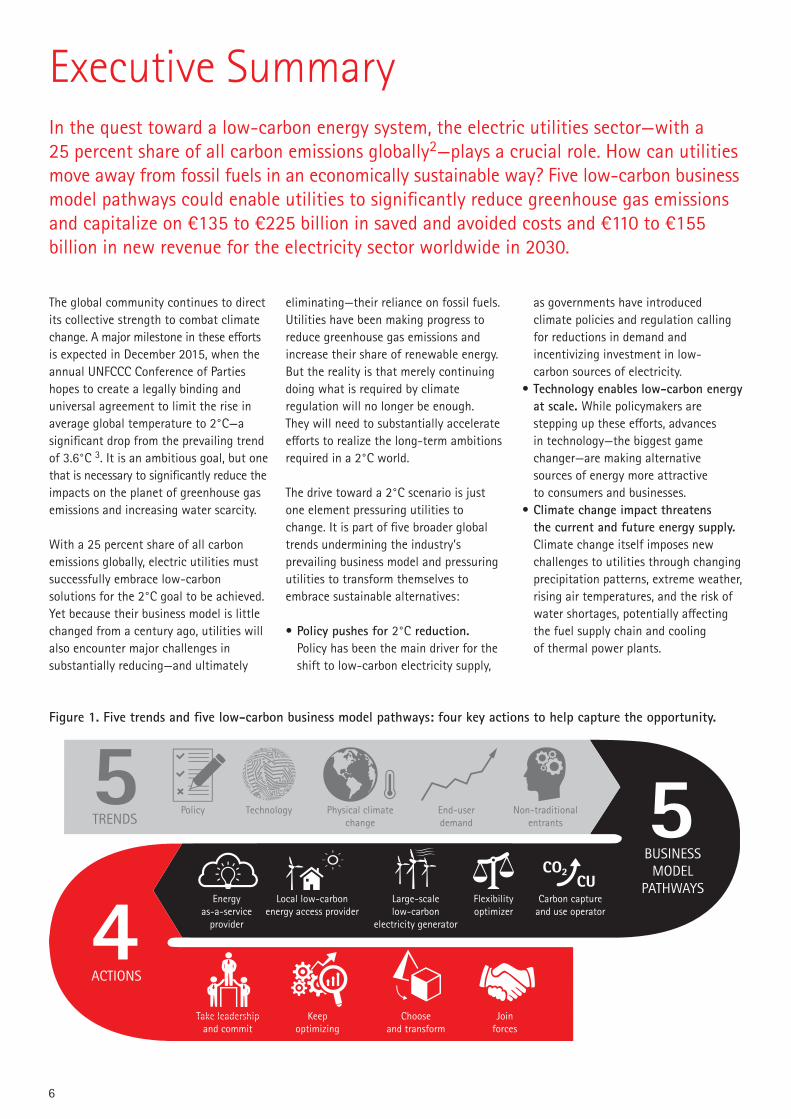
The drive toward a 2°C scenario is just one element pressuring utilities to change. It is part of five broader global trends undermining the industry’s prevailing business model and pressuring utilities to transform themselves to embrace sustainable alternatives:
• Policy pushes for 2°C reduction. Policy has been the main driver for the shift to low-carbon electricity supply,
as governments have introduced climate policies and regulation calling for reductions in demand and incentivizing investment in low- carbon sources of electricity.
• Technology enables low-carbon energy at scale. While policymakers are stepping up these efforts, advances in technology—the biggest game changer—are making alternative sources of energy more attractive to consumers and businesses.
• Climate change impact threatens the current and future energy supply. Climate change itself imposes new challenges to utilities through changing precipitation patterns, extreme weather, rising air temperatures, and the risk of water shortages, potentially affecting the fuel supply chain and cooling of thermal power plants.
Figure 1. Five trends and five low-carbon business model pathways: four key actions to help capture the opportunity.
Policy Technology Non-traditional entrants
End-user demand
Physical climate change 5
BUSINESSMODEL
PATHWAYS
4ACTIONS
Energy as-a-service
provider
Large-scale low-carbon
electricity generator
Local low-carbon energy access provider
Flexibility optimizer
Carbon capture and use operator
Take leadership and commit
Take leadership Choose and transform
Join forces
Keep optimizing
5TRENDS
CO2CU
7
• End users demand energy efficiency and low-carbon energy. Rising costs of electricity, climate change concerns and technology developments together are convincing and incentivizing end users to reduce their energy demand and shift to (and possibly produce their own) low-carbon energy.
• Non-traditional entrants challenge incumbents. Increased competition, particularly from new entrants from other industries as well as more innovative utilities, pose a growing and significant threat to traditional utilities’ business.
Together, these trends highlight the risks inherent to the established utility business model, based on selling electricity as a commodity, which is not equipped for a low-carbon transition. In fact, utilities will face rising costs and risks from increased complexity and cost of carbon, as well as pressure on revenues from selling electricity, in the next 15 years. According to our analysis, the costs of building and operating power generation facilities and networks could more than double between 2015 and 2030, if we continue business as usual. Increasing demand for electricity will be a major factor, while the impacts of climate change and carbon pricing will also add to rising operating costs.
Electricity prices would need to rise by almost one-third on average to make up for this increased investments and carbon costs—a solution that is neither politically
acceptable nor socially sustainable. So how can utilities facilitate the transition to a low-carbon energy system in an economically sustainable way?The good news is that while utilities’ traditional value pool is at risk, new ones could be created. Our analysis has found that the industry as a whole has a value opportunity of €135 to €225 billion in saved and avoided costs and €110 to €155 billion in new revenue per-year worldwide in 2030.
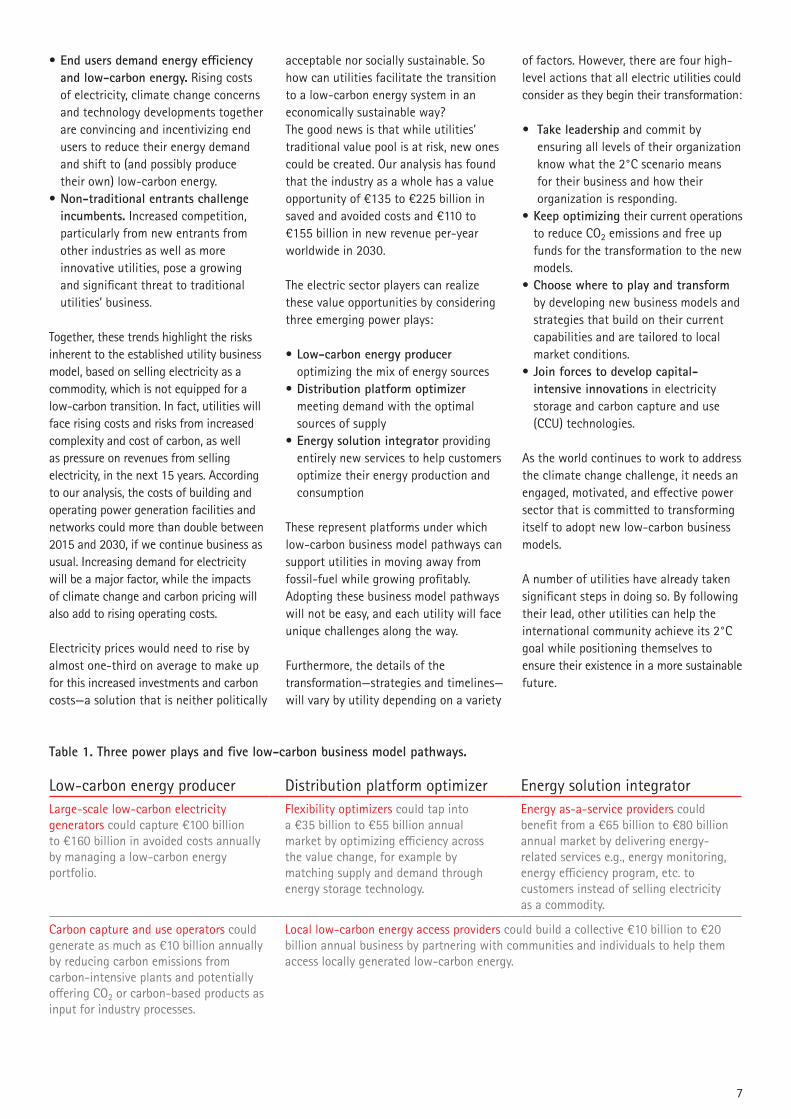
The electric sector players can realize these value opportunities by considering three emerging power plays:
• Low-carbon energy producer optimizing the mix of energy sources
• Distribution platform optimizer meeting demand with the optimal sources of supply
• Energy solution integrator providing entirely new services to help customers optimize their energy production and consumption
These represent platforms under which low-carbon business model pathways can support utilities in moving away from fossil-fuel while growing profitably. Adopting these business model pathways will not be easy, and each utility will face unique challenges along the way.
Furthermore, the details of the transformation—strategies and timelines—will vary by utility depending on a variety
of factors. However, there are four high-level actions that all electric utilities could consider as they begin their transformation:
• Take leadership and commit by ensuring all levels of their organization know what the 2°C scenario means for their business and how their organization is responding.
• Keep optimizing their current operations to reduce CO2 emissions and free up funds for the transformation to the new models.
• Choose where to play and transform by developing new business models and strategies that build on their current capabilities and are tailored to local market conditions.
• Join forces to develop capital-intensive innovations in electricity storage and carbon capture and use (CCU) technologies.
As the world continues to work to address the climate change challenge, it needs an engaged, motivated, and effective power sector that is committed to transforming itself to adopt new low-carbon business models.
A number of utilities have already taken significant steps in doing so. By following their lead, other utilities can help the international community achieve its 2°C goal while positioning themselves to ensure their existence in a more sustainable future.
Low-carbon energy producer Distribution platform optimizer Energy solution integratorLarge-scale low-carbon electricity generators could capture €100 billion to €160 billion in avoided costs annually by managing a low-carbon energy portfolio.
Flexibility optimizers could tap into a €35 billion to €55 billion annual market by optimizing efficiency across the value change, for example by matching supply and demand through energy storage technology.
Energy as-a-service providers could benefit from a €65 billion to €80 billion annual market by delivering energy-related services e.g., energy monitoring, energy efficiency program, etc. to customers instead of selling electricity as a commodity.
Carbon capture and use operators could generate as much as €10 billion annually by reducing carbon emissions from carbon-intensive plants and potentially offering CO2 or carbon-based products as input for industry processes.
Local low-carbon energy access providers could build a collective €10 billion to €20 billion annual business by partnering with communities and individuals to help them access locally generated low-carbon energy .
Table 1. Three power plays and five low-carbon business model pathways.

2°C: The Tipping Point for Utilities
8
9
The 2015 annual UNFCCC Conference of Parties conference in Paris (COP21) has once again put carbon reduction at the top of its agenda, and business and political leaders are expressing their commitment to the cause. If pledges made by all countries ahead of the Paris Conference are implemented, “there will be a material impact on the energy sector,” according to Fatih Birol, executive director of the International Energy Agency5.
The objective: limit the average global temperature rise to 2°C, well below the current trend of 3.6°C (see next page). As part of the 2°C scenario, CO2 emissions from electricity generation (i.e. 13Gt in 20126) are expected to drop by 90 percent or more below 2010 levels between 2040 and 20707.
Achieving these goals will be especially difficult given the growing need for electricity. With global demand set to rise by 2.1 percent per-year on average by 2040, primarily in emerging markets, power sector CO2 emissions would increase by 16 percent under “business as usual” conditions8. To reach a 2°C scenario, low-carbon electricity
generation in the emerging world is essential. Currently, the importance of economic growth makes many emerging countries focus on affordability and reliability of electricity, outweighing considerations about how to use energy more efficiently9. Public institutions, such as the World Bank and the European Investment Bank, could provide technological and organizational expertise, as well as financing, to help emerging economies develop low-carbon electricity systems without compromising their access to affordable and reliable supply. The World Bank has, for example, has financed 3.5 million solar home systems in Bangladesh’s rural communities, creating 70,000 installation jobs and benefitting 15 million people, thereby overcoming the political and financing constraints10.
Of course, utility companies are not sitting idly by. Many European utilities, for instance, have set targets for reducing GHG emissions and increasing their share of renewable energy in line with the EU Energy and Climate targets for 2020, and are roughly on track to meet them11. This is a good first step for reducing power sector emissions. However, GHG
emissions reductions must accelerate to achieve the 2°C scenario identified by the IEA12, which means utilities must set targets beyond the horizon of existing policy—much like what U.S. utility NRG and Enel Group have done in setting targets that extend to 205013 14.
Simply stated: While utility companies have made significant progress in reducing their environmental impact to date and are on track to achieve their goals for 2020, they will need to step up their game to compete in a 2°C scenario beyond that point in time.
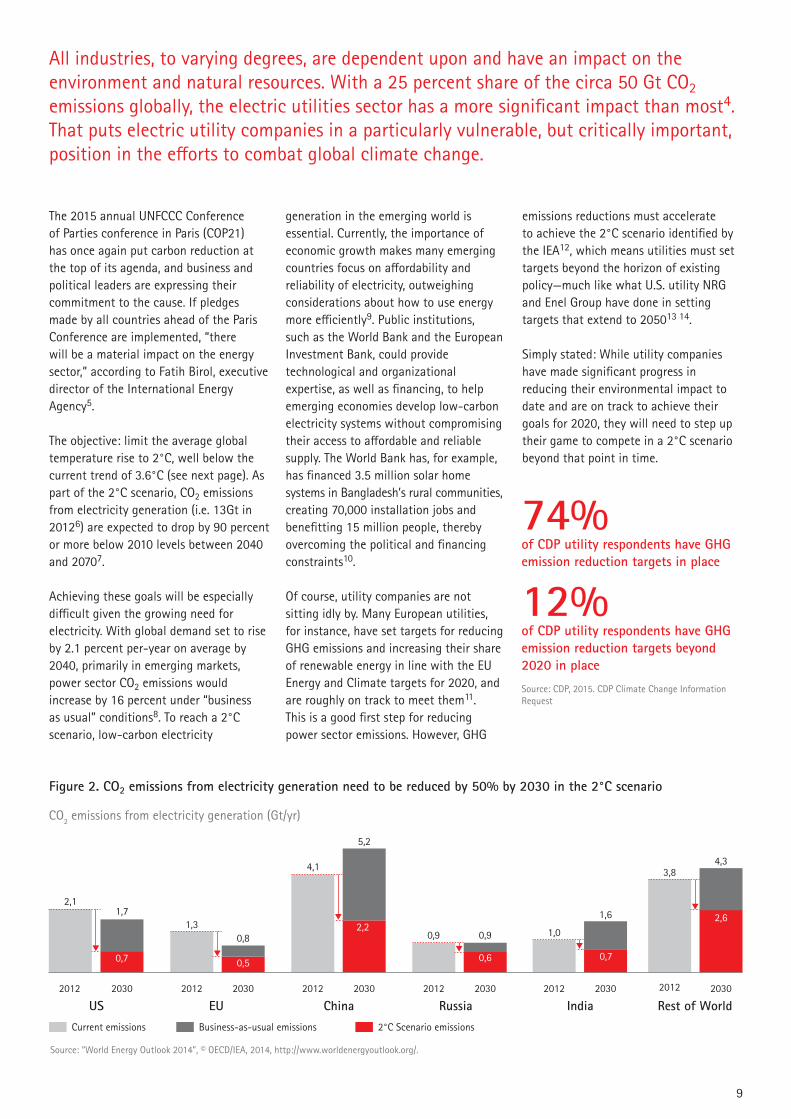
All industries, to varying degrees, are dependent upon and have an impact on the environment and natural resources. With a 25 percent share of the circa 50 Gt CO2 emissions globally, the electric utilities sector has a more significant impact than most4. That puts electric utility companies in a particularly vulnerable, but critically important, position in the efforts to combat global climate change.
Figure 2. CO2 emissions from electricity generation need to be reduced by 50% by 2030 in the 2°C scenario
20302012
4,3
2,6
3,8
Rest of WorldIndia
1,0
2030
1,6
2012
Russia 20302012
0,90,9
0,6 0,7
China2012
4,1
5,2
2030
2,2
EU
0,5
1,30,8
2012 2030
CO2 emissions from electricity generation (Gt/yr)
2030
1,7
2012
2,1
US
0,7
Current emissions Business-as-usual emissions 2°C Scenario emissions
Source: “World Energy Outlook 2014”, © OECD/IEA, 2014, http://www.worldenergyoutlook.org/.
74%
12%of CDP utility respondents have GHG emission reduction targets in place
of CDP utility respondents have GHG emission reduction targets beyond 2020 in place
Source: CDP, 2015. CDP Climate Change Information Request
1010
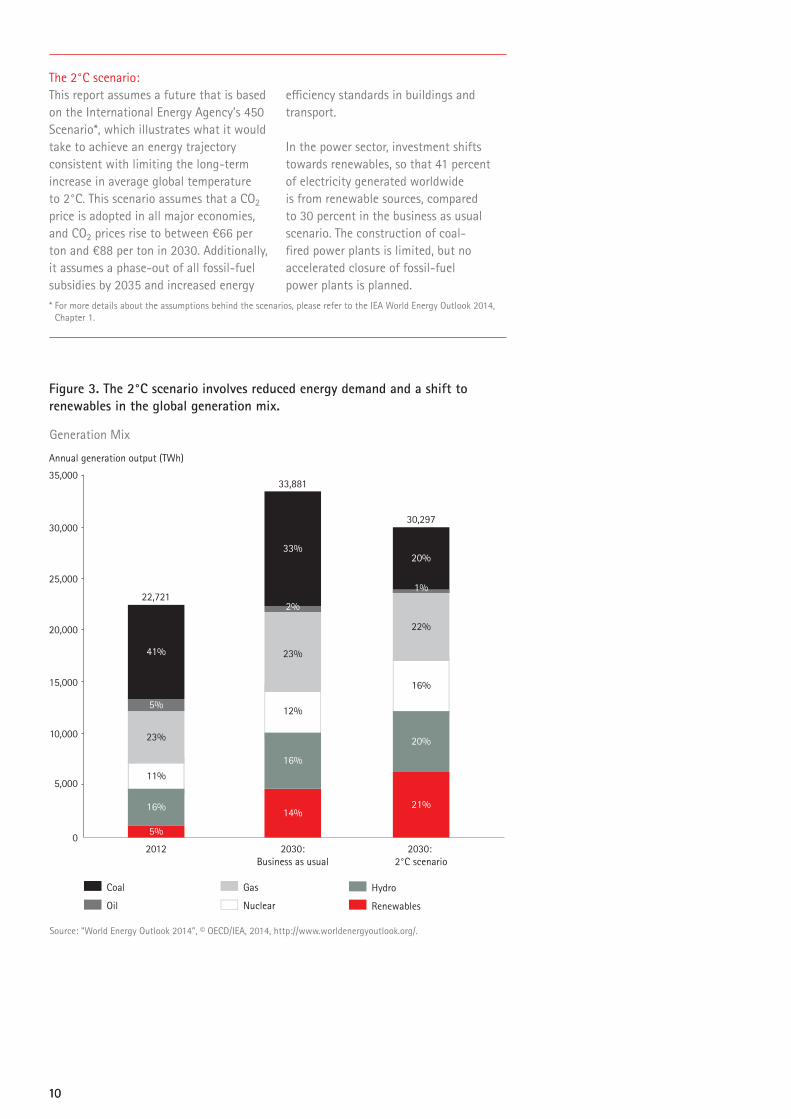
The 2°C scenario: This report assumes a future that is based on the International Energy Agency’s 450 Scenario*, which illustrates what it would take to achieve an energy trajectory consistent with limiting the long-term increase in average global temperature to 2°C. This scenario assumes that a CO2 price is adopted in all major economies, and CO2 prices rise to between €66 per ton and €88 per ton in 2030. Additionally, it assumes a phase-out of all fossil-fuel subsidies by 2035 and increased energy
efficiency standards in buildings and transport. In the power sector, investment shifts towards renewables, so that 41 percent of electricity generated worldwide is from renewable sources, compared to 30 percent in the business as usual scenario. The construction of coal- fired power plants is limited, but no accelerated closure of fossil-fuel power plants is planned.
Figure 3. The 2°C scenario involves reduced energy demand and a shift to renewables in the global generation mix.
* For more details about the assumptions behind the scenarios, please refer to the IEA World Energy Outlook 2014, Chapter 1.
2012 2030:Business as usual
2030: 2°C scenario
0
10,000
5,000
15,000
25,000
35,000
20,000
30,000
Coal Gas
Oil Nuclear
Hydro
Renewables
Source: “World Energy Outlook 2014”, © OECD/IEA, 2014, http://www.worldenergyoutlook.org/.
Generation Mix
Annual generation output (TWh)
41%
5%
23%
11%
16%
33%
2%
23%
12%
16%
20%
22%
16%
20%
1%
5%
14%21%
22,721
33,881
30,297

1111

12
Five Trends Make the Prevailing Utility Business Model Unsustainable
13
Several major trends, in particular, are undermining the industry’s prevailing business model, which has remained largely unchanged for decades:
• Policy pushes for CO2 reduction• Technology enables low-carbon
energy at scale• Climate change impact threatens
the current and future energy supply• End users demand energy efficiency
and low-carbon energy• Non-traditional entrants challenge
incumbents Together, these trends are pushing electric utility companies to decouple their business activity from emissions, which in turn require utilities to transform their business model to support sustainable, low-carbon solutions.
Policy pushes for CO2 reductionUtilities consider cap-and-trade schemes together with international agreements among the biggest drivers for CO2 reduction to date15. International and national climate initiatives—such as the Kyoto agreements, the EU 20-20-20 goals, President Obama’s announced
Clean Power Plan and the aforementioned expected outcomes of COP21*—prescribe increasingly deep greenhouse gas emissions cuts. And regulation is set to become more stringent, as emissions reductions will need to go beyond national commitments to follow the 2°C trajectory.
National policies are already guiding utility strategies toward investment in low-carbon solutions. Emissions Trading Systems in Europe, areas of North and South America, as well as Asia, set the framework, but have so far failed to provide a meaningful price signal for investors. There is genuine momentum worldwide to strengthen and extend emissions trading in the near future, as the European Commission has agreed on a market stability reserve to tighten the supply emissions allowances according to economic conditions16, and China has announced plans for a national emissions trading scheme starting in 201717.
Further reductions in the number of CO2 emissions rights available will raise CO2 prices and force companies to reduce their carbon footprint even more.
In South Africa, regulation pushing for energy efficiency and renewable energy has been the most significant driver of the decarbonizing of the country’s energy system in the past decade, according to one executive at South African utility Eskom18. In addition, cities address climate change at the local level with such moves as tax reductions and subsidies. For example, the Covenant of Mayors, a European movement involving local and regional authorities, is committed to meeting and exceeding the EU 20-20-20 goals19.
Source: C2es.org,. 2015. ‘Q&A: EPA Regulation Of Greenhouse Gas Emissions From Existing Power Plants’. http://www.c2es.org/federal/executive/epa/q-a-regulation- greenhouse-gases-existing-power; Enerdata.net,. 2015. ‘Research On Energy Efficiency, CO2 Emissions, Energy Consumption, Forecast.’. http://www.enerdata.net.
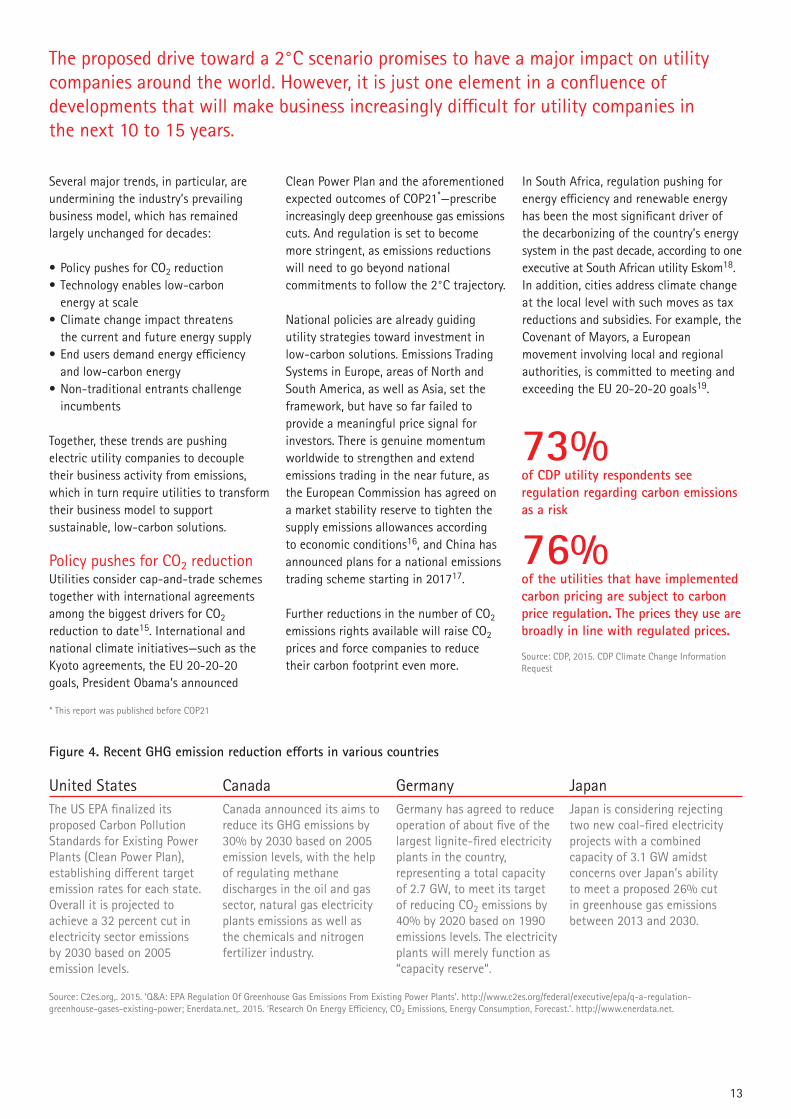
The proposed drive toward a 2°C scenario promises to have a major impact on utility companies around the world. However, it is just one element in a confluence of developments that will make business increasingly difficult for utility companies in the next 10 to 15 years.
Figure 4. Recent GHG emission reduction efforts in various countries
United States Canada Germany JapanThe US EPA finalized its proposed Carbon Pollution Standards for Existing Power Plants (Clean Power Plan), establishing different target emission rates for each state. Overall it is projected to achieve a 32 percent cut in electricity sector emissions by 2030 based on 2005 emission levels.
Canada announced its aims to reduce its GHG emissions by 30% by 2030 based on 2005 emission levels, with the help of regulating methane discharges in the oil and gas sector, natural gas electricity plants emissions as well as the chemicals and nitrogen fertilizer industry.
Germany has agreed to reduce operation of about five of the largest lignite-fired electricity plants in the country, representing a total capacity of 2.7 GW, to meet its target of reducing CO2 emissions by 40% by 2020 based on 1990 emissions levels. The electricity plants will merely function as “capacity reserve“.
Japan is considering rejecting two new coal-fired electricity projects with a combined capacity of 3.1 GW amidst concerns over Japan’s ability to meet a proposed 26% cut in greenhouse gas emissions between 2013 and 2030.
Source: CDP, 2015. CDP Climate Change Information Request
73%
76%
of CDP utility respondents see regulation regarding carbon emissions as a risk
of the utilities that have implemented carbon pricing are subject to carbon price regulation. The prices they use are broadly in line with regulated prices.
* This report was published before COP21
14
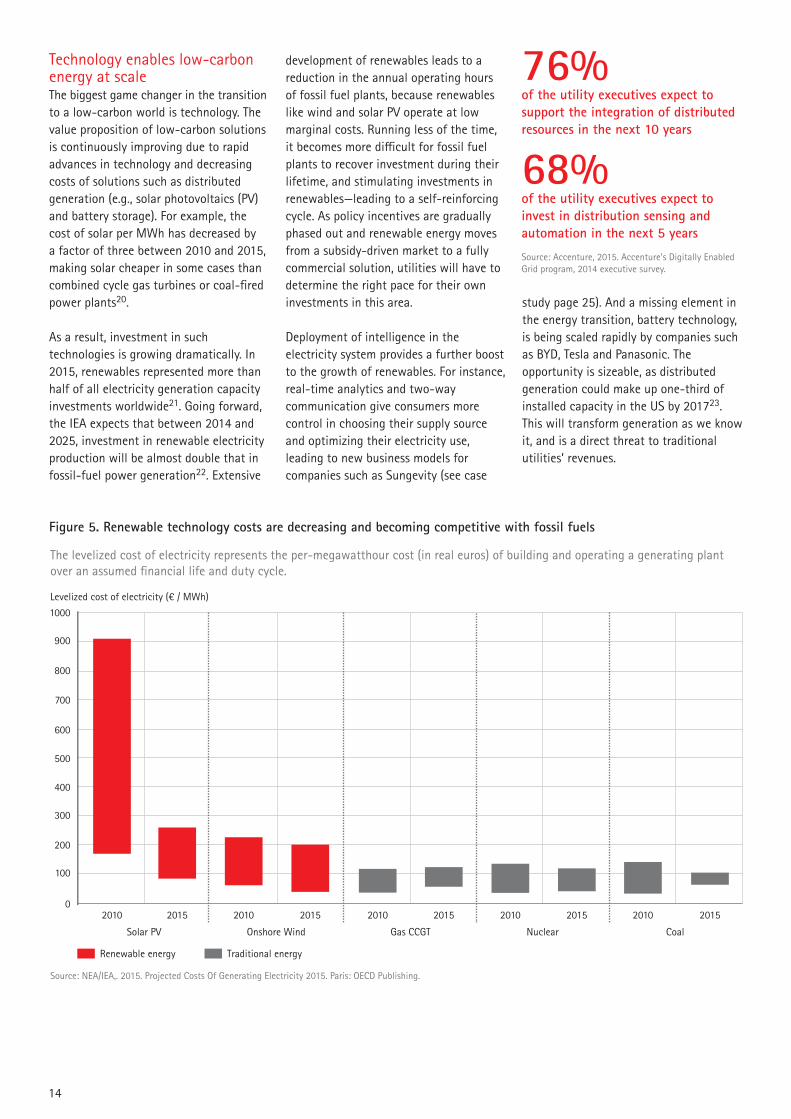
Technology enables low-carbon energy at scaleThe biggest game changer in the transition to a low-carbon world is technology. The value proposition of low-carbon solutions is continuously improving due to rapid advances in technology and decreasing costs of solutions such as distributed generation (e.g., solar photovoltaics (PV) and battery storage). For example, the cost of solar per MWh has decreased by a factor of three between 2010 and 2015, making solar cheaper in some cases than combined cycle gas turbines or coal-fired power plants20.
As a result, investment in such technologies is growing dramatically. In 2015, renewables represented more than half of all electricity generation capacity investments worldwide21. Going forward, the IEA expects that between 2014 and 2025, investment in renewable electricity production will be almost double that in fossil-fuel power generation22. Extensive
development of renewables leads to a reduction in the annual operating hours of fossil fuel plants, because renewables like wind and solar PV operate at low marginal costs. Running less of the time, it becomes more difficult for fossil fuel plants to recover investment during their lifetime, and stimulating investments in renewables—leading to a self-reinforcing cycle. As policy incentives are gradually phased out and renewable energy moves from a subsidy-driven market to a fully commercial solution, utilities will have to determine the right pace for their own investments in this area.
Deployment of intelligence in the electricity system provides a further boost to the growth of renewables. For instance, real-time analytics and two-way communication give consumers more control in choosing their supply source and optimizing their electricity use, leading to new business models for companies such as Sungevity (see case
study page 25). And a missing element in the energy transition, battery technology, is being scaled rapidly by companies such as BYD, Tesla and Panasonic. The opportunity is sizeable, as distributed generation could make up one-third of installed capacity in the US by 201723. This will transform generation as we know it, and is a direct threat to traditional utilities’ revenues.
Figure 5. Renewable technology costs are decreasing and becoming competitive with fossil fuels
2010 2015 2010 2015 2010 2015 2010 2015 2010 2015
Solar PV Onshore Wind Gas CCGT Nuclear Coal
0
200
100
300
500
700
400
600
800
900
1000
Levelized cost of electricity (€ / MWh)
Renewable energy Traditional energy
Source: NEA/IEA,. 2015. Projected Costs Of Generating Electricity 2015. Paris: OECD Publishing.
The levelized cost of electricity represents the per-megawatthour cost (in real euros) of building and operating a generating plant over an assumed financial life and duty cycle.
Source: Accenture, 2015. Accenture’s Digitally Enabled Grid program, 2014 executive survey.
76%
68%
of the utility executives expect to support the integration of distributed resources in the next 10 years
of the utility executives expect to invest in distribution sensing and automation in the next 5 years
15
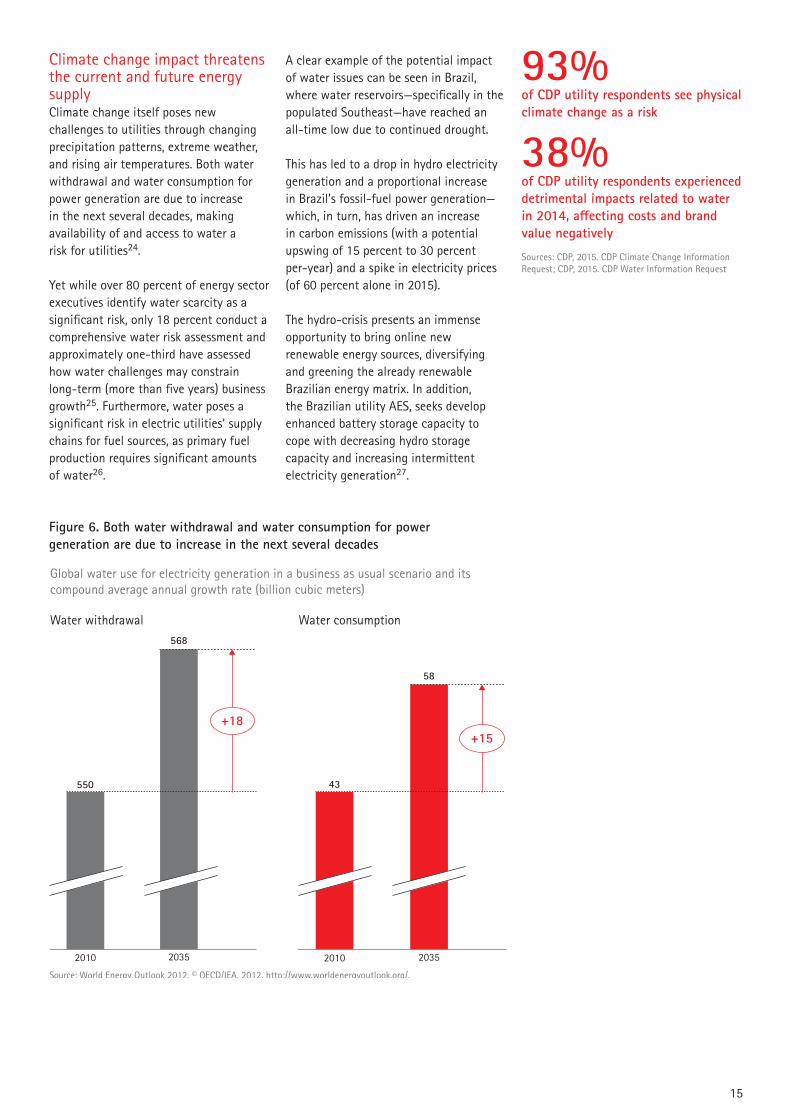
Climate change impact threatens the current and future energy supplyClimate change itself poses new challenges to utilities through changing precipitation patterns, extreme weather, and rising air temperatures. Both water withdrawal and water consumption for power generation are due to increase in the next several decades, making availability of and access to water a risk for utilities24.
Yet while over 80 percent of energy sector executives identify water scarcity as a significant risk, only 18 percent conduct a comprehensive water risk assessment and approximately one-third have assessed how water challenges may constrain long-term (more than five years) business growth25. Furthermore, water poses a significant risk in electric utilities’ supply chains for fuel sources, as primary fuel production requires significant amounts of water26.
A clear example of the potential impact of water issues can be seen in Brazil, where water reservoirs—specifically in the populated Southeast—have reached an all-time low due to continued drought.
This has led to a drop in hydro electricity generation and a proportional increase in Brazil’s fossil-fuel power generation—which, in turn, has driven an increase in carbon emissions (with a potential upswing of 15 percent to 30 percent per-year) and a spike in electricity prices (of 60 percent alone in 2015).
The hydro-crisis presents an immense opportunity to bring online new renewable energy sources, diversifying and greening the already renewable Brazilian energy matrix. In addition, the Brazilian utility AES, seeks develop enhanced battery storage capacity to cope with decreasing hydro storage capacity and increasing intermittent electricity generation27.
93%
38%of CDP utility respondents see physical climate change as a risk
of CDP utility respondents experienced detrimental impacts related to water in 2014, affecting costs and brand value negatively
Figure 6. Both water withdrawal and water consumption for power generation are due to increase in the next several decades
2010
Global water use for electricity generation in a business as usual scenario and its compound average annual growth rate (billion cubic meters)
Water withdrawal Water consumption
Source: World Energy Outlook 2012, © OECD/IEA, 2012, http://www.worldenergyoutlook.org/.
2035
+18
2010 2035
550
568
43
58
+15
Sources: CDP, 2015. CDP Climate Change Information Request; CDP, 2015. CDP Water Information Request
16
End users demand energy efficiency and low-carbon energyOn their own, climate change and technology developments play a major role in the drive toward low-carbon solutions. Together, they incentivize end users to reduce their energy demand and shift to low-carbon energy.
End users around the world are embracing the ability of new technologies to give them insight into and control over their energy use and bill and choice of energy source allowing them to reduce their environmental and societal impact.
For example, around 8 in 10 consumers in the Philippines (87 percent), Brazil (80 percent) and China (78 percent) are considering purchasing residential monitoring and control products in the next five years, the highest of any country.
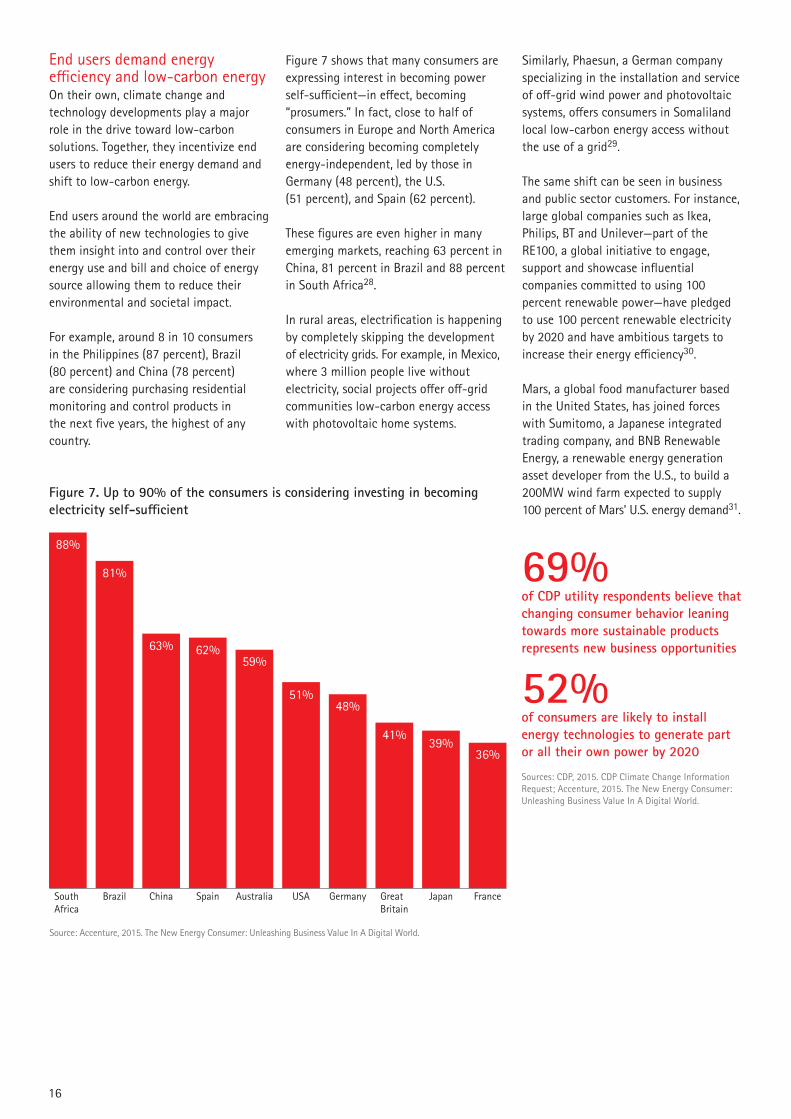
Figure 7 shows that many consumers are expressing interest in becoming power self-sufficient—in effect, becoming “prosumers.” In fact, close to half of consumers in Europe and North America are considering becoming completely energy-independent, led by those in Germany (48 percent), the U.S. (51 percent), and Spain (62 percent).
These figures are even higher in many emerging markets, reaching 63 percent in China, 81 percent in Brazil and 88 percent in South Africa28.
In rural areas, electrification is happening by completely skipping the development of electricity grids. For example, in Mexico, where 3 million people live without electricity, social projects offer off-grid communities low-carbon energy access with photovoltaic home systems.
Similarly, Phaesun, a German company specializing in the installation and service of off-grid wind power and photovoltaic systems, offers consumers in Somaliland local low-carbon energy access without the use of a grid29.
The same shift can be seen in business and public sector customers. For instance, large global companies such as Ikea, Philips, BT and Unilever—part of the RE100, a global initiative to engage, support and showcase influential companies committed to using 100 percent renewable power—have pledged to use 100 percent renewable electricity by 2020 and have ambitious targets to increase their energy efficiency30.
Mars, a global food manufacturer based in the United States, has joined forces with Sumitomo, a Japanese integrated trading company, and BNB Renewable Energy, a renewable energy generation asset developer from the U.S., to build a 200MW wind farm expected to supply 100 percent of Mars’ U.S. energy demand31.
Figure 7. Up to 90% of the consumers is considering investing in becoming electricity self-sufficient
69%
52%
of CDP utility respondents believe that changing consumer behavior leaning towards more sustainable products represents new business opportunities
of consumers are likely to install energy technologies to generate part or all their own power by 2020
South Africa
Source: Accenture, 2015.�The New Energy Consumer: Unleashing Business Value In A Digital World.
China USA JapanBrazil Spain Australia Germany GreatBritain
France
88%
81%
63% 62%59%
51%48%
41%39%
36%
Sources: CDP, 2015. CDP Climate Change Information Request; Accenture, 2015. The New Energy Consumer: Unleashing Business Value In A Digital World.
Base: All respondents who selected “yes”.Source: Accenture, 2014. Digitally Enabled Grid program, 2014 executive survey.
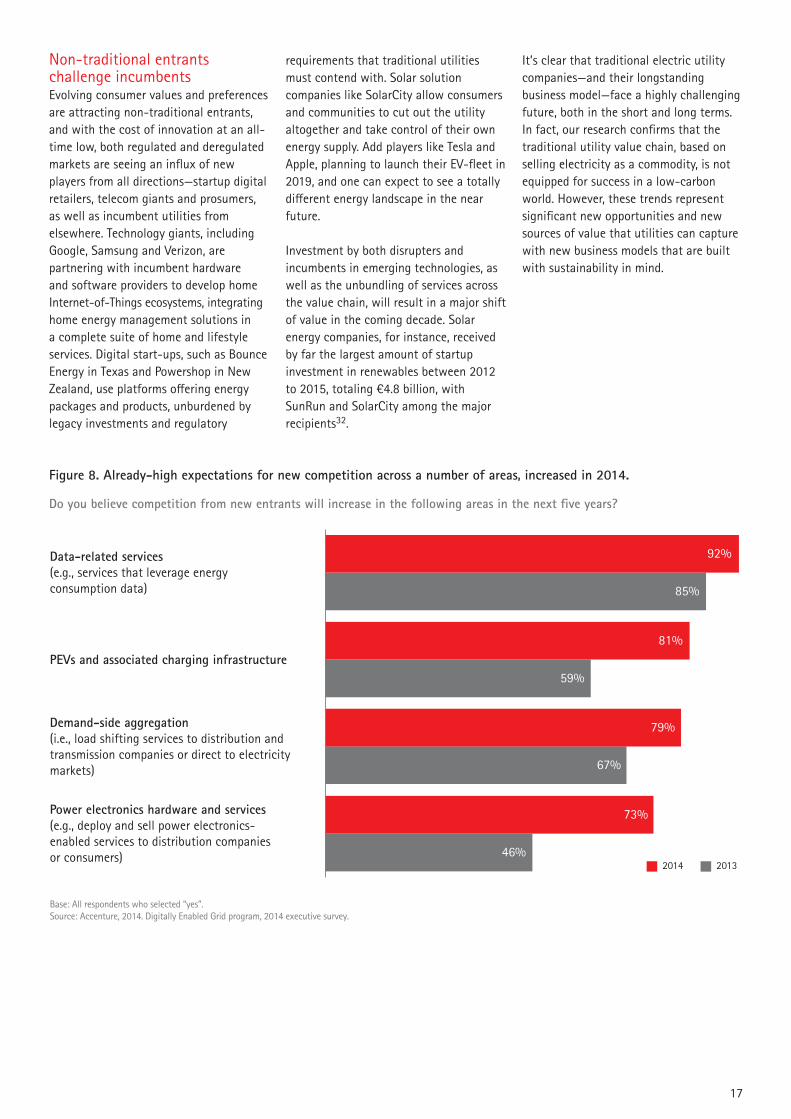
Do you believe competition from new entrants will increase in the following areas in the next five years?
Data-related services (e.g., services that leverage energy consumption data)
PEVs and associated charging infrastructure
Demand-side aggregation (i.e., load shifting services to distribution and transmission companies or direct to electricity markets)
Power electronics hardware and services(e.g., deploy and sell power electronics-enabled services to distribution companies or consumers)
92%
85%
81%
59%
79%
67%
73%
46%2014 2013
Non-traditional entrants challenge incumbentsEvolving consumer values and preferences are attracting non-traditional entrants, and with the cost of innovation at an all-time low, both regulated and deregulated markets are seeing an influx of new players from all directions—startup digital retailers, telecom giants and prosumers, as well as incumbent utilities from elsewhere. Technology giants, including Google, Samsung and Verizon, are partnering with incumbent hardware and software providers to develop home Internet-of-Things ecosystems, integrating home energy management solutions in a complete suite of home and lifestyle services. Digital start-ups, such as Bounce Energy in Texas and Powershop in New Zealand, use platforms offering energy packages and products, unburdened by legacy investments and regulatory
requirements that traditional utilities must contend with. Solar solution companies like SolarCity allow consumers and communities to cut out the utility altogether and take control of their own energy supply. Add players like Tesla and Apple, planning to launch their EV-fleet in 2019, and one can expect to see a totally different energy landscape in the near future.
Investment by both disrupters and incumbents in emerging technologies, as well as the unbundling of services across the value chain, will result in a major shift of value in the coming decade. Solar energy companies, for instance, received by far the largest amount of startup investment in renewables between 2012 to 2015, totaling €4.8 billion, with SunRun and SolarCity among the major recipients32.
It’s clear that traditional electric utility companies—and their longstanding business model—face a highly challenging future, both in the short and long terms. In fact, our research confirms that the traditional utility value chain, based on selling electricity as a commodity, is not equipped for success in a low-carbon world. However, these trends represent significant new opportunities and new sources of value that utilities can capture with new business models that are built with sustainability in mind.
17
Figure 8. Already-high expectations for new competition across a number of areas, increased in 2014.
18
Value Shifts in a Low-Carbon World
19
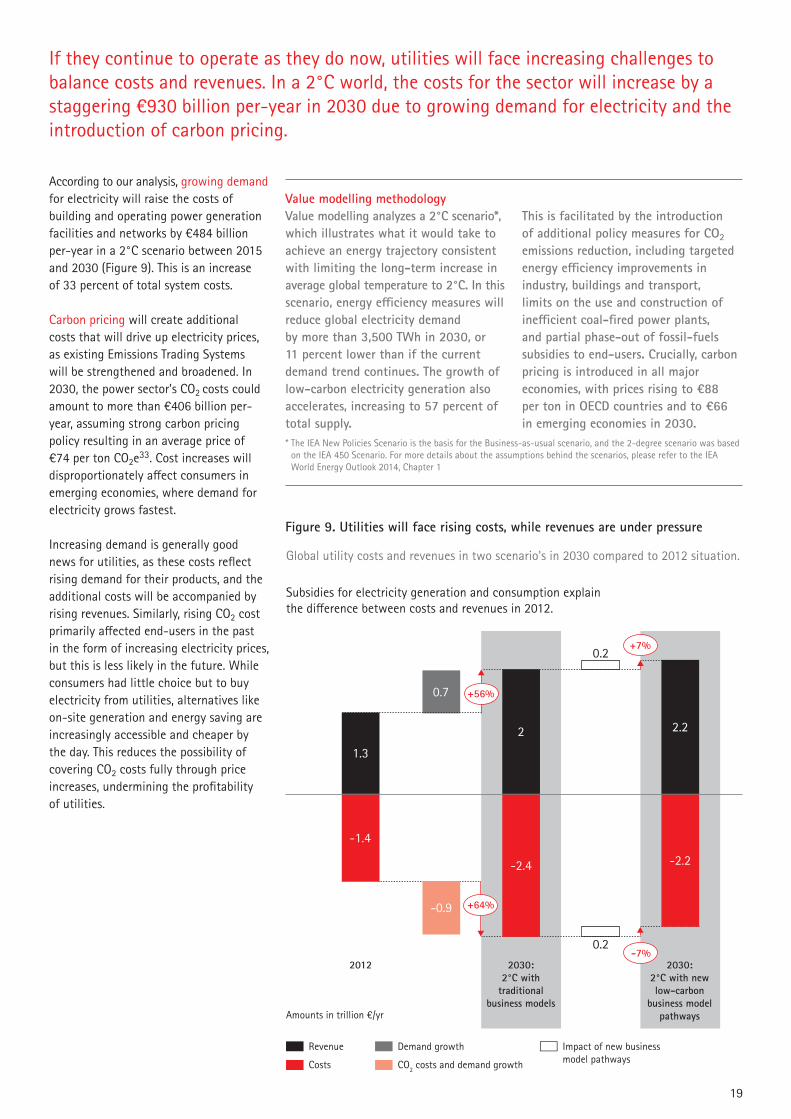
According to our analysis, growing demand for electricity will raise the costs of building and operating power generation facilities and networks by €484 billion per-year in a 2°C scenario between 2015 and 2030 (Figure 9). This is an increase of 33 percent of total system costs.
Carbon pricing will create additional costs that will drive up electricity prices, as existing Emissions Trading Systems will be strengthened and broadened. In 2030, the power sector’s CO2 costs could amount to more than €406 billion per-year, assuming strong carbon pricing policy resulting in an average price of €74 per ton CO2e33. Cost increases will disproportionately affect consumers in emerging economies, where demand for electricity grows fastest.
Increasing demand is generally good news for utilities, as these costs reflect rising demand for their products, and the additional costs will be accompanied by rising revenues. Similarly, rising CO2 cost primarily affected end-users in the past in the form of increasing electricity prices, but this is less likely in the future. While consumers had little choice but to buy electricity from utilities, alternatives like on-site generation and energy saving are increasingly accessible and cheaper by the day. This reduces the possibility of covering CO2 costs fully through price increases, undermining the profitability of utilities.
If they continue to operate as they do now, utilities will face increasing challenges to balance costs and revenues. In a 2°C world, the costs for the sector will increase by a staggering €930 billion per-year in 2030 due to growing demand for electricity and the introduction of carbon pricing.
Value modelling methodology Value modelling analyzes a 2°C scenario*, which illustrates what it would take to achieve an energy trajectory consistent with limiting the long-term increase in average global temperature to 2°C. In this scenario, energy efficiency measures will reduce global electricity demand by more than 3,500 TWh in 2030, or 11 percent lower than if the current demand trend continues. The growth of low-carbon electricity generation also accelerates, increasing to 57 percent of total supply.
This is facilitated by the introduction of additional policy measures for CO2 emissions reduction, including targeted energy efficiency improvements in industry, buildings and transport, limits on the use and construction of inefficient coal-fired power plants, and partial phase-out of fossil-fuels subsidies to end-users. Crucially, carbon pricing is introduced in all major economies, with prices rising to €88 per ton in OECD countries and to €66 in emerging economies in 2030.
Figure 9. Utilities will face rising costs, while revenues are under pressure
Global utility costs and revenues in two scenario's in 2030 compared to 2012 situation.
Subsidies for electricity generation and consumption explain the difference between costs and revenues in 2012.
2012 2030: 2°C with
traditional business models
2030: 2°C with new low-carbon
business model pathways
Revenue Demand growth Impact of new business model pathwaysCosts CO2 costs and demand growth
+56%
+7%
-7%
0.2
0.2
0.7
-0.9
-2.4
2 2.2
-2.2
-1.4
1.3
+64%
Amounts in trillion €/yr
* The IEA New Policies Scenario is the basis for the Business-as-usual scenario, and the 2-degree scenario was based on the IEA 450 Scenario. For more details about the assumptions behind the scenarios, please refer to the IEA World Energy Outlook 2014, Chapter 1
20
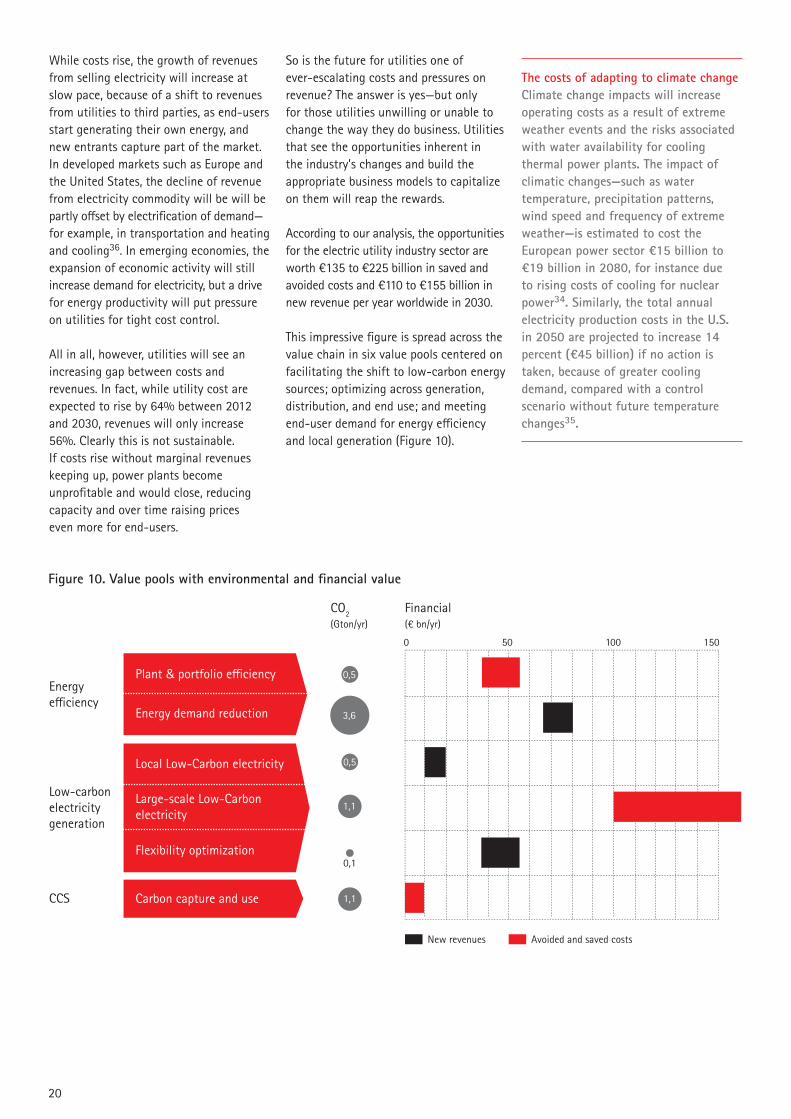
Figure 10. Value pools with environmental and financial value
The costs of adapting to climate change Climate change impacts will increase operating costs as a result of extreme weather events and the risks associated with water availability for cooling thermal power plants. The impact of climatic changes—such as water temperature, precipitation patterns, wind speed and frequency of extreme weather—is estimated to cost the European power sector €15 billion to €19 billion in 2080, for instance due to rising costs of cooling for nuclear power34. Similarly, the total annual electricity production costs in the U.S. in 2050 are projected to increase 14 percent (€45 billion) if no action is taken, because of greater cooling demand, compared with a control scenario without future temperature changes35.
While costs rise, the growth of revenues from selling electricity will increase at slow pace, because of a shift to revenues from utilities to third parties, as end-users start generating their own energy, and new entrants capture part of the market. In developed markets such as Europe and the United States, the decline of revenue from electricity commodity will be will be partly offset by electrification of demand—for example, in transportation and heating and cooling36. In emerging economies, the expansion of economic activity will still increase demand for electricity, but a drive for energy productivity will put pressure on utilities for tight cost control.
All in all, however, utilities will see an increasing gap between costs and revenues. In fact, while utility cost are expected to rise by 64% between 2012 and 2030, revenues will only increase 56%. Clearly this is not sustainable. If costs rise without marginal revenues keeping up, power plants become unprofitable and would close, reducing capacity and over time raising prices even more for end-users.
So is the future for utilities one of ever-escalating costs and pressures on revenue? The answer is yes—but only for those utilities unwilling or unable to change the way they do business. Utilities that see the opportunities inherent in the industry’s changes and build the appropriate business models to capitalize on them will reap the rewards.
According to our analysis, the opportunities for the electric utility industry sector are worth €135 to €225 billion in saved and avoided costs and €110 to €155 billion in new revenue per year worldwide in 2030.
This impressive figure is spread across the value chain in six value pools centered on facilitating the shift to low-carbon energy sources; optimizing across generation, distribution, and end use; and meeting end-user demand for energy efficiency and local generation (Figure 10).
Energy efficiency
CCS
Low-carbon electricity generation
Plant & portfolio efficiency
Energy demand reduction
Local Low-Carbon electricity
Large-scale Low-Carbon electricity
Flexibility optimization
Carbon capture and use
CO2 Financial(Gton/yr) (€ bn/yr)
0,5
3,6
0,5
1,1
0,1
1,1
0 15050 100
New revenues Avoided and saved costs
21
Value pool 1: Plant and portfolio efficiency Enhanced energy efficiency in electricity generation remains an important conventional value pool for utilities. However, additional CO2 savings achieved in plant and portfolio efficiency will be minor by 2030 (around 500 Mt CO2e per-year) because, as efficiency is an effective cost-control measure, the business-as-usual case already assumes improvement in this area.
According to our analysis, the business value of plant and portfolio efficiency improvement could range between €35 billion and €55 billion per-year by 2030, driven by reductions in operational and CO2 emissions costs and equaling a 1 percent costs reduction versus current conventional costs. Future wholesale prices and CO2 emissions prices are the main uncertainties that will determine the actual value. Importantly, this value pool will only be available during the transition to a 2°C world; it will dry up after 2030.
Eskom, a South African utility, provides one example of a company making such a transition. With coal accounting for approximately 85 percent of its generation capacity, Eskom plans to reduce its carbon emissions by enhancing its coal generation with clean coal measures such as pursuing underground coal gasification, possibly operating smaller coal units, and increasing the use of lower-carbon emitting technologies such as renewables, gas, and nuclear37.
Value pool 2: Energy demand reduction End-user reduction in energy demand is a game changer in the transition to a 2°C scenario, as it will be highly effective in cutting emissions, yielding a reduction of as much as 3.6 Gt CO2e annually. Utilities can earn back revenue losses from electricity demand reduction by capitalizing on the growing interest in energy management products and services—an estimated €65 billion to €80 billion per-year by 2030, depending on customers’ willingness to pay and the share of system benefits that utilities manage to capture.
Value pool 3: Local low-carbon energyDemand for distributed generation will create opportunities in local energy initiatives. Accounting for decreasing revenues from electricity commodity sales, distributed renewables services could enable utilities to generate revenues of €10 billion and €20 billion per year by 2030, while avoiding approximately 500 Mt CO2e emissions per-year.
Value pool 4: Large-scale low-carbon electricityAs electricity generation shifts toward low-carbon sources, assuming reduced emissions in power generation will be approximately 1.1 Gt CO2e annually, revenue from low-carbon electricity will offset the lost revenue from fossil fuel generation.
Our analysis found this to be the largest value opportunity for utilities in a 2°C scenario, providing a benefit of €100 billion to €160 billion per-year by 2030. These benefits are the result of savings in fuel and CO2 costs related to displaced fossil-fuel generation, and therefore depend on CO2 prices as well as the rate of cost reduction in low-carbon electricity technology.
Value pool 5: Flexibility optimizationSystem optimization and flexibility management make a modest direct contribution to emissions reduction of approximately 100 Mt CO2e emissions annually in a 2°C scenario, but they are essential to reducing emissions throughout the system.
By optimizing efficiency in all segments of the value chain through the tight matching of supply and demand, as well as by maintaining system balance and reliability, flexibility optimization will create €35 billion to €55 billion per-year value for utilities by 2030, depending on how the value is shared among end-users, utilities and other market players.
Value pool 6:Carbon capture and useThe 2°C scenario requires extensive action to reduce CO2 emissions. Applying carbon capture at fossil-fuel power plants could be an important building block for achieving this, if a conductive regulatory environment is created. An additional 1.1 Gt CO2e per-year could be saved if, by 2030, one-quarter of all coal- and gas-fired power plants were to be fitted with carbon capture and sequestration, thus creating a new value pool focused on the capture and use of carbon-based products.
The commercial viability of carbon capture is still a challenge today. Deploying a coal-fired power plant with CCS comes with a cost premium of 20 to 60 percent, and costs are expected to fall only gradually; thus, the value generated remains limited to 2030, up to €10 billion per-year. Beyond 2030, however, this value pool might expand, as opportunities to generate value from carbon-based products or CO2 might materialize.
As our analysis demonstrates, the low-carbon future—while challenging—offers opportunities. Although electric utility companies will continue to see their traditional revenue streams decline over time due to the gradual phasing out of carbon energy sources, significant new revenue sources could take their place. In the next section, we discuss five business model pathways that will be critical to utilities’ ability to capitalize on those revenue streams.
21
22
Five Business Model Pathways Toward a Low-Carbon Energy System
23
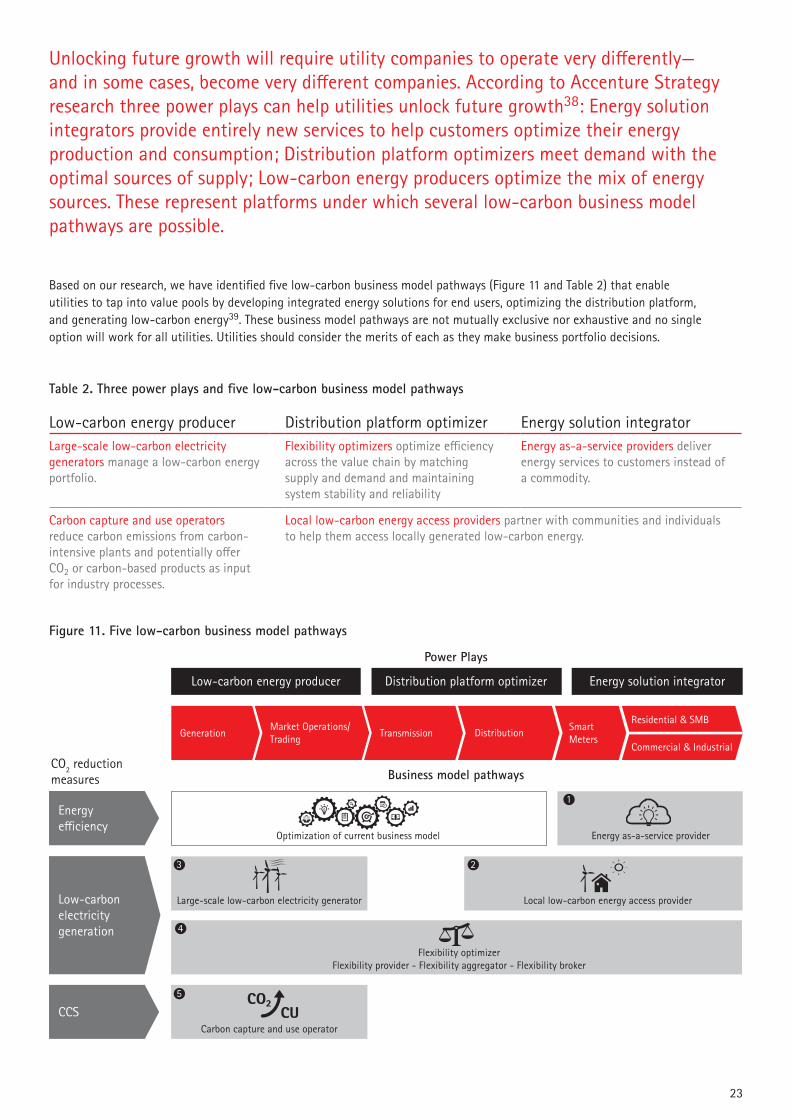
Unlocking future growth will require utility companies to operate very differently— and in some cases, become very different companies. According to Accenture Strategy research three power plays can help utilities unlock future growth38: Energy solution integrators provide entirely new services to help customers optimize their energy production and consumption; Distribution platform optimizers meet demand with the optimal sources of supply; Low-carbon energy producers optimize the mix of energy sources. These represent platforms under which several low-carbon business model pathways are possible.
Low-carbon energy producer Distribution platform optimizer Energy solution integratorLarge-scale low-carbon electricity generators manage a low-carbon energy portfolio.
Flexibility optimizers optimize efficiency across the value chain by matching supply and demand and maintaining system stability and reliability
Energy as-a-service providers deliver energy services to customers instead of a commodity.
Carbon capture and use operators reduce carbon emissions from carbon-intensive plants and potentially offer CO2 or carbon-based products as input for industry processes.
Local low-carbon energy access providers partner with communities and individuals to help them access locally generated low-carbon energy.
Table 2. Three power plays and five low-carbon business model pathways
Based on our research, we have identified five low-carbon business model pathways (Figure 11 and Table 2) that enable utilities to tap into value pools by developing integrated energy solutions for end users, optimizing the distribution platform, and generating low-carbon energy39. These business model pathways are not mutually exclusive nor exhaustive and no single option will work for all utilities. Utilities should consider the merits of each as they make business portfolio decisions.
Figure 11. Five low-carbon business model pathways
Energy efficiency
CCS
CO2 reduction measures Business model pathways
Power Plays
GenerationMarket Operations/Trading Transmission Distribution Smart
MetersCommercial & Industrial
Residential & SMB
Optimization of current business model Energy as-a-service provider
Large-scale low-carbon electricity generator
Carbon capture and use operator
Local low-carbon energy access provider
Low-carbon energy producer Distribution platform optimizer Energy solution integrator
1
23
5
Flexibility optimizerFlexibility provider - Flexibility aggregator - Flexibility broker
4
Low-carbon electricity generation
CO2CU
24
Energy-as-a-service realigns the utility business model around delivering energy services to customers instead of electricity as-a-commodity—a focus that could enable such companies to capture business value between €65 billion and €80 billion per-year by 2030 from the energy demand reduction value pool. Energy as-a-service providers help customers reduce their energy use and bills through monitoring and signaling and by controlling devices remotely on customers’ behalf. Eneco is one company that has embraced this business model by placing the customer-centric energy management device “Toon” at the core of its strategy. Toon helps consumers control their building heating, lighting, and other smart devices, and is the perfect contact point for Eneco to leverage new services.
Becoming an effective energy-as-a-service provider will require a utility to shift its revenue model away from volume sold to benefits delivered—for example, actual reduction in electricity use or specific services delivered. Sustained consumer trust will be vital within this pathway. Energy-as-a-service providers will need deep competencies in understanding customers’ needs, energy purchase criteria and usage behavior (through customer analytics) and multichannel interaction capabilities to build strong customer relationships. Providers also will require robust digital capabilities that enable them to monitor, analyze, and manage energy remotely in real time.
Retail utilities are especially well positioned to become successful energy as-a-service providers. They can gain access to customers with smart office and connected home systems, and are recognized as reliable suppliers of energy solutions by consumers: 61 percent of consumers are interested in buying energy services from energy utilities40.
However, other players with strong technology capabilities are entering the energy services market and targeting households through connected home solutions. It is therefore essential that utilities develop compelling customer value propositions backed by seamless execution. One way to do so is by joining forces with other in-home service providers—much like Direct Energy has done. This large retail provider of electricity, natural gas, and home services in North America has teamed with Google to support the adoption of Google’s Nest services41.
In addition, traditional utilities are partnering with promising new energy startups to understand and explore how to operate a new retail business. For example E.ON, a traditional German utility, is partnering with Sungevity, a North American solar energy start-up that is moving into the German residential market.
Nevertheless, not all markets have the right characteristics for such a model. The most suitable markets are those with the requisite infrastructure for sophisticated energy services—in particular, smart meters, smart grids, and a growing number of end users with connected devices. Extensive electricity use and high electricity prices increase the market potential for utilities. North America, northern Europe, Japan and Australia are among the regions most suited to an energy as-a-service model.
Case Study—Eneco sees business model innovation and cooperation with innovators crucial to its longer-term existence
Type Generation and wholesale sales of electricity and heating, as well as distribution and retail sales of electricity, heating, and gas
Region The Netherlands
Size • 2,988 MW installed capacity• 7.191 GWh generation output• 45,358 km electricity distribution
network • 2.2 million utility customers
Installed capacity42
43.8% conventional, 40.5% onshore wind, 10.0% offshore wind, 3.4% biomass, 2.4% sun
Generation output43
50.8% conventional, 26.3% onshore wind, 13.5% offshore wind, 3.4% biomass, 0.8% sun
Context & StrategyThe Dutch government is encouraging consumers and retailers to reduce energy demand via a national smart meter roll-out that offers utilities and other companies the opportunity to develop products and services to monitor and control energy. Eneco envisions itself as a digital utility of the future and wants to leverage the smart meter roll-out by providing Energy as-a-service solutions.
Energy as-a-service provider
24
25
Business modelEneco has put the energy management device “Toon” at the core of its customer strategy. The Toon is a smart thermostat and display that helps to optimize energy efficiency and comfort for residential housing. A digital platform that monitors and controls energy use, Toon has been installed in more than 100.000 households. Consumers pay a fixed subscription fee for the device.
The successful uptake of Toon and the access to its connected devices enables Eneco to offer its consumers innovative products and services to manage their energy. For instance, working with the Dutch startup Nerdalize, Eneco is testing the feasibility of using waste-heat from data servers to heat homes. A cooperation with TESLA has led to an offering for electric vehicle owners to earn money by allowing an energy company to use their car batteries for energy storage.
Utilities need to embed innovation in the core of their business and develop partnerships with innovative players in the market. As Eneco’s chairman and CEO puts, it “Successful partnerships where both parties share the risk and rewards drive us to become a truly digital utility.”
Key success factors• Customer centricity• Smart meter rollout• Digital capability• Smart devices partnerships
“Successful partnerships where both parties share the risk and rewards drive us to become a truly digital utility.” Jeroen de Haas, Chairman and CEO, Eneco
Case Study—With digital technologies and a community-based approach, Sungevity brings scale to the solar market for consumers
Type Providing local low-carbon energy access and providing of energy as-a-service Region North America, United Kingdom, The Netherlands, Germany, Australia
Size 10,000 utility customers
Context & StrategySungevity sees the conventional electricity system changing to a more democratized utility industry with a growing number of distributed generation systems. Information and communication technologies are now available and are getting cheaper, enabling the management of electricity supply and demand in real time and at scale, e.g., with demand response. Consumers are becoming more and more involved and service-oriented, due to their ability to choose their retailer, enabled by new digital technologies. Sungevity wants to leverage these changing business dynamics by broadening and deepening the customer relationship
Business modelSungevity’s value proposition is managing the installation of PV panels with additional services such as lease, insurance, monitoring, and other customer services. With the help of long-term (e.g., 20 years) service relationships, Sungevity expects to become a trusted brand for smart home technologies and will sell new additions to existing services, such as home energy management, application scheduling, and EV charging.
It foresees solar as the gateway to the smart home market. Unlike other conventional utilities’ business models, Sungevity provides tailor-made solutions aligned with customers’ needs. With the help of new digital technologies and new media, the company keeps track of its customers’ preferences and enables interactive relationships with its customers.
In 2015, Sungevity entered the German electricity market by partnering with E.ON, utilizing E.ON as a sales channel to millions of customers. For E.ON, the partnership is a learning journey for both parties to understand and explore how to run a retail business.
Key success factors• Understanding customer journey• Digital capability (remote design)• Capability on how to run an
interactive web• Customer-centric approach
“Its not a matter if all roofs will be covered with PV, its more a matter when all roofs will be energy producers” Danny Kennedy, Founder & CEO Sungevity
26
Local low-carbon energy access providerLocal low-carbon energy access providers partner with communities and individuals to help them access locally generated low-carbon energy—a market that, in our analysis, could range between €10 billion and €20 billion per-year in 2030. Utilities can encourage local deployment of low-carbon energy by individuals, businesses or communities through products and services that support distributed renewables—such as solar PV, microgrid installation, and maintenance and peer-to-peer solutions for exchanging low-carbon electricity. Local low-carbon energy access providers help customers finance, install, and maintain local generation capacity and microgrid infrastructures.
In addition, they build virtual platforms that support collaboration among small-scale generators and consumers.
Two leading examples of such providers are Dutch startup Vandebron, which enables consumers to buy their electricity from local low-carbon energy suppliers at an online marketplace; and East African for-profit social enterprise M-KOPA Solar, which partners with telecommunications companies Safaricom and Vodafone to provide residential integrated solar systems to poor and low-income customers through an innovative technology and financing platform with micro payments via SIM cards44.
The biggest change required for electric utilities adopting this model is shifting their one-dimensional business-to-consumer relationship to a partnership model, in which joint investments in local generation and distribution lead to shared profits and shared risks.
To add value and to gain the full trust of small-scale generators and consumers, utilities’ incentives must be transparent and aligned with their customers’ needs.Local low-carbon energy access providers need deep competencies to build partnerships with their customers to fully understand customers’ energy-related behavior and their buying decision factors and process. They also require capabilities in low-carbon generation solution engineering and digital platform and transaction management
Two different types of markets are most suitable for local low-carbon energy access providers. One is a market with a large consumer base that does not currently have access to reliable energy due to off-the-grid locations or the absence of a basic energy infrastructure—such as sub-Saharan Africa. In such markets, low-carbon methods can deliver energy to customers in far less time than conventional ones.
For example, Enel, a large global utility, has electrified remote communities in one year via solar, compared with the three years it would have taken with a coal-fired plant. Enel’s approach also provides significant generation modularity in terms of installed capacity, which is a major benefit for growing communities.
The other market is one with a large number of consumers who want to be engaged in communities to develop low-carbon energy generation because of commercial or environmental drivers. These include Australia, Western Europe, and parts of North America.
Case Study—Enel foresees renewables and microgrids as a tool to enter new growth markets
TypeGeneration and wholesale sales of electricity, as well as retail sales of electricity and gas
RegionEurope, the Americas, and Africa
Size• 96,112 MW installed capacity• 283.1 TWh generation output• 1.9 million km distribution network• 61 million utility customers
Generation output47% carbon-free generation (i.e. with renewables such as hydro, wind, geothermal, solar, and biomass)
Context and strategyEnel sees significant opportunities related to climate change mitigation. The significance of these opportunities led the company to reshape its strategy and investment decisions: almost 50% of growth capex is based on renewables. The climate change challenge proved to be a significant opportunity to encourage innovation in Enel Group, with a broad impact from generation and distribution process and technologies, to new energy services, to new business models.
Its key strategic theme in emerging countries is providing access to energy at competitive prices while respecting the environment.
Business modelRenewable energy projects pave the way for Enel to enter new markets. Enel Green Power is currently developing large wind and solar projects in South Africa, where it is one of the largest renewable players, and is looking to expand in other African markets such as Egypt, Morocco, Kenya and Namibia.
27
Renewables allow the company to electrify remote communities in a shorter time compared with conventional sources (i.e. up to one year for solar vs. more than three for a coal-fired plant) and provide significant generation modularity in terms of installed capacity, which is a major benefit for growing communities. Creating shared value, promotingsustainable development and contributing to improving the social conditions of local populations are objectives that are intrinsic to Enel’s business model and international approach.
The Group’s philosophy regarding action to be taken in these domains is based on giving priority to systemic development projects that will provide new tools to the involved populations, facilitating long-term changes.
Key success factors• Innovation R&D, knowledge, and
adoption in the field of decentralized generation and microgrids
• Skilled workforce contributing to the growth of the electricity market in emerging countries
• Corporate strategy supporting decarbonization
• Full adoption of a Creating Shared Value approach
“Renewables are at the core of Enel’s growth strategy.” Francesco Starace, CEO and General Manager, Enel S.p.A.
Case Study—Vandebron enables direct trading between customers and local renewable energy producers via its digital marketplace
Type Brokering of electricity
Region The Netherlands Size• 50 MW connected third party capacity• 167 GWh generation output• 31,000 utility customers• 32 local electricity generators
Generation output79% wind, 1% sun, 20% bio
Context and strategyThe Dutch market liberalization in 2004 enabled customers to choose their energy supplier and different commercial businesses to sell electricity on the market. Since then, renewable electricity demand has grown slowly—from 0.83% to 2.15% in 2014 of the total energy demand in the Netherlands45.
Vandebron is a new entrant in a saturated market with an innovative business model that directly connects renewable supply to customers. In this model customers can directly choose the source of their energy. Since the launch of Vandebron in April 2014, it is the fastest-growing energy supplier in Dutch history.
Business modelVandebron is the digital marketplace where consumers can directly buy energy from renewable electricity producers. Consumers pay a fixed fee to access the online marketplace and can buy energy directly and without additional margin from the producers.
By cutting out traditional energy providers as middlemen, producers get on average 10% more for their produced renewable energy.
Thus, Vandebron gives energy producers direct access to the market, which has spurred investment in small-scale generation. “Several producers on the platform have made the decision to increase their investments in renewable energy production based on the increased return on investment we offer,” according to Vandebron’s founder, Van Veller.
Vandebron encourages consumers to reduce their energy bills and organises events for clients who are interested in meeting their energy producer.
The main challenge in running the online marketplace is to explain to consumers the difference between Vandebron and renewable energy contracts from traditional suppliers, which are based on foreign certificates and thus do not add any new renewable supply.
Key success factors• Customer centricity • Customer loyalty• Digital platform
“Current utility business models are not geared to creating long-term value for the consumer.” Aart van Veller, Founder, Vandebron
28
Large-scale low-carbon electricity generatorLarge-scale low-carbon electricity generators manage a low-carbon energy portfolio. These companies, such as SSE in the United Kingdom and EDP in Portugal and Span are uniquely positioned to offer their customers, who chose to contract for it, guaranteed low-carbon energy from centralized and decentralized low-carbon generation assets, owned directly by the utility or managed on behalf of third parties. According to our analysis, large-scale low-carbon electricity generators could tap into a market of between €100 billion and €160 billion per-year by 2030 by accelerating the transition to a low-carbon energy supply market.
Large-scale low-carbon electricity generators effectively optimize the output of a diverse and robust generation portfolio of variable and controllable sources of supply. They anticipate and mitigate impacts of climate change on the production profile and availability of different technologies, using a combination of powerful generation analytic tools and different assets providing flexibility (e.g., demand response and storage).
Importantly, such companies also provide transparency and traceability of the low-carbon origin of the electricity they buy, supported by a market-based solution for valuing low-carbon generation, which will create a clear competitive advantage for low-carbon generation. According to Eskom, the South African utility planning to decarbonize, new governance models and a new mindsets are needed to cope with different life cycles of generation assets such as wind and solar46.
Thus, becoming a large-scale low-carbon electricity generator requires a utility to make portfolio choices that shift their generation assets toward a diversified and responsive portfolio of low-carbon assets. An internal carbon price can serve as a decision aide, and help utilities mitigate the value depreciation of fossil investments—as in the case of Iberdrola, a large global utility, which closed its largest coal plant that was responsible for 30 percent of its emissions. Effective
legacy management is key to keep financial balances healthy, while deep competencies in capital project management, asset management, real-time analytics, portfolio balancing operations, and certificates management and communication are also critical.
Nuclear generation Nuclear generation capacity is noted as low-carbon generation in this report and is expected to grow by approximately 50 percent by 2030. Nuclear’s portion of the global generation mix will fluctuate between 22 percent and 23 percent, driven mainly by China’s growing electricity market48. According to the director general of the IAEA, the “development of nuclear energy is shifting increasingly toward Asia with China playing a central role”49. An important consideration for such providers is to maximize the value of circular economy principles—for instance, by developing CCU or combined heat and power plants. That is what SSE has done as a strategic partner in a large-scale carbon capture project, which transformed part of SSE’s gas-fired carbon-intensive plant in Peterhead, Scotland, into a large-scale low-carbon electricity generation asset . Another company making the transition, E.ON, has opted to keep its low-carbon and traditional energy businesses separate. The company plans to split into two different entities: one that focuses on low-carbon generation and electricity grids and one that holds fossil fuel assets47.
Getting a utility-scale low-carbon energy generation model off the ground is easiest in markets that have rich renewable energy sources and strong grids that can effectively manage variable generation. Costa Rica, Brazil, Norway and Spain are good examples of countries that are typically well suited to utility-scale renewable energy generation.
Case Study—SSE has many of the capabilities required for succeeding as a large-scale low-carbon generator
Type Generation (through subsidiaries), transmission, distribution, and wholesale & retail sales of electricity
Region United Kingdom and Ireland
Size50
• 11,773 MW installed capacity• 27.6 TWh generation output• 130,000 km electricity
distribution network• 3.7 million utility customers
Installed capacity51
45,4% Gas and Oil, 25.6% Coal (inc. bio-mass co-firing), 28.9% Renewables.
Context & StrategySSE has been a renewable energy supplier for decades and is leveraging its legacy position to further pursue the decarbonization of its generation portfolio through the deployment of large-scale low-carbon generation assets. SSE chose to exit from a nuclear partnership in 2011, to focus on their competitive advantage in renewables with a strategic focus on wind power. SSE aims to reduce its emissions intensity by 50% by 2020, compared to 2006 levels.
Business modelSSE, operating the largest renewable generation portfolio in the United Kingdom, has many of the capabilities required for succeeding as a large-scale low-carbon generator. It has deep renewable energy technology expertise, knows the processes for securing planning approvals, and has a long track-record in developing and executing large-scale hydro and wind assets.
29
It understands the importance of working with stakeholders, as illustrated by its long-term relationships with suppliers and regulators, and its “responsible developer” approach to managing relationships with local communities.
SSE is aware of their dependency on government frameworks advancing low-carbon generation development. SSE is seeking clarity through support for a robust carbon price across the EU through the EU ETS, so that the cost of carbon is leveled and the need for renewables subsidies and support can be progressively reduced.
Key success factors• Technology expertise• Planning approvals• Capability in large-scale asset and
project management• Capability in stakeholder management• Continuous investments in green energy
portfolio• Carbon pricing• Transparency into emission
rates for customers
“As one of the UK’s largest investors in low carbon energy, SSE has long argued for a strong international carbon framework that can provide the right signals for efficient investment.” Alistair Phillips Davies, Chief Executive, SSE
Case Study—Iberdrola is committed to developing its business model as a large-scale low-carbon electricity generatorTypeGeneration and wholesale sales of electricity, as well as retail sales of electricity and gas
RegionSpain, United Kingdom, United States, Mexico and Brazil
Size• 45,089 MW installed capacity• 138.9 TWh generation output• 1,064,555 km electricity distribution
network • 32.6 million utility customers
Generation output52
43% conventional, 39% renewables (hydro and wind), 18% nuclear
Context and strategyBeginning in 2005, Iberdrola has changed from a local-oriented company to an international utility with cross-border environmental concerns and ambitious environmental goals. Iberdrola considers itself as a pioneer, having started long before climate change rose to the top of the international agenda. Iberdrola sees decarbonisation of the economy as an opportunity to enhance competitiveness and boost economic growth and job creation.
Beyond complying with local environmental regulations, Iberdrola has set ambitious cross-border environmental objectives with the help of integrated performance management. In 2013, its emissions per kWh were 30% lower than the average of the European electricity sector, and by 2030 it wants to reduce its emissions intensity to 50% of those it generated in 2007.
Business modelEmbedding low-carbon sustainable economic growth in its mission, vision, and strategy, Iberdrola has shifted its business model to large-scale clean energy generation and has promoted the closure of its largest coal plant that was responsible for 30% of its emissions. Iberdrola has developed a corporate culture focused on sustainability by incorporating environmental sustainability in its key objectives.
It has linked environmental performance directly to its economics by using an internal carbon price for planning and investment decisions53. Additionally, Iberdrola’s sustainability rankings (e.g. DJSI, FTSE4Good) affects executive compensation.
Key success factors• Embedding of persistent and
long-term visioning regarding environmental matters
• Traceability and transparency of GHG emissions
• Innovation and adoption of clean technologies
• Decreasing costs of clean technologies• Digitization of the energy system
favoring robustness• Stable regulatory framewo
“Our priority is a model of properly regulated green growth that is compatible with preserving the environment while at the same time supporting low-carbon sustainable economic growth that creates jobs and wellbeing for our company.” Ignacio S. Galán, Chairman and CEO, Iberdrola
30
Flexibility optimizer Flexibility optimizers could capture value—between €35 billion and €55 billion per-year by 2030 according to our analysis—by optimizing efficiency in all segments of the value chain and maintaining system balance and reliability. Utilities can enhance efficient electricity generation, distribution, and demand and thereby reduce operation and balancing costs and improve system stability. At the generation side, conventional flexibility such as spinning reserve are replaced by energy-efficient storage elements such as batteries. In transmission and distribution, flexibility optimizers mitigate congestion and match supply and demand with the help of smart grids and storage elements. And on the demand side, demand response results in optimized cost efficiency for the end user. The flexibility optimizer business model includes three sub-models:
1. Flexibility providers, which deliver supply and demand capacity on demand, generating revenues from availability fees and supplying flexibility.
2. Flexibility aggregators, which provide a platform that combines multiple smaller sources of flexibility, giving them access to balancing markets and creating a pool of flexibility of marketable scale.
3. Flexibility brokers, which facilitate transactions in flexibility electricity supply and demand capacity, which can be used for balancing generation portfolios or managing network load.
One example of a combined flexibility aggregator and flexibility broker is Reposit Power in Australia, whose residential storage trading platform enables households to become an electricity market trader and reap profits from automated buying and selling electricity.
Because of their emphasis on efficiency, flexibility optimizers must be adept in three key areas: addressing the complexity and cost implications of the changing composition and distribution of supply and demand; aggregating and coordinating systems such as electrification of vehicles
and heating and distributed generation across locations and partners; and capitalizing on opportunities provided by future grid technology, such as automation, sensing devices, and real-time analytics capabilities to improve real-time management of the grid.
With the right plan and effective implementation, utilities can balance investment with an opportunity to establish a more cost-effective, optimized distribution system54.
Several capabilities are vital to the success of flexibility optimizers. To optimize revenues on the commodity and balancing markets, they must have deep competencies in analytical and trading capabilities that generate insights into the real-time and projected aggregated capacity availability, network load and market demand. For example, Chilean utility Colbún has developed tools to monitor and forecast the water level in its basins to support flexibility management with its hydro generation capacity.
Flexibility optimizers also must orchestrate the supply and deployment of low-carbon and reliable flexibility at scale, combining demand response, storage, and flexible supply. Finally, they require digital capabilities to support these activities, including real-time network monitoring and control, distribution automation, and device-level intelligence.
Demand for flexibility optimizers tends to be strongest in regions such as North America: areas that are partially regulated with transparent and easily accessible balancing markets. Also suitable for flexibility optimizers are regulatory environments that enable dynamic-based pricing to encourage operators of power plants, energy storage systems, and end users to adjust their supply or demand according to system needs. In such markets, demand-response services that incentivize households and small businesses to provide flexibility require a high penetration of smart infrastructure and connected devices behind the meter.
Case Study—Colbún foresees a new business opportunity for its hydroelectric generation assets, acting as flexibility providers in a high intermittent energy system.TypeGeneration and wholesale sales of electricity
RegionChile
Size• 3,278 MW installed capacity• 12,835 GWh generation output
Generation output51,8% hydro, 48,2% thermal (e.g. gas, coal, and diesel)
Context and strategyColbún has identified a shift in Chile’s demand, favoring low-carbon energy systems over polluting ones, resulting in a revision of Colbún’s expansion strategy, energy mix, sales commitments, and stakeholder management for new energy development.
Therefore, Colbún is enhancing its low-carbon generation capacity and flexibility with the development of extra hydro and combined cycle gas turbine capacity.
According to Colbún, a mixed portfolio of hydro and thermal responds best to Chile’s challenges in terms of social and environmental sustainability, competitiveness, and security of its energy matrix.
31
Business modelColbún sees a new business opportunity for its hydroelectric generation assets: providing flexibility to Chile’s energy system in addition to providing baseload electricity. The increase of non-conventional low-carbon electricity generation is leading to high intermittency; therefore, there is a strong need for flexibility in the future energy system. To support flexibility management with its hydro assets, Colbún has taken steps to develop tools to monitor and forecast the water level in its basins.
Colbún takes a long-term and holistic approach to supplying low-carbon electricity from its hydro power plants, striving to harmonize technical requirements (flexibility and regulation capacity) with environmental and local social issues. For example, from a social perspective, Colbún has assisted local communities and farmers with its hydro storage capacity to manage water resources efficiently and is working to mitigate the impacts of its exposure to extreme weather events such as droughts and floods.
Key success factors• Holistic approach to the energy-
water-food nexus • Partnerships with local government,
communities and competitors• Monitoring and forecast analytic
capabilities in flexibility supply and demand
• Ability to fluctuate generation output
“Chile has abundant water resources but the challenge is to use them in an efficient way before they reach the ocean.”Thomas Keller L., CEO, Colbún
Case Study—Reposit Power wants to maximize the value of storage assets by enabling real time flexibility tradingType Optimizing flexibility
Region Australia
SizeEmerging market with significant growth expected as availability of storage increases.
Context and strategyReposit Power sees increased flexibility management as the solution to technical and financial difficulties the grid is facing, e.g., increasing intermittency, emerging capacity constraints, and rising network costs. Reposit anticipates an economically responsible rollout of usable flexibility capacity that enhances the overall health and performance of the complete electricity system.
It wants to maximize the returns that storage assets could make by delivering flexibility services to the grid, market parties, and consumers, i.e., by aggregating and controlling storage assets and connecting them to the flexibility market.
Business modelReposit foresees a large-scale deployment of residential storage batteries within one year in mature markets such as Australia, New Zealand, the U.S., and the E.U. Therefore, it is focusing on aggregating residential storage elements.
Reposit provides a trading platform to enable customers with storage devices to capitalize on their assets by collecting profits from automated real-time buying and selling of electricity on the wholesale and retail markets at favorable prices.
Reposit’s technology provides the access and control, but flexibility providers and buyers mutually decide on the contractual transaction of flexibility.
Reposit anticipates serving transmission and distribution service operators with contracts for line voltage control and frequency control services, reducing their costs for deploying new infrastructure to cope with increases in intermittent and distributed generation. Partnerships with storage providers such as Tesla are key to connect and control the residential storage units digitally.
Key success factors• Mature market with dynamic pricing,
high degree of liberalization, and high degree of interconnectivity between suppliers and consumers
• Digital and electro-technical capabilities
• Cooperation with key stakeholders in the energy system network, e.g., balancing responsible parties, storage providers, retailers, and consumers
“Increased flexibility management is the solution to technical and financial difficulties the grid is facing.” Lachlan Blackhall, Co-founder and CTO, Reposit
32
Carbon capture and use (CCU) generates value by reducing carbon emissions from carbon-intensive plants and offering carbon as a feedstock for industry processes and products. While today, carbon capture costs are high and current regulatory frameworks make it difficult to develop a profitable business case, our analysis projects CCU to become a potential €10 billion market by 2030. More so than with the other business models, carbon pricing will play a major role in accelerating the value generated by CCU. It is also important that externalities like water scarcity are assessed with this option, as it can be high in water consumption. An example of a contemporary carbon capture and use operator is NRG, a large North American utility, which will capture carbon in a 250 MW slip stream from its 610 MW plant in Thompsons, Texas, and reuse the carbon in enhanced oil recovery processes.
While current CCU initiatives focus on fossil fuels, utilities could even go “carbon negative” in the future by capturing CO2 emissions from power plants that burn “sustainable biomass,” effectively taking CO2 out of the air.
In some cases, utilities could opt to extend their investment in CCU—by developing and applying CCU technology to give their power plants a competitive advantage in markets subject to carbon pricing, and by selling and installing the technology at other energy plants. The Korean utility KEPCO is headed down this path, foreseeing a role for the company to enter new markets by leveraging its knowledge and expertise in CCU.
To become an effective CCU operator, utilities must apply circular economy principles to carbon that enable it to transform from “waste to wealth.”
Thus, CCU utilities need deep competencies in technology and operations that support the capture, storage and use of CO2 to reduce the cost of carbon capture and increase the value of the carbon “waste.” They also need to manage their CO2 infrastructure at the technical, regulatory, and legal levels, or work with partners that have these capabilities. The ability to become a trusted business partner among companies in other industries that use CO2, as well as deep knowledge of key processes used in those industries, will be critical to uncovering innovative ways to use carbon as inputs outside of the energy sector.
CCU is best positioned to thrive where carbon-intensive and carbon-demanding industries are located closely together—which effectively means many areas around the world*. A simple example is a horticultural zone, a large surface area covered with greenhouses that use sequestrated carbon from nearby energy plants to enhance algae and crops growth. Bioprocess Algae in the United States does just that. The company’s technology harvests CO2 emissions from an ethanol plant in Iowa, which it uses to grow algae for livestock feed55.
Similarly, in India, Tata Power, an Indian electric utility, is involved in CO2 capture from its Trombay coal plant for subsequent use in algae growth56. Other examples of current CO2 use are beverage carbonation and precipitated calcium carbonate processing for food and pharmaceutical industries57.
Case Study—Carbon capture and use is essential to NRG for the long-term viability and sustainability of its carbon-intensive generation assets
TypeGeneration & wholesale and retail sales of electricity,
RegionUnited States
Size• 53,478 MW installed capacity• 130 TWh generation output• 3 million utility customers
Installed capacity58
48% gas, 31% coal, 11% oil, 6% wind, 2% solar, 2% nuclear
Generation output59
23% gas, 62% coal, 1% oil, 5% wind, 2% solar, 7% nuclear
Context and strategyNRG’s strategy is focused on corporate growth by transforming to a low-carbon independent electricity producer and retailer, with a target to reduce its carbon emissions by 50% by 2030 and 90% by 2050 based on emissions level from 2014. Its three-pronged business strategy entails deploying low-carbon energy solutions across the value chain, adding clean energy retail offerings, and modernizing its generation fleet to reduce CO2 emissions60. To enhance the long-term viability and sustainability of its coal-fired plants and maintain a diversified base-load generation portfolio, NRG is developing a capability to capture and use CO2.
Business modelNRG is currently developing the world’s largest post-combustion carbon capture project, which will capture carbon in a 240 MW slip-stream from its 610 MW plant in Thompsons, Texas, and offer the carbon to enhanced oil recovery processes.
Carbon capture and use operatorCO2CU
* In addition, CCU is most suitable in geographies with an abundance in water supply, as current carbon capture technology requires significant amounts of water for cooling.
3333
The project is a 50/50 joint venture between NRG and JX Nippon Oil & Gas Exploration, and is expected in commercial operation in late 2016. The company has acquired a working interest in the West Ranch oil field by partnering with Hilcorp Energy Company. Captured CO2 will be injected into the oil field, permanently storing it underground, increasing oil yield, and generating revenues from CO2 use61.
Enhanced oil recovery is not considered to be a sustainable use of CO2, but rather is a short- to medium-term revenue stream expected to close the business case for commercial-scale carbon capture and use under the assumption of oil prices reaching €80 per barrel. In an era of €35 oil, NRG is pursuing lower-cost technologies and higher-value returns for CO2 to allow further implementation. With increased experience, economies of scale, and advanced carbon capture technologies, NRG expects to reduce CAPEX and OPEX, thereby enhancing the economic viability of carbon capture and use for more sustainable industrial processes.
Key success factors• Availability of centralized
high-carbon emissions • Availability of carbon storage space• Proven and less-expensive capture
and use technologies• Higher-value uses for CO2 • Carbon pricing • Government subsidies
“As the U.S. transitions to a renewables-driven, increasingly distributed, grid resilient energy system, we expect to be a leader both in clean energy and in converting the CO2 emissions of our conventional generation from a liability to a profitable by-product.”David Crane, CEO, NRG
Case Study—With CCS, KEPCO can save CO2 on a national scale and KEPCO can boost overseas technology exports in a world with increasing demand for low-carbon generation units
TypeGeneration (through subsidiaries), transmission, distribution, and wholesale and retail sales of electricity
RegionGlobal, with a strong focus on South Korea
Size• 93,216 MW installed capacity• 522.0 TWh generation output• 457,257 km electricity distribution
network in South Korea• 21.9 million utility customers
Installed capacity61,5% conventional, 22,2% nuclear, 6,9% hydro, 9,4% alternative renewables
Generation output62,0% conventional, 30,0% nuclear, 1,5% hydro, 6,5% alternative renewables
Context and strategyPhysical climate change and regulations pose a risk to KEPCO’s high-carbon operations, leading to increased capital and operational costs due to increased electricity demand and South Korean’s ETS. Therefore, KEPCO seeks to develop and deploy low-carbon, green energy technologies and solutions (e.g., smart grids, new low-carbon electricity generation), and to enhance operational efficiencies of conventional power systems. In its corporate vision for 2020, it identified low-carbon electricity and smart technology as key initiatives for future growth
KEPCO sees the increase in global demand for low-carbon generation units as an opportunity for 1. its exports in nuclear power plant construction and operation technologies; and 2. investment projects in carbon-reducing innovations.
Business modelKEPCO currently runs a leading development program in CO2 capture and storage. Together with its electricity-generation subsidiaries and CCS subsidiary Korea CCS Association, it actively invests in research and demonstrates business models. KEPCO operates two 10MW pilot CO2 capture plants, one wet and one dry—the latter being the first and largest in the world.
As a result, 146,000 tCO2 is captured annually. KEPCO’s CO2 absorber delivers global top performance, and its plants’ cost is €35~€55/tCO2, compared with an average cost of €55~€70/tCO2 in other OECD countries. The plants are expected to contribute to the development of commercializing CCS, and subsequently to the reduction of greenhouse emissions, not only in the utilities sector but also in the cement, bio-products, medical-products, chemical goods and agricultural sectors. KEPCO foresees CCS as an opportunity to save CO2 emissions on a national scale and to export this technology overseas.
Key success factors• Availability of centralized
high-carbon emissions • Availability of carbon storage space• Carbon taxation/pricing• Government subsidies• Proven capture and storage technology • Generating revenue from carbon use
(not essential for KEPCO)
“KEPCO believes CCS will play a critical role in fossil fuel electricity generation by 2020.” Hwan-Eik Cho, President and CEO, KEPCO
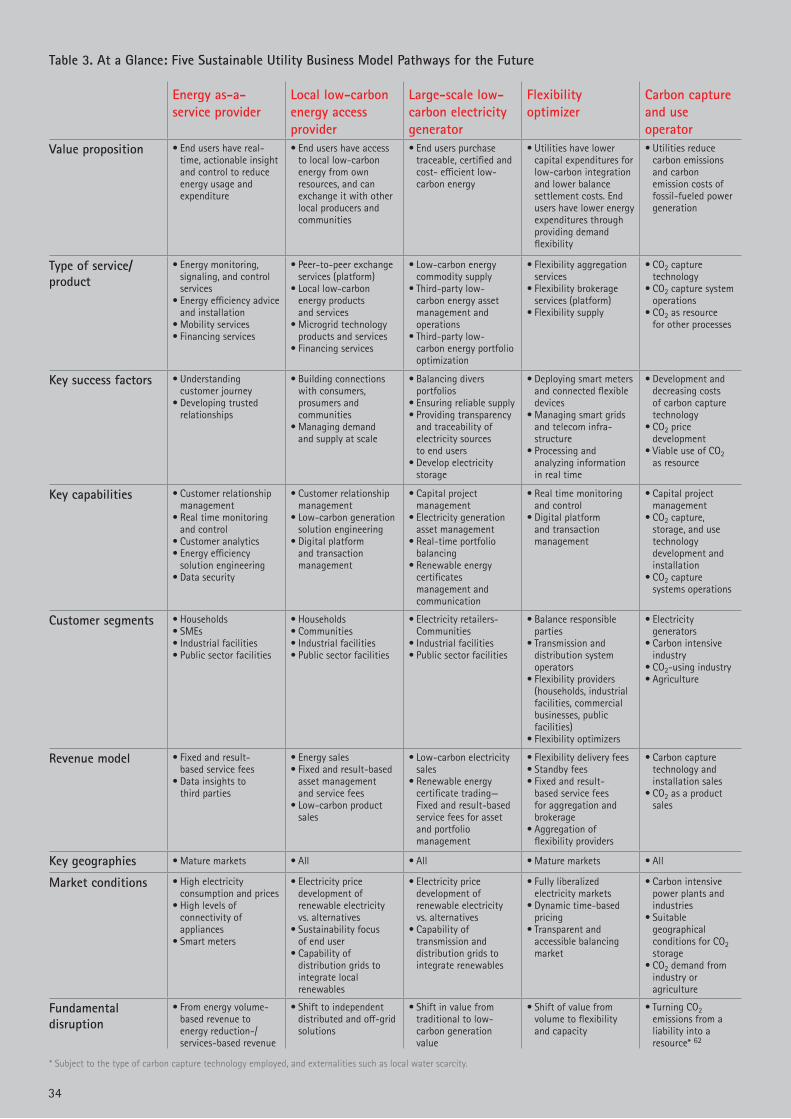
Energy as-a-service provider
Local low-carbon energy access provider
Large-scale low-carbon electricity generator
Flexibility optimizer
Carbon capture and use operator
Value proposition • End users have real- time, actionable insight and control to reduce energy usage and expenditure
• End users have access to local low-carbon energy from own resources, and can exchange it with other local producers and communities
• End users purchase traceable, certified and cost- efficient low-carbon energy
• Utilities have lower capital expenditures for low-carbon integration and lower balance settlement costs. End users have lower energy expenditures through providing demand flexibility
• Utilities reduce carbon emissions and carbon emission costs of fossil-fueled power generation
Type of service/product
• Energy monitoring, signaling, and control services
• Energy efficiency advice and installation
• Mobility services• Financing services
• Peer-to-peer exchange services (platform)
• Local low-carbon energy products and services
• Microgrid technology products and services
• Financing services
• Low-carbon energy commodity supply
• Third-party low- carbon energy asset management and operations
• Third-party low- carbon energy portfolio optimization
• Flexibility aggregation services
• Flexibility brokerage services (platform)
• Flexibility supply
• CO2 capture technology
• CO2 capture system operations
• CO2 as resource for other processes
Key success factors • Understanding customer journey
• Developing trusted relationships
• Building connections with consumers, prosumers and communities
• Managing demand and supply at scale
• Balancing divers portfolios
• Ensuring reliable supply• Providing transparency
and traceability of electricity sources to end users
• Develop electricity storage
• Deploying smart meters and connected flexible devices
• Managing smart grids and telecom infra-structure
• Processing and analyzing information in real time
• Development and decreasing costs of carbon capture technology
• CO2 price development
• Viable use of CO2 as resource
Key capabilities • Customer relationship management
• Real time monitoring and control
• Customer analytics • Energy efficiency
solution engineering• Data security
• Customer relationship management
• Low-carbon generation solution engineering
• Digital platform and transaction management
• Capital project management
• Electricity generation asset management
• Real-time portfolio balancing
• Renewable energy certificates management and communication
• Real time monitoring and control
• Digital platform and transaction management
• Capital project management
• CO2 capture, storage, and use technology development and installation
• CO2 capture systems operations
Customer segments • Households• SMEs• Industrial facilities• Public sector facilities
• Households • Communities• Industrial facilities• Public sector facilities
• Electricity retailers- Communities
• Industrial facilities• Public sector facilities
• Balance responsible parties
• Transmission and distribution system operators
• Flexibility providers (households, industrial facilities, commercial businesses, public facilities)
• Flexibility optimizers
• Electricity generators
• Carbon intensive industry
• CO2-using industry• Agriculture
Revenue model • Fixed and result- based service fees
• Data insights to third parties
• Energy sales• Fixed and result-based
asset management and service fees
• Low-carbon product sales
• Low-carbon electricity sales
• Renewable energy certificate trading—Fixed and result-based service fees for asset and portfolio management
• Flexibility delivery fees• Standby fees• Fixed and result-
based service fees for aggregation and brokerage
• Aggregation of flexibility providers
• Carbon capture technology and installation sales
• CO2 as a product sales
Key geographies • Mature markets • All • All • Mature markets • All
Market conditions • High electricity consumption and prices
• High levels of connectivity of appliances
• Smart meters
• Electricity price development of renewable electricity vs. alternatives
• Sustainability focus of end user
• Capability of distribution grids to integrate local renewables
• Electricity price development of renewable electricity vs. alternatives
• Capability of transmission and distribution grids to integrate renewables
• Fully liberalized electricity markets
• Dynamic time-based pricing
• Transparent and accessible balancing market
• Carbon intensive power plants and industries
• Suitable geographical conditions for CO2 storage
• CO2 demand from industry or agriculture
Fundamental disruption
• From energy volume-based revenue to energy reduction-/ services-based revenue
• Shift to independent distributed and off-grid solutions
• Shift in value from traditional to low-carbon generation value
• Shift of value from volume to flexibility and capacity
• Turning CO2 emissions from a liability into a resource* 62
Table 3. At a Glance: Five Sustainable Utility Business Model Pathways for the Future
34
* Subject to the type of carbon capture technology employed, and externalities such as local water scarcity.
35

Making the Move: Key Actions to Drive Transformation
36
37
For instance, while utilities in North America and Europe need to replace current power generation with cleaner alternatives, utilities in emerging markets such as China, India, and Africa must continue to support economic growth and meet increasing power demand with both replacement solutions and additional low-carbon power generation capacity. Utilities in Africa could leapfrog the fossil era entirely by directly implementing an intelligent and distributed low-carbon energy system from the start—much as the continent did in telephony by bypassing the installation of landlines and moving straight to mobile phones.
Despite these variables, however, there are several high-level actions that all utilities will need to consider as they begin their transformation toward a low-carbon energy system.
1. Take leadership and commitLow-carbon is here to stay. Thus, electric sector players should ensure that all levels of the organization not only are aware of the impending move toward a 2°C scenario, but also why the company’s competitive future depends on embracing low-carbon solutions.
Beyond cultivating internal awareness, utilities need to begin setting in motion what is necessary to make the transition. This includes basing investment planning and decision making on realistic and rising CO2 costs and setting long-term CO2 and renewables targets, starting at C-Level. It also includes determining how to effectively manage legacy and divestments and working with government to develop ambitious goals for ending fossil-fueled power generation altogether. 2. Keep optimizingWhile utilities should keep their eyes on the ultimate 2°C goal, in the near term they need to continue optimizing current operations to reduce CO2 emissions and free up funds for their business model transformation.
Key areas of immediate focus include boosting fuel efficiency in power plants (by, for example, lowering spinning reserve costs by using electricity storage); reducing grid losses and investments (by, for example, introducing enterprise asset management capabilities to improve both capital efficiency and operational efficiency); digitalizing retail processes to lower cost to serve and improve customer relationships; and building capabilities to optimize and balance across the value chain, using supply and user analytics as well as asset intelligence to manage variability and diversity on a tactical and strategic level.
3. Choose where to play and transformHistorically, business model innovation has not been at the heart of the traditional electric utility. That must change, as utilities are forced to reinvent their role in the value chain. To ease the transition, utilities should consider a two-pronged approach. First, develop low-carbon business models and strategies that build on their current capabilities and are tailored to local market conditions.
Second, establish new businesses in separate entities, independent of the existing ones, to help ensure they are developed quickly, with agility and entrepreneurial spirit. Such a hybrid model combines elements of traditional asset-intensive businesses with an increasing emphasis on revenue generation from services-oriented businesses based on low-carbon generation assets. In doing so, the model ensures stable revenues as, over time, the new businesses eventually takes over from the conventional ones.
Based on our analysis, the most effective transition approach begins with identifying the right business model(s), based on the value potential of each and the utility’s ability to capture that value.
From there, a utility should create a roadmap that will guide the transformation and begin building the new model. A utility also may find it valuable to build partnerships and ecosystems with other utilities, startups and companies in other industries to exchange knowledge, capabilities, and potentially funding.
4. Join forces to develop capital-intensive innovationsTo make both electricity storage and CCU economically viable and commercially implementable, large investments are needed. Thus, utilities should join forces (and budgets) globally—both within the energy sector as well as in other industries—to fund research, testing, piloting and scaling of technologies for electricity storage and carbon capture and use. Such joint efforts and partnership will be critical to marshaling the resources, time and expertise necessary to building and sustaining momentum and meeting the industry’s ambitious timeline.
As the previous chapters illustrate, electric utilities will face a common challenge in transforming their business for a 2°C world. But the specifics of that transformation—strategies, roadmaps and timelines—will vary depending on a utility’s current asset base, its role in the value chain, and its local market and regulatory environment.
Source: CDP, 2015. CDP Climate Change Information Request
51%
39%
of CDP utility respondents use an internal price on carbon and an additional 15 percent is anticipating doing so in the next two years
of CDP utility respondents provide a monetary incentive to their C-level executives for the management of climate change issues, including emissions reduction targets and efficiency targets
In the drive toward a low-carbon future, two things are clear: The world must move quickly and ambitiously to deal with greenhouse gas emissions that threaten both the planet and the global economy; and utilities are in many ways at the heart of that movement. Indeed, with 25 percent of carbon emissions globally generated by utility companies, the world simply will not be able to achieve its ambitious sustainability goals without an engaged, motivated, and effective power sector.
The good news is that utilities are well aware of the challenges of the energy transition. They also understand the business opportunities that arise as value shifts toward low-carbon solutions. Some leading utilities are already tapping into value pools by reshaping their companies around low-carbon business model pathways. As the success of these leaders grows, they will serve as inspiration for other utilities that are starting their own transformation.
The awareness of the challenge is there, as are the motivation and the path forward. Now utilities need to take action at scale and at speed.
38

39

Appendix Assessing the Value of Low-Carbon Business Model Pathways
40
Modelling scenariosThe value analysis compares a 2°C scenario against the current trajectory of CO2 emissions (business-as-usual).
In the 2°C scenario, CO2 emissions are 50% lower in 2030 because of:
• Additional measures in energy efficiency (3,584 TWh additional electricity saving in 2030),
• More low-carbon electricity generation (additional 3,232 TWh in 2030) displacing fossil-fuel generation,
• The application of carbon capture and storage at coal- and gas-fired power plants (covering 3157 TWh of fossil-fuel generation by 2030).
The 2°C scenario is based on scenarios from the IEA World Energy Outlook 2014*. It illustrates what it would take to achieve an energy trajectory consistent with limiting the long-term increase in average global temperature to 2°C.
This scenario assumes that a CO2 price is adopted globally in electricity generation and industry, at a level sufficiently to make investments in low-carbon solutions attractive. Wholesale electricity prices rise modestly between 2015 and 2030 in North America, from €44 to €57 per MWe, and in China from €57 to €73 per MWh, while prices in Europe increase to €101 per MWh in 2030.
Additionally, it assumes a phase-out of all fossil-fuel subsidies by 2035 and increased energy efficiency standards in buildings and transport.
In the electricity sector, capital investment has shifted towards renewables. The construction of coal-fired power plants is limited, but no accelerated closure of fossil fuel power plants are taken into consideration.
Assessing the costs and revenues for utilitiesThe value model calculates the costs and revenues for utilities in these scenarios, using projections of the costs of generating electricity for each technology (‘levelized costs of electricity’), and forecasts of prices of electricity and CO2, as reported by the IEA. These were applied to the future amount of electricity generation and the mix of technologies used to produce this, resulting in the overall costs of running the electricity system.
The total costs were distributed over utilities and other parties based on typical ownership shares per technology. Similarly, we derived the CO2 emissions by technology and by system actor using the current and projected CO2 emissions factors as reported by the Intergovern-mental Panel on Climate Change.
The assessment revenues uses projections of electricity and CO2 prices. These projections are an average of price projections for major geographies (US, EU, China, India, Brazil), weighted by total demand for electricity per geography.
Figure 12. Development of electricity sector CO2 emissions in the two scenarios
2010 2020 2030 204001
2
3
45
6
7
8
9
10
11
12
13
14
15
16
Global electricity sector CO2 emissions
Gt CO2e
-50%
• Energy efficiency
• Low-carbon electricity generation
• Carbon-capture & storage
2°C Scenario Business-as-usual Scenario
* The IEA New Policies Scenario is the basis for the Business-as-usual scenario, and the 2-degree scenario was based on the IEA 450 Scenario. For more details about the assumptions behind the scenarios, please refer to the IEA World Energy Outlook 2014, Chapter 1.
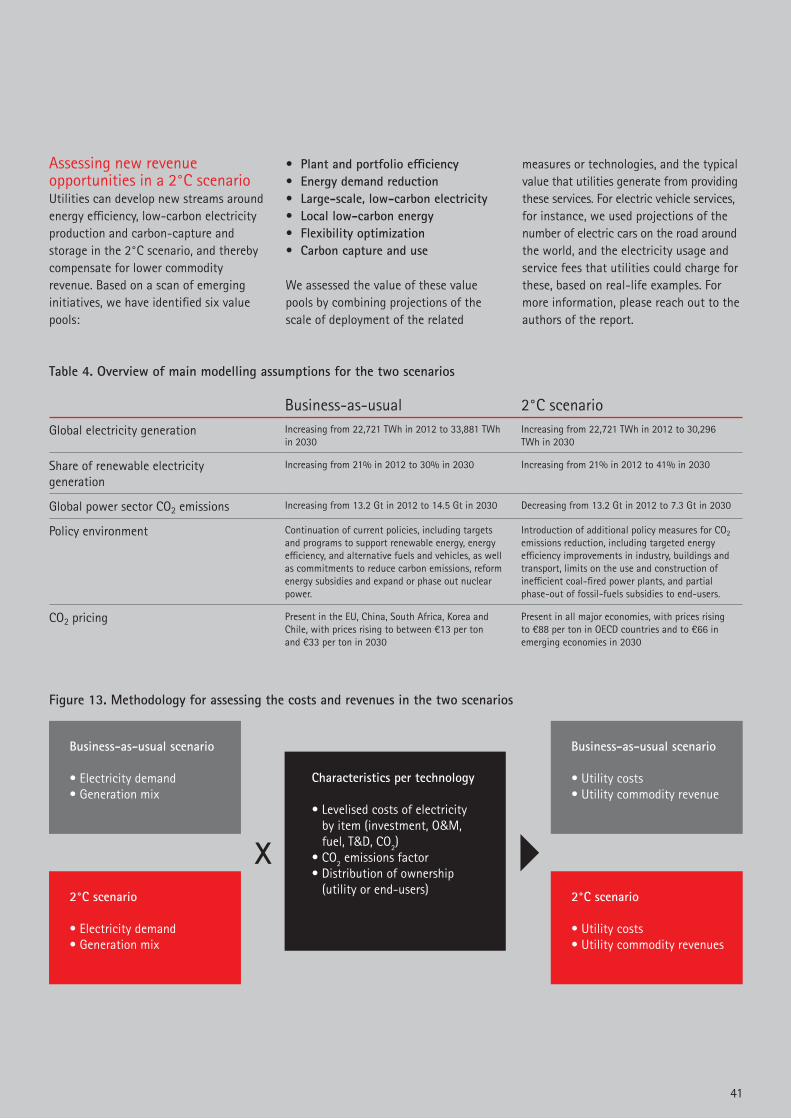
41
Business-as-usual 2°C scenarioGlobal electricity generation Increasing from 22,721 TWh in 2012 to 33,881 TWh
in 2030Increasing from 22,721 TWh in 2012 to 30,296 TWh in 2030
Share of renewable electricity generation
Increasing from 21% in 2012 to 30% in 2030 Increasing from 21% in 2012 to 41% in 2030
Global power sector CO2 emissions Increasing from 13.2 Gt in 2012 to 14.5 Gt in 2030 Decreasing from 13.2 Gt in 2012 to 7.3 Gt in 2030
Policy environment Continuation of current policies, including targets and programs to support renewable energy, energy efficiency, and alternative fuels and vehicles, as well as commitments to reduce carbon emissions, reform energy subsidies and expand or phase out nuclear power.
Introduction of additional policy measures for CO2 emissions reduction, including targeted energy efficiency improvements in industry, buildings and transport, limits on the use and construction of inefficient coal-fired power plants, and partial phase-out of fossil-fuels subsidies to end-users.
CO2 pricing Present in the EU, China, South Africa, Korea and Chile, with prices rising to between €13 per ton and €33 per ton in 2030
Present in all major economies, with prices rising to €88 per ton in OECD countries and to €66 in emerging economies in 2030
Table 4. Overview of main modelling assumptions for the two scenarios
Assessing new revenue opportunities in a 2°C scenarioUtilities can develop new streams around energy efficiency, low-carbon electricity production and carbon-capture and storage in the 2°C scenario, and thereby compensate for lower commodity revenue. Based on a scan of emerging initiatives, we have identified six value pools:
• Plant and portfolio efficiency• Energy demand reduction• Large-scale, low-carbon electricity• Local low-carbon energy• Flexibility optimization• Carbon capture and use
We assessed the value of these value pools by combining projections of the scale of deployment of the related
measures or technologies, and the typical value that utilities generate from providing these services. For electric vehicle services, for instance, we used projections of the number of electric cars on the road around the world, and the electricity usage and service fees that utilities could charge for these, based on real-life examples. For more information, please reach out to the authors of the report.
Figure 13. Methodology for assessing the costs and revenues in the two scenarios
Business-as-usual scenario
• Electricity demand• Generation mix
2°C scenario
• Electricity demand• Generation mix
2°C scenario
• Utility costs• Utility commodity revenues
Business-as-usual scenario
• Utility costs• Utility commodity revenue
Characteristics per technology
• Levelised costs of electricity by item (investment, O&M, fuel, T&D, CO2)• CO2 emissions factor• Distribution of ownership (utility or end-users)
References1 IPCC, 2014: Summary for Policymakers. In: Climate Change 2014: Mitigation of Climate Change. Contribution of Working Group
III to the Fifth Assessment Report of the Intergovernmental Panel on Climate Change [Edenhofer, O., R. Pichs-Madruga, Y. Sokona, E. Farahani, S. Kadner, K. Seyboth, A. Adler, I. Baum, S. Brunner, P. Eickemeier, B. Kriemann, J. Savolainen, S. Schlömer, C. von Stechow, T. Zwickel and J.C. Minx (eds.)]. Cambridge University Press, Cambridge, United Kingdom and New York, NY, USA.
2 IPCC, 2014: Climate Change 2014: Mitigation of Climate Change. Contribution of Working Group III to the Fifth Assessment Report of the Intergovernmental Panel on Climate Change.3 “World Energy Outlook 2014”, © OECD/IEA, 2014, http://www.worldenergyoutlook.org/.4 IPCC, 2014: Climate Change 2014: Mitigation of Climate Change. Contribution of Working Group III to the Fifth Assessment Report of the Intergovernmental Panel on Climate Change.5 Bloomberg Business, 2015. ‘Energy Mix To Shift Because Of Climate Pledges, IEA’S Birol Says’. http://www.bloomberg.com/ newsarticles/2015-07-14/energy-mix-to-shift-because-of-climate-pledges-iea-s-birol-says. 6 “World Energy Outlook 2014”, © OECD/IEA, 2014, http://www.worldenergyoutlook.org/.7 IPCC, 2014: Summary for Policymakers. In: Climate Change 2014: Mitigation of Climate Change. Contribution of Working Group
III to the Fifth Assessment Report of the Intergovernmental Panel on Climate Change [Edenhofer, O., R. Pichs-Madruga, Y. Sokona, E. Farahani, S. Kadner, K. Seyboth, A. Adler, I. Baum, S. Brunner, P. Eickemeier, B. Kriemann, J. Savolainen, S. Schlömer, C. von Stechow, T. Zwickel and J.C. Minx (eds.)]. Cambridge University Press, Cambridge, United Kingdom and New York, NY, USA.
8 “World Energy Outlook 2014”, © OECD/IEA, 2014, http://www.worldenergyoutlook.org/. 9 “World Energy Outlook 2014”, © OECD/IEA, 2014, p 298. http://www.worldenergyoutlook.org/.10 G8 Research Group, G20 Research Group, and University of Toronto, 2015. Delivering Sustainable Energy Access. Agenda Intelligence.11 CDP, 2015. Flicking the switch12 EIA, 2015. Energy Technology Perspectives 2015: Mobilising Innovation To Accelerate Climate Action.13 NRG, 2014. NRG Sustainability Report 201414 Enel Group, Enel Sustainability Report 201415 CDP, 2015. CDP 2015 Climate Change Information Request.16 European Commission, 2015. ‘Structural Reform Of The European Carbon Market—European Commission’. http://ec.europa.eu/ clima/policies/ets/reform/index_en.htm.17 Guardian, 2015. ‘China to launch national cap-and-trade plan in 2017, US announces’. http://www.theguardian.com/world/ 2015/sep/24/china-national-cap-and-trade-deal18 Based on an interview with an executive from Eskom (2015)19 Covenant of Mayors, 2015. ‘Covenant Of Mayors’. http://www.covenantofmayors.eu/about/covenant-of-mayors_en.html.20 NEA/IEA, 2015. Projected Costs Of Generating Electricity 2015. Paris: OECD Publishing.21 Bloomberg, 2015. ‘Fossil Fuels Just Lost the Race Against Renewables’. http://www.bloomberg.com/news/articles/2015-04-14/ fossil-fuels-just-lost-the-race-against-renewables 22 “World Energy Outlook 2014”, © OECD/IEA, 2014, http://www.worldenergyoutlook.org/.23 The Economist, 2014. ‘Devolving power’. http://www.economist.com/news/business/21598668-big-batteries-threaten- big-powerstations-and-utilities-profits-devolving-power.24 CDP, 2014. Power Generation Utilities: Navigating Global Water Risk25 “World Energy Outlook 2014”, © OECD/IEA, 2014, http://www.worldenergyoutlook.org/. 26 CDP, 2014. Power Generation Utilities Navigating Global Water Risk. Exhibit 2, page 3, https://www.cdp.net/Docs/ investor/2015/navigating-water-risk-excecutive-summary.pdf27 Based on an interview with executives from AES (2015)28 Accenture, 2015. The New Energy Consumer: Unleashing Business Value In A Digital World.29 Alliance for Rural Electrification, 2013. Best Practiced Of The Alliance For Rural Electrification. Third Edition. http://www.ruralelec.org/fileadmin/DATA/Documents/06_Publications/ARE_Best_Practises_2013_FINAL.pdf.30 There100.org, 2015. ‘The World Most Influential Companies Are Committing To 100% Renewable Power.’. http://there100.org/re100.31 Mars, 2014. Mars Moves Towards Carbon Neutral Operations With Massive Wind Farm That Will Provide Electricity From Renewable Sources Equal To Its Entire U.S. Operations. http://www.mars.com/global/press-center/press-list/ news-releases.aspx?SiteId=94&Id=5629.32 Bloomberg New Energy Finance, 2015.
42

43
33 World Energy Outlook 2014”, © OECD/IEA, 2014, http://www.worldenergyoutlook.org/34 Based on original figures of €15 billion to €18 billion from Koen Rademaekers, Jeroen van de Laan, Sil Boeve, Wietze Lise, and Christian Kirchsteiger, 2011. Investment Needs For Future Adaptation Measures In EU Nuclear Power Plants And Other Electricity Generation Technologies Due To Effects Of Climate Change. Brussels: European Commission. https://ec.europa.eu/energy/sites/ ener/files/documents/2011_03_eur24769-en.pdf. 35 Wendy S. Jaglom, James R. McFarland, Michelle F. Colley, Charlotte B. Mack, Boddu Venkatesh, Rawlings L. Miller, and Juanita Haydel et al. 2014. ‘Assessment Of Projected Temperature Impacts From Climate Change On The U.S. Electric Power Sector Using The Integrated Planning Model®’. Energy Policy 73: 524-539. doi:10.1016/j.enpol.2014.04.032. 36 EIA, 2015. Energy Technology Perspectives 2015: Mobilising Innovation To Accelerate Climate Action. 37 Based on an interview with an executive from Eskom (2015).38 Accenture, 2015. Power play: Three new models for growth in the utilities industry.39 Accenture, 2015. Power play: Three new models for growth in the utilities industry.40 Accenture, 2014. The New Energy Consumer: Architecting for the Future.41 Bloomberg, 2014. ‘ Direct Energy Partners with Nest to Bring Energy Savings Offers to Customers in North America’. http://www.bloomberg.com/bb/newsarchive/a2M6IOGPbKFo.html.42 Eneco, 2014. Eneco Annual Report 201443 Eneco, 2014. Eneco Annual Report 201444 Accenture and the National Business Initiative, 2015. Reimagining Africa’s future: The $350 billion opportunity for sustainable business.45 CBS, 2015. CBS: Sterke Groei Aandeel Hernieuwbare Energie.46 Based on an interview with an executive from Eskom (2015)47 Based on an interview with executives from SSE (2015)48 “World Energy Outlook 2014”, © OECD/IEA, 2014, http://www.worldenergyoutlook.org/.49 Xinhuanet, 2015. ‘China playing central role in nuclear power development: IAEA chief’. http://news.xinhuanet.com/
english/2015-09/15/c_134623759.50 SSE, 2015. SSE Annual Report 201451 SSE, 2015. SSE Annual Report 201452 Iberdrola, 2015. Iberdrola Annual Report 201453 CDP, 2015. Putting a price on risk: Carbon pricing in the corporate world.54 Accenture, 2014. Trends Toward A Digital Grid: A Year-Over-Year Review Of Utilities Executives’ Opinions. Accenture’s Digitally Enabled Grid Program. 55 Algae World News, 2015. ’Brown Panel: To Cut CO2 Emissions, Make It Profitable’. http://news.algaeworld.org/2015/01/ brown-panel-cut-co2-emissions-make-profitable/56 Based on an interview with an executive from Tata Power (2015)57 Parsons Binckerhoff, 2011. Accelerating the uptake of CCS: Industrial use of captured carbon dioxide. http://www.geos.ed.ac.uk/ ccs/Meetings/edinburgh-sep-2011/Smith_IPA_HW11.pdf58 NRG, 2014. Annual Report 2014.59 NRG, 2014. Annual Report 2014.60 CDP, 2015. Mind the science.61 NRG, 2014. Sustainability Report 2014.62 Global CCS Institute, 2015. How does carbon capture affect water consumption? https://www.globalccsinstitute.com/ insights/authors/guidomagneschi/2015/01/02/how-does-carbon-capture-affect-water-consumption; CDP, 2014 Power Generation Utilities Navigating Global Water Risk. Exhibit 2, page 3, https://www.cdp.net/Docs/investor/ 2015/navigating-water-risk-excecutive-summary.pdf

Copyright © 2015 Accenture All rights reserved.
Accenture, its logo, and High Performance Delivered are trademarks of Accenture.
Contact the authors:
Manon van [email protected]
Alexander [email protected]
Justin [email protected]
Additional contributors:
Joost Brinkman, Stephanie Bronchard, Jonathan A. Burton, Alexander Cramwinckel, Sytze Dijkstra, Pedro Faria, Michiel Frenaij, Sander van Ginkel, Ana Clara Gimenez, Kirsten Kramer, Esben Madsen, John K. Rhoads, Karina de Souza, Sergio Veth, Serge Younes, Roberto Zanchi
About AccentureAccenture is a global management consulting, technology services and outsourcing company, with more than 358,000 people serving clients in more than 120 countries. Combining unparalleled experience, comprehensive capabilities across all industries and business functions, and extensive research on the world’s most successful companies, Accenture collaborates with clients to help them become high-performance businesses and governments. The company generated net revenues of US$31.0 billion for the fiscal year ended Aug. 31, 2015. Its home page is www.accenture.com.
About Accenture StrategyAccenture Strategy operates at the intersection of business and technology. We bring together our capabilities in business, technology, operations and function strategy to help our clients envision and execute industry-specific strategies that support enterprise wide transformation. Our focus on issues related to digital disruption, competitiveness, global operating models, talent and leadership help drive both efficiencies and growth. For more information, follow @AccentureStrat or visit www.accenture.com/strategy.
About CDPCDP is an international not-for-profit providing the global disclosure system for companies to manage and share vital environmental information. CDP works with 822 institutional investors with assets of US$95 trillion, to motivate companies to disclose their environmental impacts and take action to reduce them. With more than 5,500 companies disclosing on climate change, forests and water through CDP in 2015, it holds the largest collection globally of primary natural capital information and puts these insights at the heart of strategic business, investment and policy decisions. Visit www.cdp.net to find out more.
AcknowledgementsList of contributing companiesClaudy dos Santos Jr (AES Tiete), Eduardo Brumer (AES Tiete), Patricia Byington (AES Serviços), Cristián Mosella (Colbun), Ron Wit (Eneco), Andrea Valcalda (ENEL SpA), Mandy Rambharos (ESKOM), Monica Oviedo (Iberdrola), Sang-Won Lee (KEPCO), Wee-Kyung Choi (KEPCO), Tae-Keun Kim (KEPCO), Candice Adams (NRG Energy), Laurel Peackock (NRG Energy), Lachlan Blackhall (Reposit Power), Rachel Turner (SSE), Justyn Smith (SSE), Alan Young (SSE), Danny Kennedy (Sungevity), Sanjay Neve (Tata Power Co), Aart van Veller (Vandebron)
Photographer Jeppe de Boer (Frontpage photo and page 36)
Join the conversation@AccentureStrat
This document makes descriptive reference to trademarks that may be owned by others. The use of such trademarks herein is not an assertion of ownership of such trademarks by Accenture and is not intended to represent or imply the existence of an association between Accenture and the lawful owners of such trademarks.