Embed Size (px)
Citation preview

Fernanda Magalhaes & Mario Duran Low carbon cities – Curitiba x Brasilia 45th ISOCARP Congress 2009
1
Low Carbon Cities: Curitiba and Brasilia
Fernanda Magalhậes Mario Durán-Ortiz
Inter-American Development Bank1
Introduction
This paper addresses the following general questions: what kind of consumption patterns (e.g., land, carbon footprint, traveling) are generated by the more compact and traditional structure of Curitiba vis-à-vis the modernist urban sprawl of Brasilia? What kind of urban and transport policies and actions can help these cities to become less resource and carbon intensive? What can city or metropolitan governments do to help cities achieve these goals? The paper will show how the carbon footprints of Curitiba and Brasilia—in regard to land use distribution and transportation—are reflected in their motorized and fuel consumption rates and will suggest what can be done in policy terms to improve the cities’ performances in terms of carbon and resource efficiency. The central premise is that the shape of a city affects its energy patterns and that there is a relationship between its urban form, block structure, size, density, and land use with its travel behavior, split transportation modes, and carbon footprint. City Shape, Densities, and Trip Patterns The consumption of land by public space, infrastructure, and houses is expressed by density (population per unit of land, number of dwellings per unit of land, or built-up area per unit of land). Those metrics are set up by local standards, ordinances and planning regulations, and often reflect unsustainable and inefficient patterns, such as unnecessary wide roads, excessive land saved for public use, low-built areas, high infrastructure runs, and maintenance costs. In general, it has often been assumed that the higher the density, the better the utilization of land and infrastructure. High densities provide public investment maximization and allow more efficient use of resources. Low densities, on the other hand, increase per capita cost of land, infrastructure, and services, and produce environments that reduce the degree of casual social interaction. Also, residents in these areas are forced to travel long distances to reach services such as education and health care. High densities mean a higher level of access for business, more productivity, and less energy and time consumption (Accioly, 1996). Some authors have suggested that the optimum infrastructure costs are maintained when the density is in the range of 250 to 1250 people per square mile; above or below that value, costs increase (Richardson and Gordon, 2000). Researchers have also argued that mixed-use high-density environments tend to be more egalitarian, which provides a better relative social equity position for the poor. Empirical evidence has shown a strong correlation between low urban density and high levels of automobile use and, hence, high levels of energy consumption (Newman and Kenworthy, 1986). Compact high-density cities appear as the most efficient of all urban forms, with 43 percent less fuel consumption than others forms of urban development; hence
1 The views and opinions expressed in this paper are those of the authors and do not necessarily
reflect the official position of the Inter-American Development Bank. The authors appreciate the support of Kenneth Kassin and Sarah Schineller in the technical revision of the paper.

Fernanda Magalhaes & Mario Duran Low carbon cities – Curitiba x Brasilia 45th ISOCARP Congress 2009
2
they have the lowest output of carbon dioxide emissions, due to greater use of public transport and reduced use of privately owned vehicles. A recent U.S. research (NRC, 2009) has shown that increasing the population and employment in U.S. metropolitan areas could reduce vehicle travel, energy use, and CO2 emissions from 1 to 11% by 2050. In cities, the higher the density, the higher the use of public transit (Bertaud and Richardson, 2004). But, an increase in density does not necessarily means less automobile dependence. The influence of urban form on trip generation and in traveling patterns appears to be crucial. There is little evidence that proves that increasing the densities of cities will have a great impact on automobile ownership. Automobile ownership levels and car dependency are influenced by many variables aside from urban form, such as cultural behavior, income, and the availability and efficiency of public transport availability, among others. The introduction of the automobile during the twentieth century changed the scale and the way mobility modes and trip patterns operate in cities. Preindustrial cities were generally compact—contained into a limited built-up area—, high density, monocentric, and confined to a walkable radius of between 2 (30 minutes) and 8 kilometers (2 hours), with trips oriented towards the urban center. The widespread automobile use and development of mass transportation—particularly trains—, has caused cities to expand beyond the walkable scale, enabling suburban growth. Urban centers have changed their structure to a larger scale becoming star-shaped with nodes—concentrated around the stations—that are interconnected by empty (often green) corridors or belts with occupation spread to 20 or 30 kilometers. Since this change, a hierarchy of centers has emerged, dominated by a main center where activities are clustered. Traveling patterns have acquired the same star shape with trips structured by the nodes and converging to the main pole that concentrates labor (or employment), consumption, and market activity (Bertaud, 2001). As certain cities have grown in size and population, with the advent of the automobile enabling for the first time large-scale urbanization and metropolization, the monocentric structure has evolved progressively into a polycentric shape. In those cities, trips are generated from all over the built-up area and trip originated activities are clustered in many poles spread over a wide area outside the main center; thus traveling patterns are random and normally longer. Their shape is dispersed into a wider area—spreading over 50 to 60 kilometers—with much lower densities and longer commuting distances, and trip patterns are largely dependent on the relative location of housing, employment, commerce, and other facilities. Ideally, as Newman (2006) suggests, based on Marchetti Constant (1994), journey-to-work trip time should be half an hour or less on average.
Fig. 1. Population densities in built up areas in cities and metropolitan areas
Source: Bertraud and Malpezzi (1999), and Bertraud (2003)

Fernanda Magalhaes & Mario Duran Low carbon cities – Curitiba x Brasilia 45th ISOCARP Congress 2009
3
For policy purposes aimed to increase public transportation use, the more dense, monocentric, and compact the city, the better. Larger, denser cities are easily served by mass transport—there is a minimum critical density threshold of 35 to 40 people/ha (or seven dwellings per acre) in which public transport is less viable (Newman and Kenworthy, 2006 and Holtzclaw, 2002). The key point is that density of people and buildings is necessary for the development of financially viable public transit. Yet, the last 50 years have shown a worldwide gradual drop in average densities and an increase in city sprawl and dispersion. This means that an additional effort has to be made to design appropriate measures for infrastructure networks and to counteract the effects of urban sprawl—an inefficient city shape might be guided in the long term to evolve into a more efficient one. Bertraud (2001) notes that in cities with the same density, similar trip patterns, and mono or polycentric structures; the shape is a more critical factor for time and cost than density. In those cases, it is the degree of dispersion, distance, and distribution of activity poles that matters for trip patterns since flows—generated by people when they go from their houses to any other places (for work, education, shopping, leisure, or any other activity)—are strongly influenced by urban form and land use. In the United States, only 50 percent of trips are due to job commuting. Thus, urban configuration, land use, and city shape have a fundamental impact on movement patterns, emerging as the most important factor in determining travel behavior. Also, some transit modes work better when matched with specific spatial structures. Rail mass transit, trains, light rail, bus rapid transit, and metro are easy to operate in monocentric structures, while buses are the only mode that will serve polycentric structures where jobs and activities are dispersed throughout the metropolitan areas (Bertraud and Richardson, 2004). Trip lengths expressed in terms of their time (highly depending on travel speed), costs, and fuel consumption have pervasive impacts on the economies of cities and their carbon footprint. Large ecological footprints, dispersion of activities and people (and other urban amenities)—expressed by land use intensity and built-up density—, and automobile dependence have been tied together and strongly impact city life. The need for parking spaces has also had a pervasive effect on urban quality, as huge areas in central locations have been dedicated to satisfying it. As cities grow larger, an increase in the tendency towards polycentric structures worldwide continues to undermine expansion of public transit use and expand automobile reliance. The way density (of people and activities) is spatially distributed within a city or urban area can be much more important for its energy performance and CO2 emissions than the density itself (i.e., density increase or decrease from city centers and their effect on lengthening or
Fig. 2. Population Density distribution in Cities
Source: Bertraud (2003)
Fernanda Magalhaes & Mario Duran Low carbon cities – Curitiba x Brasilia 45th ISOCARP Congress 2009
4
shortening trips). Research data for the United Kingdom and the United States reveals that daily trip distances decline with higher densities (Giuliano and Narayan, 2000).
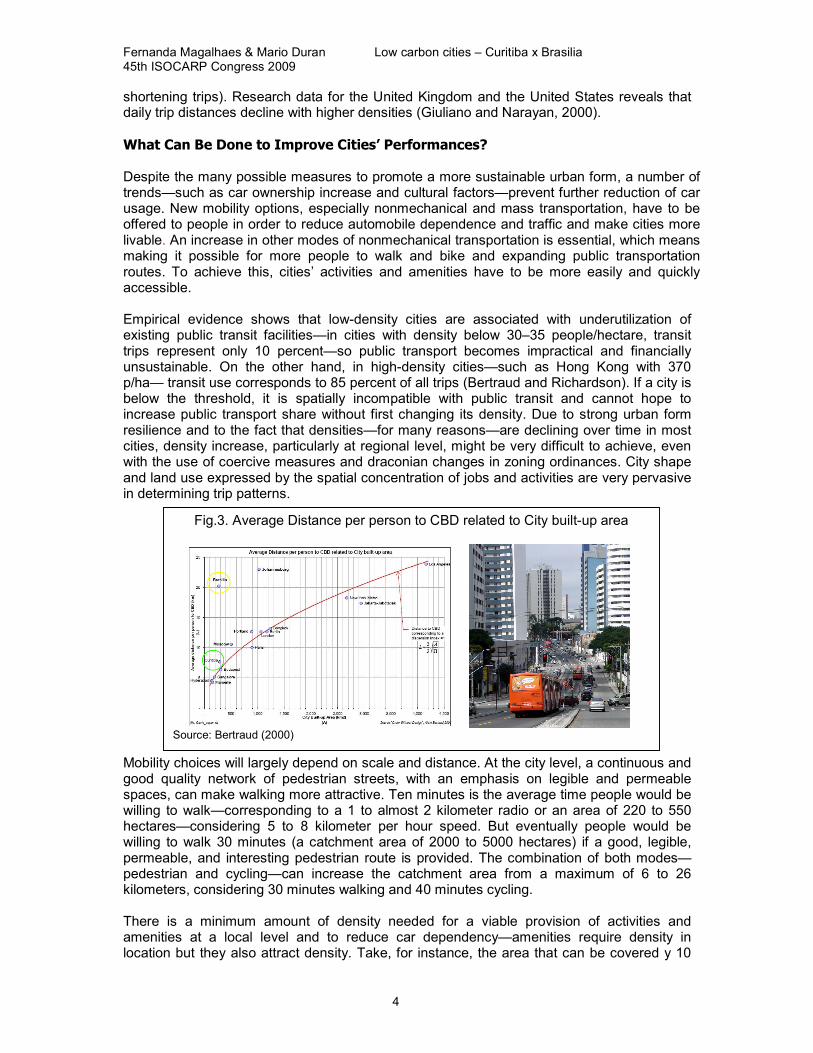
What Can Be Done to Improve Cities’ Performances? Despite the many possible measures to promote a more sustainable urban form, a number of trends—such as car ownership increase and cultural factors—prevent further reduction of car usage. New mobility options, especially nonmechanical and mass transportation, have to be offered to people in order to reduce automobile dependence and traffic and make cities more livable. An increase in other modes of nonmechanical transportation is essential, which means making it possible for more people to walk and bike and expanding public transportation routes. To achieve this, cities’ activities and amenities have to be more easily and quickly accessible. Empirical evidence shows that low-density cities are associated with underutilization of existing public transit facilities—in cities with density below 30–35 people/hectare, transit trips represent only 10 percent—so public transport becomes impractical and financially unsustainable. On the other hand, in high-density cities—such as Hong Kong with 370 p/ha— transit use corresponds to 85 percent of all trips (Bertraud and Richardson). If a city is below the threshold, it is spatially incompatible with public transit and cannot hope to increase public transport share without first changing its density. Due to strong urban form resilience and to the fact that densities—for many reasons—are declining over time in most cities, density increase, particularly at regional level, might be very difficult to achieve, even with the use of coercive measures and draconian changes in zoning ordinances. City shape and land use expressed by the spatial concentration of jobs and activities are very pervasive in determining trip patterns. Mobility choices will largely depend on scale and distance. At the city level, a continuous and good quality network of pedestrian streets, with an emphasis on legible and permeable spaces, can make walking more attractive. Ten minutes is the average time people would be willing to walk—corresponding to a 1 to almost 2 kilometer radio or an area of 220 to 550 hectares—considering 5 to 8 kilometer per hour speed. But eventually people would be willing to walk 30 minutes (a catchment area of 2000 to 5000 hectares) if a good, legible, permeable, and interesting pedestrian route is provided. The combination of both modes—pedestrian and cycling—can increase the catchment area from a maximum of 6 to 26 kilometers, considering 30 minutes walking and 40 minutes cycling. There is a minimum amount of density needed for a viable provision of activities and amenities at a local level and to reduce car dependency—amenities require density in location but they also attract density. Take, for instance, the area that can be covered y 10
Fig.3. Average Distance per person to CBD related to City built-up area
Source: Bertraud (2000)

Fernanda Magalhaes & Mario Duran Low carbon cities – Curitiba x Brasilia 45th ISOCARP Congress 2009
5
minutes walk (equivalent to around 300 hectares) and a minimum density of 35 jobs per hectare: for transit to be viable, this will require a population of at least 10,000. On a regional scale, considering an area that can be covered with 30 minutes of walking, this population can reach around 100,000 (Newman, 2006). The same applies to cycle routes. Brasilia and Curitiba: City Shape, Trip Patterns, and Energy Footprint Brasilia presents one of the best examples of modernist urban structures—a model based on the CIAM (International Congress of Modern Architecture) principles—, with low densities, large areas dedicated to open public or semi-public spaces, segregated land uses, social and spatial stratification, and suburban developments of satellite towns isolated by a green 20 to 30 kilometer-wide belt. The city itself (Pilot Plan) has been conceived as a collection of enclosed cul-de-sac neighborhood cells—the superblocks, which contain all the basic amenities (schools, sport facilities, and religious buildings) and commerce—interconnected in pairs through a local street string with a sole entrance to each unit. Buildings occupy only 10 percent of the plot. This has generated a very fragmented street and pedestrian network. Each of those units was conceived to be self-sufficient, with no need for residents to leave their cell for everyday routine activities. Administrative buildings and employment were functionally segregated and located in cells close to the geometric center of the city—the monumental axis. The city macrostructure layout, in the shape of an airplane, is formed by two perpendicular axis—the monumental axis (vertical) and the transportation axis (horizontal). Institutional buildings are located in the cockpit and the residential areas are in the wings. The bus terminal is at the geometric center in the junction of the main city axis. This junction defines
the city core and symbolizes the absolute prevalence of the private car in structuring the city shape, epitomized as the country modernity triumph. The 120 superblocks are aligned along the horizontal axis but they do not have direct connection to it. Each wing of the horizontal axis measures around 6 kilometers and superblock exits are at each 500 meters through the commercial strips. Each superblock—with approximately 250mx250m of space—accommodates from 2,500 to 3,000 people with a net density of 400/600 p/ha but a gross residential density of only 14 p/ha. The city was designed to support a limited number of people (500,000). The city expansion was designed as a reproduction of this same polycentric structure. A number of satellite towns have been spread around, separated by a green belt, over 20 kilometers away from Brasilia. The purpose of this belt is to preserve the city integrity, isolating the Pilot Plan from its hinterland. Each town is in itself a cell connected to a highway, forming a very fragmented and discontinuous system. Jobs and facilities are all concentrated in the Brasilia Pilot Plan, which comprises around 70 percent of all employment, but only 10 percent of the population.
The population of the city with its metropolitan hinterland is approximately 2.5 million people; 80 percent live outside the monumental area (the Pilot Plan) in the 12 suburban
Fig.4. Brasilia’s superblock

Fernanda Magalhaes & Mario Duran Low carbon cities – Curitiba x Brasilia 45th ISOCARP Congress 2009
6
satellite towns (or 16 administrative regions that form the Federal District). An estimated 200,000 live in the monumental city. Brasilia shows also a remarkable concentration of income. The Pilot Plan has the highest country income per capita but the periphery is dominated by poor families. The richest administrative region income is 15.4 times higher than the poorest. Densities are very low—23 p/ha for the metropolitan area and around 50 p/ha in the Pilot Plan. However, the density distribution is very uneven—between the richest and the poorest neighborhoods (Lago sul and norte) it varies from 5 p/ha to over 250 p/ha (Paranoa). Brasilia is also the most dispersed city of Brazil (Holanda in Villaescuza, 2006). In the 48 cities worldwide surveyed by Bertraud and Malpezzi (1999) the city ranks second in terms of dispersion. With more than twice the density of Los Angeles, it is three times more dispersed. It is also the most spatially fragmented city among 37 surveyed in Brazil (Ojima, 2007). In Brasilia, the average distance per person to the center is 10 percent higher than in metropolitan New York, but the built-up area is 10 times smaller. Contrary to the norm, higher densities in Brasilia are at the periphery, in the downtown centers of some of the satellite towns (Bertraud, 2001). This gives a measure of the city shape diseconomy. Although there is no numeric evidence for trip patterns by the description above, it is clear that Brasilia city shape and density characteristics have a profound influence on traveling patterns—both by individual cars and public transit—resulting in long distances and an illogical, discontinuous chicaned pattern with very low carbon and energy efficiency levels. The city is also very expensive, with high costs of land, infrastructure, and maintenance due to restrictions on the land delivery system, spatial structure, and amount and spread of open public spaces allocated to green areas, roads, residual spaces, parks, and parking. Despite the generosity in green and open spaces, it is not very easy to walk or cycle given the fragmentation and bad quality on these networks and the inexistence of dedicated spaces.
Fig.6. Density and dispersion in Metropolitan Brasilia
Source: Holanda in Villaescusa (2006)
Fig.5. Population and employment distribution, Brasilia, Federal District
Source: SEDUH (2004)

Fernanda Magalhaes & Mario Duran Low carbon cities – Curitiba x Brasilia 45th ISOCARP Congress 2009
7
Like Brasilia, but to a lesser degree, Curitiba is also a city shaped by urban ideology and utopia (Bertraud, 2001). Planners have conceived the city in such a way that urban form results in a pre-established pattern—a combination of land use zoning/regulation and transport transit planning—with three high-density corridors running from the center to the periphery to optimize bus transport circulation. These corridors define a monocentric structure concentrating jobs and establishing a density gradient. A clever mechanism allows property owners in low-density areas near the corridors to trade vertical development rights with developers who want to build areas of higher density in the transport corridor. Low-income high-density housing was built at the edge of the corridors.
In terms of density distribution patterns, Bertraud (2001) reveals that due to the land market effect, higher densities are pushed to the edge of the corridors, resulting in a city where trips are much longer than they would have been if land use was not so strongly controlled and density gradients were solely free market shaped—decreasing from center to periphery.
Curitiba has a population and a density similar to Brasilia (around 2.5 million in the metropolitan area and 57 p/ha). It is much more compact and has a grid shape, with much higher density along the BRT (Bus Rapid Transit) corridors. In comparing density profiles and average distance per person to CBD (Central Business District) related to build-up area, Bertraud (2001) shows that both cities have an erratic profile but the distance to downtown in Curitiba is three times lower than in Brasilia, not exceeding 7.5 kilometers. In a comparison of 48 cities in the world, Brasilia only loses to Johannesburg in average distance to CBD. Suburbian cities in Curitiba are located at the immediate edge of the city, forming a ring around it. Less dispersion and shorter distances to CBD result in much smaller networks and shorter trips, and a much more efficient city.
Fig.7. Density gradient in Curitiba
Source: Bertraud (2002)

Fernanda Magalhaes & Mario Duran Low carbon cities – Curitiba x Brasilia 45th ISOCARP Congress 2009
8
An analysis of the fuel consumption data for the light vehicle fleet from the two metropolitan areas provides empirical evidence to the trends observed in carbon emissions due to the urban form.2 Curitiba and the seven municipalities in conurbation have a motorization level that is 21.3 percent higher than the Federal District (FD, metropolitan Brasilia); however, metropolitan Brasilia consumes 24 percent more gasoline and ethanol than the Curitiba metropolitan area which implies that on average, light vehicles in Brasilia travel longer distances than in the Curitiba area. Despite the higher car ownership of its residents, and as a result of the shorter trip distances, a higher ethanol consumption, and more transit ridership, the metropolitan Curitiba area has an annual average carbon dioxide emission (CO2) of 4.2 ton per light vehicle while Brasilia emits 6.2 tons per light vehicle, which means than the more sprawled FD emits 46 percent more CO2 emissions than denser more transit oriented Curitiba area, and 55 percent more than the city of Curitiba. These results illustrate how spatial attributes in metropolitan Brasilia translate into much higher carbon intensity rates due to more auto travel than Curitiba and surrounding municipalities.
Table 1. Comparative fuel consumption and light vehicles carbon footprint for Curitiba and Brasilia
Variable Year Units FD
(BRASILIA)
CURITIBA CITY
METRO
CURITIBA + 7
Population 2008 inhabitants 2,557,158 1,828,092 2,861,750
Total motor vehicle fleet
2008 vehicles 1,029,277 1,109,511 1,397,126
Light vehicle fleet 2007 vehicles 832,637 850,760 1,079,101
∆ to FD ∆ to FD
Motorization index 2008 Vehicles per 1,000
inhabitants 402.51 606.92 51% 488.21 21%
Market share
Market share
Market share
Yearly sales Gasoline C (E25)
2007 liters 731,690,263 64% 474,626,905 51% 630,916,650 40%
Yearly sales Ethanol (E100)
2007 liters 150,221,381 13% 169,231,359 18 % 290,679,523 18%
Yearly sales diesel fuel
(6)
2007 liters 268,889,118 23% 290,416,975 31% 657,452,512 42%
Total consumption gasoline market
2007 liters 881,911,644 643,858,264 921,596,173
∆ to FD ∆ to FD
Average fuel Consumption
gasoline market 2007
Liters per vehicles
1,059.18 756.80 40 % 854.04 24 %
Total CO2 emissions from
light vehicle fleet
(6)(7)(8)
2007 Kg 5,122.322.409 3,385,879,088 4,558,649,533
∆ to FD ∆ to FD
Annual average CO2 emissions
from light vehicles 2007
Metric Ton CO2 per vehicle
6.15 3.98 55 % 4.22 46 %

Fernanda Magalhaes & Mario Duran Low carbon cities – Curitiba x Brasilia 45th ISOCARP Congress 2009
9
Conclusions Based on Brasilia’s small capillarity of road patterns and fabric structure, its land use concentration, its circulation specialization, its fragmented metropolitan spatial structure, and its density dispersion, it is not able to operate efficiently in terms of traveling and mobility mode patterns. Thus, the current system is inefficient and unsustainable and reduces social cohesion and city vitality. The centrality of the core city is in itself compromised and reduced to an interchange station of origins and destinations regulated by the daily labor routine and people have no place to gather and socialize outside of shopping malls. The heart of the city is the bus terminal. On the other hand in Curitiba, spatial structure, urban characteristics, and public transportation are much more inductive to reduce automobile use and they generate a more efficient traveling behavior, a lower carbon footprint, and more efficient resource use. Any measure guided to improve energy efficiency and its directly related carbon footprint of those cities has to be appropriate to their specific contexts. Urban strategies could include measures to decentralize employment and activities; improve accessibility to amenities and services; increase density in transport corridors; increase continuity, capillarity, logic, and quality of pedestrian pathways and bicycle routes; improve integration of mobility modes; reduce dispersal of metropolitan arrangement; reduce the need for traveling by introducing changes in land uses; and improve density patterns to create more opportunities for social interaction. Any improvement in the efficiency and effectiveness of public transport in Brasilia, however, is highly dependent on significant mid- and long-term land use changes. In order to reduce Brasilia’s carbon footprint in the short term, some mitigation measures should include policies to incentivize more widespread use of clean fuels (such as sugarcane ethanol and vehicular natural gas) and the use of more clean and advanced vehicles (such as clean diesel, electric hybrids, hybrids plug-ins, flex-fuel electric hybrids and plug-ins, and electric vehicles), including its introduction in the public transport fleets. It is possible to implement a large proportion of those measures at the local or metropolitan level.

Fernanda Magalhaes & Mario Duran Low carbon cities – Curitiba x Brasilia 45th ISOCARP Congress 2009
10
Content Notes 1. The term “automobile dependence” was used by Newman and Kenworthy (1989) to describe settlements that as a result of land use and transport policies are dominated by automobile use. 2. City dispersion (dispersion index) is a city shape measure proposed by Bertaud (2001) that captures the relation between built-up area and population density (average distance per person to CBD or center of gravity) and allows city shape comparisons. For a given a built-up city area, the shorter the trips to activity centers the better the performance. The index reveals the importance of city shape for trip patterns. 3. A comparison of built-up urban density (Bertraud and Richardson, 2004) for the Barcelona metropolitan area and Atlanta have shown that the first is 28 times larger than the second (171 p/ha compared to 6p/ha). This means that the area covered by public transport in the second is 28 times bigger for the same population. This explains why Atlanta’s share of public transport is only 4.5 percent, while in Barcelona it is 30 percent. 4. The Marchetti Constant (Newman, 2006) shows how cities historically have functioned on with an average of one hour per day travel time. 5. Holtzclaw (1990) shows that the required threshold density varies according to transport mode—30 p/ha for bus, 35 p/ha for light rail, and 50 p/ha for metro. 6. Diesel-powered vehicles were not included in the estimation because there is no disaggregate data available to differentiate fuel consumption between public and commercial transport vehicles associated with land use patterns, but the latter mainly reflects the economic dynamism of each region, and therefore, it is not of interest for this analysis. 7. Calculations were made based on an assumption of CO2 emissions of 8.8 kg per gallon as
estimated by US EPA (2005), which assumes 2,421 grams of carbon content per gallon of gasoline without considering the impact of fuel additives such as ethanol or methyl tertiary-butyl ether (MTBE). 8. Calculation for ethanol considered that Brazilian sugarcane ethanol emits 90 percent less CO2 than pure gasoline according to Macedo et al (2004) and Goldemberg (2008), and our estimation considers than all Brazilian gasoline C is blended with 25 percent ethanol (E25). Estimates do not include any potential carbon emissions due to indirect land use change (ILUC) effects.
Fernanda Magalhậes Mario Durán-Ortiz Inter-American Development Bank
Fernanda Magalhaes & Mario Duran Low carbon cities – Curitiba x Brasilia 45th ISOCARP Congress 2009
11
References Accioly, Claudio (1996). Density in Urban Development. Building Issues (8), Lund Centre for Habitat Survey. Lund. Agencia Nacional de Petróleo, Gás natural e Biocombustiveis, Brasil. Amancio, Macedo and Penha, Suely (2008). The Urban Form and Foot Travel. Acta Sicentiarum Technology. Anuario Estado do Parana, 2007/2008. Governo do Estado do Parana, Parana, Brasil Bertraud, Alain (2003). A Measure of Spatial Organization of 7 Large Cities. (unpublished paper) Bertraud, Alain (2001). The Costs of Utopia: Brasilia, Johannesburg, and Moscow. (unpublished paper) Bertraud, Alain and Stephen Malpezzi (1999). The Spatial Distribution of Population in 35 World Cities: The Role of Markets, Planning and Topograph. The Centre for Urban Land and Economic Research, University of Wisconsin, Wisconsin. Bertraud, Alain (2002). Note on Transportation and Urban Spatial Structure, Washington, ABCDE Conference. Bertraud, A and Richardson W (2004). Transit and Density: Atlanta, the United States and Western Europe, in Urban Sprawl in Western Europe and the United Sates, Urban Planning and Environment, Ashgate. SEDUH, Governo do Distrito Federal (2004). Study on the Urban Land Market of the Federal District and its Surrounding Areas. Washington DC, Cities Alliance. Giuliano G. Hu,H-H. and Narayan, D. (2000). Another Look at Travel Patterns and Urban Form: The US and Great Britain. International Travel Project, University of Southern California, Los Angeles. Goldemberg, Jose (2008). The Brazilian Biofuels Industry. Biotechnology for Biofuels 1(6). Gordon, Peter and Richardson, Harry, (2000).Transportation and Land Use, University of Southern California. Holtzclaw J., Clear R., Dittmar H., Goldstein D., and Haas P. (2002). Location Efficiency: neighborhood socio-economic characteristics determine auto ownership and use: studies in Chicago, Los Angeles and San Francisco. ransportation Planning and Technology, 25 (1): 1–27. March. Lucio, Costa (1987). Brasilia Revisitada, Diario Oficial DF, Decreto n 10829, October 14. Marchetti,C. (1994). Anthropological Invariants in Travel Behaviour. Technical Forecasting and Social Change, 47 (1). Newman, Peter and Kenworthy, Neighbourhood and Socio-Economic Characteristics

Fernanda Magalhaes & Mario Duran Low carbon cities – Curitiba x Brasilia 45th ISOCARP Congress 2009
12
Determine Auto Ownership and Use – Studies in Chicago, Los Angeles and San Francisco, Transportation Planning and Technology, 25 (1): 1–27. January. Newman, Peter and Kenworthy, John (2006). Urban Design to Reduce Automobile Dependance. Opolis 2(1) Winter. Newman, Peter (1999). Sustainability in Cities: Overcoming Automobile Dependance. Washington, DC: Island Press. Macedo Isaias, M. Lima Verde Leal and J. Azevedo Ramos da Silva (2004). Assessment of greenhouse gas emissions in the production and use of fuel ethanol in Brazil. Secretariat of the Environment, Government of the State of São Paulo, Brazil. Marshall, Stephen and Banister, David, Travel Reduction Strategies: Intention and Outcomes. University College of London (unpublished paper). Mike, Jenks and Burguess, Rod (2000). Compact Cities: Sustainable Urban Forms for Developing Countries. London: Spoon Press. National Research Council of the National Academies (2009) Driving and the Built Environment: The Effects of Compact Development on Motorized Travel, Energy Use, and CO2 Emissions. Transportation Research Board Special Report 298. Washington, D.C. Ojima, Ricardo (2007). Dimensões da urbanização dispersa e proposta metodológica para estudos comparativos: uma abordagem socioespacial em aglomerações urbanas brasileiras. Revista Brasileira de Estudos da População, Sao Paulo, v. 24, p. 277-300., Richardson, Harry W. (1988). Monocentric versus Polycentric Modes: The Future of Urban Economics in Regional Science. Annals of Regional Science 22. Williams, Kate; Jenks, Michael and Burton, Elizabeth. (2000), Achieving Sustainable Urban Form. London: Spoon Press. US Environmental Protection Industry, Office of Transportation and Air Quality (2005). Average Carbon Dioxide Emissions Resulting from Gasoline and Diesel Fuel, Emission Facts. Villaescusa, Eduardo and Rodriguez, Cibele (2006). Brasília 1956–2006: de La fundacion de una ciudad capital, al capital de la ciudad. LLeida:Editorial Milenio.