Embed Size (px)
Citation preview

Low and Mixed Dose Jar Test Study to Evaluate Alum Treatment at Maximum Flow
on the Catskill Aqueduct
By Nicholas Prokopowicz

2
Presentation Overview
• Background of NYC Water Supply System
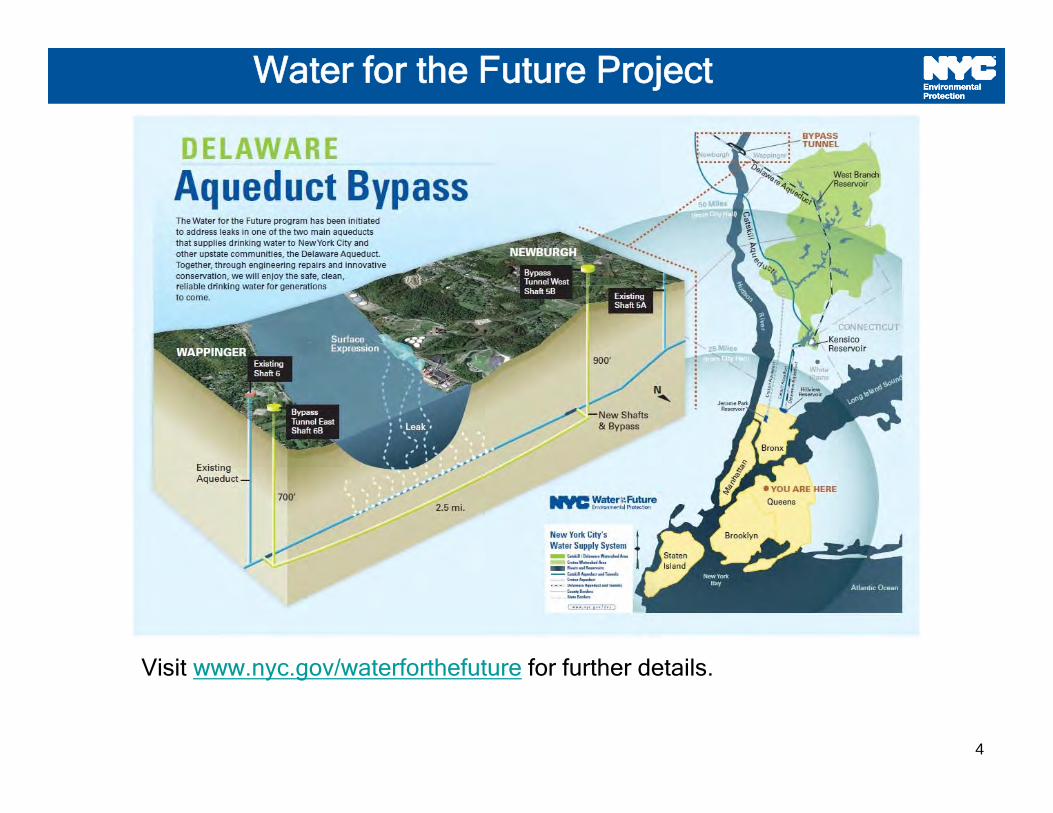
• Summary of Water for the Future Project
• History of Alum Treatment
• Overview of Study
• Conclusion

3
3
NYC water travels up to 125 miles from its upstate
watershed source before reaching the faucets of 9
million downstate consumers.
NYC Water Supply System
4
Visit www.nyc.gov/waterforthefuture for further details.
Water for the Future Project
5
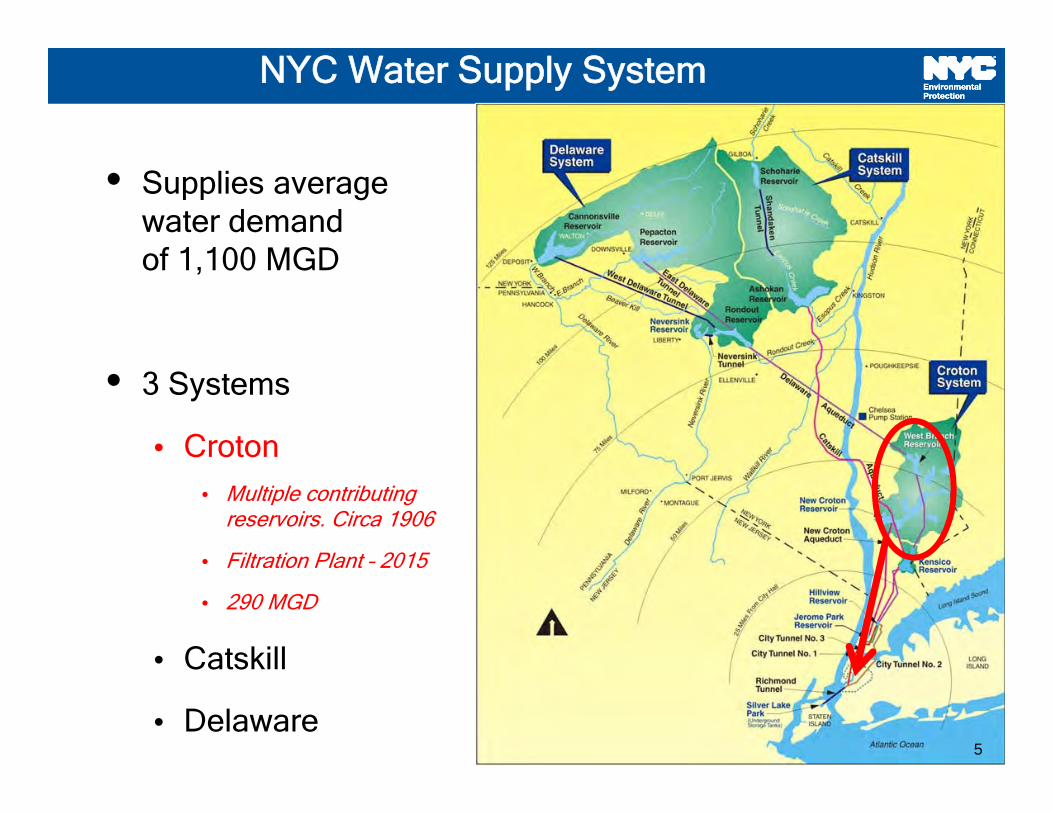
• Supplies average water demand of 1,100 MGD (Million Gallons per Day)
• 3 Systems
• Croton
• Catskill
• Delaware
• Supplies average water demand of 1,100 MGD
• 3 Systems
• Croton• Multiple contributing
reservoirs. Circa 1906
• Filtration Plant – 2015
• 290 MGD
• Catskill
• Delaware
NYC Water Supply System
5

6
• Supplies average water demand of 1,100 MGD
• 3 Systems
• Croton
• Catskill
• Delaware• Pepacton, Neversink,
Cannonsville and Rondout Reservoirs. Circa 1944
• 820 MGD
NYC Water Supply System
Rondout-West Branch (RWB) Tunnel
• Losing 15-35 MGD• Bypass repairs slated
for 2021• 5-8 months shutdown
for connection6
7
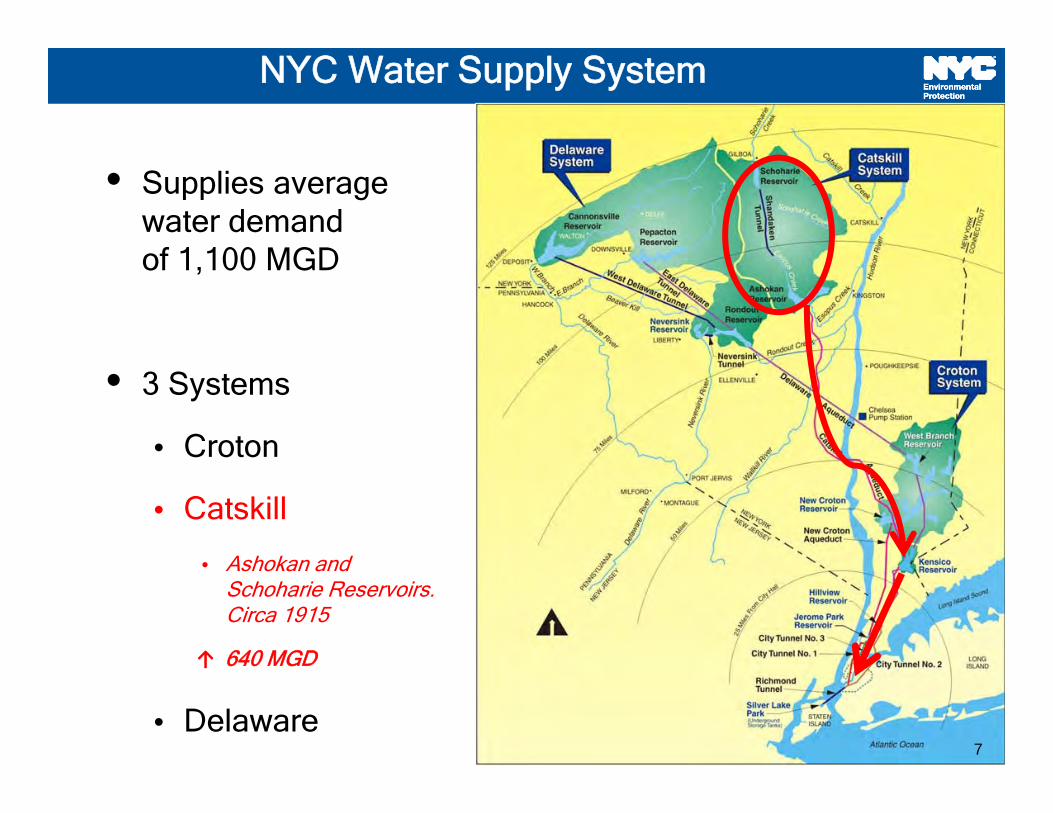
• Supplies average water demand of 1,100 MGD
• 3 Systems
• Croton
• Catskill
• Ashokan and Schoharie Reservoirs. Circa 1915
• 590 MGD
• Delaware
NYC Water Supply System
↑ 640 MGD
7
8
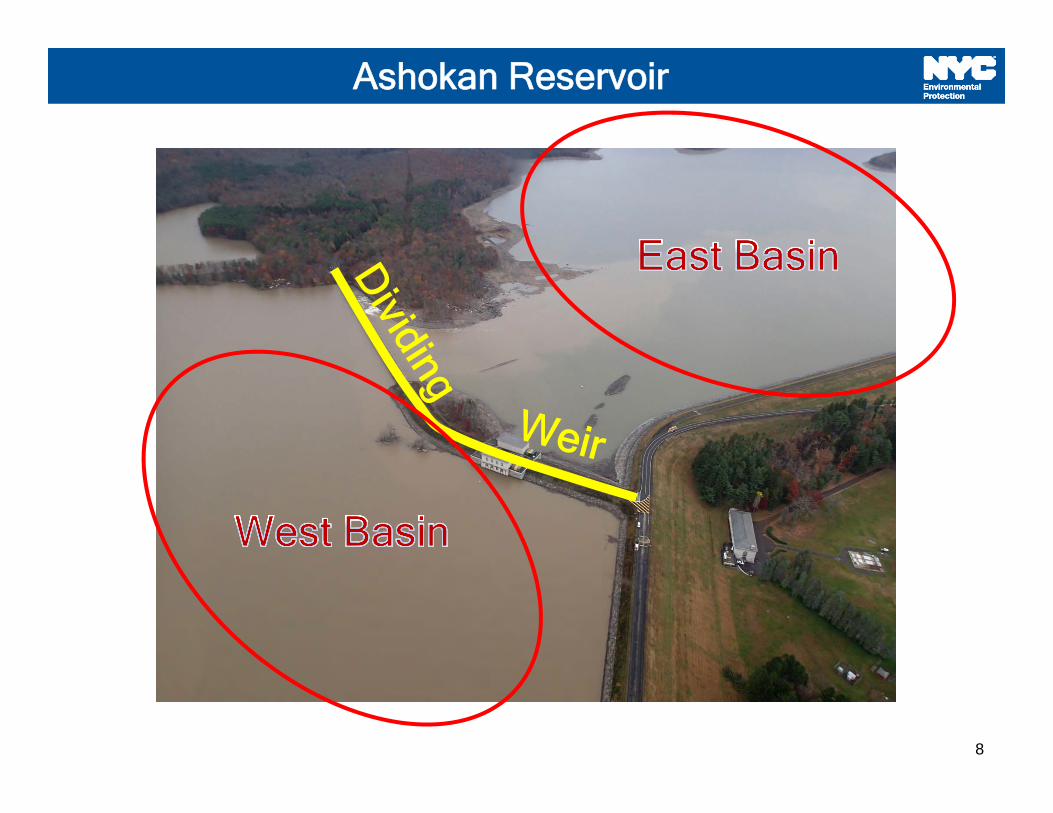
Ashokan Reservoir

9
Tropical Storm Tammy 2005
October 7-8, 2005 during Tropical Storm Tammy
• >6 inches of precipitation fell
• 32 NTU water spilled at the Dividing Weir
• 18 NTU water entered the Aqueduct
• Alum treatment began on October 13, 2005
• Treatment was administered for 180 days
• Treatment continued until May 24, 2006
Retrieved from – Alum Post-Treatment Report Water Quality and System Operations Catskill Water Supply, September 2006

10
Tropical Storms Irene and Lee 2011
August 28, 2011 Hurricane Irene weakened to a tropical storm and passed over New York City
• Path passed directly over the NYC Water Supply watersheds
• Catastrophic flooding damage occurred to many watershed communities
• Resulting turbidity reached 75 NTU entering the aqueduct
• Alum treatment began August 29, 2011
Retrieved from – Alum Treatment After Action Report, July 2012
11
Tropical Storms Irene and Lee 2011
Retrieved from – Alum Treatment After Action Report, July 2012
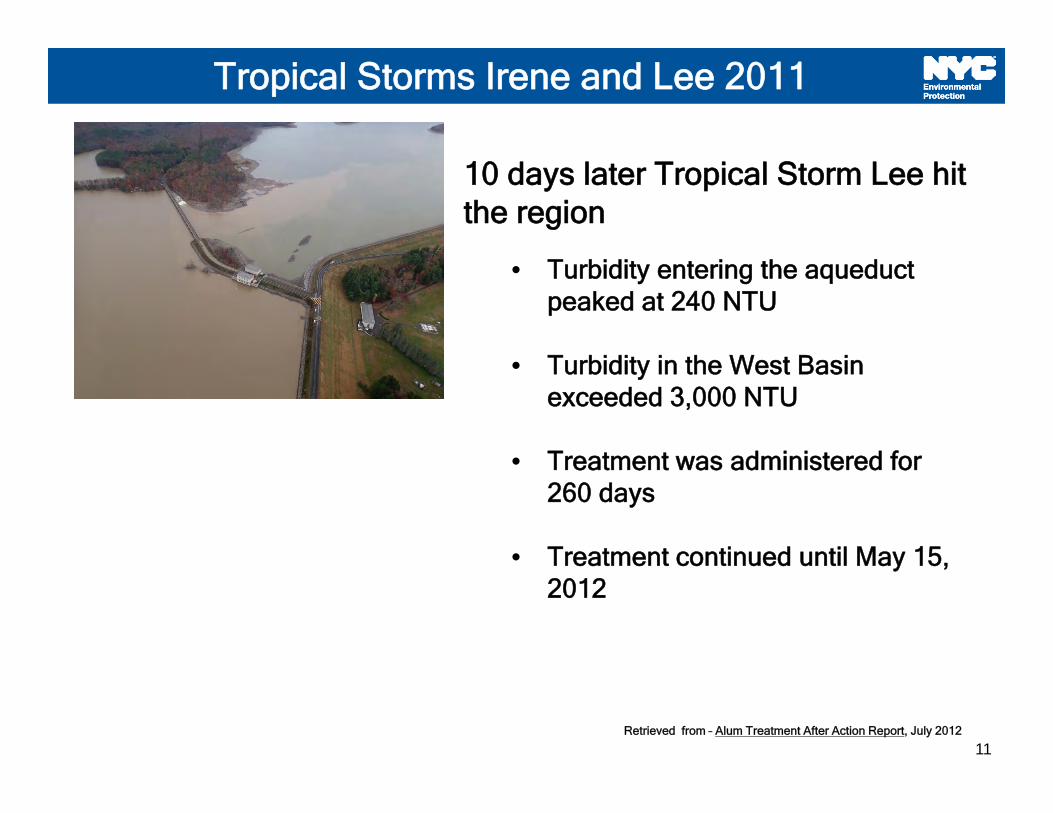
10 days later Tropical Storm Lee hit the region
• Turbidity entering the aqueduct peaked at 240 NTU
• Turbidity in the West Basin exceeded 3,000 NTU
• Treatment was administered for 260 days
• Treatment continued until May 15, 2012

12
Catskill Alum Plant
19172014

13
Previous Jar Test Results
0
10
20
30
40
50
60
70
80
90
100
0 5 10 15
% R
educt
ion in T
urb
idity
Alum added (mg/L)
2005-2006 % Change
0
10
20
30
40
50
60
70
80
90
100
0 5 10 15 20 25
% R
educt
ion in T
urb
idity
Alum added (mg/L)
2011-2012 % Change
14
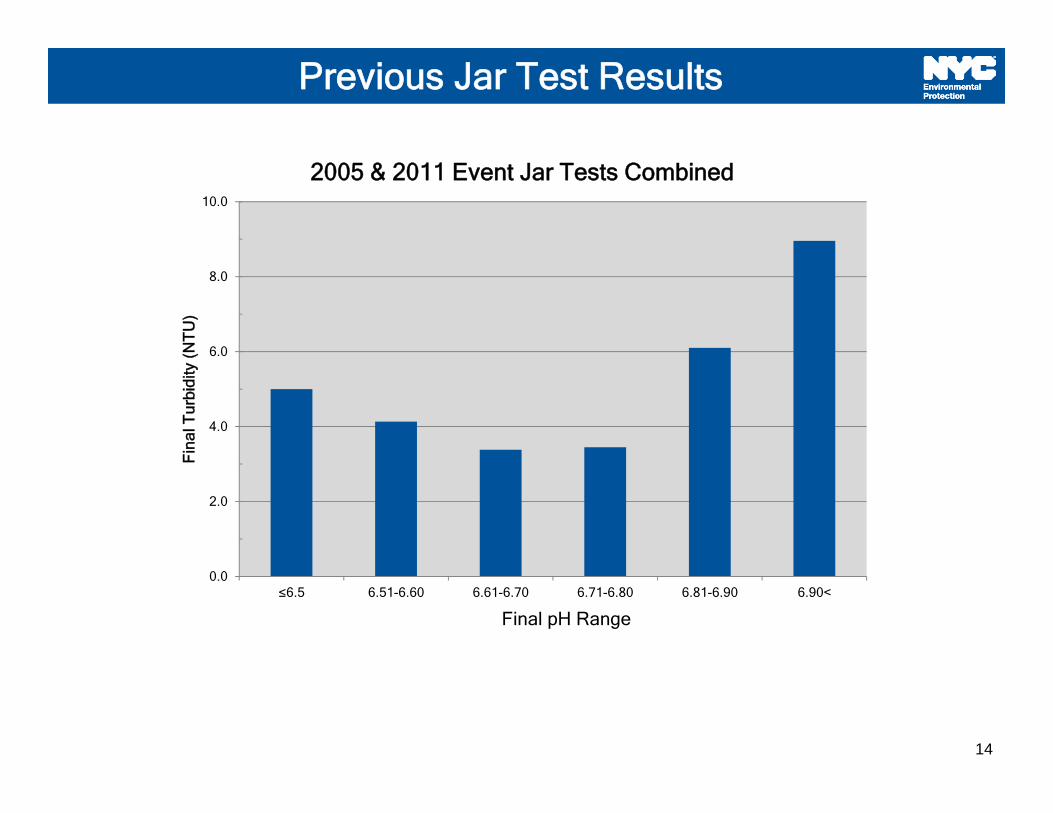
Previous Jar Test Results
0.0
2.0
4.0
6.0
8.0
10.0
≤6.5 6.51-6.60 6.61-6.70 6.71-6.80 6.81-6.90 6.90<
Fin
al T
urbi
dity
(NT
U)
Final pH Range
2005 & 2011 Event Jar Tests Combined
15
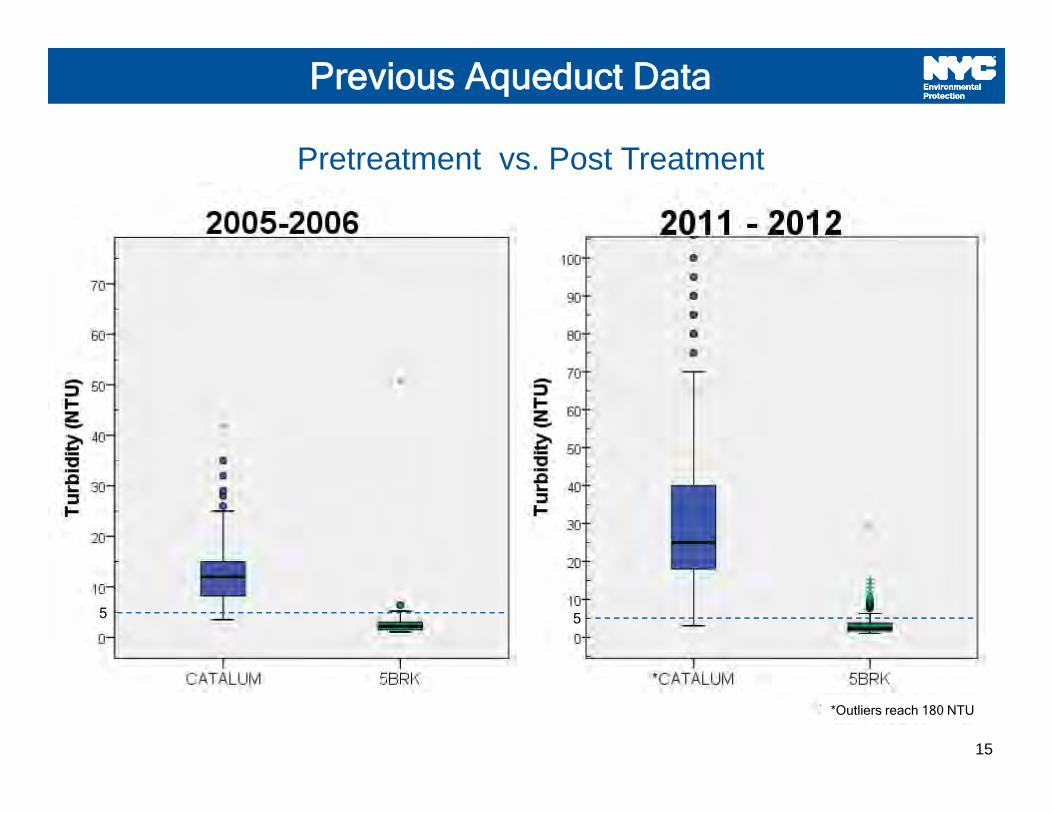
Previous Aqueduct Data
Pretreatment vs. Post Treatment
5 5
*Outliers reach 180 NTU

16
Previous Aqueduct Data
Pretreatment vs. Post Treatment
5 5
2005-2006 Descriptive StatisticsAlum dose (mg/L)
Mean 6Standard Error 0.20
Median 7.5Mode 8
Standard Deviation 3.05Sample Variance 9.27
Skewness -1.47Range 11
Minimum 0Maximum 11
Count 234
2011-2012 Descriptive StatisticsAlum dose (mg/L)
Mean 11Standard Error 0.28
Median 10Mode 7
Standard Deviation 4.60Sample Variance 21.12
Skewness 0.36Range 23
Minimum 0Maximum 23
Count 261
*Outliers reach 180 NTU

17
CATALUM
• 5BRK
Leaving the reservoir
Image is not to scale
Currently Offline
18
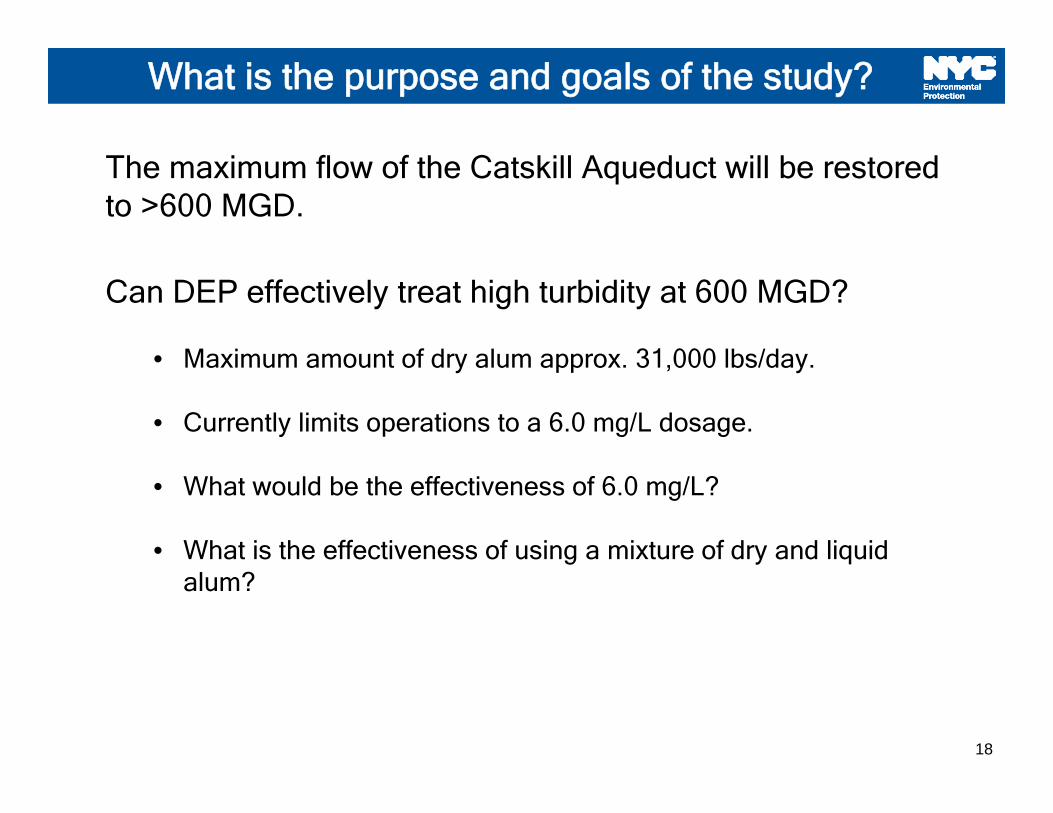
What is the purpose and goals of the study?
The maximum flow of the Catskill Aqueduct will be restored to >600 MGD.
Can DEP effectively treat high turbidity at 600 MGD?
• Maximum amount of dry alum approx. 31,000 lbs/day.
• Currently limits operations to a 6.0 mg/L dosage.
• What would be the effectiveness of 6.0 mg/L?
• What is the effectiveness of using a mixture of dry and liquid alum?

19
Low and Mixed Dose Alum Study
20
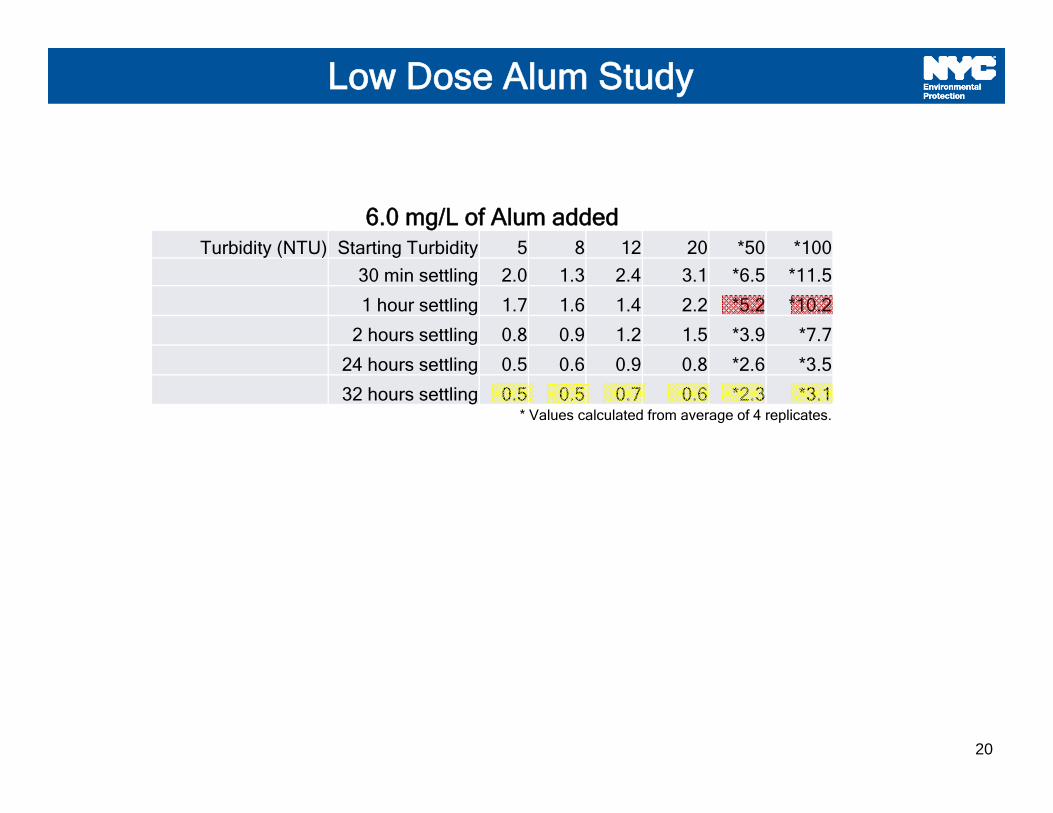
Low Dose Alum Study
6.0 mg/L of Alum addedTurbidity (NTU) Starting Turbidity 5 8 12 20 *50 *100
30 min settling 2.0 1.3 2.4 3.1 *6.5 *11.5
1 hour settling 1.7 1.6 1.4 2.2 *5.2 *10.2
2 hours settling 0.8 0.9 1.2 1.5 *3.9 *7.7
24 hours settling 0.5 0.6 0.9 0.8 *2.6 *3.5
32 hours settling 0.5 0.5 0.7 0.6 *2.3 *3.1* Values calculated from average of 4 replicates.

21
50
20
40
60
80
100
0 2 4 6 8 10 12 14 16 18 20 22 24 26 28 30 32
Tur
bidi
ty (N
TU
)
Settling Time (Hours)
Starting Turbidity *100ntu6.0 mg/L of Alum added
Low Dose Alum Study
5
0
10
20
30
40
50
0 2 4 6 8 10 12 14 16 18 20 22 24 26 28 30 32
Tur
bidi
ty (N
TU
)
Settling Time (Hours)
Starting turbidity *50ntu6.0 mg/L of Alum added
*Values calculated from average of 4 replicates
22
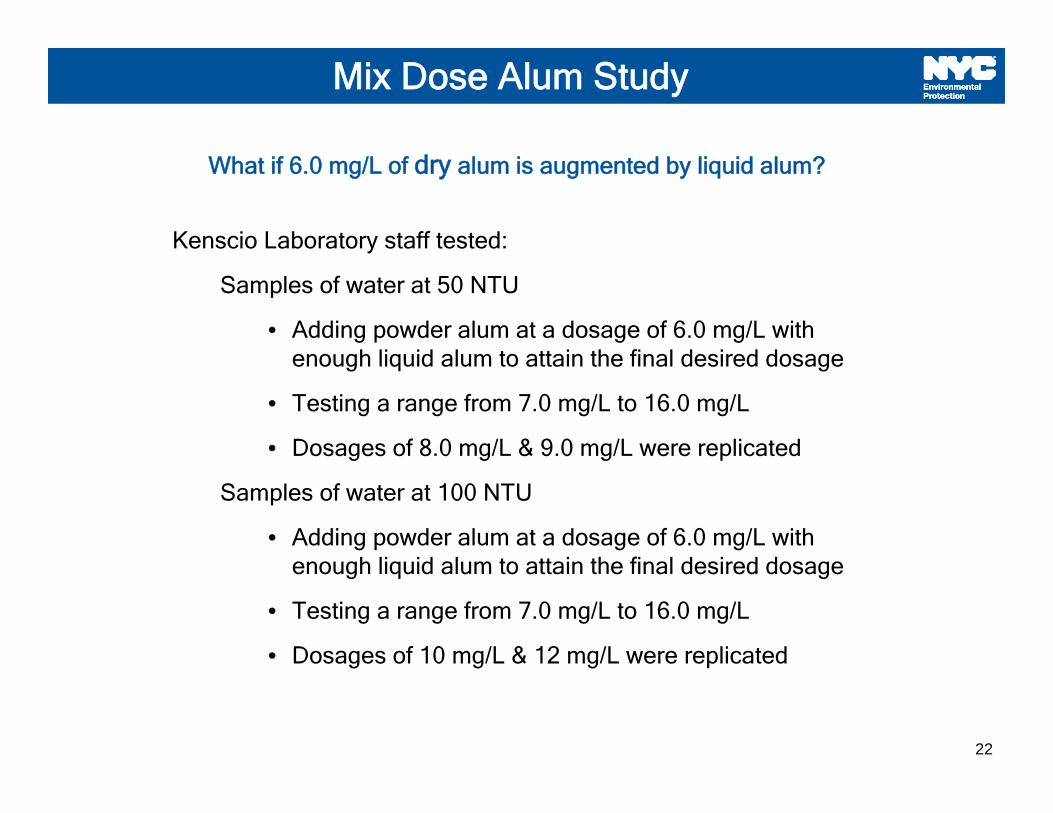
Kenscio Laboratory staff tested:
Samples of water at 50 NTU
• Adding powder alum at a dosage of 6.0 mg/L with enough liquid alum to attain the final desired dosage
• Testing a range from 7.0 mg/L to 16.0 mg/L
• Dosages of 8.0 mg/L & 9.0 mg/L were replicated
Samples of water at 100 NTU
• Adding powder alum at a dosage of 6.0 mg/L with enough liquid alum to attain the final desired dosage
• Testing a range from 7.0 mg/L to 16.0 mg/L
• Dosages of 10 mg/L & 12 mg/L were replicated
Mix Dose Alum Study
What if 6.0 mg/L of dry alum is augmented by liquid alum?

23
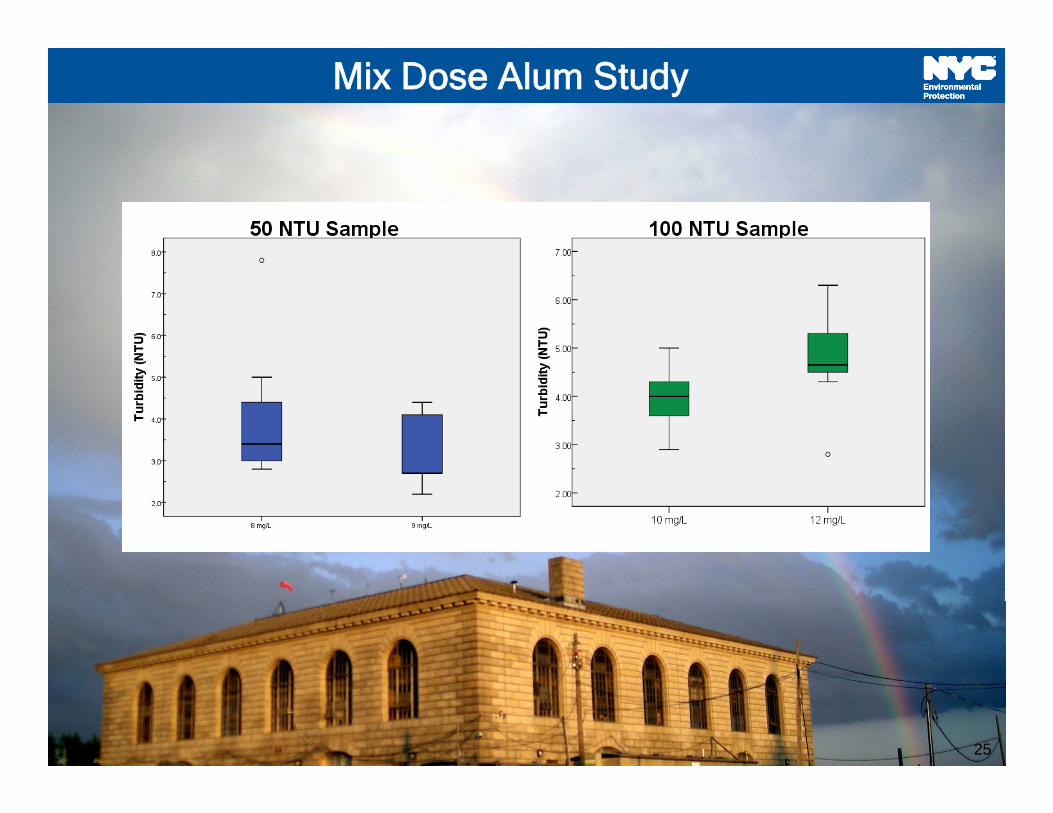
Mix Dose Alum Study
Starting turbidity at 50 NTU
Alum (mg/L) 7 8 9 10 11 12 13 14 15 16
10min Settling (NTU) 6.1 5.2 7.7 5.0 3.8 4.7 3.7 6.5 6.5 6.4
20min Settling (NTU) 4.4 3.4 5.2 3.8 5.0 5.1 4.1 4.5 5.2 6.2
30min Settling (NTU) 3.4 3.1 2.6 3.5 2.6 4.7 4.4 4.1 5.1 5.9
60min Settling (NTU) 6.9 5.0 2.7 3.1 3.8 4.1 3.3 4.4 5.2 5.7
Final pH 6.65 6.67 6.74 6.53 6.55 6.58 6.45 6.38 6.30 6.28
Starting Turbidity at 100 NTU
Alum (mg/L) 7 8 9 10 11 12 13 14 15 16
10 min Settling (NTU) 8.6 6.3 6.2 4.9 4.5 4.8 4.6 3.7 7.0 11.9
20 min Settling (NTU) 6.9 6.8 4.8 3.2 4.2 4.2 4.3 5.0 6.8 9.2
30 min Settling (NTU) 6.8 5.8 3.4 3.3 4.0 3.2 3.1 4.3 6.7 10.7
1 hour Settling (NTU) 7.7 5.6 3.7 2.9 4.0 2.8 3.1 4.3 6.1 9.8
Final pH 6.68 6.65 6.81 6.75 6.73 6.75 6.65 6.56 6.49 6.43
Starting Turbidity at 50 NTU
Alum (mg/L) 7 8 9 10 11 12 13 14 15 16
10min Settling (NTU) 6.1 5.2 7.7 5.0 3.8 4.7 3.7 6.5 6.5 6.4
20min Settling (NTU) 4.4 3.4 5.2 3.8 5.0 5.1 4.1 4.5 5.2 6.2
30min Settling (NTU) 3.4 3.1 2.6 3.5 2.6 4.7 4.4 4.1 5.1 5.9
60min Settling (NTU) 6.9 5.0 2.7 3.1 3.8 4.1 3.3 4.4 5.2 5.7
Final pH 6.65 6.67 6.74 6.53 6.55 6.58 6.45 6.38 6.30 6.28
Starting Turbidity at 100 NTU
Alum (mg/L) 7 8 9 10 11 12 13 14 15 16
10 min Settling (NTU) 8.6 6.3 6.2 4.9 4.5 4.8 4.6 3.7 7.0 11.9
20 min Settling (NTU) 6.9 6.8 4.8 3.2 4.2 4.2 4.3 5.0 6.8 9.2
30 min Settling (NTU) 6.8 5.8 3.4 3.3 4.0 3.2 3.1 4.3 6.7 10.7
1 hour Settling (NTU) 7.7 5.6 3.7 2.9 4.0 2.8 3.1 4.3 6.1 9.8
Final pH 6.68 6.65 6.81 6.75 6.73 6.75 6.65 6.56 6.49 6.43

24
0
5
10
15
20
25
30
35
40
45
50
0 10 20 30 40 50 60
Tur
bidi
ty (N
TU
)
Time (minutes)
50 NTU Sample with 9 mg/L Alum
94% Reduction in
Turbidity
0
5
10
15
20
25
30
35
40
45
50
0 10 20 30 40 50 60
Tur
bidi
ty (N
TU
)
Time (minutes)
50 NTU Sample with 8 mg/L Alum
92% Reduction in
Turbidity
Mix Dose Alum Study
0
10
20
30
40
50
60
70
80
90
100
0 10 20 30 40 50 60
Tur
bidi
ty (N
TU
)
Time (minutes)
100 NTU Sample with 10 mg/L Alum
96% Reduction in
Turbidity
0
10
20
30
40
50
60
70
80
90
100
0 10 20 30 40 50 60
Tur
bidi
ty (N
TU
)
Time (minutes)
100 NTU Sample with 12mg/L Alum
95% Reduction in
Turbidity
25
Mix Dose Alum Study
25

26
Under optimal conditions• A sample of Catskill Aqueduct water
with turbidity that is ≤20 NTU can be mitigated with 6.0 mg/L of dry alum.
• For samples of Catskill Aqueduct water that have a turbidity of 50 and 100 NTU, a mixture of 6.0 mg/L of dry alum augmented with liquid alum will be needed to adequately reduce the turbidity.
Final Statement
Conclusion
26
27
Citations• New York City Department of Environmental Protection Alum Post-Treatment
Report Water Quality and System Operations Catskill Water Supply – Volumes 1 and 2, September 2006
• New York City Department of Environmental Protection Alum Treatment After Action Report, July 2012
• NYC Environmental Protections Strategy 2011-2014 retrieved from: http://www.nyc.gov/html/dep/pdf/strategic_plan/dep_strategy_2011.pdf
• Operational Control of Coagulation and Filtration Processes, Manual M37; 1st
American Water Works Association. Denver, CO. 1992
• United States Environmental Protection Drinking Water Treatability Database: Conventional Treatment – 2014 retrieved from: http://iaspub.epa.gov/tdb/pages/treatment/treatmentOverview.do?treatmentProcessId=1934681921

2828